
Distinct Effects of a High Fat Diet on Bone in Skeletally Mature and Developing Male C57BL/6J Mice

 , , , , and
Abstract
:1. Introduction
2. Methods
2.1. Animals and Tissue Sampling
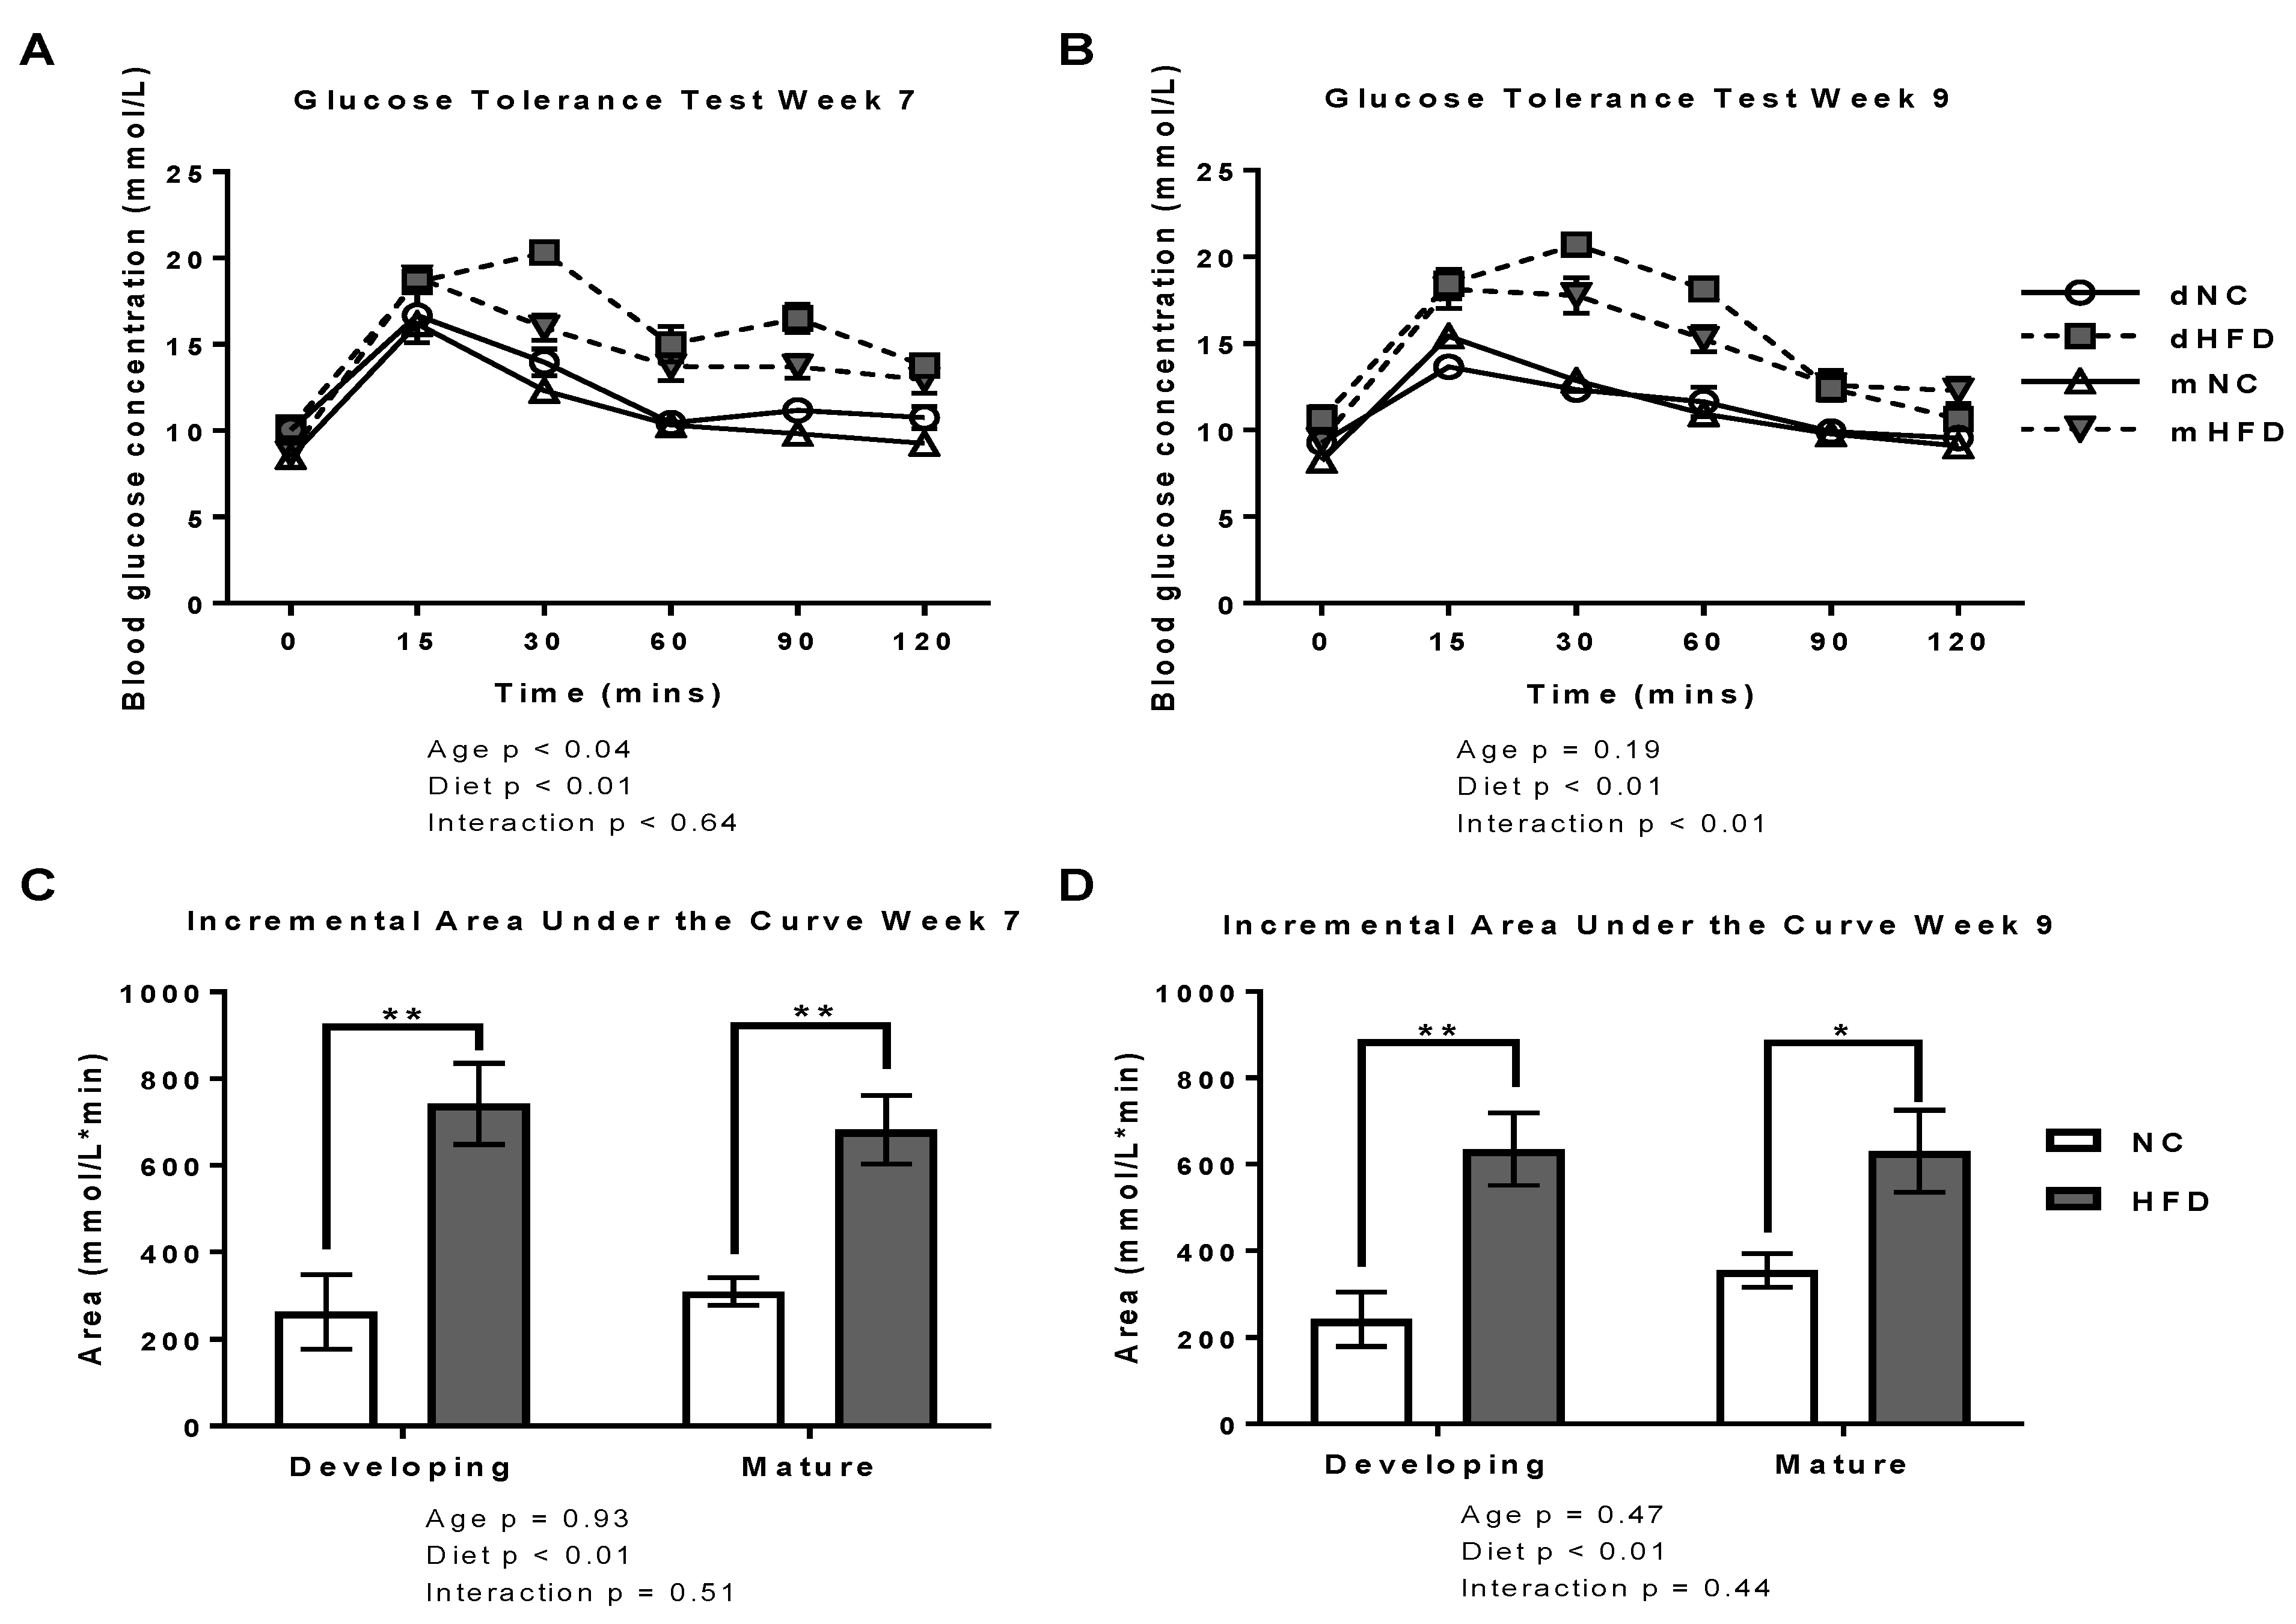
2.2. Oral Glucose Tolerance Tests
2.3. Bone Microarchitecture by µCT
2.4. Bone Histomorphometry
2.5. Biomechanical Bone Properties
2.6. Real-Time Quantitative PCR
2.7. Western Blotting
2.8. Statistical Analysis
3. Results
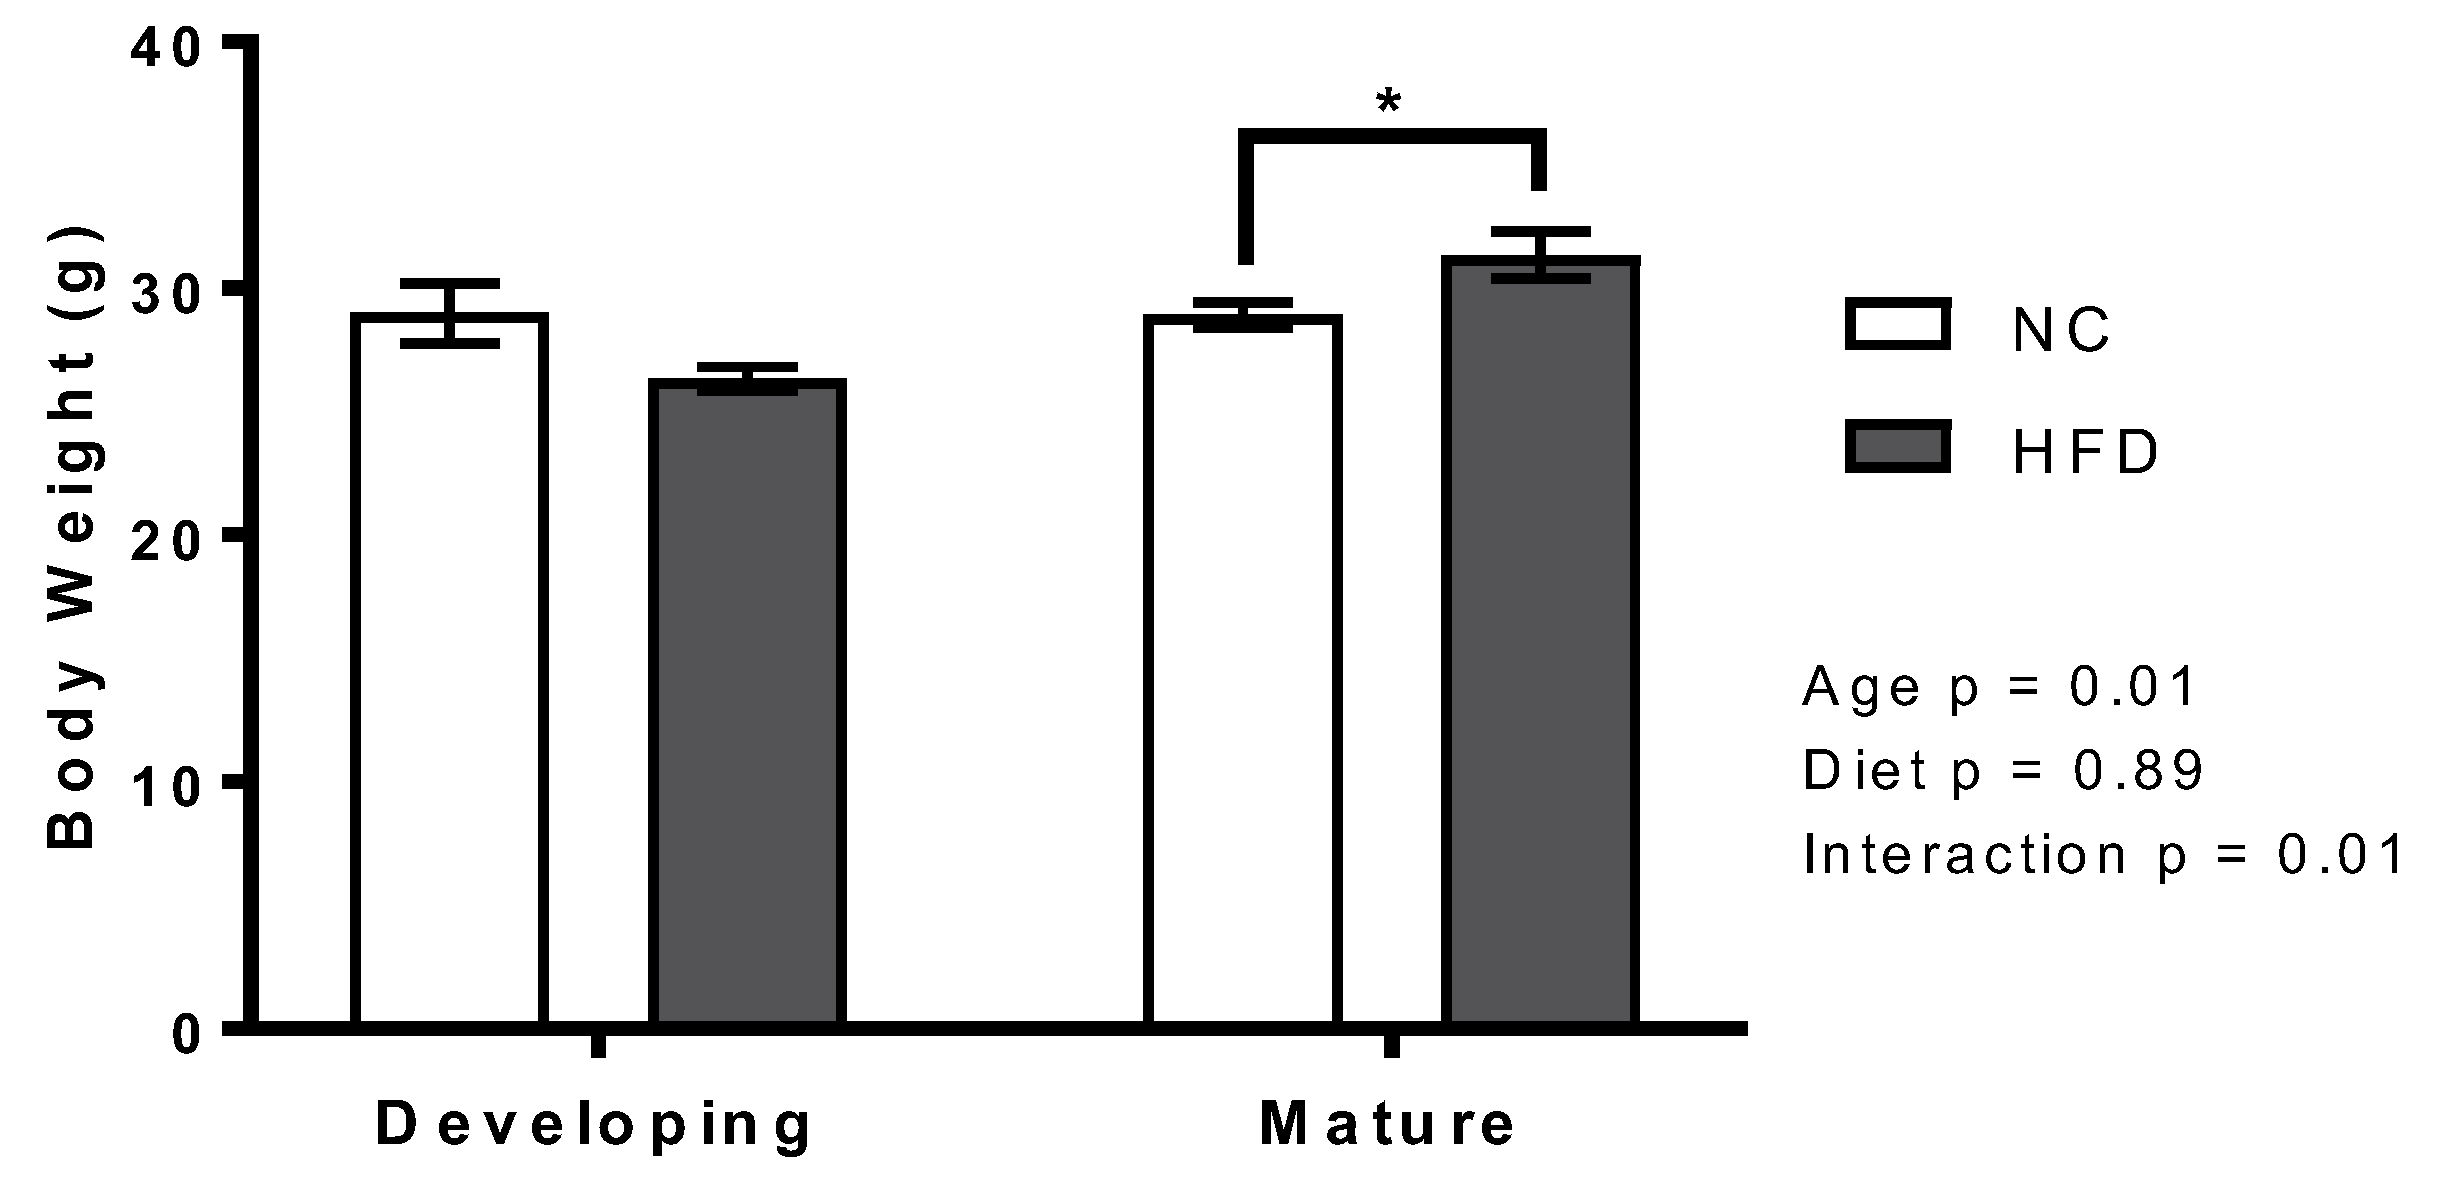
3.1. Body Weight
3.2. oGTT
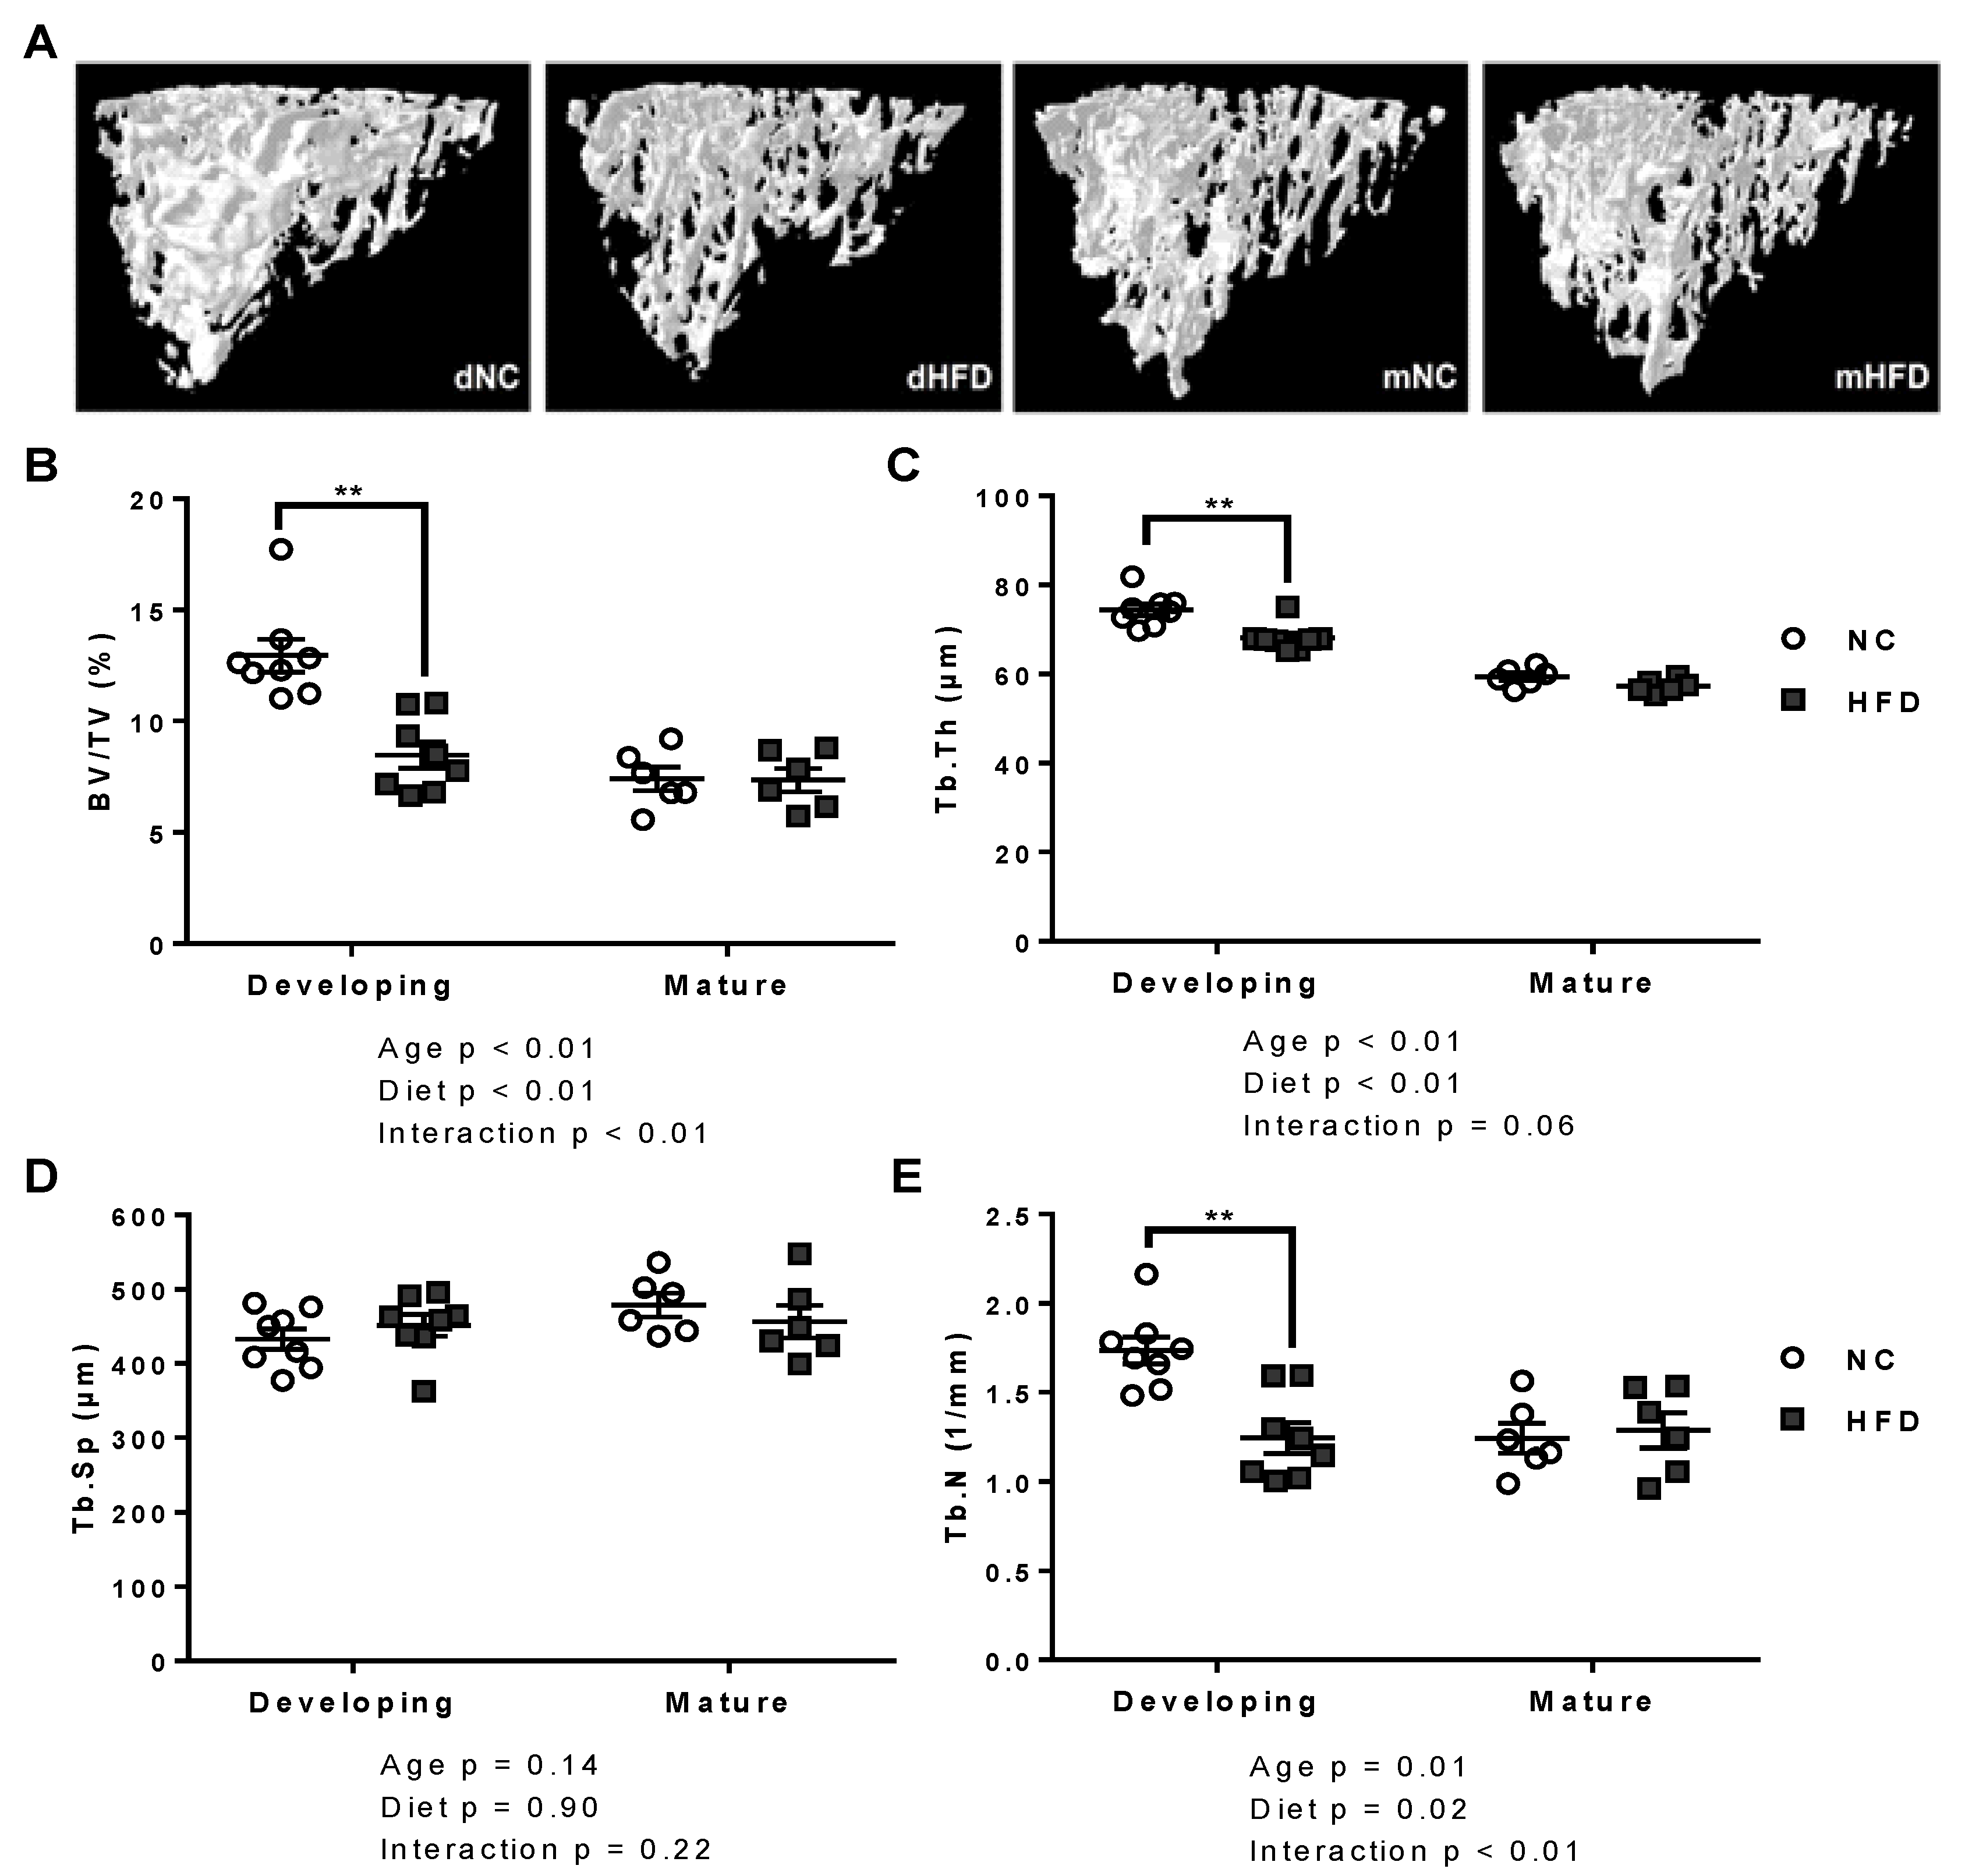
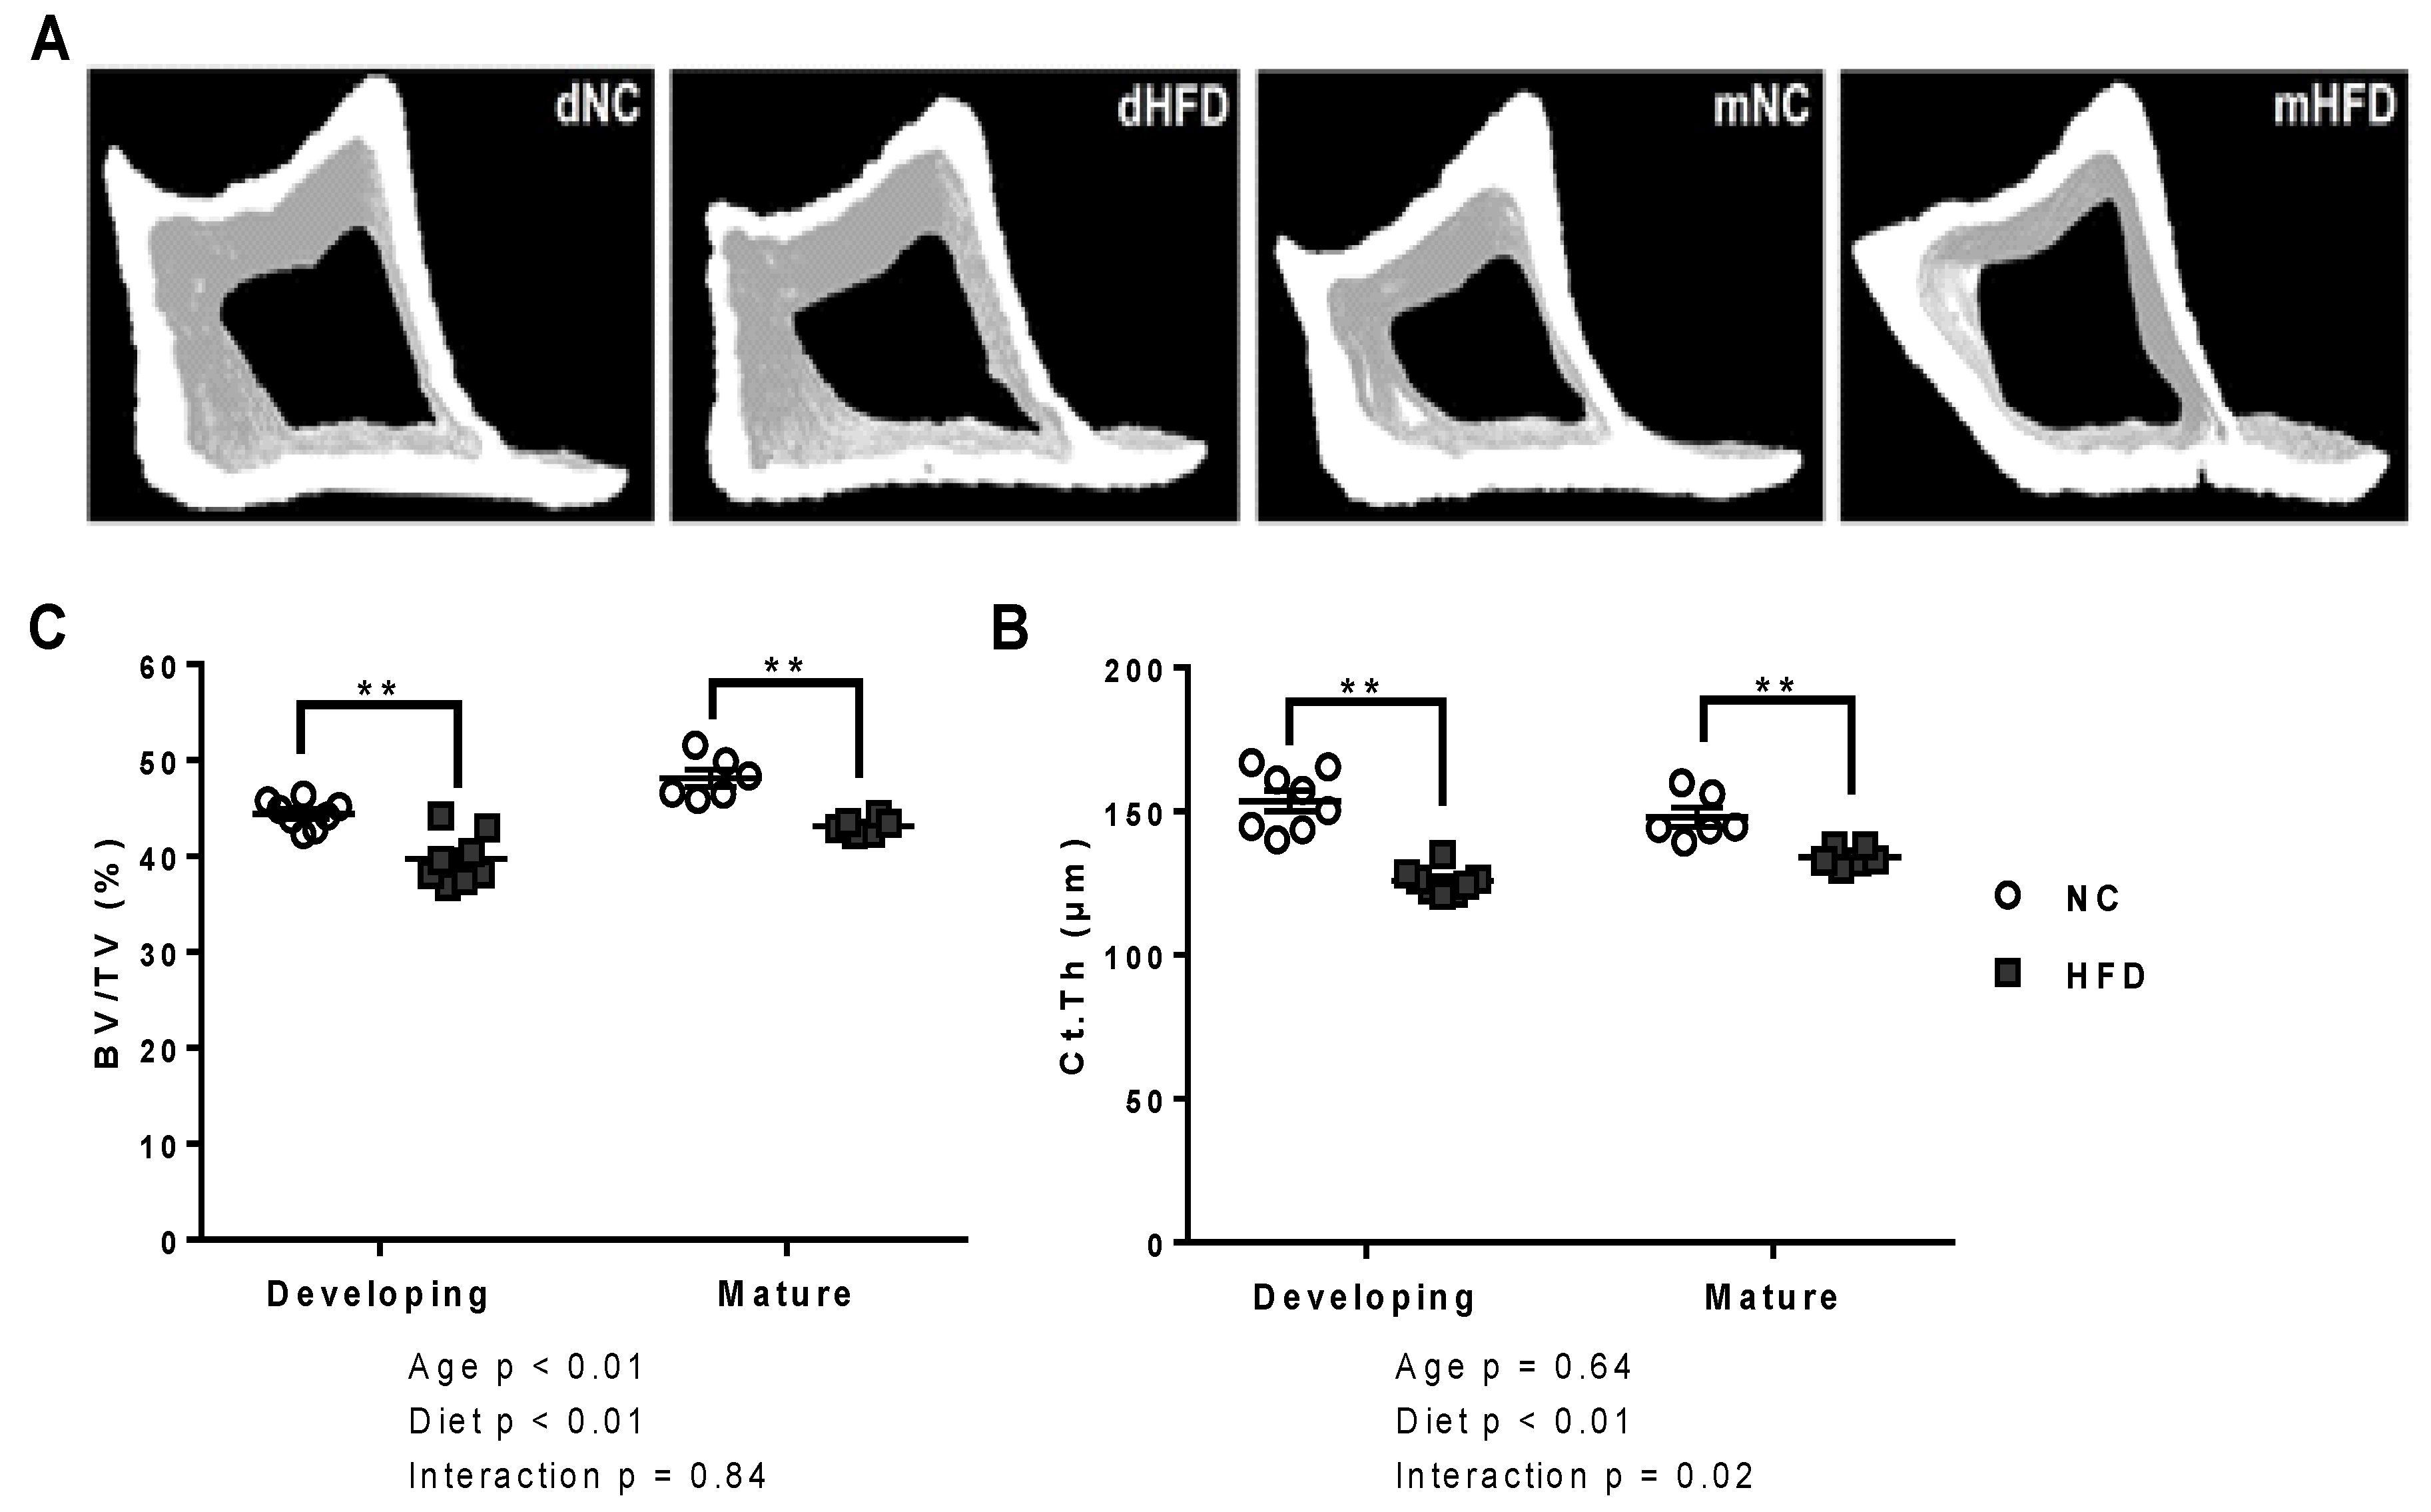
3.3. µ-CT
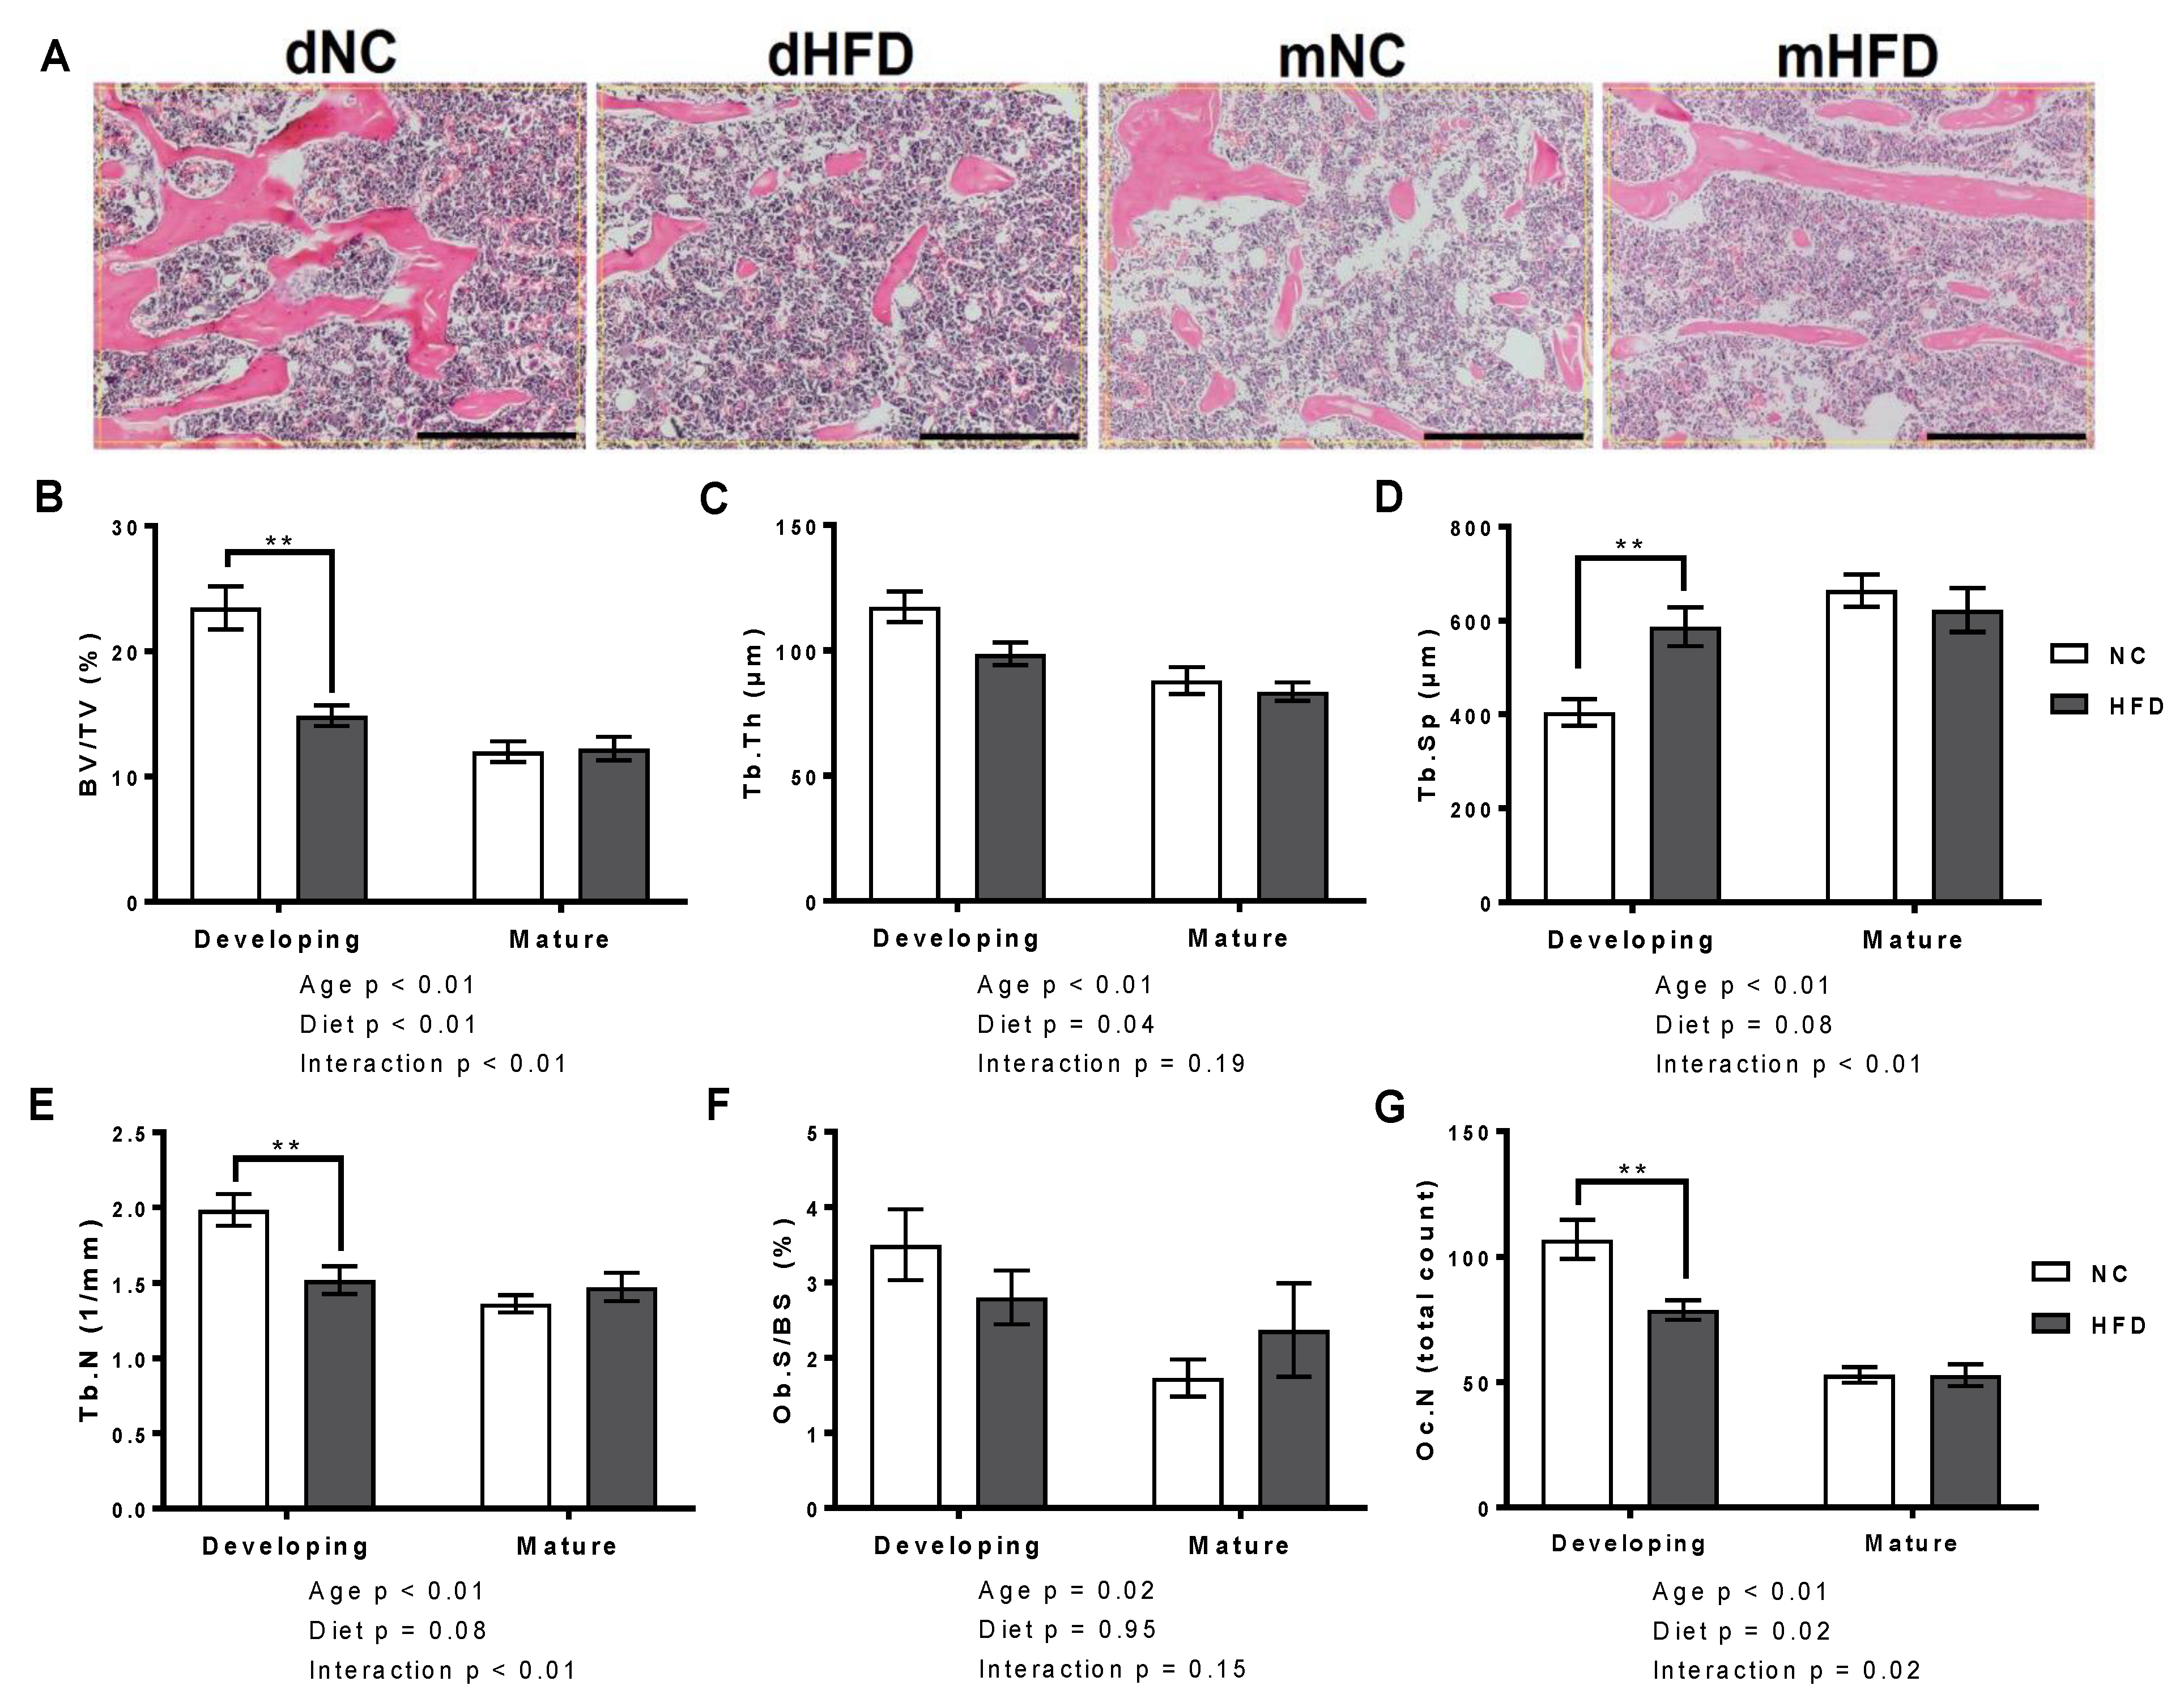
3.4. Bone Histomorphometry
3.5. Biomechanical Properties (Three-Point Bending Tests)
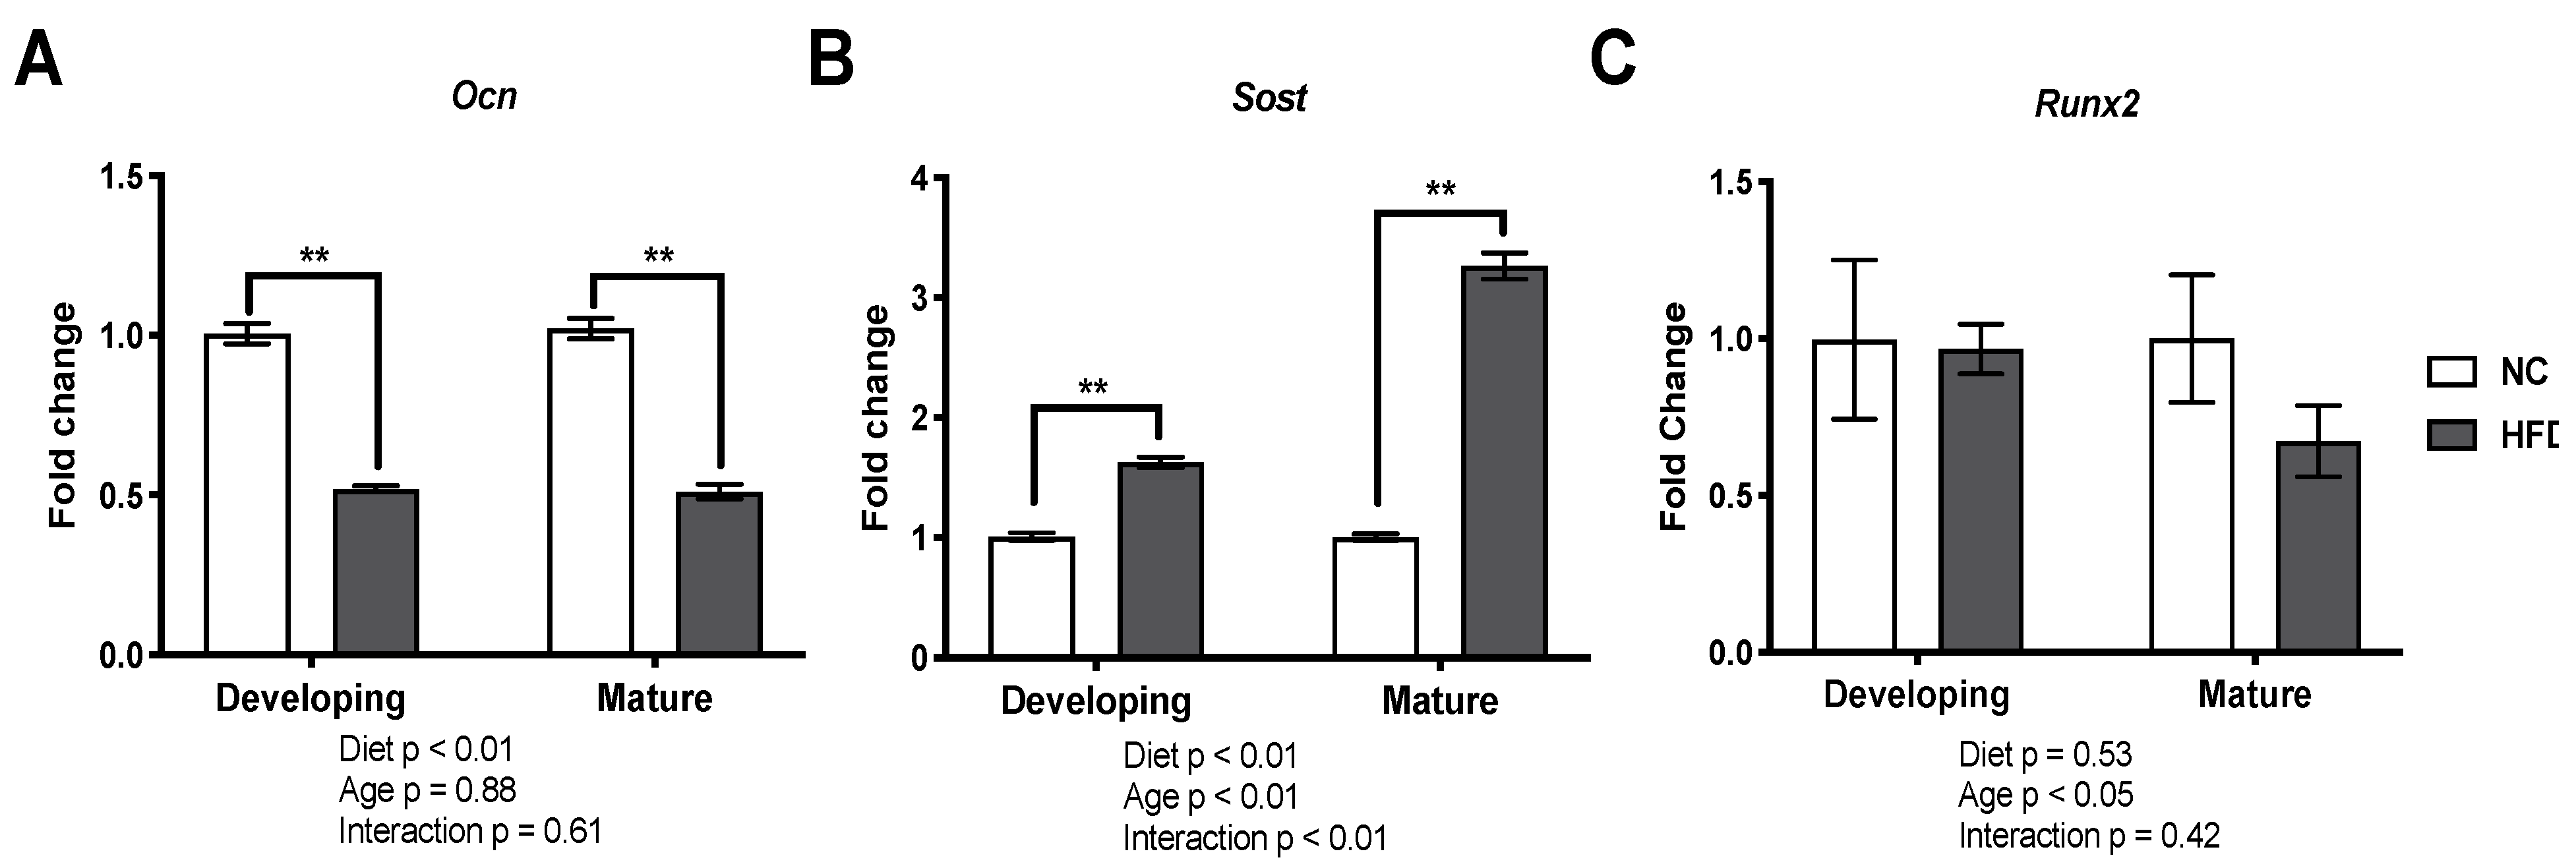
3.6. Gene Expression Analysis
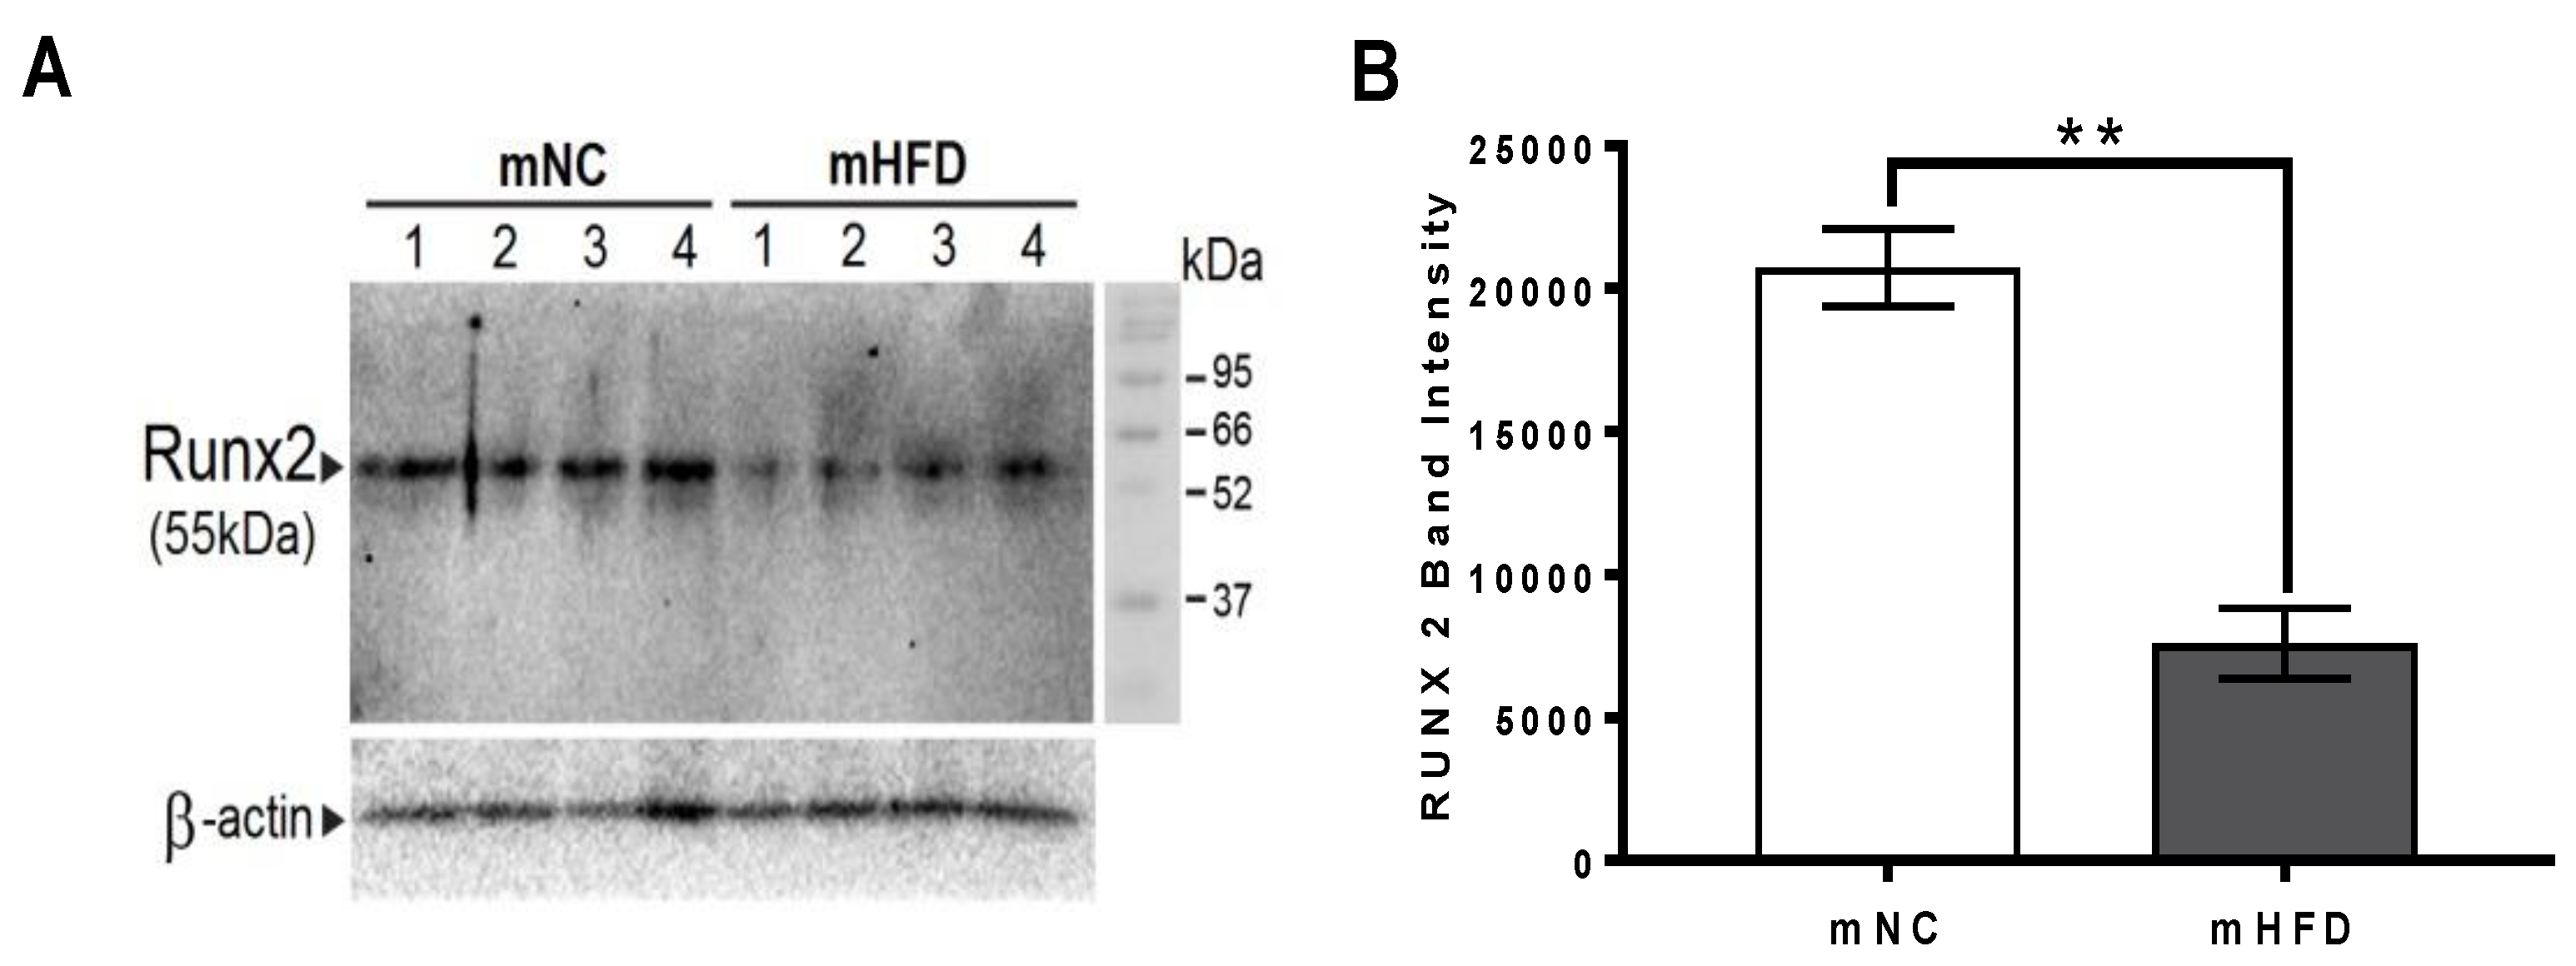
3.7. Western Blot Analysis
4. Discussion
5. Conclusions
Author Contributions
Funding
Institutional Review Board Statement
Acknowledgments
Conflicts of Interest
References
- Maurer, M.S.; Burcham, J.; Cheng, H. Diabetes mellitus is associated with an increased risk of falls in elderly residents of a long-term care facility. J. Gerontol. Ser. A Biol. Sci. Med. Sci. 2005, 60, 1157–1162. [Google Scholar] [CrossRef] [Green Version]
- Patel, S.; Hyer, S.; Tweed, K.; Kerry, S.; Allan, K.; Rodin, A.; Barron, J. Risk factors for fractures and falls in older women with type 2 diabetes mellitus. Calcif. Tissue Int. 2008, 82, 87–91. [Google Scholar] [CrossRef] [PubMed]
- Vinik, A.I.; Camacho, P.; Reddy, S.; Valencia, W.M.; Trence, D.; Matsumoto, A.M.; Morley, J.E. Ageing, Diabetes and Falls. Endocr. Pract. 2017, 23, 1120–1142. [Google Scholar] [CrossRef]
- Janghorbani, M.; Feskanich, D.; Willett, W.C.; Hu, F. Prospective study of diabetes and risk of hip fracture: The Nurses’ Health Study. Diabetes Care 2006, 29, 1573–1578. [Google Scholar] [CrossRef] [Green Version]
- Jia, P.; Bao, L.; Chen, H.; Yuan, J.; Liu, W.; Feng, F.; Li, J.; Tang, H. Risk of low-energy fracture in type 2 diabetes patients: A meta-analysis of observational studies. Osteoporos. Int. 2017, 28, 3113–3121. [Google Scholar] [CrossRef]
- Schwartz, A.V.; Vittinghoff, E.; Bauer, D.C.; Hillier, T.A.; Strotmeyer, E.S.; Ensrud, K.E.; Donaldson, M.G.; Cauley, J.A.; Harris, T.B.; Koster, A.; et al. Association of BMD and FRAX score with risk of fracture in older adults with type 2 diabetes. JAMA 2011, 305, 2184–2192. [Google Scholar] [CrossRef]
- Compston, J. Type 2 diabetes mellitus and bone. J. Intern. Med. 2018, 283, 140–153. [Google Scholar] [CrossRef] [Green Version]
- Bonds, D.E.; Larson, J.C.; Schwartz, A.V.; Strotmeyer, E.S.; Robbins, J.; Rodriguez, B.L.; Johnson, K.C.; Margolis, K.L. Risk of fracture in women with type 2 diabetes: The Women’s Health Initiative Observational Study. J. Clin. Endocrinol. Metab. 2006, 91, 3404–3410. [Google Scholar] [CrossRef] [Green Version]
- Starup-Linde, J.; Frost, M.; Vestergaard, P.; Abrahamsen, B. Epidemiology of Fractures in Diabetes. Calcif. Tissue Int. 2017, 100, 109–121. [Google Scholar] [CrossRef]
- Vestergaard, P. Discrepancies in bone mineral density and fracture risk in patients with type 1 and type 2 diabetes—A meta-analysis. Osteoporos. Int. 2007, 18, 427–444. [Google Scholar] [CrossRef]
- Dede, A.D.; Tournis, S.; Dontas, I.; Trovas, G. Type 2 diabetes mellitus and fracture risk. Metabolism 2014, 63, 1480–1490. [Google Scholar] [CrossRef] [PubMed]
- Cho, N.H.; Shaw, J.E.; Karuranga, S.; Huang, Y.; da Rocha Fernandes, J.D.; Ohlrogge, A.W.; Malanda, B. IDF Diabetes Atlas: Global estimates of diabetes prevalence for 2017 and projections for 2045. Diabetes Res. Clin. Pract. 2018, 138, 271–281. [Google Scholar] [CrossRef] [PubMed]
- Hygum, K.; Starup-Linde, J.; Harsløf, T.; Vestergaard, P.; Langdahl, B.L. MECHANISMS IN ENDOCRINOLOGY: Diabetes mellitus, a state of low bone turnover—A systematic review and meta-analysis. Eur. J. Endocrinol. 2017, 176, 137–157. [Google Scholar] [CrossRef] [PubMed]
- Farr, J.N.; Drake, M.T.; Amin, S.; Melton, L.J., 3rd; McCready, L.K.; Khosla, S. In vivo assessment of bone quality in postmenopausal women with type 2 diabetes. J. Bone Miner. Res. Off. J. Am. Soc. Bone Miner. Res. 2014, 29, 787–795. [Google Scholar] [CrossRef] [PubMed]
- Shu, A.; Yin, M.T.; Stein, E.; Cremers, S.; Dworakowski, E.; Ives, R.; Rubin, M.R. Bone structure and turnover in type 2 diabetes mellitus. Osteoporos. Int. 2012, 23, 635–641. [Google Scholar] [CrossRef] [Green Version]
- Iglesias, P.; Arrieta, F.; Pinera, M.; Botella-Carretero, J.I.; Balsa, J.A.; Zamarron, I.; Menacho, M.; Diez, J.J.; Munoz, T.; Vázquez, C. Serum concentrations of osteocalcin, procollagen type 1 N-terminal propeptide and beta-CrossLaps in obese subjects with varying degrees of glucose tolerance. Clin. Endocrinol. 2011, 75, 184–188. [Google Scholar] [CrossRef] [PubMed]
- Gaudio, A.; Privitera, F.; Battaglia, K.; Torrisi, V.; Sidoti, M.H.; Pulvirenti, I.; Canzonieri, E.; Tringali, G.; Fiore, C.E. Sclerostin levels associated with inhibition of the Wnt/β-catenin signaling and reduced bone turnover in type 2 diabetes mellitus. J. Clin. Endocrinol. Metab. 2012, 97, 3744–3750. [Google Scholar] [CrossRef]
- Gennari, L.; Merlotti, D.; Valenti, R.; Ceccarelli, E.; Ruvio, M.; Pietrini, M.G.; Capodarca, C.; Franci, M.B.; Campagna, M.S.; Calabrò, A.; et al. Circulating sclerostin levels and bone turnover in type 1 and type 2 diabetes. J. Clin. Endocrinol. Metab. 2012, 97, 1737–1744. [Google Scholar] [CrossRef] [Green Version]
- Tanaka, K.; Yamaguchi, T.; Kanazawa, I.; Sugimoto, T. Effects of high glucose and advanced glycation end products on the expressions of sclerostin and RANKL as well as apoptosis in osteocyte-like MLO-Y4-A2 cells. Biochem. Biophys. Res. Commun. 2015, 461, 193–199. [Google Scholar] [CrossRef]
- Yamamoto, M.; Sugimoto, T. Advanced Glycation End Products, Diabetes, and Bone Strength. Curr. Osteoporos. Rep. 2016, 14, 320–326. [Google Scholar] [CrossRef] [Green Version]
- Goh, S.Y.; Cooper, M.E. Clinical review: The role of advanced glycation end products in progression and complications of diabetes. J. Clin. Endocrinol. Metab. 2008, 93, 1143–1152. [Google Scholar] [CrossRef] [PubMed] [Green Version]
- Tang, S.Y.; Zeenath, U.; Vashishth, D. Effects of non-enzymatic glycation on cancellous bone fragility. Bone 2007, 40, 1144–1151. [Google Scholar] [CrossRef] [Green Version]
- Furst, J.R.; Bandeira, L.C.; Fan, W.W.; Agarwal, S.; Nishiyama, K.K.; McMahon, D.J.; Dworakowski, E.; Jiang, H.; Silverberg, S.J.; Rubin, M.R. Advanced Glycation Endproducts and Bone Material Strength in Type 2 Diabetes. J. Clin. Endocrinol. Metab. 2016, 101, 2502–2510. [Google Scholar] [CrossRef] [PubMed] [Green Version]
- Ho-Pham, L.T.; Nguyen, T.V. Association between trabecular bone score and type 2 diabetes: A quantitative update of evidence. Osteoporos. Int. 2019, 30, 2079–2085. [Google Scholar] [CrossRef]
- Yilmaz, V.; Umay, E.; Gundogdu, I.; Tezel, N. Effect of type 2 diabetes mellitus on treatment outcomes of patients with postmenopausal osteoporosis: A retrospective study. J. Diabetes Metab. Disord. 2018, 17, 181–187. [Google Scholar] [CrossRef] [PubMed]
- Karim, L.; Moulton, J.; Van Vliet, M.; Velie, K.; Robbins, A.; Malekipour, F.; Abdeen, A.; Ayres, D.; Bouxsein, M.L. Bone microarchitecture, biomechanical properties, and advanced glycation end-products in the proximal femur of adults with type 2 diabetes. Bone 2018, 114, 32–39. [Google Scholar] [CrossRef] [PubMed]
- Yu, E.W.; Putman, M.S.; Derrico, N.; Abrishamanian-Garcia, G.; Finkelstein, J.S.; Bouxsein, M.L. Defects in cortical microarchitecture among African-American women with type 2 diabetes. Osteoporos. Int. 2015, 26, 673–679. [Google Scholar] [CrossRef] [Green Version]
- Burghardt, A.J.; Issever, A.S.; Schwartz, A.V.; Davis, K.A.; Masharani, U.; Majumdar, S.; Link, T.M. High-resolution peripheral quantitative computed tomographic imaging of cortical and trabecular bone microarchitecture in patients with type 2 diabetes mellitus. J. Clin. Endocrinol. Metab. 2010, 95, 5045–5055. [Google Scholar] [CrossRef] [Green Version]
- Hunt, H.B.; Torres, A.M.; Palomino, P.M.; Marty, E.; Saiyed, R.; Cohn, M.; Jo, J.; Warner, S.; Sroga, G.E.; King, K.B.; et al. Altered Tissue Composition, Microarchitecture, and Mechanical Performance in Cancellous Bone from Men with Type 2 Diabetes Mellitus. J. Bone Miner. Res. Off. J. Am. Soc. Bone Miner. Res. 2019, 34, 1191–1206. [Google Scholar] [CrossRef]
- Starr, J.F.; Bandeira, L.C.; Agarwal, S.; Shah, A.M.; Nishiyama, K.K.; Hu, Y.; McMahon, D.J.; Guo, X.E.; Silverberg, S.J.; Rubin, M.R. Robust Trabecular Microstructure in Type 2 Diabetes Revealed by Individual Trabecula Segmentation Analysis of HR-pQCT Images. J. Bone Miner. Res. Off. J. Am. Soc. Bone Miner. Res. 2018, 33, 1665–1675. [Google Scholar] [CrossRef]
- Paccou, J.; Ward, K.A.; Jameson, K.A.; Dennison, E.M.; Cooper, C.; Edwards, M.H. Bone Microarchitecture in Men and Women with Diabetes: The Importance of Cortical Porosity. Calcif. Tissue Int. 2016, 98, 465–473. [Google Scholar] [CrossRef] [PubMed]
- Xu, F.; Dong, Y.; Huang, X.; Li, M.; Qin, L.; Ren, Y.; Guo, F.; Chen, A.; Huang, S. Decreased osteoclastogenesis, osteoblastogenesis and low bone mass in a mouse model of type 2 diabetes. Mol. Med. Rep. 2014, 10, 1935–1941. [Google Scholar] [CrossRef] [PubMed] [Green Version]
- Won, H.Y.; Lee, J.A.; Park, Z.S.; Song, J.S.; Kim, H.Y.; Jang, S.M.; Yoo, S.E.; Rhee, Y.; Hwang, E.S.; Bae, M.A. Prominent bone loss mediated by RANKL and IL-17 produced by CD4+ T cells in TallyHo/JngJ mice. PLoS ONE 2011, 6, e18168. [Google Scholar] [CrossRef] [Green Version]
- Ferguson, V.L.; Ayers, R.A.; Bateman, T.A.; Simske, S.J. Bone development and age-related bone loss in male C57BL/6J mice. Bone 2003, 33, 387–398. [Google Scholar] [CrossRef]
- Brennan-Speranza, T.C.; Henneicke, H.; Gasparini, S.J.; Blankenstein, K.I.; Heinevetter, U.; Cogger, V.C.; Svistounov, D.; Zhang, Y.; Cooney, G.J.; Buttgereit, F. Osteoblasts mediate the adverse effects of glucocorticoids on fuel metabolism. J. Clin. Investig. 2012, 122, 4172–4189. [Google Scholar] [CrossRef] [Green Version]
- Blair, H.C.; Larrouture, Q.C.; Li, Y.; Lin, H.; Beer-Stoltz, D.; Liu, L.; Tuan, R.S.; Robinson, L.J.; Schlesinger, P.H.; Nelson, D.J. Osteoblast Differentiation and Bone Matrix Formation In Vivo and In Vitro. Tissue Eng. Part B Rev. 2017, 23, 268–280. [Google Scholar] [CrossRef] [Green Version]
- Florencio-Silva, R.; Sasso, G.R.; Sasso-Cerri, E.; Simões, M.J.; Cerri, P.S. Biology of Bone Tissue: Structure, Function, and Factors That Influence Bone Cells. BioMed Res. Int. 2015, 2015, 421746. [Google Scholar] [CrossRef] [Green Version]
- Jiang, X.; Ye, M.; Jiang, X.; Liu, G.; Feng, S.; Cui, L.; Zou, H. Method development of efficient protein extraction in bone tissue for proteome analysis. J. Proteome Res. 2007, 6, 2287–2294. [Google Scholar] [CrossRef]
- Hu, F.B. Globalization of diabetes: The role of diet, lifestyle, and genes. Diabetes Care 2011, 34, 1249–1257. [Google Scholar] [CrossRef] [Green Version]
- Surwit, R.S.; Kuhn, C.M.; Cochrane, C.; McCubbin, J.A.; Feinglos, M.N. Diet-Induced Type II Diabetes in C57BL/6J Mice. Diabetes 1988, 37, 1163–1167. [Google Scholar] [CrossRef]
- Collins, S.; Martin, T.L.; Surwit, R.S.; Robidoux, J. Genetic vulnerability to diet-induced obesity in the C57BL/6J mouse: Physiological and molecular characteristics. Physiol. Behav. 2004, 81, 243–248. [Google Scholar] [CrossRef]
- Hoffler, U.; Hobbie, K.; Wilson, R.; Bai, R.; Rahman, A.; Malarkey, D.; Travlos, G.; Ghanayem, B.I. Diet-induced obesity is associated with hyperleptinemia, hyperinsulinemia, hepatic steatosis, and glomerulopathy in C57Bl/6J mice. Endocrine 2009, 36, 311–325. [Google Scholar] [CrossRef] [PubMed] [Green Version]
- Liu, C.Y.; Chang, C.W.; Lee, H.C.; Chen, Y.J.; Tsai, T.H.; Chiau, J.S.; Wang, T.E.; Tsai, M.C.; Yeung, C.Y.; Shih, S.C. Metabolic Damage Presents Differently in Young and Early-Aged C57BL/6 Mice Fed a High-Fat Diet. Int. J. Gerontol. 2016, 10, 105–111. [Google Scholar] [CrossRef] [Green Version]
- Cao, J.J.; Gregoire, B.R.; Gao, H. High-fat diet decreases cancellous bone mass but has no effect on cortical bone mass in the tibia in mice. Bone 2009, 44, 1097–1104. [Google Scholar] [CrossRef]
- Patsch, J.M.; Kiefer, F.W.; Varga, P.; Pail, P.; Rauner, M.; Stupphann, D.; Resch, H.; Moser, D.; Zysset, P.K.; Stulnig, T.M.; et al. Increased bone resorption and impaired bone microarchitecture in short-term and extended high-fat diet-induced obesity. Metabolism 2011, 60, 243–249. [Google Scholar] [CrossRef] [PubMed]
- Scheller, E.L.; Khoury, B.; Moller, K.L.; Wee, N.K.; Khandaker, S.; Kozloff, K.M.; Abrishami, S.H.; Zamarron, B.F.; Singer, K. Changes in Skeletal Integrity and Marrow Adiposity during High-Fat Diet and after Weight Loss. Front. Endocrinol. 2016, 7, 102. [Google Scholar] [CrossRef] [PubMed]
- Inzana, J.A.; Kung, M.; Shu, L.; Hamada, D.; Xing, L.P.; Zuscik, M.J.; Awad, H.A.; Mooney, R.A. Immature mice are more susceptible to the detrimental effects of high fat diet on cancellous bone in the distal femur. Bone 2013, 57, 174–183. [Google Scholar] [CrossRef] [PubMed] [Green Version]
- Halloran, B.P.; Ferguson, V.L.; Simske, S.J.; Burghardt, A.; Venton, L.L.; Majumdar, S. Changes in bone structure and mass with advancing age in the male C57BL/6J mouse. J. Bone Miner. Res. Off. J. Am. Soc. Bone Miner. Res. 2002, 17, 1044–1050. [Google Scholar] [CrossRef]
- Hauschka, P.V.; Lian, J.B.; Cole, D.E.; Gundberg, C.M. Osteocalcin and matrix Gla protein: Vitamin K-dependent proteins in bone. Physiol. Rev. 1989, 69, 990–1047. [Google Scholar] [CrossRef] [PubMed]
- Baron, R.; Kneissel, M. WNT signaling in bone homeostasis and disease: From human mutations to treatments. Nat. Med. 2013, 19, 179–192. [Google Scholar] [CrossRef]
- Stein, G.S.; Lian, J.B.; van Wijnen, A.J.; Stein, J.L.; Montecino, M.; Javed, A.; Zaidi, S.K.; Young, D.W.; Choi, J.Y.; Pockwinse, S.M. Runx2 control of organization, assembly and activity of the regulatory machinery for skeletal gene expression. Oncogene 2004, 23, 4315–4329. [Google Scholar] [CrossRef] [PubMed] [Green Version]
- García-Martínez, O.; Rivas, A.; Ramos-Torrecillas, J.; De Luna-Bertos, E.; Ruiz, C. The effect of olive oil on osteoporosis prevention. Int. J. Food Sci. Nutr. 2014, 65, 834–840. [Google Scholar] [CrossRef] [PubMed]
- Tosti, V.; Bertozzi, B.; Fontana, L. Health Benefits of the Mediterranean Diet: Metabolic and Molecular Mechanisms. J. Gerontol. Ser. A Biol. Sci. Med. Sci. 2018, 73, 318–326. [Google Scholar] [CrossRef] [PubMed] [Green Version]
- Denova-Gutierrez, E.; Mendez-Sanchez, L.; Munoz-Aguirre, P.; Tucker, K.L.; Clark, P. Dietary Patterns, Bone Mineral Density, and Risk of Fractures: A Systematic Review and Meta-Analysis. Nutrients 2018, 10, 1992. [Google Scholar] [CrossRef] [PubMed] [Green Version]
- Shahen, V.A.; Gerbaix, M.; Koeppenkastrop, S.; Lim, S.F.; McFarlane, K.E.; Nguyen, A.N.; Peng, X.Y.; Weiss, N.B.; Brennan-Speranza, T.C. Multifactorial effects of hyperglycaemia, hyperinsulinemia and inflammation on bone remodelling in type 2 diabetes mellitus. Cytokine Growth Factor Rev. 2020, 55, 109–118. [Google Scholar] [CrossRef]


| Developing | Mature | ||||
|---|---|---|---|---|---|
| NC | HFD | NC | HFD | ||
| Trabecular | BV/TV (%) | 12.95 ± 0.70 | 8.48 ± 0.55 ** | 7.40 ± 0.48 | 7.35 ± 0.48 |
| Tb.Th (µm) | 74.46 ± 1.32 | 68.10 ± 1.08 ** | 59.41 ± 0.85 | 57.3 ± 0.61 | |
| Tb.Sp (µm) | 432.79 ± 13.75 | 451.34 ± 14.74 | 478.74 ± 15.79 | 456.21 ± 21.83 | |
| Tb.N (1/mm) | 1.73 ± 0.08 | 1.24 ± 0.08 ** | 1.24 ± 0.08 | 1.29 ± 0.10 | |
| Cortical | BV/TV (%) | 44.41 ± 0.5 | 39.72 ± 0.93 ** | 48.13 ± 0.91 | 43.13 ± 0.33 ** |
| Ct.Th. (µm) | 153.66 ± 3.67 | 125.70 ± 1.61 ** | 147.90 ± 3.33 | 134.08 ± 1.36 ** | |
| Developing | Mature | ||||
|---|---|---|---|---|---|
| NC | HFD | NC | HFD | ||
| Structural | BV/TV (%) | 23.46 ± 1.71 | 14.85 ± 0.82 ** | 11.98 ± 0.83 | 12.22 ± 0.94 |
| Tb.Th (µm) | 114.40 ± 6.11 | 98.60 ± 4.57 | 87.98 ± 5.37 | 83.48 ± 3.72 | |
| Tb.Sp (µm) | 404.70 ± 28.48 | 586.93 ± 41.43 ** | 664.19 ± 34.24 | 622.33 ± 46.92 | |
| Tb.N (1/mm) | 1.98 ± 0.11 | 1.52 ± 0.09 ** | 1.36 ± 0.06 | 1.47 ± 0.09 | |
| Cellular | Ob.S/BS (%) | 3.50 ± 0.47 | 2.80 ± 0.36 | 1.73 ± 0.25 | 2.37 ± 0.62 |
| Oc.N | 106.84 ± 7.70 | 78.78 ± 3.90 ** | 52.96 ± 3.16 | 52.83 ± 4.38 | |
| Developing | Mature | ||||
|---|---|---|---|---|---|
| NC | HFD | NC | HFD | ||
| Mechanical | Max Load (N) | 11.95 ± 0.01 | 8.64 ± 0.01 ** | 9.91 ± 0.02 | 8.66 ± 0.34 ** |
| Stiffness (N/mm) | 60.53 ± 1.54 | 66.65 ± 0.27 * | 63.75 ± 1.15 | 71.78 ± 0.83 ** | |
Publisher’s Note: MDPI stays neutral with regard to jurisdictional claims in published maps and institutional affiliations. |
© 2021 by the authors. Licensee MDPI, Basel, Switzerland. This article is an open access article distributed under the terms and conditions of the Creative Commons Attribution (CC BY) license (https://creativecommons.org/licenses/by/4.0/).
Share and Cite
Ross, D.S.; Yeh, T.-H.; King, S.; Mathers, J.; Rybchyn, M.S.; Neist, E.; Cameron, M.; Tacey, A.; Girgis, C.M.; Levinger, I.; et al. Distinct Effects of a High Fat Diet on Bone in Skeletally Mature and Developing Male C57BL/6J Mice. Nutrients 2021, 13, 1666. https://0-doi-org.brum.beds.ac.uk/10.3390/nu13051666
Ross DS, Yeh T-H, King S, Mathers J, Rybchyn MS, Neist E, Cameron M, Tacey A, Girgis CM, Levinger I, et al. Distinct Effects of a High Fat Diet on Bone in Skeletally Mature and Developing Male C57BL/6J Mice. Nutrients. 2021; 13(5):1666. https://0-doi-org.brum.beds.ac.uk/10.3390/nu13051666
Chicago/Turabian StyleRoss, Dean S., Tzu-Hsuan Yeh, Shalinie King, Julia Mathers, Mark S. Rybchyn, Elysia Neist, Melissa Cameron, Alexander Tacey, Christian M. Girgis, Itamar Levinger, and et al. 2021. "Distinct Effects of a High Fat Diet on Bone in Skeletally Mature and Developing Male C57BL/6J Mice" Nutrients 13, no. 5: 1666. https://0-doi-org.brum.beds.ac.uk/10.3390/nu13051666