
Intraepithelial Lymphocyte Cytometric Pattern Is a Useful Diagnostic Tool for Coeliac Disease Diagnosis Irrespective of Degree of Mucosal Damage and Age—A Validation Cohort

 ,
,  and
and
Abstract
:1. Introduction
2. Materials and Methods
2.1. Patients and Controls
2.2. Coeliac Serology
2.3. HLA Genotyping
2.4. Duodenal Biopsy Assessment for Histopathology
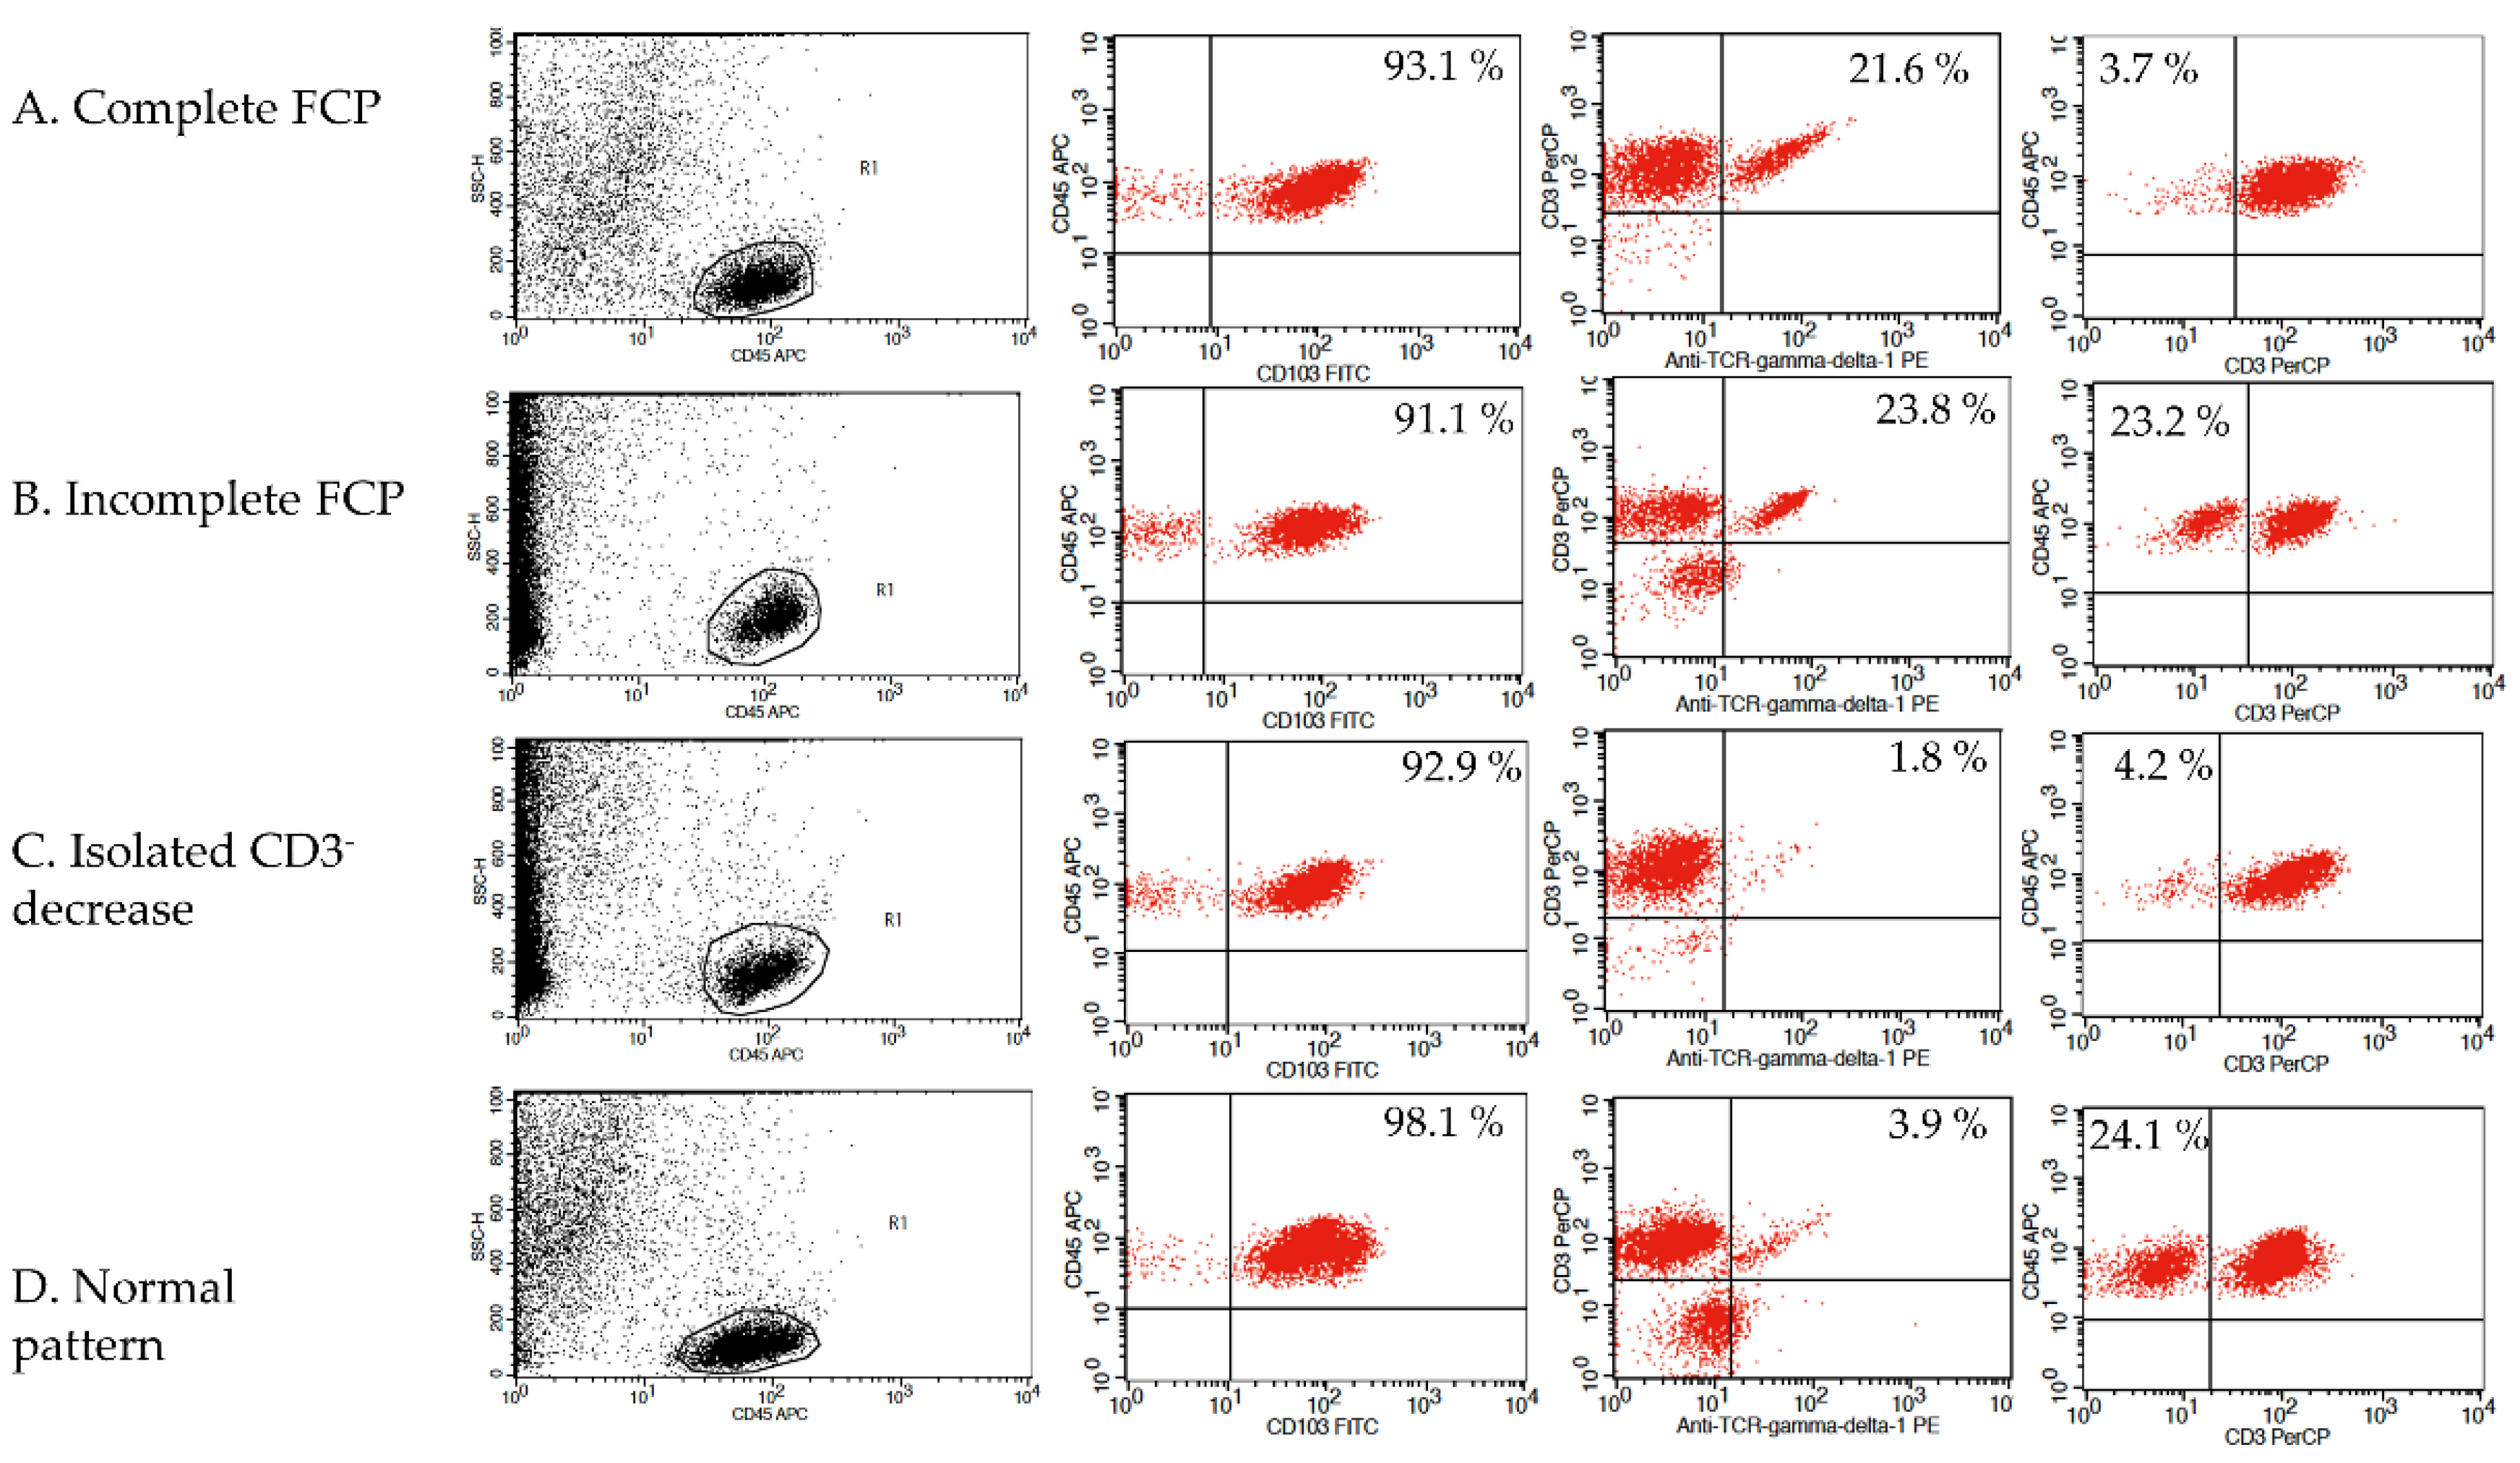
2.5. Duodenal Biopsy Assessment by Flow Cytometry
2.6. Statistical Analysis
2.7. Ethical Statements
3. Results
4. Discussion
Supplementary Materials
Author Contributions
Funding
Institutional Review Board Statement
Informed Consent Statement
Data Availability Statement
Acknowledgments
Conflicts of Interest
Writing Assistance
References
- Catassi, C.; Fasano, A. Celiac disease diagnosis: Simple rules are better than complicated algorithms. Am. J. Med. 2010, 123, 691–693. [Google Scholar] [CrossRef]
- Eiras, P.; Roldan, E.; Camarero, C.; Olivares, F.; Bootello, A.; Roy, G. Flow cytometry description of a novel CD3−/CD7+ intraepithelial lymphocyte subset in human duodenal biopsies: Potential diagnostic value in celiac disease. Cytometry 1998, 34, 95–102. [Google Scholar] [CrossRef]
- Camarero, C.; Eiras, P.; Leon, F.; Olivares, F.; Escobar, H.; Roy, G. Intraephitelial lymphocytes and celiac disease: Permanent changes in CD3-/CD7+ and T cell γδ receptor subsets studied by flow cytometry. Acta Paediatr. 2000, 89, 285–290. [Google Scholar]
- León, F. Flow cytometry of intestinal intraepithelial lymphocytes in celiac disease. J. Immunol. Methods 2011, 363, 177–186. [Google Scholar] [CrossRef]
- Calleja, S.; Vivas, S.; Santiuste, M.; Arias, L.; Hernando, M.; Nistal, E.; De Morales JG, R. Dynamics of non-conventional intraepithelial lymphocytes-NK, NKT, and γδ T- in celiac disease: Relationship with age, diet, and histopathology. Dig. Dis. Sci. 2011, 56, 2042–2049. [Google Scholar] [CrossRef] [PubMed]
- Järvinen, T.T.; Kaukinen, K.; Laurila, K.; Kyrönpalo, S.; Rasmussen, M.; Mäki, M.; Korhonen, H.; Reunala, T.; Collin, P. Intraepithelial lymphocytes in celiac disease. Am. J. Gastroenterol. 2003, 98, 1332–1337. [Google Scholar] [CrossRef] [PubMed]
- Husby, S.; Koletzko, S.; Korponay-Szabó, I.; Mearin, M.; Phillips, A.; Shamir, R.; Troncone, R.; Giersiepen, K.; Branski, D.; Catassi, C.; et al. European Society for Pediatric Gastroenterology, Hepatology, and Nutrition guidelines for the diagnosis of coeliac disease. J. Pediatr. Gastroenterol. Nutr. 2012, 54, 136–160. [Google Scholar] [CrossRef] [PubMed]
- Fernández-Bañares, F.; Carrasco, A.; García-Puig, R.; Rosinach, M.; González, C.; Alsina, M.; Loras, C.; Salas, A.; Viver, J.M.; Esteve, M. Intestinal Intraepithelial Cytometric pattern is more accurate than subepithelial deposits of anti-tissue transglutaminase Ig A for the diagnosis of Celiac disease in lymphocytic enteritis. PLoS ONE 2014, 9, e101249. [Google Scholar] [CrossRef] [Green Version]
- Vivas, S.; De Morales, J.M.R.; Fernandez, M.; Hernando, M.; Herrero, B.; Casqueiro, J.; Gutierrez, S. Age-related clinical, serological, and histopathological features of celiac disease. Am. J. Gastroenterol. 2008, 103, 2360–2365. [Google Scholar] [CrossRef]
- Dickey, W.; Hughes, D.F.; McMillan, S.A. Disappearance of endomysial antibodies in treated celiac disease does not indicate histological recovery. Am. J. Gastroenterol. 2000, 95, 712–714. [Google Scholar] [CrossRef]
- Esteve, M.; Rosinach, M.; Fernández-Bañares, F.; Farré, C.; Salas, A.; Alsina, M.; Vilar, P.; Abad-Lacruz, A.; Forné, M.; Mariné, M.; et al. Spectrum of gluten-sensitive enteropathy in first-degree relatives of patients with coeliac disease: Clinical relevance of lymphocytic enteritis. Gut 2006, 55, 1739–1745. [Google Scholar] [CrossRef] [PubMed] [Green Version]
- Rosinach, M.; Fernández-Bañares, F.; Carrasco, A.; Ibarra, M.; Temiño, R.; Salas, A.; Esteve, M. Double-blind randomized clinical trial: Gluten versus placebo rechallenge in patients with lymphocytic enteritis and suspected celiac disease. PLoS ONE 2016, 11, e0157879. [Google Scholar] [CrossRef]
- Kokkonen, J.; Holm, K.; Kartunnen, T.J.; Maki, M. Children with untreated food allergy express a relative increment in the density of duodenal gammadelta+ T cells. Scand. J. Gastroenterol. 2000, 35, 1137. [Google Scholar] [PubMed]
- Palomar, P.O.; Ruiz, A.C.; Scapa MA, M.; Prieto, F.L.; Ariño, G.R.; Verge, C.R. Adult celiac disease and intraepithelial lymphocytes. New options for diagnosis? Gastroenterol. Hepatol. 2008, 31, 555–559. [Google Scholar]
- Mariné, M.; Farre, C.; Alsina, M.; Vilar, P.; Cortijo, M.; Salas, A.; Fernández-Bañares, F.; Rosinach, M.; Santaolalla, R.; Loras, C.; et al. The prevalence of coeliac disease is significantly higher in children compared with adults. Aliment. Pharmacol. Ther. 2011, 33, 477–486. [Google Scholar] [CrossRef] [PubMed]
- Chorzelski, T.P.; Beutner, E.H.; Sulej, J.; Tchorzewska, H.; Jablonska, S.; Kumar, V.; Kapuscinska, A. Ig A anti-endomysium antibody. A new immunological marker of dermatitis herpetiformis and coeliac disease. Br. J. Dermatol. 1984, 111, 395–405. [Google Scholar] [CrossRef]
- Farré, C. Enfermedad Celíaca: Marcadores Serológicos y de Predisposición Genética, Aspectos Clínicos y Poblaciones de Riesgo. Ph.D. Thesis, University of Barcelona, Barcelona, Spain, 2002. [Google Scholar]
- Megiorni, F.; Pizzuti, A. HLA-DQA1 and HLA-DQB1 in Celiac disease predisposition: Practical implications of the HLA molecular typing. J. Biomed. Sci. 2012, 19, 88. [Google Scholar] [CrossRef]
- Rosinach, M.; Esteve, M.; González, C.; Temiño, R.; Mariné, M.; Monzón, H.; Sainz, E.; Loras, C.; Espinos, J.C.; Forné, M.; et al. Lymphocytic duodenosis: Aetiology and long-term response to specific treatment. Dig. Liver Dis. 2012, 44, 643–648. [Google Scholar] [CrossRef]
- Walker, M.M.; Murray, J.A. An update in the diagnosis of coeliac disease. Histopathology 2011, 59, 166–179. [Google Scholar] [CrossRef] [PubMed]
- Pellegrino, S.; Villanacci, V.; Sansotta, N.; Scarfì, R.; Bassotti, G.; Vieni, G.; Princiotta, A.; Sferlazzas, C.; Magazzù, G.; Tuccari, G. Redefining the intraepithelial lymphocytes threshold to diagnose gluten sensitivity in patients with architecturally normal duodenal histology. Aliment. Pharmacol. Ther. 2011, 33, 697–706. [Google Scholar] [CrossRef] [Green Version]
- Fernández-Bañares, F.; Carrasco, A.; Rosinach, M.; Arau, B.; García-Puig, R.; González, C.; Tristán, E.; Zabana, Y.; Esteve, M. A scoring system for identifying patients likely to be diagnosed with low-grade coeliac enteropathy. Nutrients 2019, 11, 1050. [Google Scholar] [CrossRef] [Green Version]
- Santaolalla, R.; Fernández-Bañares, F.; Rodriguez, R.; Alsina, M.; Rosinach, M.; Marine, M.; Farre, C.; Salas, A.; Forné, M.; Loras, C.; et al. Diagnostic value of duodenal antitissue transglutaminase antibodies in gluten-sensitive enteropathy. Aliment. Pharmacol. Ther. 2008, 27, 820–829. [Google Scholar] [CrossRef] [PubMed]
- Rostami, K.; Kerckhaert, J.; Tiemessen, R.; Von Blomberg, B.M.E.; Meijer, J.W.; Mulder, C.J. Sensitivity of antiendomysium and antigliadin antibodies in untreated celiac disease: Disappointing in clinical practice. Am. J. Gastroenterol. 1999, 94, 888–894. [Google Scholar] [CrossRef] [PubMed]
- Aziz, I.; Evans, K.E.; Hooper, A.D.; Smillie, D.M.; Sanders, D.S. A prospective study into the aetiology of lymphocytic duodenosis. Aliment. Pharmacol. Ther. 2010, 32, 1392–1397. [Google Scholar] [CrossRef] [PubMed]
- Kakar, S.; Nehra, V.; Murray, J.A.; Dayharsh, J.A.; Burgart, R.J. Significance of intraepithelial lymphocytosis in small bowel biopsy samples with normal mucosal architecture. Am. J. Gastroenterol. 2003, 98, 2027–2033. [Google Scholar] [CrossRef] [PubMed]
- Wahab, P.J.; Crusius, B.A.; Meijer, J.W.R.; Mulder, C.J. Gluten challenge in borderline gluten-sensitive enteropathy. Am. J. Gastroenterol. 2001, 96, 1464–1469. [Google Scholar] [CrossRef]
- Fernández-Bañares, F.; Crespo, L.; Núñez, C.; López-Palacios, N.; Tristán, E.; Vivas, S.; Farrais, S.; Arau, B.; Vidal, J.; Roy, G.; et al. Gamma delta+ intraepithelial lymphocytes and coeliac lymphogram in a diagnostic approach to coeliac disease in patients with seronegative villous atrophy. Aliment. Pharmacol. Ther. 2020, 51, 699–705. [Google Scholar] [CrossRef] [PubMed] [Green Version]


| Laser | Fluorochrome | Cell Marker | Antibody Clone | Supplier | Reference | Dilution |
|---|---|---|---|---|---|---|
| 488 | PerCP | CD3 | SK7 | BD 1 | 345,766 | 2.5:100 |
| FITC | CD103 | Ber-ACT8 | BD | 333,155 | 2.5:100 | |
| 633 | PE | TCRγδ | 11F2 | BD | 333,141 | 2.5:100 |
| APC | CD45 | 2D1 | BD | 340,910 | 1.5:100 |
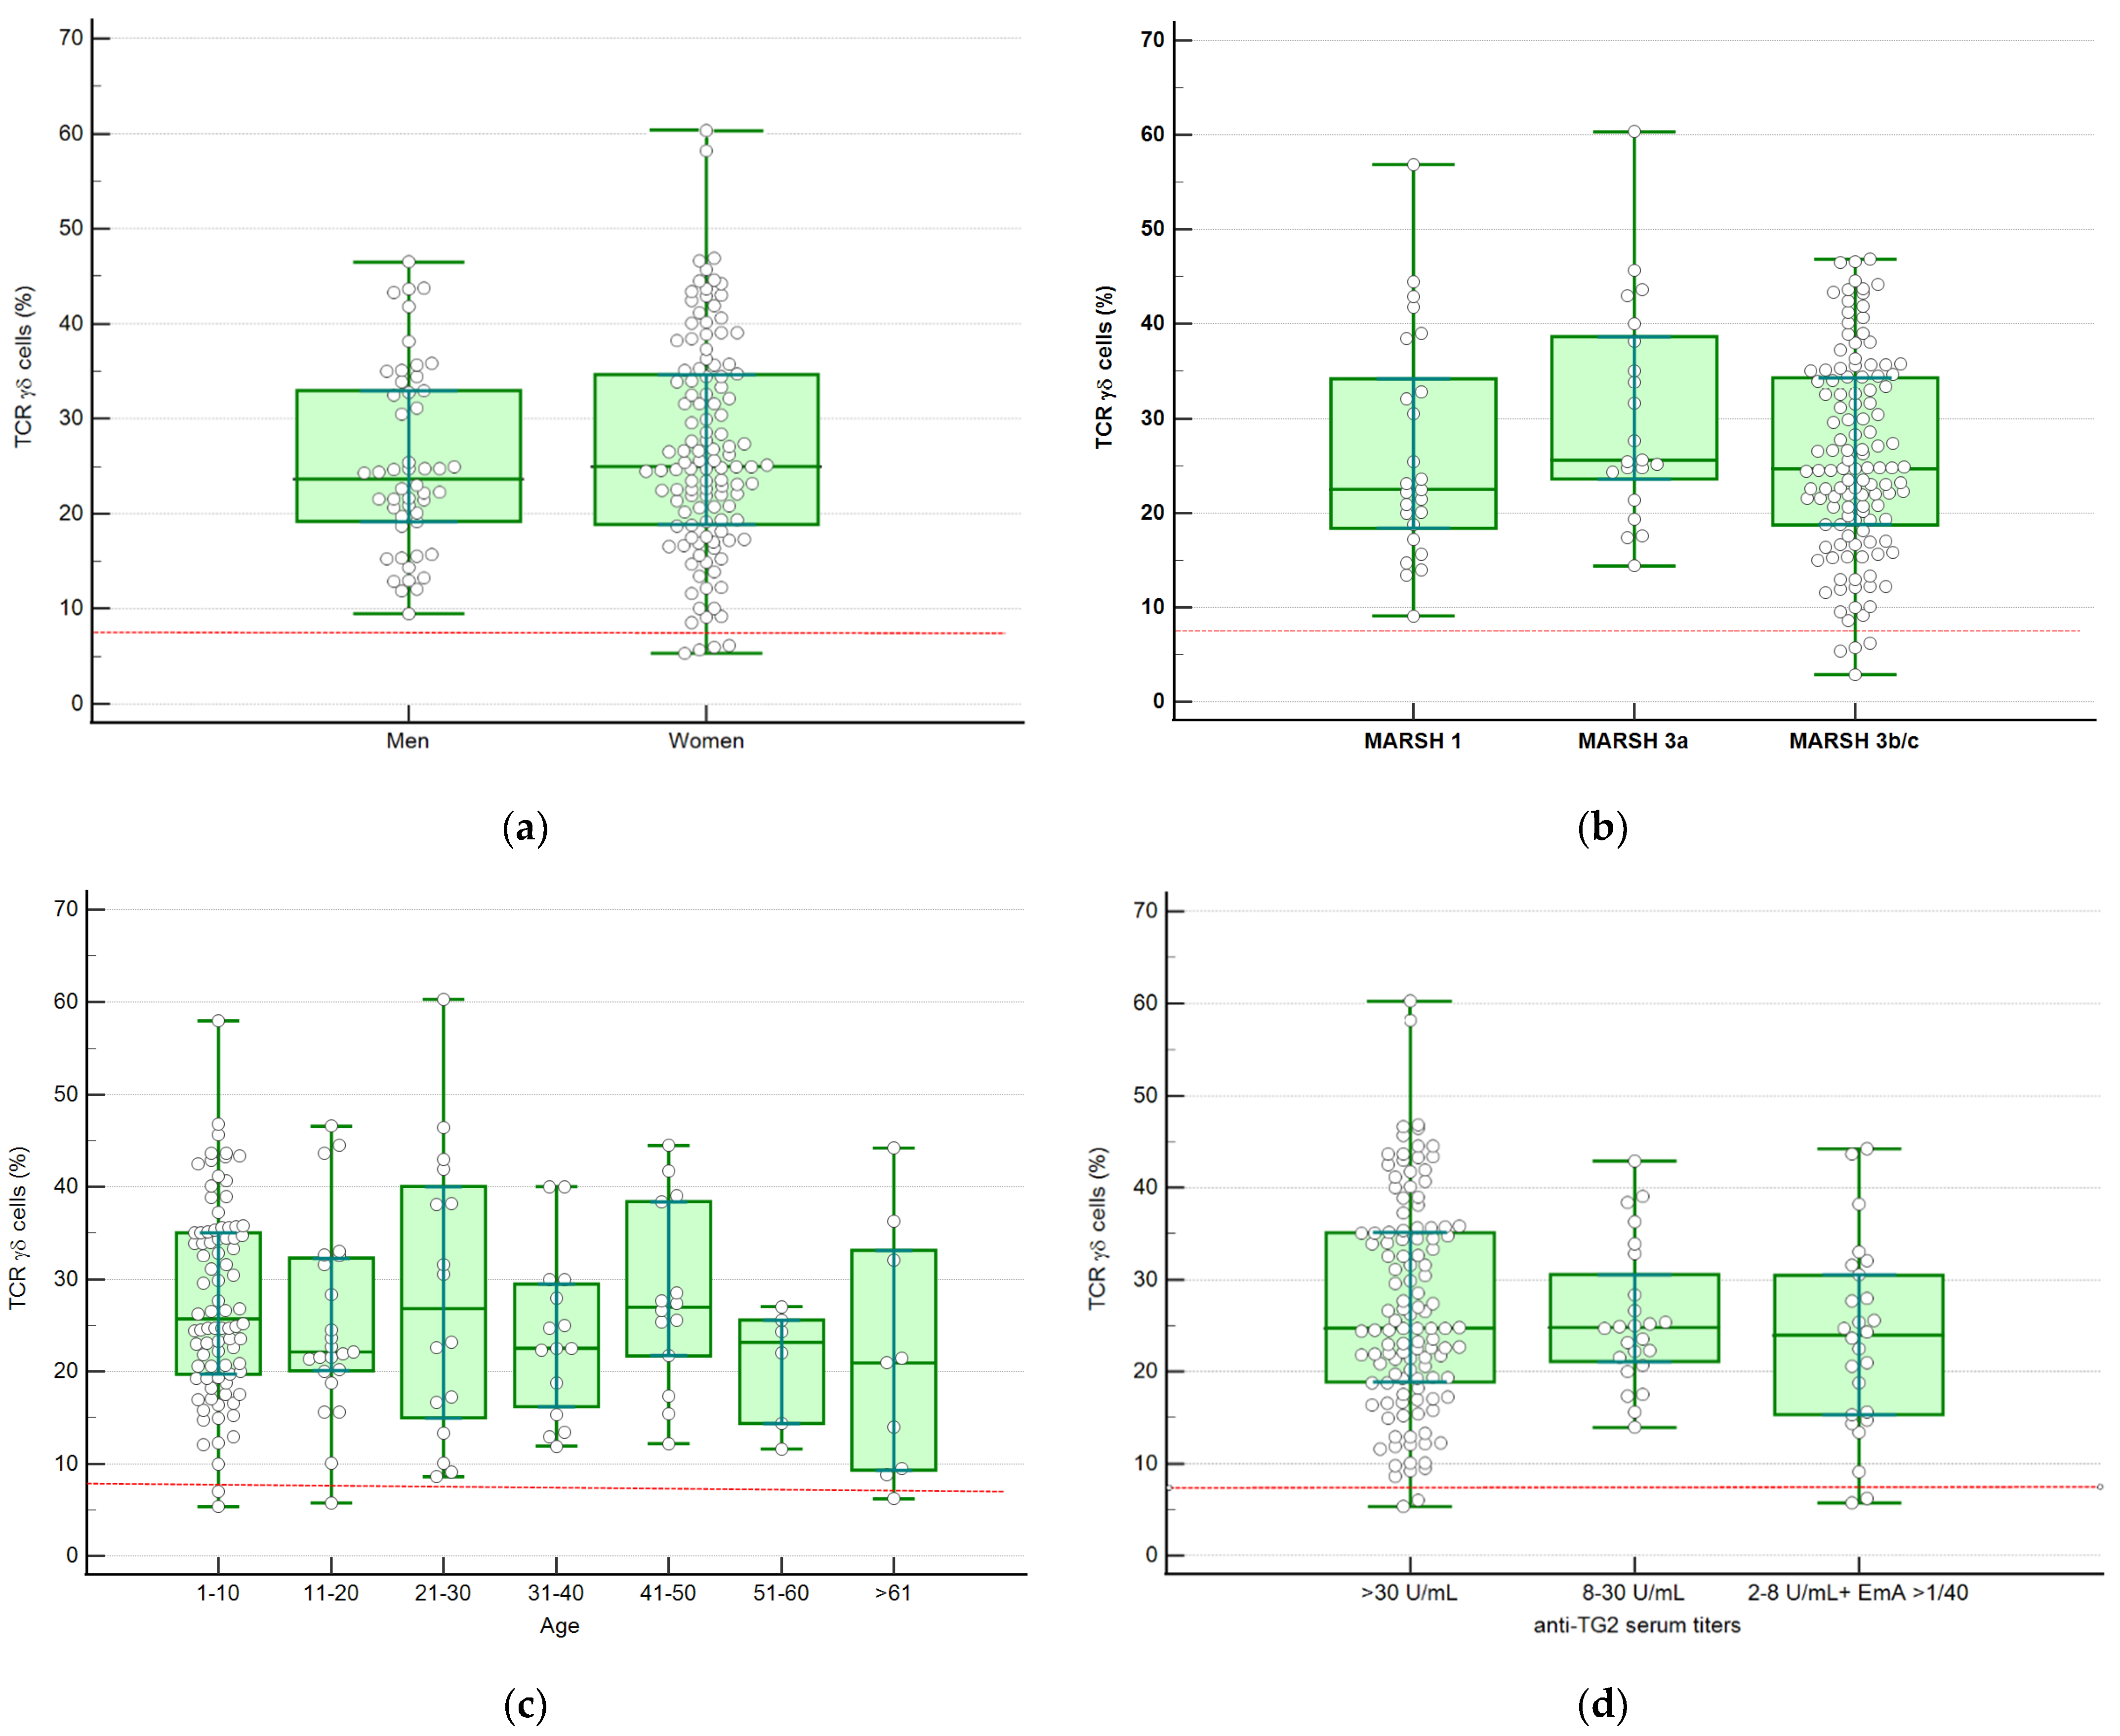
| Variable | Median %TCRγδ+ (IQR) | p | |
|---|---|---|---|
| Sex | Male (n = 50) | 23.70 (18.08–34.00) | 0.909 |
| Female (n = 119) | 25.40 (18.78–35.31) | ||
| Histology | Marsh 1 (n = 25) | 22.51 (16.40–35.62) | 0.41 |
| Marsh 3a (n = 21) | 25.60 (22.85–39.13) | ||
| Marsh 3b-c (n = 123) | 24.70 (18.73–34.48) | ||
| Age | 0–10 (n = 86) | 25.03 (19.32–35.04) | 0.79 |
| 11–20 (n = 23) | 22.13 (20.08–32.31) | ||
| 21–30 (n = 16) | 26.82 (14.98–40.07) | ||
| 31–40 (n = 15) | 22.53 (16.19–36.38) | ||
| 41–50 (n = 14) | 26.98 (21.69–38.44) | ||
| 51–60 (n = 6) | 23.17 (14.38–25.59) | ||
| ≥61 (n = 9) | 21.47 (12.00–38.28) | ||
| Serology | anti-TG2 ≥30 U/mL (n = 119) | 24.75 (19.20–35.31) | 0.53 |
| anti-TG2 8–30 U/mL (n = 24) | 24.81 (20.90–33.60) | ||
| anti-TG2 2–8 U/mL + EmA > 1/40 (n = 26) | 23.98 (15.18–31.70) |
| Age (years) * | 40.00 (25.00–51.50) |
| Sex (% women) | 71.4% |
| Clinical symptoms 1 | |
| Diarrhea | 19 (36%) |
| Bloating | 10 (20%) |
| Dyspepsia | 10 (20%) |
| Abdominal pain | 4 (8%) |
| Anaemia | 4 (8%) |
| Autoimmune disease | 4 (8%) |
| HLA Genotyping | |
| HLA-DQ2.2 | 16 (32%) |
| HLA-DQA1 * 05 | 14 (29%) |
| HLA-DQB1 * 02 | 9 (19%) |
| Without risk alleles | 10 (20%) |
| IEL count (%) * | 16.70 (11.50–20.00) |
| CD3+ TCRγδ+ IEL (%) * | 3.40 (2.63–5.78) |
| CD3− IEL (%) * | 21.03 (13.79–30.55) |
| Final diagnosis | |
| Irritable bowel syndrome | 25 (51%) |
| Fructose malabsorption | 8 (17%) |
| Gastroesophageal reflux disease | 6 (12%) |
| Lactose malabsorption | 3 (6%) |
| Non-coeliac gluten sensitivity | 2 (4%) |
| Autoimmune pancreatitis | 1 (2%) |
| Chronic pancreatitis and exocrine pancreatic insufficiency | 1 (2%) |
| Factitious diarrhea | 1 (2%) |
| Esophageal dysmotility due to systemic sclerosis | 1 (2%) |
| Control biopsy after Helicobacter pylori eradication | 1 (2%) |
| CD Patients n = 169 | Controls (n = 49) | ||||
|---|---|---|---|---|---|
| Marsh 1 (n= 25) | Marsh 3a (n= 21) | Marsh 3b-c (n= 123) | IEL < 18 (n = 27) | IEL < 25 (n = 49) | |
| Complete FCP | 19 | 19 | 101 | 0 | 0 |
| Incomplete FCP: Isolated increase of %TCRγδ+ IEL | 4 | 2 | 18 | 0 | 3 |
| Isolated decrease of % CD3− | 2 | 0 | 0 | 2 | 5 |
| Increase of %TCRγδ+ IEL 1 | 23 | 21 | 119 | 0 | 3 |
| Normal pattern | 0 | 0 | 4 | 25 | 41 |
| Sensitivity % (95% CI) | Specificity % (95% CI) | PPV % (95% CI) | NPV % (95% CI) | |
|---|---|---|---|---|
| Complete FCP | 82 (75–88) | 100 (84–100) | 100 (82–100) | 47 (34–61) |
| Increase of %TCRγδ+ IEL 1 | 96 (92–98) | 100 (84–100) | 100 (97–100) | 81 (64–92) |
| Sensitivity % (95% CI) | Specificity % (95% CI) | PPV % (95% CI) | NPV % (95% CI) | |
|---|---|---|---|---|
| Complete FCP | 82 (75–88) | 100 (91–100) | 100 (97–100) | 62 (50–73) |
| Increase of %TCRγδ+ IEL 1 | 96 (92–98) | 93 (82–98) | 98 (93–99) | 88 (76–95) |
Publisher’s Note: MDPI stays neutral with regard to jurisdictional claims in published maps and institutional affiliations. |
© 2021 by the authors. Licensee MDPI, Basel, Switzerland. This article is an open access article distributed under the terms and conditions of the Creative Commons Attribution (CC BY) license (https://creativecommons.org/licenses/by/4.0/).
Share and Cite
Ruiz-Ramírez, P.; Carreras, G.; Fajardo, I.; Tristán, E.; Carrasco, A.; Salvador, I.; Zabana, Y.; Andújar, X.; Ferrer, C.; Horta, D.; et al. Intraepithelial Lymphocyte Cytometric Pattern Is a Useful Diagnostic Tool for Coeliac Disease Diagnosis Irrespective of Degree of Mucosal Damage and Age—A Validation Cohort. Nutrients 2021, 13, 1684. https://0-doi-org.brum.beds.ac.uk/10.3390/nu13051684
Ruiz-Ramírez P, Carreras G, Fajardo I, Tristán E, Carrasco A, Salvador I, Zabana Y, Andújar X, Ferrer C, Horta D, et al. Intraepithelial Lymphocyte Cytometric Pattern Is a Useful Diagnostic Tool for Coeliac Disease Diagnosis Irrespective of Degree of Mucosal Damage and Age—A Validation Cohort. Nutrients. 2021; 13(5):1684. https://0-doi-org.brum.beds.ac.uk/10.3390/nu13051684
Chicago/Turabian StyleRuiz-Ramírez, Pablo, Gerard Carreras, Ingrid Fajardo, Eva Tristán, Anna Carrasco, Isabel Salvador, Yamile Zabana, Xavier Andújar, Carme Ferrer, Diana Horta, and et al. 2021. "Intraepithelial Lymphocyte Cytometric Pattern Is a Useful Diagnostic Tool for Coeliac Disease Diagnosis Irrespective of Degree of Mucosal Damage and Age—A Validation Cohort" Nutrients 13, no. 5: 1684. https://0-doi-org.brum.beds.ac.uk/10.3390/nu13051684