
Diet Quality According to Mental Status and Associated Factors during Adulthood in Spain


1
Department of Preventive Medicine and Public Health, Faculty of Medicine, University of Seville, Avda. Doctor Fedriani, S/N, 41009 Seville, Spain
2
Department of Nursing, Pharmacology and Physiotherapy, Faculty of Medicine and Nursing, University of Córdoba, Avda. Menéndez Pidal, S/N, 14071 Córdoba, Spain
*
Author to whom correspondence should be addressed.
Nutrients 2021, 13(5), 1727; https://0-doi-org.brum.beds.ac.uk/10.3390/nu13051727
Submission received: 14 February 2021
/
Revised: 3 May 2021
/
Accepted: 17 May 2021
/
Published: 19 May 2021
(This article belongs to the Special Issue Diet and Wellbeing across the Life Course)
Abstract
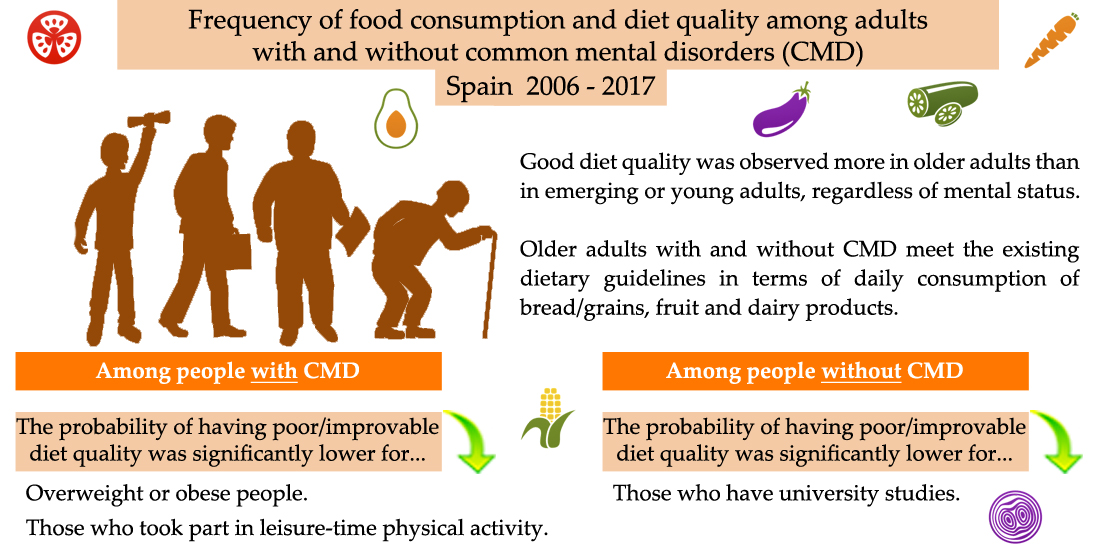
:Common mental disorders (CMD) are characterized by non-psychotic depressive symptoms, anxiety and somatic complaints, which affect the performance of daily activities. This study aimed to analyze prevalence of diet quality among adults with and without CMD from 2006 to 2017, to study the frequency of food consumption and diet quality according to mental status and age, and to determine which sociodemographic, lifestyle and health-related factors are associated with poor/moderate diet quality, according to mental status. A nationwide cross-sectional study was performed in adults with (n = 12,545) and without CMD (n = 48,079). The data were obtained from three Spanish National Health Surveys (2006, 2011/2012 and 2017). Two logistic regression analyses were used to identify factors associated with diet quality in people with and without CMD. Among those with CMD, the probability of having poor/moderate diet quality was significantly lower for overweight or obese people and those who took part in leisure-time physical activity. Among those without CMD, university graduates were less likely to have a poor/moderate diet quality. Good diet quality was observed more in older adults (≥65 years old) than in emerging (18–24 years old) or young adults (25–44 years old), regardless of mental status.

1. Introduction
Mental disorders constitute a rising public health concern throughout the world and are responsible for major social and economic issues affecting all age groups [1,2]. In the wide spectrum of mental illnesses, the most prevalent conditions are depressive and anxiety disorders, defined by the World Health Organization as common mental disorders (CMD) [3]. Although CMD are situated among the top 25 causes of the global burden of disease [4], they are in most cases, preventable and treatable [5,6,7]. Nevertheless, reducing the prevalence of CMD continues to pose a major challenge for health systems worldwide [8].
Many studies have examined the association between diet and depression, with only a limited exploration of anxiety and more severe mental illnesses. However, it is now clear that observational research nutritional psychiatry needs to be extended into this area [9,10,11]. Moreover, dietary intervention studies could not only provide far-reaching guidelines for the prevention and treatment of CMD in the future, but they could also further our current understanding of the associations between diet quality and CMD from an epidemiological viewpoint [12].
The influence of diet and nutrition on mental health and wellbeing is an emerging research avenue [13], and a poor diet quality has recently been revealed as a risk factor for CMD [14,15]. Over recent years, many studies have investigated the role of diet in the development of depression due to its influence on inflammatory pathways [16,17]. Here, extensive research has indicated that high levels of dietary inflammation are associated with increased risk of developing depression in different subgroups of the general population [16,17,18,19,20,21,22,23]. These findings highlight the need to considerer the promotion of an anti-inflammatory diet and healthy overall lifestyle as important elements in primary prevention strategies for CMD in the course of aging [23]. However, to confirm the role of a proinflammatory diet in depression, further prospective epidemiologic investigations are needed.
Optimal nutrition is critical to a person’s wellbeing and a healthy lifespan [24]. In this context, the scientific literature has shown that diet quality is worse in young people compared with older-age individuals [25,26,27]. For example, emerging (18–24 years old) and young adults (25–44 years old) usually have a poor quality diet, due to an excessive intake of energy-dense food and nutrient-poor meals, that include soft drinks, sweets and fast food, in comparison to older adults (≥65 years old) [28]. The inflammatory effects of a diet high in calories and saturated fat have been proposed as one mechanism that may have detrimental effects on brain health, including cognitive decline, hippocampal dysfunction, and damage to the blood-brain barrier [29]. This mechanism also presents a pathway through which poor diet could increase the risk of depression [30]. Some studies have reported that in emerging and young adults, levels of awareness about a balanced diet are low and, therefore, interventions are needed to provide opportunities for healthy dietary choices [31,32]. On the other hand, middle-aged (45–64 years old) and older adults are at important stages of life where events could impact on their diet quality, such as marital transitions, varying work-loads and children moving out of the home [33,34,35]. Here, promoting healthy dietary changes in these stages their lives and improving diet quality [36] could lead to an improved quality of life and help to reduce the burden of certain diseases [37]. Therefore, the key to managing non-communicable diseases related to diet and malnutrition is to take a life-course perspective, and steps must be taken to encourage a good quality diet in each stage of life by promoting a healthy diet [38].
A healthy dietary pattern is mainly characterized by a regular intake of fruit, vegetables, fish, seafood and whole grains [39]. The Mediterranean diet, which is associated with mental wellbeing [30,40], is a healthy dietary pattern characterized by a high intake of legumes, fruit and vegetables, nuts and seafood, a moderate alcohol intake, a low intake of red meat and saturated fat, and olive oil as the only or at least the main culinary fat source [41]. The anti-inflammatory nature of these foods may be the factor linked to a reduced prevalence of mental health conditions [42]. Most studies assess diet quality by the use of dietary quality indexes based on recommended dietary guidelines [43]. In the present study, we evaluated diet quality using the Spanish Healthy Eating Index (SHEI) [44], which conforms to the Spanish Society of Community Nutrition’s (SSCN) dietary guidelines [45].
In this novel study, we show the relationship between numerous different factors and diet quality in a large sample of adults with and without CMD in Spain surveyed in three waves (2006, 2011/2012, 2017) as part of the Spanish National Health Survey (SNHS). Therefore, the aims of this study are: (i) to analyze prevalence of diet quality among adults with and without CMD from 2006 to 2017, (ii) to study the frequency of food consumption and diet quality according to mental status and age, and (iii) to determine which sociodemographic, lifestyle and health-related factors are associated with poor/moderate diet quality, according to mental status.
2. Materials and Methods
2.1. Design, Data Source and Sample
A nationwide, cross-sectional study was carried out using individual data taken from three SNHS: 2006 [46], 2011/2012 [47] and 2017 [48].
The SNHS were conducted by the National Institute of Statistics and Spanish Minis-try of Health, Consumer Affairs and Social Welfare. These surveys were carried out on a representative sample of individuals via home-based personal interviews. The study sub-jects were selected by means of a probabilistic multistage sample, with census tracts as the first-stage units, family dwellings as the second-stage units and surveyable people present at home the third. SNHS collected data via in-home interviews which included specific questions on sociodemographic characteristics, mental health status and diet quality. Interviews were conducted by a suitably approved interviewer and supplemented in some cases by a follow-up telephone interview. Further details on the SNHS methodology can be obtained from the National Institute of Statistics [49,50,51].
From the SNHS database, we selected people aged ≥ 18 years old. From the initial 72,090 participants (SNHS 2006: n = 29,026; SNHS 2011/2012: n = 20,587; SNHS 2017: n = 22,477), we excluded 11,466 individuals who did not respond to or refused to answer the interview questions (SNHS 2006: n = 5162; SNHS 2011/2012: n = 3120; SNHS 2017: n = 3184). Therefore, the total sample of participants for the current study numbered 60,624 adults: 23,864 from SNHS 2006; 17,467 from SNHS 2011/2012; and 19,293 from SNHS 2017. For the nationwide, cross-sectional analysis, we included 48,079 adults without CMD (SNHS 2006: n = 18,657; SNHS 2011/2012: n = 13,721; SNHS 2017: n = 15,701) and 12,545 adults with CMD (SNHS 2006: n = 5207; SNHS 2011/2012: n = 3746; SNHS 2017: n = 3592).
2.2. Variables
2.2.1. Diet Quality
The SHEI tool was used to study diet quality as a dependent variable [44]. The SHEI is an instrument designed to measure how well diets meet the recommendations of the SSCN dietary guidelines [45].
The SHEI questionnaire consists of ten food representative groups from the dietary guidelines, as follows: (a) daily consumption: (1) bread/grains, (2) vegetables (i.e., leafy vegetables, salads) (3) fruit (excluding juices) and (4) dairy products (yoghurt, cheese, milk). (b) Weekly consumption: (5) meat (lamb, pork, chicken) and (6) legumes. (c) Occasional food consumption: (7) cold meats and cuts, (8) sweets (pastries, cereals with sugar, biscuits, jams) and (9) soft drinks with sugar, and the last was (10) the variety of the diet, according to the SSCN recommendations for a healthy diet. The ten food items were worded in exactly the same way in the three SNHS. These items were divided into five response options, in the following order according to the frequency of food consumption: (i) never or hardly ever, (ii) <1 a week, (iii) 1–2 a week, (iv) ≥3 times a week, but not daily, (iv) and daily.
Each of the ten food groups was scored from 0 to 10 points (Supplementary Table S1), with the highest score in a food group denoting maximum compliance with the SSCN recommendations [45].
The overall score of the SHEI results was based exclusively on the frequency of food consumption rather than the quantity consumed and was calculated from the sum of the frequency of consumption of the ten representative food groups and ranged from 0 to 100 points: the ‘poor diet quality’ category corresponds with the lowest scores (SHEI score < 51 points), the ‘moderate diet quality’ category corresponds with the middle scores (SHEI score 51–80 points) and ‘good diet quality’ category corresponds with the highest scores (SHEI score > 80 points) [44].
2.2.2. Mental Health
Questions were answered in a 4-point Likert-type response format, from 0 points (‘more than usual’) to 3 points (‘much less than usual’) and were scored on a bimodal response scale (0-0-1-1), according to the original GHQ method [50]. The total score there-fore ranges from 0 to 12 points. A cut-off of ≥3 points was chosen to estimate the pro-portion of participants without CMD (<3 points) and with CMD (≥3 points) [55].
2.2.3. Sociodemographic Characteristics
Sociodemographic factors were analyzed as independent variables and were gathered by asking subjects the following questions: ‘What is your gender?’ (female, male), ‘What is your marital status?’ (never-married, married, widowed and separated/divorced), ‘What is your educational level?’ (without formal education, completed primary studies, completed secondary studies or professional training, and completed university studies), ‘What is your nationality?’ (Spanish, foreign), ‘What is the size of your town of your residence?’ (<10,000 inhabitants and ≥10,000 inhabitants), ‘How old are you?’ (the age was divided into four major life stages encompassing most of the human lifespan: emerging adults (18–24 years old) as proposed by Arnett [56], young adults (25–44 years old), middle-aged adults (45–64 years old) and older adults (≥65 years), as proposed by Erikson [57]) and ‘What is/was the occupation, profession or trade you perform or performed in your last job?’ (occupation was classified into the occupation social class categories reported by the Spanish Society of Epidemiology [58] as Classes I and II, Classes III and IV, Classes V and VI).
2.2.4. Health-Related Variables
Information on health-related variables was collected through the following questions: ‘Can you tell me if you currently smoke?’ (yes, no), ‘Have you consumed any alcoholic drinks in the last twelve months?’ (yes, no). In addition, self-perceived health status was assessed with the following question: ‘What is your health status?’, to which the participants could answer: very good, good, fair, poor or very poor.
Finally, body mass index (BMI) was based on self-reported weight and height and was classified into four categories, following the World Health Organization [59]: underweight (BMI < 18.50 kg/m2), normal-weight (BMI ranging between 18.50 and 24.99 kg/m2), overweight (BMI ranging between 25.00 and 29.99 kg/m2) and obese (BMI ≥ 30 kg/m2).
2.2.5. Lifestyle Variables
The SNHS measured lifestyle variables on the basis of the following questions: ‘Do you take part in any physical activity in your work or your main activity?’ (yes, no) and ‘Do you engage in any physical activity during your leisure time?’ (yes, no).
2.3. Ethical Aspects
Data from the three SNHS (2006, 2011/2012 and 2017) are available to the public and are stored in anonymized microdata [46,47,48]; as a result, no special permits were required for their use. According to Spanish law, the approval of an Ethics Committee was not required. This data is shown in the Supplementary File.
2.4. Statistical Analysis
Statistical methods used in data analysis were descriptive statistics, inferential statistics and regression technique. Descriptive statistics were presented with a count (n/%). We performed the Kolmogorov–Smirnov normality test before any comparison of quantitative variables between the groups. Inferential statistics used were the Chi-Square test, or Fisher’s exact test if the number of expected frequencies was >5 between qualitative variables; Student’s t-test to compare the means between two independent groups as a parametric test, and the Mann–Whitney U test as a non-parametric test. The kind of regression technique used was logistic regression. In particular, two binary logistic regressions in subjects with and without CMD were performed to identify the factors related to diet quality in each group. For the purpose of the analysis, the diet quality was recoded as a categorical variable into ‘good diet quality’ (if the SHEI score was above than 80 points) and ‘poor diet quality/moderate diet’ (if the SHEI score was below or equal to 80 points). The significant variables (p < 0.05) obtained in each univariate analysis were modelled in binary logistic regressions. The goodness of fit was corroborated with the Hosmer-Lemeshow test. The Wald statistic was used as a contrasting statistic. In addition, the crude and adjusted odds ratios (OR) were calculated with 95% confidence intervals. The presence of confounding and interaction were examined. The hypothesis tests were two-tailed and statistical significance was fixed at an alpha error of below 5%. The weighting coefficients included in the SNHS were applied in all the analyses to ensure representativeness. For the statistical analysis, the IBM SPSS Statistics version 25 program (IBM Corp, Armonk, NY, USA), licensed to the University of Seville (Spain) was used.
3. Results
3.1. Characteristics of Participants
A total of 60,624 adults (48,079 people without CMD and 12,545 people with CMD) participated in the present study. Females were much more likely to be represented among those without CMD (75.12%) than those with CMD (24.88%). Participants who were active during their leisure time were much more likely to be represented among those without CMD (83.04%) than those with CMD (16.96%). In contrast, adults who perceived ‘poor’ their health status were much more likely to be represented among those with CMD (56.52%) than those without CMD (43.48%). Other sociodemographic, lifestyle and health-related factors are shown in Table 1.
3.2. Prevalence of Diet Quality in SNHS 2006, SNHS 2011/2012 and SNHS 2017
Following the year of the survey (2006, 2011/2012 and 2017), no significant trend in diet quality was observed in participants with or without CMD.
The prevalence of moderate diet quality among people with CMD was 63.82% in 2006, 50.96% in 2011/2012 and 67.01% in 2017 (p = 0.85). Similarly, the percentage of people without CMD whose diet quality was moderate was 65.18% in 2006, 56.17% in 2011/2012 and 70.13% in 2017 (p = 0.74). On the other hand, the prevalence of good diet quality in individuals with CMD was 32.76% in 2006, 46.53% in 2011/2012 and 30.71% in 2017 (p = 0.89) and in people without CMD was 31.47% in 2006, 42.15% in 2011/2012 and 28.13% in 2017 (p = 0.82). Finally, the prevalence of poor diet quality in people with CMD was 3.42% in 2006, 2.51% in 2011/2012 and 2.28% in 2017 (p = 0.25) while in participants without CMD it was 3.35% in 2006, 1.68% in 2011/2012 and 1.74% in 2017 (p = 0.39).
3.3. Frequency of Food Consumption and Diet Quality According to Mental Status
Table 2 shows the frequency of food consumption and diet quality according to mental status among adults from all three survey periods (2006, 2011/2012 and 2017). A higher frequency of daily consumption of certain food groups was observed among people without CMD (bread/grains: 87.23% vs. 85.39% p < 0.001; fruit: 68.46% vs. 67.63% p < 0.001; dairy products: 87.20% vs. 86.24% p < 0.001), but not in vegetables (44.78% vs. 47.12% p < 0.001).
As regards weekly consumption, 1–2 weekly consumption of meat was lower among individuals without CMD (27.22% vs. 31.42% p < 0.001), while for legumes, it was higher among individuals without CMD (67.01% vs. 57.66% p < 0.001).
As for occasional food consumption, the consumption ‘never or hardly ever’ of cold meats and cuts, sweets, soft drinks with sugar consumption was lower among participants without CMD (13.13% vs. 19.03% p < 0.001; 17.01% vs. 20.93% p < 0.001; 48.92% vs. 55.36% p < 0.001, respectively).
Furthermore, a moderate diet quality was more prevalent in individuals without CMD (64.22% vs. 60.89% p < 0.001).
The relationships between overall diet quality score, food group scores and presence/absence of CMD are shown in Table 3. People without CMD meet more food-based dietary guidelines of the SSCN in relation to bread/grains, fruit, dairy products and legumes consumptions in comparison with people with CMD. In contrast, people with CMD meet more food-base dietary guidelines of the SSCN in relation to cold meats and cuts, sweets and soft drinks with sugar consumption in comparison with people without CMD. In total, the overall diet quality was better in people with CMD.
3.4. Comparison of the Frequency of Food Consumption and Diet Quality across Age Groups within Individuals with CMD
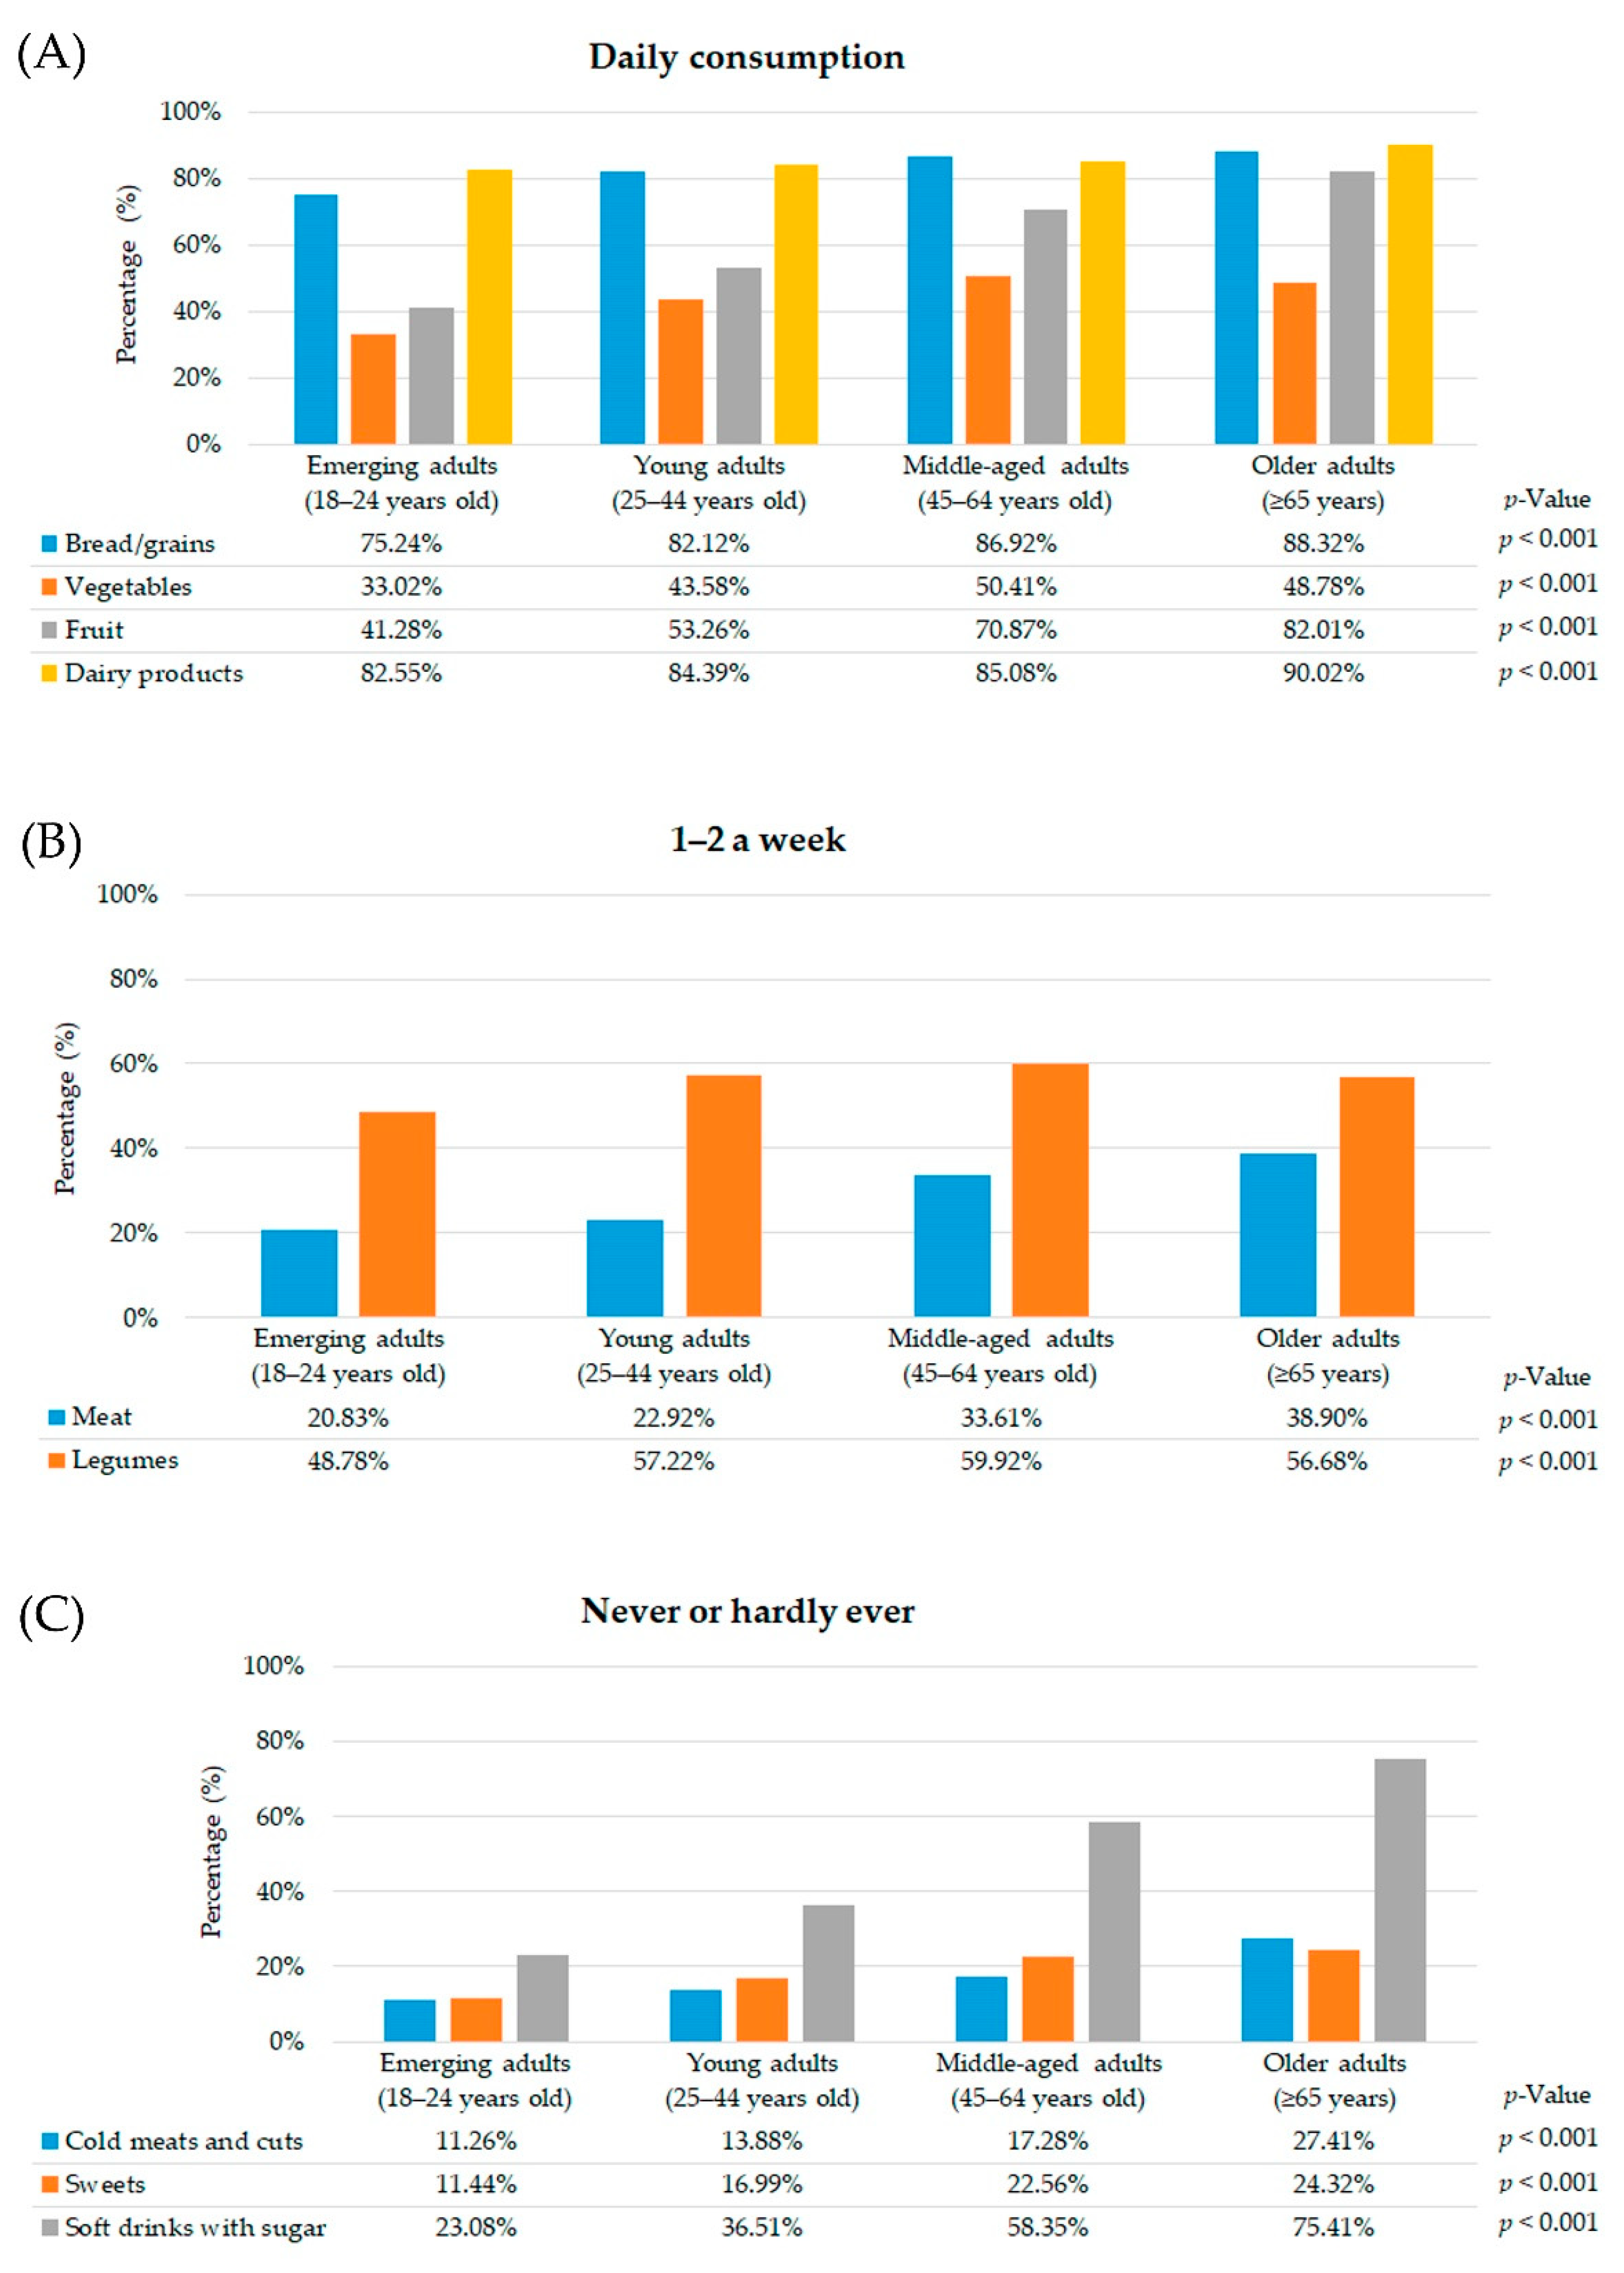
Older adults with CMD had a higher prevalence of daily consumption of bread/grains, fruit and dairy products compared to other age groups. Nonetheless, vegetable consumption was higher among middle-aged adults than other age groups (Figure 1A).
In relation to weekly consumption, older adults with CMD had a significantly higher 1–2 weekly consumption of meat than other age groups. Meanwhile, the consumption of legumes 1–2 a week was more frequent in middle-aged adults with CMD compared to other age groups (Figure 1B).
As far as occasional food consumption is concerned, the prevalence of older adults with CMD who never or hardly ever consumed cold meats and cuts, sweets and soft drinks with sugar was higher than other age groups (Figure 1C).
Moreover, older adults with CMD had a significantly better diet quality in comparison with other age groups (emerging adults: 8.63%, young adults: 21.55%, middle-aged adults: 39.55%, and older adults: 51.20%; p < 0.001). In contrast, emerging adults had a higher moderate diet quality (emerging adults: 78.05%, young adults: 73.02%, middle-aged adults: 59.08%, older adults: 48.38%; p < 0.001) and poor diet quality (emerging adults: 13.32%, young adults: 5.43%, middle-aged adults: 1.37%, older adults: 0.42%; p < 0.001).
3.5. Comparison of the Frequency of Food Consumption and Diet Quality across Age Groups within Individuals without CMD
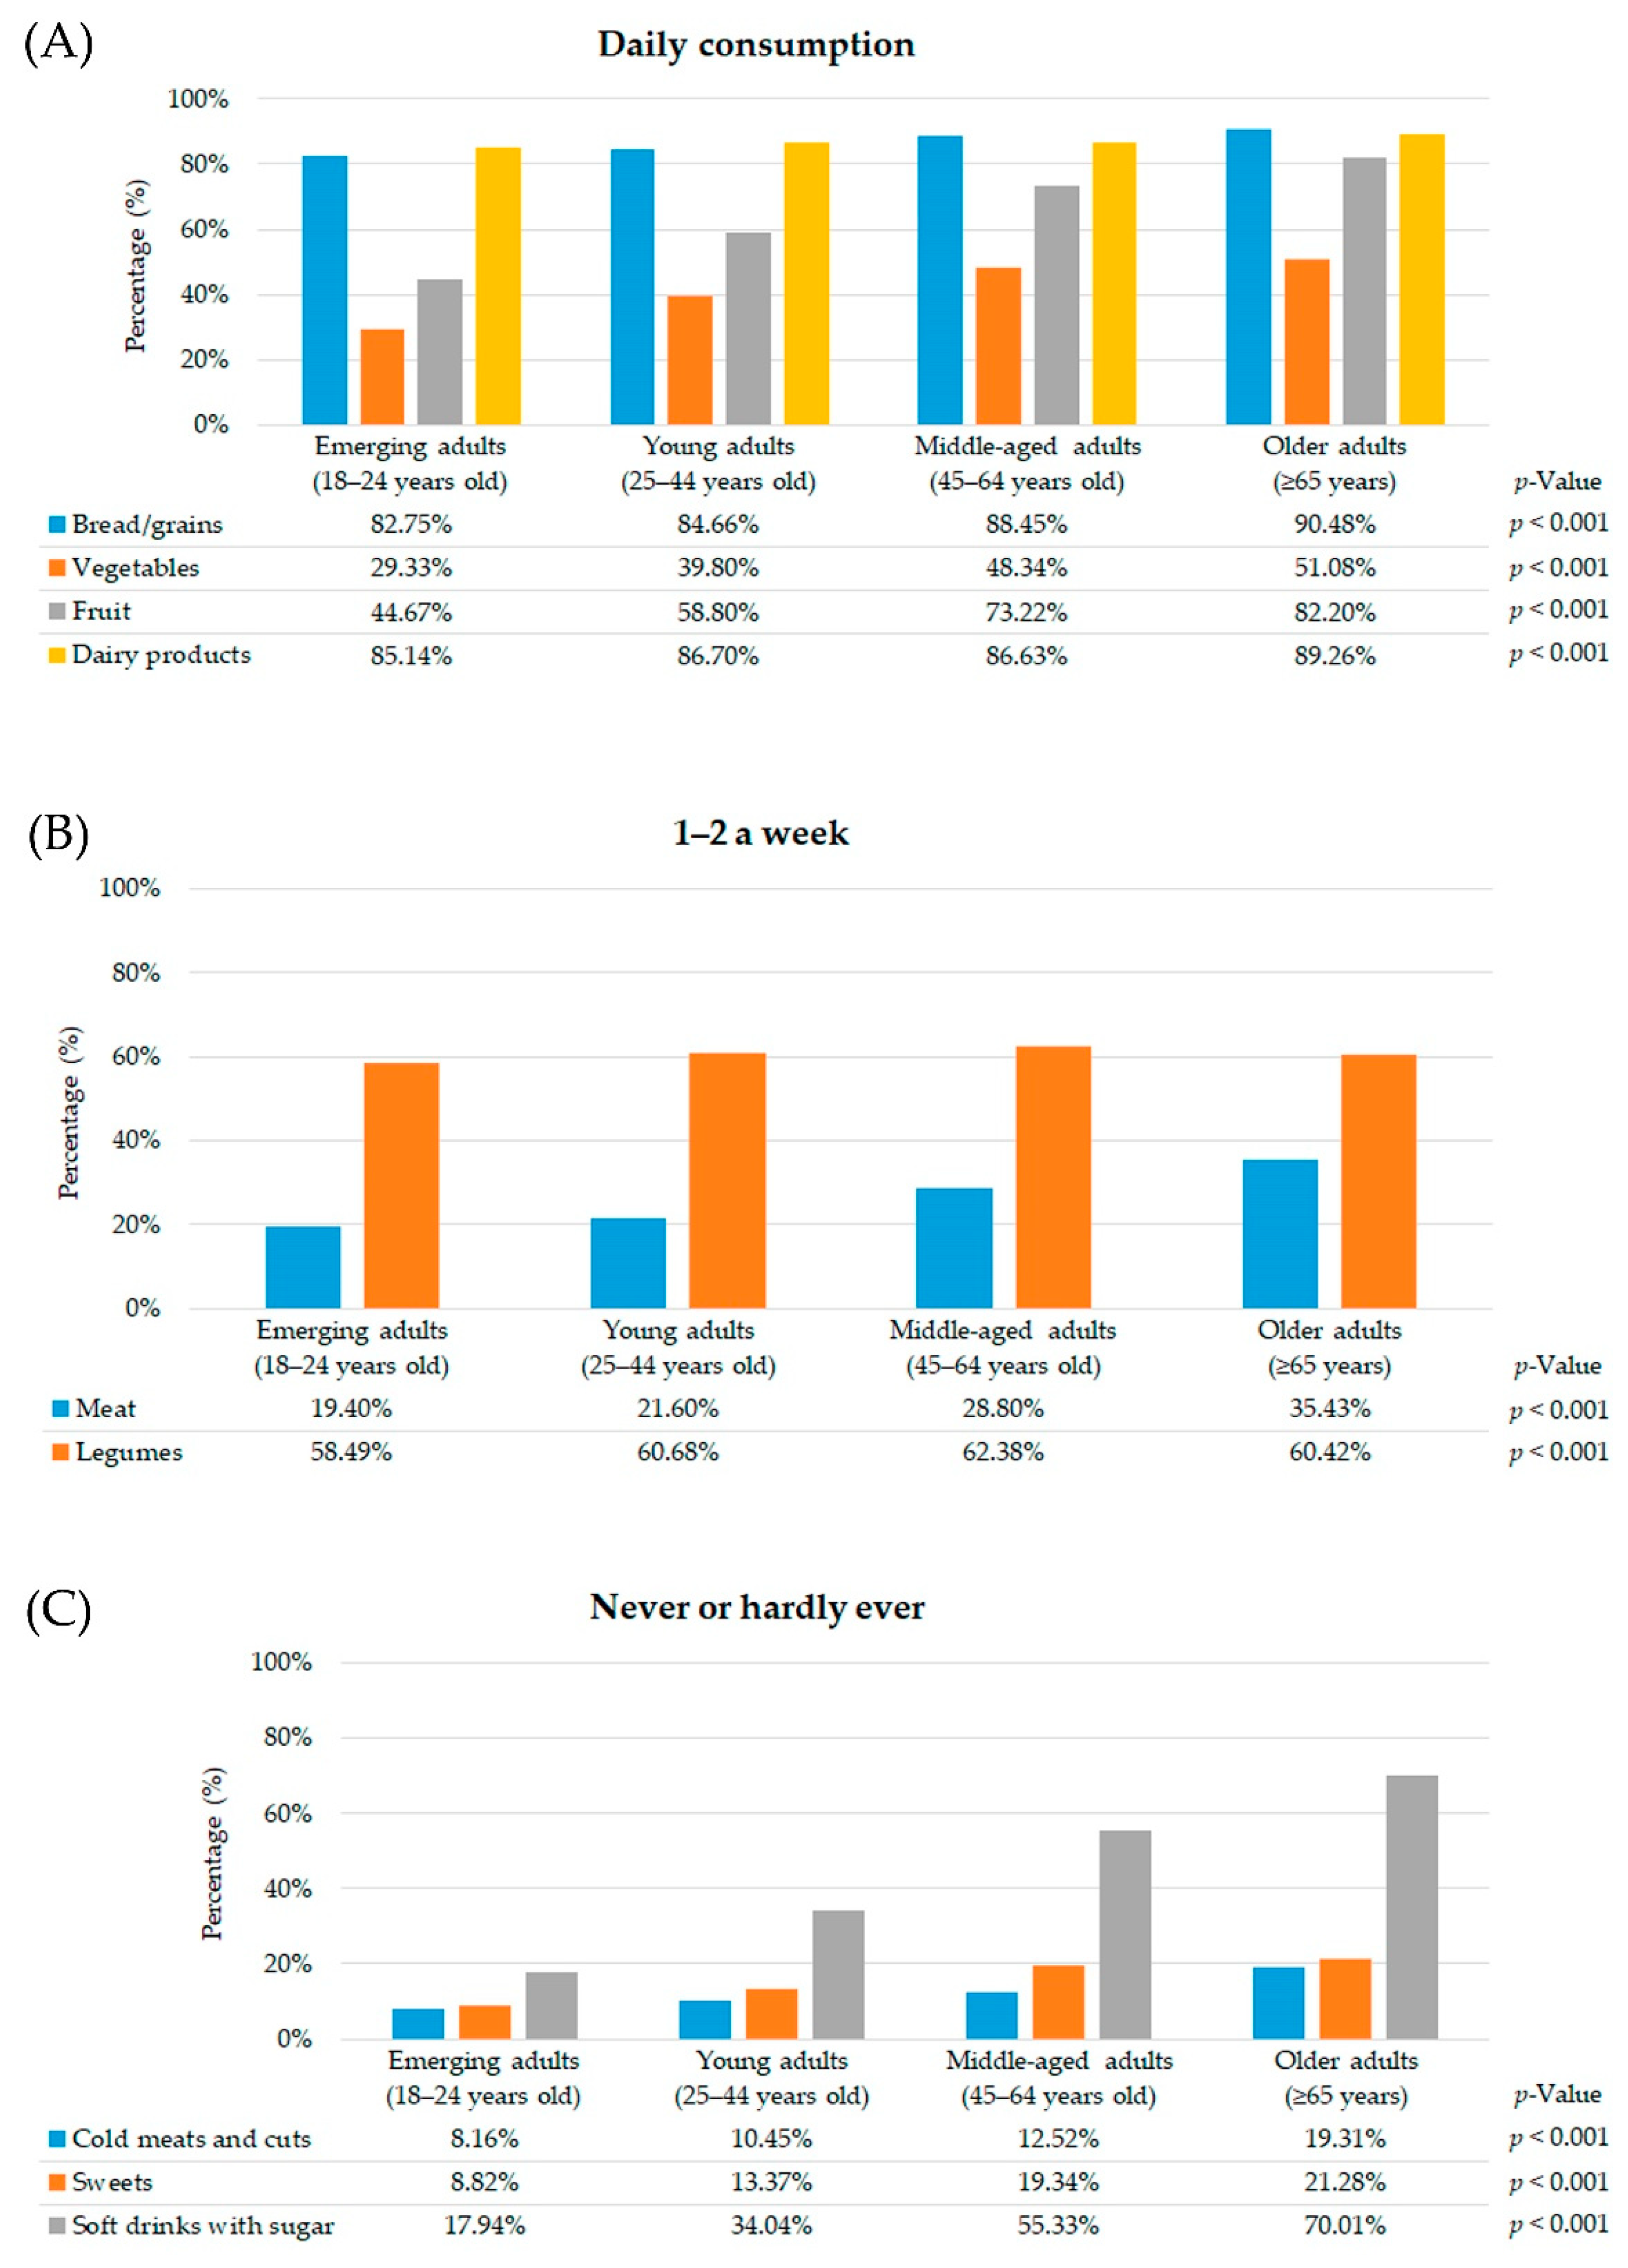
Among participants without CMD, older adults met the existing dietary guidelines in terms of the daily consumption of bread/grains, vegetables, fruit and dairy products compared with the other age groups (Figure 2A).
As regards weekly consumption, the prevalence of 1–2 weekly consumption units of meat was higher among older adults without CMD. Nevertheless, middle-aged adults had a significantly higher 1–2 weekly consumption of legumes (Figure 2B).
In relation to occasional food consumption, the prevalence of older adults without CMD who never or hardly ever reported a daily consumption of cold meats and cuts, sweets and soft drinks with sugar was higher in comparison with other age groups (Figure 2C).
As for diet quality, moderate diet quality was higher in emerging adults without CMD (emerging adults: 78.62%, young adults: 75.07%, middle-aged adults: 61.29%, older adults: 48.42%; p < 0.001) than other age groups, as was poor diet quality (emerging adults: 10.38%, young adults: 3.67%, middle-aged adults: 0.98%, older adults: 0.30%; p < 0.001). In contrast, good diet quality was more prevalent in older adults without CMD (emerging adults: 11.00%, young adults: 21.26%, middle-aged adults: 37.73%, older adults: 51.28%; p < 0.001).
3.6. Comparison of the Frequency of Food Consumption and Diet Quality across Age Group in Individuals with and without CMD
As can be seen in Table 4, a higher frequency of daily consumption of bread/grains was observed among emerging and young adults without CMD in comparison with those with CMD. Moreover, a higher frequency of daily consumption of bread/grains was observed among middle-aged and older adults with CMD compared to those without CMD.
As regards weekly consumption, the consumption of meat was higher among middle-aged and older individuals with CMD in comparison with those without CMD. Similarly, 1–2 weekly consumption of legumes was higher among emerging and young adults without CMD compared to those with CMD.
As for occasional food consumption, the consumption ‘never or hardly ever’ of soft drinks with sugar consumption was higher among emerging and young adults without CMD in comparison with those with CMD. In contrast, the consumption ‘never or hardly ever’ of soft drinks with sugar was more prevalent in older adults with CMD compared to those without CMD.
In relation to diet quality, the prevalence of good diet quality among older adults with CMD was higher than those without CMD. On the other hand, the prevalence of poor diet quality among emerging adults without CMD was higher than those with CMD.
3.7. Association between Sociodemographic Characteristics, Lifestyle Behavior, Health-Related Variables and Diet Quality According to Mental Status
Among participants with CMD (Table 5), the adjusted logistic regression model indicated that the likelihood of having a poor or moderate diet quality was greater in individuals without formal education (OR = 1.24, 95% CI 1.09–1.40) and primary education (OR = 1.17, 95% CI 1.06–1.29). In contrast, lower rates of poor or moderate diet quality were linked to overweight (OR = 0.83, 95% CI 0.76–0.91) and obese (OR = 0.84, 95% CI 0.76–0.94) status, and those who took part in leisure-time physical activity (OR = 0.78, 95% CI 0.72–0.84).
The adjusted logistic regression model in Table 6 shows that the probability of having a poor or moderate diet quality was lower in people with university studies (OR = 0.90, 95% CI 0.84–0.95), and those belonging to Social Classes I and II (OR = 0.89, 95% CI 0.84–0.94). In contrast, higher rates of poor or moderate diet quality were linked to Social Classes V and VI (OR = 1.08, 95% CI 1.03–1.13), underweight status (OR = 1.47, 95% CI 1.23–1.77), people who had consumed alcohol (OR = 1.04, 95% CI 1.01–1.09), and those who took part in no leisure-time physical activity (OR = 1.47, 95% CI 1.40–1.53). Furthermore, the probability of having a poor or moderate diet quality was greater when the perceived health was fair (OR = 0.93, 95% CI 0.88–0.98) or very poor (OR = 0.80, 95% CI 0.64–0.99).
4. Discussion
4.1. Main Findings
The present study is unique in that it shows the relationship between a large number of characteristics and diet quality in a large sample of adults with and without CMD living in Spain, from a survey conducted in three waves (2006, 2011/2012 and 2017).
In our study, the prevalence of diet quality in need of improvement among people with and without CMD was higher in 2017 than in 2011/12. This may be due to the fact that in recent years, food habits and consumption in Spain are moving away from the traditional Mediterranean diet towards an increasingly “westernized” diet [60]. The Spanish diet is becoming saltier and sweeter due to the incorporation of more highly processed foods and changes in dietary habits. Specifically, the report on food consumption in Spain 2017 [61], conducted by the Ministry of Agriculture, Fisheries and Food shows that the prevalence of processed food consumption increased by 2.2% from 2011/12 to 2017. In addition, since 2015, there has been a reduction in the number of households with children and in the average family size. According to a previous study [62], people living alone are less likely to follow a varied diet and have lower fruit, vegetable, and fish consumption than those living with others.
There is a broad consensus in the scientific literature regarding the association be-tween the adherence to a poor diet quality and the presence of CMD [63,64,65,66]. The lack of energy or enthusiasm for preparing or enjoying food, as well as appetite loss, may influence diet quality among people with CMD symptoms [41,67]. Furthermore, emerging evidence suggests that diet may influence the onset of mood disorders and specifically depression. For instance, recent systematic reviews have demonstrated associations between measurements of diet quality and the probability and risk of depression [15,63]. Thus, diet may impact on in mental health via several pathways, including those related to oxidative stress, inflammation, and mitochondrial dysfunction, which are disrupted in people with mental disorders [68], and unhealthy diets contain certain compounds that may negatively affect these pathways. For example, elements commonly found in processed foods such as saturated fatty acids, artificial sweeteners, and emulsifiers may alter the gut microbiome and activate inflammatory pathways [43], which is associated with a significantly higher incidence of depressive symptoms, even among those without diagnosed mental disorders [17,20,69].
Our findings show that the prevalence of a moderate diet quality was higher in individuals without CMD. However, previous studies have pointed out that a history of CMD may stimulate these subjects to improve their diet quality in the long term [65,67].
Emerging adulthood (individuals aged 18 to 24 years old) is characterized by a continuing process of self-definition and increasing autonomy and it is a time when major role transitions take place [56,70,71]. Emerging adults tend to have a poor quality diet, often accompanied by an excessive intake of soft drinks with sugar and fast food [72]. Similarly, young adulthood is a period when healthy patterns are established, such as a good quality diet, which will carry over into later adulthood.
In our analysis, both emerging and young adults obtained poor diet quality index scores, regardless of their mental status. It is well-known that young people have an excessive intake of soft drinks with sugar, cold meats and cuts and sweets, while their intake of vegetables and fruit is lower in comparison with older age groups [73,74,75,76,77]. In fact, our findings showed that ‘never or hardly ever’ consuming soft drinks, sweets and cold meats and cuts was higher as age increased among people with CMD in comparison with those without CMD, except in older adults. Several possible mechanisms linking food with sugar intake and anxiety/depression symptoms are assumed, including inflammation markers [78]. Previous studies reported other influences on an unhealthy diet such as lack of motivation, time constraints and cost [79,80,81]. Meanwhile, a few intervention studies have correlated improvements in mental health status with an increase in fruit and vegetable intake [82,83,84,85]. For example, Mujcic and Oswald [86] showed that fruit and vegetables consumption increased happiness, wellbeing and life satisfaction. Moreover, middle-aged and especially older adults had a better diet quality in comparison with the two first life stages, although other studies in these advanced age groups with depressive symptoms found a poor diet quality [87,88], perhaps influenced by social factors, such as marital status and social contacts [89]. Our results show that a higher frequency of daily consumption of bread/grains, vegetables or fruit was observed among middle-aged and older adults with CMD in comparison with those without CMD. A higher intake of dietary fiber helps the nervous system, which has a beneficial influence on mental health [90]. Other food groups, such as legumes, contain B vitamins, magnesium, folic acid and potassium, among others, which could act as protection against the risk of psychological disorders [91]. Our findings show that 1–2 weekly consumption of legumes was higher among emerging and young adults without CMD compared to those with CMD, and among middle-aged and older adults with CMD in comparison with those without CMD. A randomized clinical trial suggests that a dietary rich in legume and nuts had beneficial effects on depression [92]. As regards the 1–2 weekly consumption of meat, it was higher among middle-aged and older adults with CMD, in line with another study [93].
Educational level may be one of most important social factors explaining differences in food habits [94,95,96]. Here, it was found that the probability of having a poor or moderate diet quality was greater in adults with CMD with a lower educational level compared with those without CMD with higher education. This is not the first time that a higher educational level has been associated with good dietary habits [97,98,99], although some studies have failed to find any association [100] or even found an inverse link [101,102], probably due to people with a higher educational level having access to better knowledge about food [103,104]. In addition, some studies have shown that a favorable attitude towards a healthy diet was associated with a higher educational level [105,106,107]. Our results contrast with another study, which found that university students whose diet was in need of improvement or had a poor diet had twice or triple the risk of CMD, respectively, than those who had a healthy diet [108].
Several studies have found an association between poor or moderate diet quality; the latter indicates a medium adherence to the recommendations proposed by the Spanish Society of Community Nutrition [45] and high BMI [109,110,111]. Nevertheless, our results have shown that overweight and obese were protective factors for poor or moderate diet quality in adults with CMD. Recently, it has also been shown that obese and overweight adults are motivated to lose weight by taking up a healthier lifestyle, such as healthy eating or doing physical activity [112]. Moreover, the sensory pleasure derived from eating palatable meals could reduce stress and produce a positive mood [113]. In contrast, being underweight was a risk factor for poor or moderate diet quality in adults without CMD, in line with other studies [114,115,116], probably due to a reduced intake of nutritious food [117].
As regards lifestyle behavior, the multivariate analysis showed a link between lower rates of poor or moderate diet quality and those who engaged in physical activity during their leisure time among adults with CMD. Moreover, not engaging in physical activity was a risk factor for poor or moderate diet quality in adults without CMD. It is well-documented that leisure-time physical activity has considerable mental health benefits throughout a patient’s lifespan [118,119,120,121]. In fact, engaging in leisure-time physical activity is negatively associated with CMD symptoms [122]. In addition, several studies have found many cases of individuals who had a good diet quality, and took part in healthy behaviors associated with engaging in physical activity and smoking less [123,124,125].
4.2. Strengths and Limitations
This study has certain limitations. First, the present study is a cross-sectional design, so it is currently not possible to assign causality. Second, diet quality was based exclusively on the frequency of food consumption and not on the quantity of consumption; this does not allow us to judge if the p-values given for the small percentages obtained for CMD versus non-CMD are clinically significant despite the fact that the sample size is very large. Third, mental status was constructed from self-reported questionnaires, and the responses could therefore have been biased by social desirability and/or memory. Fourth, there was a lack of data on institutionalized populations, since the personal interviews were conducted at the participants’ homes. Fifth, the BMI data were taken from the participants’ own responses about their height and weight in the self-reported surveys. Finally, the SNHS surveys were carried out with different samples, which means that the different characteristics of the participants could have affected our results.
On the other hand, one strength of the present study is that data from the SNHS surveys have been obtained using carefully planned methodology, including sampling, well-designed forms, preparation of the survey participants, supervision of the survey and filtering of the data, all of which guarantee a representative sample of the population and enable comparisons to be made. Moreover, the validity of the Health Eating Index (HEI) has been demonstrated with plasma biomarkers [126,127], where a higher score in the SHEI was associated with blood concentrations of certain markers with a protective effect against particular diseases. Finally, this study included people aged ≥ 65 years old, and the total sample was therefore representative of all adults living in Spain.
4.3. Implications for Research and Practice
The findings of this work offer useful insights for further studies. Regardless of mental status, a high percentage of people had a moderate diet quality, which suggests that more effort needs to be made to improve healthy dietary habits. In addition, our findings could help to identify which age groups had a poor and/or moderate diet quality. In this case, it would be desirable for public health policies to promote healthy eating habits, especially among young people [128,129]. In particular, it is crucial to target favorable opinions of family, friends and health professionals in relation to the consumption of fruit and vegetables [130]. One way could be by promoting short cooking programs to improve young people’s skills and confidence in certain areas of food literacy, especially those related to the consumption of fruit and vegetables [131,132]. Although middle-aged adults and older individuals had higher diet quality index scores in comparison with other age groups, further intervention studies are required to promote healthy diet quality in these age groups, considering the psychological and social factors [133]. In addition, the results of the multivariate analysis may be used as a guide to improve Spanish public health policies and health promotion guidelines about diet quality [1]. Lastly, it would be of great interest to carry out further longitudinal studies to evaluate the impact of CMD on diet quality in the stages of life highlighted in this study.
5. Conclusions
Regardless of mental status, a better diet quality could be observed in older adults than emerging and young adults. In this regard, older adults with and without CMD meet the existing dietary guidelines in terms of daily consumption of bread/grains, fruit and dairy products. Nevertheless, a higher frequency of daily consumption of bread/grains is observed among middle-aged and older adults with CMD compared to those without CMD. In contrast, the consumption ‘never or hardly ever’ of soft drinks, sweets and cold meats and cuts increases with age among people with CMD in comparison to those without CMD, except in older adults. Among people with CMD, not having primary studies is considered a risk factor for having a poor or moderate diet quality. In contrast, in adults, overweight or obese and doing leisure-time physical activity are considered protective factors against having a poor or moderate diet quality. Among individuals without CMD, the likelihood of a having poor or moderate diet quality decreases in those who have university studies; however, it increases in those who are underweight or do not do any physical activity in their leisure time.
Supplementary Materials
The following are available online at https://0-www-mdpi-com.brum.beds.ac.uk/article/10.3390/nu13051727/s1, Table S1: criteria to define the score for each item of the Spanish Health Eating Index (SHEI), File S1: research data.
Author Contributions
Conceptualization, S.P.d.l.C. and J.C.; methodology, S.P.d.l.C. and J.C.; software, S.P.d.l.C. and J.C.; validation, S.P.d.l.C. and J.C.; formal analysis, J.C.; investigation, S.P.d.l.C. and J.C.; resources, S.P.d.l.C. and J.C.; data curation, S.P.d.l.C. and J.C.; writing—original draft preparation, S.P.d.l.C. and J.C.; writing—review and editing, S.P.d.l.C. and J.C.; visualization, S.P.d.l.C. and J.C.; supervision, S.P.d.l.C.; project administration, S.P.d.l.C. and J.C. All authors have read and agreed to the published version of the manuscript.
Funding
This research received no specific grant from any funding agency.
Institutional Review Board Statement
Ethical review and approval were waived for this study, due to according with Spanish legislation, when secondary data are used, there is no need for approval from an ethics committee.
Informed Consent Statement
Informed consent was obtained from all subjects involved in the study.
Data Availability Statement
The data are available as Supplementary Material (File S1: research data).
Acknowledgments
We would like to express special thanks to F. Cordobés for her assistance.
Conflicts of Interest
The authors declare no conflict of interest.
References
- World Health Organization (WHO). Mental Health Action Plan 2013–2020. Available online: https://apps.who.int/iris/bitstream/handle/10665/89966/9789241506021_eng.pdf?sequence=1 (accessed on 3 January 2020).
- World Health Organization (WHO). Mental Health Action Programme (mhGAP) Community Toolkit: Field Test Version. 2019. Available online: https://apps.who.int/iris/bitstream/handle/10665/328742/9789241516556-eng.pdf (accessed on 3 January 2021).
- World Health Organization (WHO). Depression and Other Common Mental Disorders: Global Health Estimates. 2017. Available online: https://apps.who.int/iris/bitstream/handle/10665/254610/WHO-MSD-MER-2017.2-eng.pdf (accessed on 3 January 2021).
- GBD 2017 DALYs and HALE Collaborators. Global, regional, and national disability-adjusted life-years (DALYs) for 359 diseases and injuries and healthy life expectancy (HALE) for 195 countries and territories, 1990–2017: A systematic analysis for the Global Burden of Disease Study 2017. Lancet 2018, 392, 1859–1922. [Google Scholar] [CrossRef] [Green Version]
- Craske, M.G.; Stein, M.B.; Eley, T.C.; Milad, M.R.; Holmes, A.; Rapee, R.M.; Wittchen, H.-U. Anxiety disorders. Nat. Rev. Dis. Primers. 2017, 3, 17024. [Google Scholar] [CrossRef] [PubMed]
- Hudson, J.L. Prevention of anxiety disorders across the lifespan. JAMA Psychiatry 2017, 74, 1029–1030. [Google Scholar] [CrossRef] [PubMed]
- Hoare, E.; Callaly, E.; Berk, M. Can depression be prevented? If so, how? JAMA Psychiatry 2020. [Google Scholar] [CrossRef]
- Jorm, A.F.; Patten, S.B.; Brugha, T.S.; Mojtabai, R. Has increased provision of treatment reduced the prevalence of common mental disorders? Review of the evidence from four countries. World Psychiatry 2017, 16, 90–99. [Google Scholar] [CrossRef] [PubMed] [Green Version]
- Marx, W.; Moseley, G.; Berk, M.; Jacka, F.N. Nutritional psychiatry: The present state of the evidence. Proc. Nutr. Soc. 2017, 76, 427–436. [Google Scholar] [CrossRef] [PubMed] [Green Version]
- Hockey, M.; McGuinness, A.J.; Marx, W.; Rocks, T.; Jacka, F.N.; Ruusunen, A. Is dairy consumption associated with depressive symptoms or disorders in adults? A systematic review of observational studies. Crit. Rev. Food. Sci. Nutr. 2020, 60, 3653–3668. [Google Scholar] [CrossRef] [PubMed]
- Lane, M.M.; Davis, J.A.; Beattie, S.; Gómez-Donoso, C.; Loughman, A.; O’Neil, A.; Jacka, F.N.; Berk, M.; Page, R.; Marx, W.; et al. Ultraprocessed food and chronic noncommunicable diseases: A systematic review and meta-analysis of 43 observational studies. Obes. Rev. 2021, 22, e13146. [Google Scholar] [CrossRef] [PubMed]
- Dash, S.R.; O’Neil, A.; Jacka, F.N. Diet and common mental disorders: The imperative to translate evidence into action. Front. Public Health 2016, 4, 81. [Google Scholar] [CrossRef] [PubMed] [Green Version]
- Owen, L.; Corfe, B. The role of diet and nutrition on mental health and wellbeing. Proc. Nutr. Soc. 2017, 76, 425–426. [Google Scholar] [CrossRef] [Green Version]
- Marx, W.; Lane, M.; Hockey, M.; Aslam, H.; Berk, M.; Walder, K.; Borsini, A.; Firth, J.; Pariante, C.M.; Berding, K.; et al. Diet and depression: Exploring the biological mechanisms of action. Mol. Psychiatry 2021, 26, 134–150. [Google Scholar] [CrossRef] [PubMed]
- Lassale, C.; Batty, G.D.; Baghdadli, A.; Jacka, F.N.; Sánchez Villegas, A.; Kivimäki, M.; Akbaraly, T. Healthy dietary indices and risk of depressive outcomes: A systematic review and meta-analysis of observational studies. Mol. Psychiatry 2019, 24, 965–986. [Google Scholar] [CrossRef] [PubMed] [Green Version]
- Firth, J.; Veronese, N.; Cotter, J.; Shivappa, N.; Hebert, J.R.; Ee, C.; Smith, L.; Stubbs, B.; Jackson, S.E.; Sarris, J. What is the role of dietary inflammation in severe mental illness? A review of observational and experimental findings. Front. Psychiatry 2019, 10, 350. [Google Scholar] [CrossRef] [PubMed]
- Phillips, C.M.; Shivappa, N.; Hébert, J.R.; Perry, I.J. Dietary inflammatory index and mental health: A cross-sectional analysis of the relationship with depressive symptoms, anxiety and well-being in adults. Clin. Nutr. 2017, 37, 1485–1491. [Google Scholar] [CrossRef]
- Wirth, M.D.; Shivappa, N.; Burch, J.B.; Hurley, T.G.; Hébert, J.R. The dietary inflammatory index, shift work, and depression: Results from NHANES. Health Psychol. 2017, 36, 760–769. [Google Scholar] [CrossRef]
- Shivappa, N.; Hebert, J.R.; Neshatbini Tehrani, A.; Bayzai, B.; Naja, F.; Rashidkhani, B. A pro-inflammatory diet is associated with an increased odds of depression symptoms among Iranian female adolescents: A cross-sectional study. Front. Psychiatry 2018, 9, 400. [Google Scholar] [CrossRef]
- Shivappa, N.; Hébert, J.R.; Veronese, N.; Caruso, M.G.; Notarnicola, M.; Maggi, S.; Stubbs, B.; Firth, J.; Fornaro, M.; Solmi, M. The relationship between the Dietary Inflammatory Index (DII®) and incident depressive symptoms: A longitudinal cohort study. J. Affect. Disord. 2018, 235, 39–44. [Google Scholar] [CrossRef] [Green Version]
- Wang, J.; Zhou, Y.; Chen, K.; Jing, Y.; He, J.; Sun, H.; Hu, X. Dietary inflammatory index and depression: A meta-analysis. Public Health Nutr. 2018, 22, 1–7. [Google Scholar] [CrossRef]
- Tolkien, K.; Bradburn, S.; Murgatroyd, C. An anti-inflammatory diet as a potential intervention for depressive disorders: A systematic review and meta-analysis. Clin. Nutr. 2019, 38, 2045–2052. [Google Scholar] [CrossRef] [PubMed] [Green Version]
- Adjibade, M.; Andreeva, V.A.; Lemogne, C.; Touvier, M.; Shivappa, N.; Hébert, J.R.; Wirth, M.D.; Hercberg, S.; Galan, P.; Julia, C.; et al. The inflammatory potential of the diet is associated with depressive symptoms in different subgroups of the general population. J. Nutr. 2017, 147, 879–887. [Google Scholar] [CrossRef]
- Wickramasinghe, K.; Mathers, J.C.; Wopereis, S.; Marsman, D.S.; Griffiths, J.C. From lifespan to healthspan: The role of nutrition in healthy ageing. J. Nutr. Sci. 2020, 9, e33. [Google Scholar] [CrossRef]
- Gracia, A.; Albisu, L.M. Moving away from a typical Mediterranean diet: The case of Spain. Br. Food J. 1999, 101, 701–714. [Google Scholar] [CrossRef]
- Bondia Pons, I.; Mayneris Perxachs, J.; Serra Majem, L.; Castellote, A.I.; Mariné, A.; López Sabater, M.C. Diet quality of a population sample from coastal North-East Spain evaluated by a Mediterranean adaptation of the Diet Quality Index (DQI). Public Health Nutr. 2010, 13, 12–24. [Google Scholar] [CrossRef] [Green Version]
- Buckland, G.; Agudo, A.; Travier, N.; Huerta, J.M.; Cirera, L.; Tormo, M.-J.; Navarro, C.; Chirlaque, M.D.; Moreno-Iribas, C.; Ardanaz, E.; et al. Adherence to the Mediterranean diet reduces mortality in the Spanish cohort of the European Prospective Investigation into Cancer and Nutrition (EPIC-Spain). Br. J. Nutr. 2011, 106, 1581–1591. [Google Scholar] [CrossRef] [Green Version]
- Allman-Farinelli, M.; Partridge, S.R.; Roy, R. Weight-related dietary behaviors in young adults. Curr. Obes. Rep. 2016, 5, 23–29. [Google Scholar] [CrossRef]
- Noble, E.E.; Hsu, T.M.; Kanoski, S.E. Gut to brain dysbiosis: Mechanisms linking Western diet consumption, the microbiome, and cognitive impairment. Front. Behav. Neurosci. 2017, 11, 9. [Google Scholar] [CrossRef] [Green Version]
- Cook, N.R.; He, F.J.; MacGregor, G.A.; Graudal, N. Sodium and health-concordance and controversy. BMJ 2020, 369, m2440. [Google Scholar] [CrossRef]
- Adams, M.S. Gaps in the awareness of current nutrition issues as dependent on age. Nutr. Food. Sic. 2006, 36, 286–294. [Google Scholar] [CrossRef]
- Poddar, K.H.; Hosig, K.W.; Anderson-Bill, E.S.; Nickols-Richardson, S.; Duncan, S.E. Dairy intake and related self-regulation improved in college students using online nutrition education. J. Acad. Nutr. Diet. 2012, 112, 1976–1986. [Google Scholar] [CrossRef]
- Davies, L. Retirement courses: Should they include nutrition? J. R. Soc. Health 1990, 110, 20–22. [Google Scholar] [CrossRef]
- Eng, P.M.; Kawachi, I.; Fitzmaurice, G.; Rimm, E.B. Effects of marital transitions on changes in dietary and other health behaviours in US male health professionals. J. Epidemiol. Community Health 2005, 59, 56–62. [Google Scholar] [CrossRef] [Green Version]
- Lee, S.; Cho, E.; Grodstein, F.; Kawachi, I.; Hu, F.B.; Colditz, G.A. Effects of marital transitions on changes in dietary and other health behaviours in US women. Int. J. Epidemiol. 2005, 34, 69–78. [Google Scholar] [CrossRef] [PubMed] [Green Version]
- Lara, J.; Hobbs, N.; Moynihan, P.J.; Meyer, T.D.; Adamson, A.J.; Errington, L.; Rochester, L.; Sniehotta, F.F.; White, M.; Mathers, J.C. Effectiveness of dietary interventions among adults of retirement age: A systematic review and meta-analysis of randomized controlled trials. BMC Med. 2014, 12, 60. [Google Scholar] [CrossRef] [PubMed] [Green Version]
- Milte, C.M.; Thorpe, M.G.; Crawford, D.; Ball, K.; McNaughton, S.A. Associations of diet quality with health-related quality of life in older Australian men and women. Exp. Gerontol. 2015, 64, 8–16. [Google Scholar] [CrossRef] [Green Version]
- World Health Organization (WHO). European Food and Nutrition Action Plan 2015–2020. Available online: https://www.euro.who.int/__data/assets/pdf_file/0003/294474/European-Food-Nutrition-Action-Plan-20152020-en.pdf (accessed on 13 January 2021).
- Cena, H.; Calder, P.C. Defining a healthy diet: Evidence for the role of contemporary dietary patterns in health and disease. Nutrients 2020, 12, 334. [Google Scholar] [CrossRef] [Green Version]
- Molendijk, M.; Molero, P.; Ortuño Sánchez-Pedreño, F.; Van der Does, W.; Martínez González, M.A. Diet quality and depression risk: A systematic review and dose-response meta-analysis of prospective studies. J. Affect. Disord. 2018, 226, 346–354. [Google Scholar] [CrossRef] [Green Version]
- Childs, C.E. From the Mediterranean Diet to the microbiome. J. Nutr. 2018, 148, 819–820. [Google Scholar] [CrossRef]
- Edirappuli, S.D.; Venkatesh, A.; Zaman, R. The effect of nutrition on mental health: A focus on inflammatory mechanisms. Psychiatr. Danub. 2020, 32, 114–120. [Google Scholar]
- Jacka, F.N. Nutritional psychiatry: Where to next? EBioMedicine 2017, 17, 24–29. [Google Scholar] [CrossRef] [PubMed] [Green Version]
- Norte Navarro, A.; Ortiz Moncada, R. Spanish diet quality according to the healthy eating index. Nutr. Hosp. 2011, 26, 330–336. [Google Scholar] [CrossRef]
- Spanish Society of Community Nutrition (SSCN). Healthy Dietary Guidelines (2014). Available online: http://www.nutricioncomunitaria.org/es/otras-publicaciones (accessed on 30 December 2020).
- Ministerio de Sanidad Servicios Sociales e Igualdad, Instituto Nacional de Estadística. Encuesta Europea de Salud en España ENSE 2006; Ministerio de Sanidad, Servicios Sociales e Igualdad: Madrid, Spain, 2007; Available online: https://www.mscbs.gob.es/estadEstudios/estadisticas/encuestaNacional/encuesta2006.htm (accessed on 25 December 2020).
- Ministerio de Sanidad Servicios Sociales e Igualdad, Instituto Nacional de Estadística. Encuesta Nacional de Salud España ENSE 2011/12; Ministerio de Sanidad, Servicios Sociales e Igualdad: Madrid, Spain, 2013; Available online: https://www.mscbs.gob.es/estadEstudios/estadisticas/encuestaNacional/encuesta2011.htm (accessed on 25 December 2020).
- Ministerio de Sanidad Servicios Sociales e Igualdad, Instituto Nacional de Estadística. Encuesta Nacional de Salud España ENSE 2017; Ministerio de Sanidad, Servicios Sociales e Igualdad: Madrid, Spain, 2018; Available online: https://www.mscbs.gob.es/estadEstudios/estadisticas/encuestaNacional/encuesta2017.htm (accessed on 25 December 2020).
- National Institute of Statistics. National Health Survey 2006 (SNHS 2006): Methodology. Available online: https://www.ine.es/en/metodologia/t15/t153041906_en.pdf (accessed on 25 December 2020).
- National Institute of Statistics. National Health Survey 2011–2012 (SNHS 2011–2012): Methodology. Available online: https://www.ine.es/en/metodologia/t15/t153041912_en.pdf (accessed on 25 December 2020).
- National Institute of Statistics. National Health Survey 2017 (SNHS 2017): Methodology. Available online: https://www.ine.es/en/metodologia/t15/t153041917_en.pdf (accessed on 25 December 2020).
- Goldberg, D.P.; Hillier, V.F. A scaled version of the General Health Questionnaire. Psychol. Med. 1979, 9, 139–145. [Google Scholar] [CrossRef] [PubMed]
- Goldberg, D.P.; Williams, P. Cuestionario de Salud General GHQ: Guía Para el Usuario de las Distintas Versiones, 1st ed.; Masson: Barcelona, Spain, 1996. [Google Scholar]
- Sánchez López, M.P.; Dresch, V. The 12-Item General Health Questionnaire (GHQ-12): Reliability, external validity and factor structure in the Spanish population. Psicothema 2008, 20, 839–843. [Google Scholar]
- Goldberg, D.P.; Gater, R.; Sartorius, N.; Ustun, T.B.; Piccinelli, M.; Gureje, O.; Rutter, C. The validity of two versions of the GHQ in the WHO study of mental illness in general health care. Psychol. Med. 1997, 27, 191–197. [Google Scholar] [CrossRef]
- Arnett, J.J. Emerging adulthood: A theory of development from the late teens through the twenties. Am. Psychol. 2000, 55, 469–480. [Google Scholar] [CrossRef] [PubMed]
- Erikson, E.H. Identity: Youth, and Crisis; W. W. Norton & Company: New York, NY, USA, 1968. [Google Scholar]
- Domingo-Salvany, A.; Bacigalupe, A.; Carrasco, J.M.; Espelt, A.; Ferrando, J.; Borrell, C. Proposals for social class classification based on the Spanish National Classification of Occupations 2011 using neo-Weberian and neo-Marxist approaches. Gac. Sanit. 2011, 27, 263–272. [Google Scholar] [CrossRef] [Green Version]
- World Health Organization (WHO). Body Mass Index (BMI). Available online: http://www.euro.who.int/en/health-topics/disease-prevention/nutrition/a-healthy-lifestyle/body-mass-index-bmi (accessed on 31 December 2020).
- Partearroyo, T.; Samaniego-Vaesken, M.L.; Ruiz, E.; Aranceta-Bartrina, J.; Gil, Á.; González-Gross, M.; Ortega, R.M.; Serra-Majem, L.; Varela-Moreiras, G. Current food consumption amongst the Spanish ANIBES Study Population. Nutrients 2019, 11, 2663. [Google Scholar] [CrossRef] [Green Version]
- Report on Food Consumption in Spain. Available online: https://www.mapa.gob.es/eu/alimentacion/temas/consumo-tendencias/informeconsumoalimentacionenespana2017_prefinal_tcm35-456186.pdf (accessed on 11 April 2021).
- Kim, N.; Kim, G.-U.; Kim, H. Comparative study of dietary patterns by living arrangements: The Korea National Health and Nutrition Examination Survey (KNHANES) 2013–2015. Int. J. Environ. Res. Public Health 2020, 17, 2371. [Google Scholar] [CrossRef] [Green Version]
- Li, Y.; Lv, M.-R.; Wei, Y.J.; Sun, L.; Zhang, J.-X.; Zhang, H.-G.; Li, B. Dietary patterns and depression risk: A meta-analysis. Psychiatry Res. 2017, 253, 373–382. [Google Scholar] [CrossRef]
- Quirk, S.E.; Williams, L.J.; O’Neil, A.; Pasco, J.A.; Jacka, F.N.; Housden, S.; Berk, M.; Brennan, S.L. The association between diet quality, dietary patterns and depression in adults: A systematic review. BMC Psychiatry 2013, 13, 175. [Google Scholar] [CrossRef] [Green Version]
- Jacka, F.N.; Cherbuin, N.; Anstey, K.J.; Butterworth, P. Does reverse causality explain the relationship between diet and depression? J. Affect. Disord. 2015, 175, 248–250. [Google Scholar] [CrossRef]
- Davison, K.M.; Gondara, L.; Kaplan, B.J. Food insecurity, poor diet quality, and suboptimal intakes of folate and iron are independently associated with perceived mental health in Canadian adults. Nutrients 2017, 9, 274. [Google Scholar] [CrossRef] [PubMed] [Green Version]
- Gibson-Smith, D.; Bot, M.; Brouwer, I.A.; Visser, M.; Penninx, B.W. Diet quality in persons with and without depressive and anxiety disorders. J. Psychiatr. Res. 2018, 106, 1–7. [Google Scholar] [CrossRef]
- Godos, J.; Currenti, W.; Angelino, D.; Mena, P.; Castellano, S.; Caraci, F.; Galvano, F.; del Rio, D.; Ferri, R.; Grosso, G. Diet and mental health: Review of the recent updates on molecular mechanisms. Antioxidants 2020, 9, 346. [Google Scholar] [CrossRef] [PubMed] [Green Version]
- Oddy, W.H.; Allen, K.L.; Trapp, G.S.A.; Ambrosini, G.L.; Black, L.J.; Huang, R.-C.; Rzehak, P.; Runions, K.C.; Pan, F.; Beilin, L.J.; et al. Dietary patterns, body mass index and inflammation: Pathways to depression and mental health problems in adolescents. Brain Behav. Immun. 2018, 69, 428–439. [Google Scholar] [CrossRef] [PubMed] [Green Version]
- Inguglia, C.; Ingoglia, S.; Liga, F.; Lo Coco, A.; Lo Cricchio, M.G. Autonomy and relatedness in adolescence and emerging adulthood: Relationships with parental support and psychological distress. J. Adult Dev. 2015, 22, 1–13. [Google Scholar] [CrossRef]
- Verschueren, M.; Rassart, J.; Claes, L.; Moons, P.; Luyckx, K. Identity statuses throughout adolescence and emerging adulthood: A large-scale study into gender, age, and contextual differences. Psychol. Belg. 2017, 57, 32–42. [Google Scholar] [CrossRef] [PubMed] [Green Version]
- Pelletier, J.E.; Graham, D.J.; Laska, M.N. Social norms and dietary behaviors among young adults. Am. J. Health Behav. 2014, 38, 144–152. [Google Scholar] [CrossRef] [Green Version]
- Grech, A.; Sui, Z.; Siu, H.Y.; Zheng, M.; Allman-Farinelli, M.; Rangan, A. Socio-demographic determinants of diet quality in Australian adults using the validated Healthy Eating Index for Australian adults (HEIFA-2013). Healthcare 2017, 5, 7. [Google Scholar] [CrossRef] [Green Version]
- DeChristopher, L.R.; Uribarri, J.; Tucker, K.L. Intake of high-fructose corn syrup sweetened soft drinks, fruit drinks and apple juice is associated with prevalent arthritis in US adults, aged 20–30 years. Nutr. Diabetes 2016, 6, e199. [Google Scholar] [CrossRef] [Green Version]
- Al-Qahtani, M.H. Dietary habits of Saudi medical students at University of Dammam. Int. J. Health Sci. 2016, 10, 353–362. [Google Scholar] [CrossRef]
- Van Draanen, J.; Prelip, M.; Upchurch, D.M. Consumption of fast food, sugar-sweetened beverages, artificially-sweetened beverages and allostatic load among young adults. Prev. Med. Rep. 2017, 10, 212–217. [Google Scholar] [CrossRef] [PubMed]
- Aguirre, A.; Borneo, M.T.; El Khori, S.; Borneo, R. Exploring the understanding of the term “ultra-processed foods” by young consumers. Food Res. Int. 2019, 115, 535–540. [Google Scholar] [CrossRef]
- Fakhoury, M. Revisiting the serotonin hypothesis: Implications for major depressive disorders. Mol. Neurobiol. 2016, 53, 2778–2786. [Google Scholar] [CrossRef] [PubMed]
- Ashton, L.M.; Hutchesson, M.J.; Rollo, M.E.; Morgan, P.J.; Thompson, D.I.; Collins, C.E. Young adult males’ motivators and perceived barriers towards eating healthily and being active: A qualitative study. Int. J. Behav. Nutr. Phys. Act. 2015, 12, 93. [Google Scholar] [CrossRef] [PubMed] [Green Version]
- Ashton, L.M.; Hutchesson, M.J.; Rollo, M.E.; Morgan, P.J.; Collins, C.E. Motivators and barriers to engaging in healthy eating and physical activity: A cross-sectional survey in young adult men. Am. J. Men’s Health 2017, 330–343. [Google Scholar] [CrossRef] [PubMed]
- Munt, A.E.; Partridge, S.R.; Allman-Farinelli, M. The barriers and enablers of healthy eating among young adults: A missing piece of the obesity puzzle: A scoping review. Obes. Rev. 2017, 18, 1–17. [Google Scholar] [CrossRef]
- Steptoe, A.; Perkins-Porras, L.; Hilton, S.; Rink, E.; Cappuccio, F.P. Quality of life and self-rated health in relation to changes in fruit and vegetable intake and in plasma vitamins C and E in a randomised trial of behavioural and nutritional education counselling. Br. J. Nutr. 2004, 92, 177–184. [Google Scholar] [CrossRef] [Green Version]
- Carr, A.C.; Bozonet, S.M.; Pullar, J.M.; Vissers, M.C.M. Mood improvement in young adult males following supplementation with gold kiwifruit, a high-vitamin C food. J. Nutr. Sci. 2014, 2, e24. [Google Scholar] [CrossRef] [Green Version]
- Smith, A.P.; Rogers, R. Positive effects of a healthy snack (fruit) versus an unhealthy snack (chocolate/crisps) on subjective reports of mental and physical health: A preliminary intervention study. Front. Nutr. 2014, 1, 10. [Google Scholar] [CrossRef] [Green Version]
- Conner, T.S.; Brookie, K.L.; Carr, A.C.; Mainvil, L.A.; Vissers, M.C.M. Let them eat fruit! The effect of fruit and vegetable consumption on psychological well-being in young adults: A randomized controlled trial. PLoS ONE 2017, 12, e0171206. [Google Scholar] [CrossRef] [Green Version]
- Mujcic, R.; Oswald, A.J. Evolution of well-being and happiness after increases in consumption of fruit and vegetables. Am. J. Public Health 2016, 106, 1504–1510. [Google Scholar] [CrossRef] [PubMed]
- Yu, Z.M.; Parker, L.; Dummer, T.J.B. Depressive symptoms, diet quality, physical activity, and body composition among populations in Nova Scotia, Canada: Report from the Atlantic Partnership for Tomorrow’s Health. Prev. Med. 2014, 61, 106–113. [Google Scholar] [CrossRef] [PubMed]
- Elstgeest, L.E.M.; Winkens, L.H.H.; Penninx, B.W.J.H.; Brouwer, I.A.; Visser, M. Associations of depressive symptoms and history with three a priori diet quality indices in middle-aged and older adults. J. Affect. Disord. 2019, 249, 394–403. [Google Scholar] [CrossRef] [PubMed]
- Conklin, A.I.; Forouhi, N.G.; Surtees, P.; Khaw, K.-T.; Wareham, N.J.; Monsivais, P. Social relationships and healthful dietary behaviour: Evidence from over-50s in the EPIC cohort, UK. Soc. Sci. Med. 2014, 100, 167–175. [Google Scholar] [CrossRef] [PubMed] [Green Version]
- Haghighatdoost, F.; Azadbakht, L.; Keshteli, A.H.; Feinle-Bisset, C.; Daghaghzadeh, H.; Afshar, H.; Feizi, A.; Esmaillzadeh, A.; Adibi, P. Glycemic index, glycemic load, and common psychological disorders. Am. J. Clin. Nutr. 2016, 103, 201–209. [Google Scholar] [CrossRef] [PubMed] [Green Version]
- Gröber, U.; Schmidt, J.; Kisters, K. Magnesium in prevention and therapy. Nutrients 2015, 7, 8199–8226. [Google Scholar] [CrossRef] [PubMed] [Green Version]
- Sánchez-Villegas, A.; Martínez-González, M.A.; Estruch, R.; Salas-Salvadó, J.; Corella, D.; Covas, M.I.; Arós, F.; Romaguera, D.; Gómez-Gracia, E.; Lapetra, J.; et al. Mediterranean dietary pattern and depression: The PREDIMED Randomized Trial. BMC Med. 2013, 11, 208. [Google Scholar] [CrossRef] [Green Version]
- Gregório, M.J.; Rodrigues, A.M.; Eusébio, M.; Sousa, R.D.; Dias, S.; André, B.; Grønning, K.; Coelho, P.S.; Mendes, J.M.; Graça, P.; et al. Dietary patterns characterized by high meat consumption are associated with other unhealthy life styles and depression symptoms. Front. Nutr. 2017, 4, 25. [Google Scholar] [CrossRef] [Green Version]
- Roos, E.; Prättälä, R.; Lahelma, E.; Kleemola, P.; Pietinen, P. Modern and healthy: Socioeconomic differences in the quality of diet. Eur. J. Clin. Nutr. 1996, 50, 753–760. [Google Scholar]
- Irala Estévez, J.D.; Groth, M.; Johansson, L.; Oltersdorf, U.; Prättälä, R.; Martínez González, M.A. A systematic review of socio-economic differences in food habits in Europe: Consumption of fruit and vegetables. Eur. J. Clin. Nutr. 2000, 54, 706–714. [Google Scholar] [CrossRef] [Green Version]
- Groth, M.V.; Fagt, S.; Brøndsted, L. Social determinants of dietary habits in Denmark. Eur. J. Clin. Nutr. 2001, 55, 959–966. [Google Scholar] [CrossRef] [PubMed]
- Backholer, K.; Spencer, E.; Gearon, E.; Magliano, D.J.; McNaughton, S.A.; Shaw, J.E.; Peeters, A. The association between socio-economic position and diet quality in Australian adults. Public Health Nutr. 2016, 19, 477–485. [Google Scholar] [CrossRef] [Green Version]
- Deroover, K.; Bucher, T.; Vandelanotte, C.; de Vries, H.; Duncan, M.J. Practical nutrition knowledge mediates the relationship between sociodemographic characteristics and diet quality in adults: A cross-sectional analysis. Am. J. Health Promot. 2020, 34, 59–62. [Google Scholar] [CrossRef] [PubMed]
- Yau, A.; Adams, J.; White, M.; Nicolaou, M. Differences in diet quality and socioeconomic patterning of diet quality across ethnic groups: Cross-sectional data from the HELIUS Dietary Patterns study. Eur. J. Clin. Nutr. 2020, 74, 387–396. [Google Scholar] [CrossRef] [PubMed] [Green Version]
- Barnaba, L.; Intorre, F.; Azzini, E.; Ciarapica, D.; Venneria, E.; Foddai, M.S.; Maiani, F.; Raguzzini, A.; Polito, A. Evaluation of adherence to Mediterranean diet and association with clinical and biological markers in an Italian population. Nutrition 2020, 77, 110813. [Google Scholar] [CrossRef]
- Sánchez Ojeda, M.A.; Luna Bertos, E.D. Hábitos de vida saludable en la población universitaria. Nutr. Hosp. 2015, 31, 1910–1919. [Google Scholar] [CrossRef]
- Deliens, T.; Verhoeven, H.; de Bourdeaudhuij, I.; Huybrechts, I.; Mullie, P.; Clarys, P.; Deforche, B. Factors associated with fruit and vegetable and total fat intake in university students: A cross-sectional explanatory study. Nutr. Diet. 2018, 75, 151–158. [Google Scholar] [CrossRef] [PubMed]
- Dallongeville, J.; Marécaux, N.; Cottel, D.; Bingham, A.; Amouyel, P. Association between nutrition knowledge and nutritional intake in middle-aged men from Northern France. Public Health Nutr. 2001, 4, 27–33. [Google Scholar] [CrossRef] [PubMed] [Green Version]
- Turrell, G.; Kavanagh, A.M. Socio-economic pathways to diet: Modelling the association between socio-economic position and food purchasing behaviour. Public Health Nutr. 2006, 9, 375–383. [Google Scholar] [CrossRef] [Green Version]
- Hupkens, C.L.H.; Knibbe, R.A.; Drop, M.J. Social class differences in food consumption: The explanatory value of permissiveness and health and cost considerations. Eur. J. Public Health 2005, 10, 108–113. [Google Scholar] [CrossRef] [Green Version]
- Ball, K.; Crawford, D.; Mishra, G. Socio-economic inequalities in women’s fruit and vegetable intakes: A multilevel study of individual, social and environmental mediators. Public Health Nutr. 2006, 9, 623–630. [Google Scholar] [CrossRef] [Green Version]
- Lê, J.; Dallongeville, J.; Wagner, A.; Arveiler, D.; Haas, B.; Cottel, D.; Simon, C.; Dauchet, L. Attitudes toward healthy eating: A mediator of the educational level–diet relationship. Eur. J. Clin. Nutr. 2013, 67, 808–814. [Google Scholar] [CrossRef] [Green Version]
- Ramón Arbués, E.; Martínez Abadía, B.; Granada López, J.M.; Echániz Serrano, E.; Pellicer García, B.; Juárez Vela, R.; Guerrero Portillo, S.; Sáez Guinoa, M. Conducta alimentaria y su relación con el estrés, la ansiedad, la depresión y el insomnio en estudiantes universitarios. Nutr. Hosp. 2019, 36, 1339–1345. [Google Scholar] [CrossRef] [Green Version]
- Tardivo, A.P.; Nahas Neto, J.; Nahas, E.A.P.; Maestra, N.; Rodrigues, M.A.H.; Orsatti, F.L. Association between healthy eating patterns and indicators of metabolic risk in postmenopausal women. Nutr. J. 2010, 9, 64. [Google Scholar] [CrossRef] [Green Version]
- Sundararajan, K.; Campbell, M.K.; Choi, Y.-H.; Sarma, S. The relationship between diet quality and adult obesity: Evidence from Canada. J. Am. Coll. Nutr. 2014, 33, 1–17. [Google Scholar] [CrossRef]
- Knaapila, A.J.; Sandell, M.A.; Vaarno, J.; Hoppu, U.; Puolimatka, T.; Kaljonen, A.; Lagström, H. Food neophobia associates with lower dietary quality and higher BMI in Finnish adults. Public Health Nutr. 2015, 18, 2161–2171. [Google Scholar] [CrossRef] [Green Version]
- Surrow, S.; Jessen-Winge, C.; Ilvig, P.M.; Reffstrup Christensen, J. The motivation and opportunities for weight loss related to the everyday life of people with obesity: A qualitative analysis within the DO:IT study. Scand. J. Occup. Ther. 2020, 1–9. [Google Scholar] [CrossRef]
- Gibson, E.L. Emotional influences on food choice: Sensory, physiological and psychological pathways. Physiol. Behav. 2006, 89, 53–61. [Google Scholar] [CrossRef]
- Gomes, A.P.; Gonçalves Soares, A.L.; Gonçalves, H. Low diet quality in older adults: A population-based study in southern Brazil. Cien. Saude Colet. 2016, 21, 3417–3428. [Google Scholar] [CrossRef] [Green Version]
- Yuan, Y.-Q.; Li, F.; Dong, R.-H.; Chen, J.-S.; He, G.-S.; Li, S.-G.; Chen, B. The development of a Chinese Healthy Eating Index and its application in the general population. Nutrients 2017, 9, 977. [Google Scholar] [CrossRef] [Green Version]
- Martínez Lacoba, R.; Pardo García, I.; Amo Saus, E.; Escribano Sotos, F. Socioeconomic, demographic and lifestyle-related factors associated with unhealthy diet: A cross-sectional study of university students. BMC Public Health 2018, 18, 1241. [Google Scholar] [CrossRef]
- Moli, G.K.; Mini, G.K. Correlates of overweight among adult women in Kerala: A study based on National Family Health Survey (NFHS-3). Anthropologist 2012, 14, 67–72. [Google Scholar] [CrossRef]
- Biddle, S.J.H.; Asare, M. Physical activity and mental health in children and adolescents: A review of reviews. Br. J. Sports Med. 2011, 45, 886–895. [Google Scholar] [CrossRef] [Green Version]
- Kwan, B.M.; Davis, K.J.; Dunn, A.L. Physical activity for the prevention of depression. In Physical Activity across the Lifespan: Prevention and Treatment for Health and Well-Being; Meyer, A.L., Gullotta, T.P., Eds.; Springer: New York, NY, USA, 2012. [Google Scholar]
- Jewett, R.; Sabiston, C.M.; Brunet, J.; O’Loughlin, E.K.; Scarapicchia, T.; O’Loughlin, J. School sport participation during adolescence and mental health in early adulthood. J. Adolesc. Health 2014, 55, 640–644. [Google Scholar] [CrossRef]
- Hinkley, T.; Teychenne, M.; Downing, K.L.; Ball, K.; Salmon, J.; Hesketh, K.D. Early childhood physical activity, sedentary behaviors and psychosocial well-being: A systematic review. Prev. Med. 2014, 62, 182–192. [Google Scholar] [CrossRef] [PubMed] [Green Version]
- Doré, I.; O’Loughlin, J.L.; Beauchamp, G.; Martineau, M.; Fournier, L. Volume and social context of physical activity in association with mental health, anxiety and depression among youth. Prev. Med. 2016, 91, 344–350. [Google Scholar] [CrossRef] [PubMed]
- Paradis, A.-M.; Pérusse, L.; Vohl, M.-C. Dietary patterns and associated lifestyles in individuals with and without familial history of obesity: A cross-sectional study. Int. J. Behav. Nutr. Phys. Act. 2006, 3, 38. [Google Scholar] [CrossRef] [Green Version]
- Zamora, D.; Gordon-Larsen, P.; Jacobs, D.R.; Popkin, B.M. Diet quality and weight gain among black and white young adults: The Coronary Artery Risk Development in Young Adults (CARDIA) Study (1985–2005). Am. J. Clin. Nutr. 2010, 92, 784–793. [Google Scholar] [CrossRef] [PubMed] [Green Version]
- Parveen, Z.; Ali, A.; Ali, T.M.; Hasnain, A. Association of dietary patterns with anthropometric, lifestyle and socio-economic factors among women of selected communities from Karachi, Pakistan. J. Pak. Med. Assoc. 2016, 66, 1249–1257. [Google Scholar]
- Hann, C.S.; Rock, C.L.; King, I.; Drewnowski, A. Validation of de Healthy Eating Index with use of plasma biomarkers in a clini-cal sample of women. Am. J. Clin. Nutr. 2001, 74, 479–486. [Google Scholar] [CrossRef] [PubMed]
- Weinstein, S.J.; Vogt, T.M.; Gerrior, S.A. Healthy Eating Index scores are associated with blood nutrient concentrations in the Third National Health and Nutrition Examination Survey. J. Am. Diet. Assoc. 2004, 104, 576–584. [Google Scholar] [CrossRef] [PubMed]
- Thiele, S.; Mensink, G.B.M.; Beitz, R. Determinants of diet quality. Public Health Nutr. 2003, 7, 29–37. [Google Scholar] [CrossRef] [Green Version]
- Gorski, M.T.; Roberto, C.A. Public health policies to encourage healthy eating habits: Recent perspectives. J. Healthc. Leadersh. 2015, 7, 81–90. [Google Scholar] [CrossRef] [Green Version]
- Menozzi, D.; Sogari, G.; Mora, C. Understanding and modelling vegetables consumption among young adults. LWT 2017, 85, 327–333. [Google Scholar] [CrossRef]
- García, A.L.; Reardon, R.; McDonald, M.; Vargas García, E.J. Community interventions to improve cooking skills and their effects on confidence and eating behaviour. Curr. Nutr. Rep. 2016, 5, 315–322. [Google Scholar] [CrossRef] [Green Version]
- Hutchinson, J.; Watt, J.F.; Strachan, E.K.; Cade, J.E. Evaluation of the effectiveness of the Ministry of Food cooking programme on self-reported food consumption and confidence with cooking. Public Health Nutr. 2016, 19, 3417–3427. [Google Scholar] [CrossRef] [Green Version]
- Bloom, I.; Lawrence, W.; Barker, M.; Baird, J.; Dennison, E.; Sayer, A.A.; Cooper, C.; Robinson, S. What influences diet quality in older people? A qualitative study among community-dwelling older adults from the Hertfordshire Cohort Study, UK. Public Health Nutr. 2017, 20, 2685–2693. [Google Scholar] [CrossRef] [Green Version]
Figure 1.
Frequency of food consumption according to age groups of participants with common mental disorders (n = 12,545) (SNHS 2006, SNHS 2011/2012 and SNHS 2017) ((A) for daily consumption, (B) for 1–2 a week, (C) for never or hardly ever).
Figure 1.
Frequency of food consumption according to age groups of participants with common mental disorders (n = 12,545) (SNHS 2006, SNHS 2011/2012 and SNHS 2017) ((A) for daily consumption, (B) for 1–2 a week, (C) for never or hardly ever).

Figure 2.
Frequency of food consumption according to age groups of participants without common mental disorders (n = 48,079) (SNHS 2006, SNHS 2011/2012 and SNHS 2017) ((A) for daily consumption, (B) for 1–2 a week, (C) for never or hardly ever).
Figure 2.
Frequency of food consumption according to age groups of participants without common mental disorders (n = 48,079) (SNHS 2006, SNHS 2011/2012 and SNHS 2017) ((A) for daily consumption, (B) for 1–2 a week, (C) for never or hardly ever).


Table 1.
Sociodemographic, lifestyle, and health-related characteristics of participants (n = 60,624) (SNHS 2006, SNHS 2011/12 and SNHS 2017).
Table 1.
Sociodemographic, lifestyle, and health-related characteristics of participants (n = 60,624) (SNHS 2006, SNHS 2011/12 and SNHS 2017).
| Variables | People without Common Mental Disorders n = 48,079 (%) | People with Common Mental Disorders n = 12,545 (%) |
|---|---|---|
| Gender | ||
| Female | 24,817 (75.12%) | 8219 (24.88%) |
| Male | 23,262 (84.32%) | 4326 (15.68%) |
| Age groups (years) | ||
| Emerging adults | 2881 (84.39%) | 533 (15.61%) |
| Young adults | 17,343 (82.06%) | 3791 (17.94%) |
| Middle-aged adults | 16,368 (78.58%) | 4463 (21.42%) |
| Older adults | 11,487 (75.35%) | 3758 (24.65%) |
| Marital status | ||
| Never-married | 12,441 (81.69%) | 2789 (18.31%) |
| Married | 28,453 (81.23%) | 6575 (18.77%) |
| Widowed | 4277 (67.71%) | 2040 (32.29%) |
| Separated/divorced | 2908 (71.82%) | 1141 (28.18%) |
| Social class | ||
| Classes I and II | 9909 (84.36%) | 1837 (15.64%) |
| Classes III and IV | 20,250 (79.85%) | 5111 (20.15%) |
| Classes V and VI | 17,920 (76.20%) | 5597 (23.80%) |
| Educational level | ||
| Without formal education | 4637 (69.15%) | 2069 (30.85%) |
| Completed primary studies | 10,608 (77.00%) | 3169 (23.00%) |
| Completed secondary studies or professional training | 23,695 (80.43%) | 5766 (19.57%) |
| University studies | 9139 (85.57%) | 1541 (14.43%) |
| Nationality | ||
| Spanish | 44,928 (79.27%) | 11,751 (20.73%) |
| Foreign | 3151 (79.87%) | 794 (20.13%) |
| Population of town/city | ||
| <10,000 inhabitants | 11,901 (80.52%) | 2879 (19.48%) |
| ≥10,000 inhabitants | 36,178 (78.92%) | 9666 (21.08%) |
| Body Mass Index | ||
| Underweight | 800 (77.07%) | 238 (22.93%) |
| Normal-weight | 20,875 (80.39%) | 5092 (19.61%) |
| Overweight | 18,371 (80.01%) | 4589 (19.99%) |
| Obese | 8033 (75.36%) | 2626 (24.64%) |
| Self-perceived health status | ||
| Very good | 9452 (92.64%) | 751 (7.36%) |
| Good | 26,519 (87.25%) | 3877 (12.75%) |
| Fair | 9934 (67.86%) | 4704 (32.14%) |
| Poor | 1832 (43.48%) | 2381 (56.52%) |
| Very poor | 342 (29.13%) | 832 (70.87%) |
| Current smokers | ||
| Yes | 12,903 (78.68%) | 3496 (21.32%) |
| No | 35,176 (79.54%) | 9049 (20.46%) |
| Alcohol consumption in the past twelve months | ||
| Yes | 20,943 (82.66%) | 4394 (17.34%) |
| No | 27,136 (76.90%) | 8151 (23.10%) |
| Physical exercise in main activity | ||
| Yes | 31,838 (81.75%) | 7108 (18.25%) |
| No | 16,241 (74.92%) | 5437 (25.08%) |
| Leisure-time physical activity | ||
| Yes | 30,527 (83.04%) | 6233 (16.96%) |
| No | 17,552 (73.55%) | 6312 (26.45%) |
Table 2.
Frequency of food consumption and diet quality according to mental status among adults from all three survey periods (n = 60,624) (SNHS 2006, SNHS 2011/2012 and SNHS 2017).
Table 2.
Frequency of food consumption and diet quality according to mental status among adults from all three survey periods (n = 60,624) (SNHS 2006, SNHS 2011/2012 and SNHS 2017).
| Variables | People without Common Mental Disorders n = 48,079 (%) | People with Common Mental Disorders n = 12,545 (%) | p-Value |
|---|---|---|---|
| Frequency of bread/grains consumption | |||
| Never or hardly ever | 859 (1.79%) | 329 (2.62%) | <0.001 |
| <1 a week | 663 (1.38%) | 248 (1.98%) | |
| 1–2 a week | 1575 (3.27%) | 440 (3.51%) | |
| ≥3 times a week, but not daily | 3044 (6.33%) | 816 (6.50%) | |
| Daily | 41,938 (87.23%) | 10,712 (85.39%) | |
| Frequency of vegetable consumption | |||
| Never or hardly ever | 582 (1.21%) | 227 (1.81%) | <0.001 |
| <1 a week | 1160 (2.41%) | 358 (2.85%) | |
| 1–2 a week | 6318 (13.14%) | 1714 (13.66%) | |
| ≥3 times a week, but not daily | 18,491 (38.46%) | 4335 (34.56%) | |
| Daily | 21,528 (44.78%) | 5911 (47.12%) | |
| Frequency of fruit consumption | |||
| Never or hardly ever | 1462 (3.04%) | 549 (4.38%) | <0.001 |
| <1 a week | 1434 (2.98%) | 463 (3.69%) | |
| 1–2 a week | 4140 (8.61%) | 1166 (9.29%) | |
| ≥3 times a week, but not daily | 8131 (16.91%) | 1883 (15.01%) | |
| Daily | 32,912 (68.46%) | 8484 (67.63%) | |
| Frequency of consumption of dairy products | |||
| Never or hardly ever | 1072 (2.23%) | 373 (2.97%) | <0.001 |
| <1 a week | 684 (1.42%) | 185 (1.48%) | |
| 1–2 a week | 1389 (2.89%) | 417 (3.32%) | |
| ≥3 times a week, but not daily | 3012 (6.26%) | 751 (5.99%) | |
| Daily | 41,922 (87.20%) | 10,819 (86.24%) | |
| Frequency of meat consumption | |||
| Never or hardly ever | 580 (1.21%) | 254 (2.03%) | <0.001 |
| <1 a week | 1107 (2.30%) | 483 (3.85%) | |
| 1–2 a week | 13,089 (27.22%) | 3942 (31.42%) | |
| ≥3 times a week, but not daily | 27,718 (57.65%) | 6496 (51.78%) | |
| Daily | 5585 (11.62%) | 1370 (10.92%) | |
| Frequency of consumption of legumes | |||
| Never or hardly ever | 1163 (2.42%) | 455 (3.63%) | <0.001 |
| <1 a week | 5200 (10.81%) | 1452 (11.57%) | |
| 1–2 a week | 29,361 (61.07%) | 7233 (57.66%) | |
| ≥3 times a week, but not daily | 11,515 (23.95%) | 3132 (24.97%) | |
| Daily | 840 (1.75%) | 273 (2.17%) | |
| Frequency of consumption of cold meats and cuts | |||
| Never or hardly ever | 6314 (13.13%) | 2387 (19.03%) | <0.001 |
| <1 a week | 8871 (18.45%) | 2612 (20.82%) | |
| 1–2 a week | 14,190 (29.52%) | 3515 (28.02%) | |
| ≥3 times a week, but not daily | 12,002 (24.96%) | 2480 (19.77%) | |
| Daily | 6702 (13.94%) | 1551 (12.36%) | |
| Frequency of consumption of sweets | |||
| Never or hardly ever | 8181 (17.01%) | 2626 (20.93%) | <0.001 |
| <1 a week | 7905 (16.44%) | 2094 (16.69%) | |
| 1–2 a week | 9663 (20.10%) | 2220 (17.70%) | |
| ≥3 times a week, but not daily | 7542 (15.69%) | 1699 (13.54%) | |
| Daily | 14,788 (30.76%) | 3906 (31.14%) | |
| Frequency of consumption of soft drinks with sugar | |||
| Never or hardly ever | 23,519 (48.92%) | 6945 (55.36%) | <0.001 |
| <1 a week | 8676 (18.05%) | 1894 (15.10%) | |
| 1–2 a week | 6940 (14.43%) | 1387 (11.05%) | |
| ≥3 times a week, but not daily | 3832 (7.97%) | 883 (7.04%) | |
| Daily | 5112 (10.63%) | 1436 (11.45%) | |
| Diet quality | |||
| Poor diet quality | 1130 (2.35%) | 354 (2.82%) | <0.001 |
| Moderate diet quality | 30,878 (64.22%) | 7639 (60.89%) | |
| Good diet quality | 16,071 (33.43%) | 4552 (36.29%) |
Table 3.
Overall diet quality score and food groups’ scores according to mental status of participants (n = 60,624) (SNHS 2006, SNHS 2011/12 and SNHS 2017).
Table 3.
Overall diet quality score and food groups’ scores according to mental status of participants (n = 60,624) (SNHS 2006, SNHS 2011/12 and SNHS 2017).
| Variables | People without Common Mental Disorders (n = 48,079) M (SD) | People with Common Mental Disorders (n = 12,545) M (SD) | p-Value |
|---|---|---|---|
| Bread/grains consumption (points) | 9.40 (1.85) | 9.25 (2.11) | <0.001 |
| Vegetable consumption (points) | 8.08 (2.14) | 8.06 (2.28) | 0.34 |
| Fruit consumption (points) | 8.62 (2.45) | 8.45 (2.70) | <0.001 |
| Consumption of dairy products (points) | 9.37 (1.94) | 9.28 (2.12) | <0.001 |
| Meat consumption (points) | 7.45 (2.33) | 7.49 (2.46) | 0.10 |
| Consumption of legumes (points) | 8.49 (2.31) | 8.27 (2.51) | <0.001 |
| Consumption of cold meats and cuts (points) | 5.11 (3.08) | 5.60 (3.17) | <0.001 |
| Consumption of sweets (points) | 4.53 (3.71) | 4.76 (3.85) | <0.001 |
| Consumption of soft drinks with sugar (points) | 7.29 (3.36) | 7.50 (3.44) | <0.001 |
| Overall diet quality (points) | 74.96 (10.86) | 75.27 (11.64) | <0.01 |
M = mean; SD = standard deviation.
Table 4.
Frequency of consumption recommended by the Spanish Society of Community Nutrition according to age groups and mental status (n = 60,624) (SNHS 2006, SNHS 2011/12 and SNHS 2017).
Table 4.
Frequency of consumption recommended by the Spanish Society of Community Nutrition according to age groups and mental status (n = 60,624) (SNHS 2006, SNHS 2011/12 and SNHS 2017).
| Frequency of Consumption Recommended by the Spanish Society of Community Nutrition | Type of Food | Age Groups | People with Common Mental Disorders n = 12,545 (%) | People without Common Mental Disorders n = 48,079 (%) | p-Value |
|---|---|---|---|---|---|
| Daily consumption | Bread/grains | Emerging adults (18–24 years old) | 401 (3.74%) | 2384 (5.69%) | <0.001 |
| Young adults (25–44 years old) | 3113 (29.06%) | 14,683 (35.01%) | |||
| Middle-aged adults (45–64 years old) | 3879 (36.21%) | 14,477 (34.52%) | |||
| Older adults (≥65 years old) | 3319 (30.99%) | 10,394 (24.78%) | |||
| Vegetables | Emerging adults (18–24 years old) | 176 (2.98%) | 895 (3.92%) | <0.001 | |
| Young adults (25–44 years old) | 1652 (27.95%) | 6902 (32.06%) | |||
| Middle-aged adults (45–64 years old) | 2250 (38.06%) | 7913 (36.76%) | |||
| Older adults (≥65 years old) | 1833 (31.01%) | 5868 (27.26%) | |||
| Fruit | Emerging adults (18–24 years old) | 220 (2.59%) | 1287 (3.91%) | <0.001 | |
| Young adults (25–44 years old) | 2019 (23.80%) | 10,198 (30.99%) | |||
| Middle-aged adults (45–64 years old) | 3163 (37.28%) | 11,985 (36.41%) | |||
| Older adults (≥65 years old) | 3082 (36.33%) | 9442 (28.69%) | |||
| Dairy products | Emerging adults (18–24 years old) | 440 (4.06%) | 2453 (5.85%) | <0.001 | |
| Young adults (25–44 years old) | 3199 (29.57%) | 15,036 (35.87%) | |||
| Middle-aged adults (45–64 years old) | 3797 (35.10%) | 14,180 (33.82%) | |||
| Older adults (≥65 years old) | 3383 (31.27%) | 10,253 (24.46%) | |||
| 1–2 times a week | Meat | Emerging adults (18–24 years old) | 111 (2.82%) | 559 (4.27%) | <0.001 |
| Young adults (25–44 years old) | 869 (22.04%) | 3746 (28.62%) | |||
| Middle-aged adults (45–64 years old) | 1500 (38.05%) | 4714 (36.02%) | |||
| Older adults (≥65 years old) | 1462 (37.09%) | 4070 (31.09%) | |||
| Legumes | Emerging adults (18–24 years old) | 260 (3.59%) | 1685 (5.74%) | <0.001 | |
| Young adults (25–44 years old) | 2169 (29.99%) | 10,524 (35.84%) | |||
| Middle-aged adults (45–64 years old) | 2674 (36.97%) | 10,211 (34.78%) | |||
| Older adults (≥65 years old) | 2130 (29.45%) | 6941 (23.64%) | |||
| Never or hardly ever | Cold meats and cuts | Emerging adults (18–24 years old) | 60 (2.51%) | 235 (3.72%) | <0.001 |
| Young adults (25–44 years old) | 526 (22.04%) | 1812 (28.70%) | |||
| Middle-aged adults (45–64 years old) | 771 (32.30%) | 2049 (32.45%) | |||
| Older adults (≥65 years old) | 1030 (43.15%) | 2218 (35.13%) | |||
| Sweets | Emerging adults (18–24 years old) | 61 (2.32%) | 254 (3.11%) | <0.001 | |
| Young adults (25–44 years old) | 644 (24.52%) | 2318 (28.33%) | |||
| Middle-aged adults (45–64 years old) | 1007 (38.35%) | 3165 (38.69%) | |||
| Older adults (≥65 years old) | 914 (34.81%) | 2444 (29.87%) | |||
| Soft drinks with sugar | Emerging adults (18–24 years old) | 123 (1.77%) | 517 (2.20%) | <0.001 | |
| Young adults(25–44 years old) | 1384 (19.93%) | 5904 (25.10%) | |||
| Middle-aged adults(45–64 years old) | 2604 (37.49%) | 9056 (38.51%) | |||
| Older adults(≥65 years old) | 2834 (40.81%) | 8042 (34.19%) | |||
| Diet Quality | Age Groups | People with Common Mental Disorders n = 12,545 (%) | People without Common Mental Disorders n = 48,079 (%) | p-Value | |
| Poor diet quality | Emerging adults (18–24 years old) | 71 (20.06%) | 299 (26.46%) | 0.04 | |
| Young adults (25–44 years old) | 206 (58.19%) | 636 (56.28%) | |||
| Middle-aged adults (45–64 years old) | 61 (17.23%) | 161 (14.25%) | |||
| Older adults (≥65 years old) | 16 (4.52%) | 34 (3.01%) | |||
| Moderate diet quality | Emerging adults (18–24 years old) | 416 (5.45%) | 2265 (7.34%) | <0.001 | |
| Young adults (25–44 years old) | 2768 (36.24%) | 13,019 (42.16%) | |||
| Middle-aged adults (45–64 years old) | 2637 (34.52%) | 10,032 (32.49%) | |||
| Older adults (≥65 years old) | 1818 (23.80%) | 5562 (18.01%) | |||
| Good diet quality | Emerging adults (18–24 years old) | 46 (1.01%) | 317 (1.97%) | <0.001 | |
| Young adults (25–44 years old) | 817 (17.95%) | 3688 (22.95%) | |||
| Middle-aged adults (45–64 years old) | 1765 (38.77%) | 6175 (38.42%) | |||
| Older adults (≥65 years old) | 1924 (42.27%) | 5891 (36.66%) | |||
Table 5.
Association between diet quality and sociodemographic, lifestyle and health-related factors in people with common mental disorders (n = 12,545) (SNHS 2006, SNHS 2011/2012 and SNHS 2017).
Table 5.
Association between diet quality and sociodemographic, lifestyle and health-related factors in people with common mental disorders (n = 12,545) (SNHS 2006, SNHS 2011/2012 and SNHS 2017).
| Variables | Participants with Common Mental Disorders (n = 12,545) | ||||
|---|---|---|---|---|---|
| Poor/Moderate Diet Quality (n = 7993) | |||||
| n (%) | OR (CI 95%) | p-Value | ORa (CI 95%) 1 | p-Value | |
| Gender | |||||
| Female | 3005 (37.60%) | 0.68 (0.63–0.73) | <0.001 | 0.70 (0.65–0.77) | <0.001 |
| Male | 4988 (62.40%) | Reference | Reference | ||
| Age groups (years) | |||||
| Emerging adults | 487 (6.09%) | 2.91 (2.13–3.97) | <0.001 | 2.44 (1.60–3.36) | <0.001 |
| Young adults | 2974 (37.21%) | Reference | Reference | ||
| Middle-aged adults | 2698 (33.75%) | 0.42 (0.38–0.46) | <0.001 | 0.46 (0.41–0.51) | <0.001 |
| Older adults | 1834 (22.95%) | 0.26 (0.24–0.29) | <0.001 | 0.31 (0.27–0.35) | <0.001 |
| Marital status | |||||
| Never-married | 2175 (27.21%) | 2.31 (2.08–2.56) | <0.001 | 1.35 (1.21–1.52) | <0.001 |
| Married | 3982 (49.82%) | Reference | Reference | ||
| Widowed | 1035 (12.95%) | 0.67 (0.61–0.74) | <0.001 | 1.09 (0.97–1.22) | 0.13 |
| Separated/divorced | 801 (10.02%) | 1.53 (1.34–1.76) | <0.001 | 1.36 (1.18–1.57) | <0.001 |
| Social class | |||||
| Classes I and II | 1144 (14.31%) | 0.91 (0.82–1.02) | 0.10 | ||
| Classes III and IV | 3246 (40.61%) | 0.96 (0.89–1.04) | 0.35 | ||
| Classes V and VI | 3603 (45.08%) | Reference | |||
| Educational level | |||||
| Without formal education | 1120 (14.01%) | 0.55 (0.49–0.61) | <0.001 | 1.24 (1.09–1.40) | <0.01 |
| Completed primary studies | 1901 (23.78%) | 0.70 (0.64–0.76) | <0.001 | 1.17 (1.06–1.29) | <0.01 |
| Completed secondary studies or professional training | 3939 (49.28%) | Reference | Reference | ||
| University studies | 1033 (12.93%) | 0.94 (0.84–1.06) | 0.34 | 0.91 (0.80–1.04) | 0.16 |
| Nationality | |||||
| Spanish | 7353 (91.99%) | Reference | Reference | ||
| Foreign | 640 (8.01%) | 2.49 (2.07–2.98) | <0.001 | 157 (1.30–1.90) | <0.001 |
| Population of town/city | |||||
| <10,000 inhabitants | 1794 (22.44%) | 0.93 (0.85–1.01) | 0.08 | ||
| ≥10,000 inhabitants | 6199 (77.56%) | Reference | |||
| Body Mass Index | |||||
| Underweight | 184 (2.30%) | 1.53 (1.12–2.08) | <0.01 | 1.29 (0.93–1.79) | 0.13 |
| Normal-weight | 3515 (43.98%) | Reference | Reference | ||
| Overweight | 2752 (34.43%) | 0.67 (0.62–0.73) | <0.001 | 0.83 (0.76–0.91) | <0.001 |
| Obese | 1542 (19.29%) | 0.64 (0.58–0.70) | <0.001 | 0.84 (0.76–0.94) | <0.01 |
| Self-perceived health status | |||||
| Very good | 532 (6.66%) | 1.50 (1.27–1.77) | <0.001 | ||
| Good | 2650 (33.15%) | 1.33 (1.22–1.46) | <0.001 | ||
| Fair | 2911 (36.42%) | Reference | |||
| Poor | 1391 (17.40%) | 0.87 (0.78–0.96) | <0.01 | ||
| Very poor | 509 (6.37%) | 0.97 (0.84–1.13) | 0.70 | ||
| Current smokers | |||||
| Yes | 2689 (33.64%) | 2.35 (2.15–2.57) | <0.001 | 1.59 (1.44–1.75) | <0.001 |
| No | 5304 (66.36%) | Reference | Reference | ||
| Alcohol consumption in the past twelve months | |||||
| Yes | 2925 (36.59%) | 1.21 (1.12–1.31) | <0.001 | ||
| No | 5068 (63.41%) | Reference | |||
| Physical exercise in main activity | |||||
| Yes | 4602 (57.58%) | Reference | |||
| No | 3391 (42.42%) | 0.90 (0.84–0.97) | <0.01 | ||
| Leisure-time physical activity | |||||
| Yes | 3863 (48.33%) | 0.86 (0.80–0.93) | <0.001 | 0.78 (0.72–0.84) | <0.001 |
| No | 4130 (51.67%) | Reference | Reference | ||
1 OR = odds ratio; ORa = odds ratio adjusted for all sociodemographic, lifestyle and health-related factors; CI 95% = confidence Interval; n = number of people with a poor or moderate diet quality; Hosmer–Lemeshow test χ2 = 12.22, p = 0.14; Nagelkerke’s R2: 0.14; p-value < 0.001.
Table 6.
Association between diet quality and sociodemographic, lifestyle and health-related factors in people without common mental disorders (n = 48,079) (SNHS 2006, SNHS 2011/2012 and SNHS 2017).
Table 6.
Association between diet quality and sociodemographic, lifestyle and health-related factors in people without common mental disorders (n = 48,079) (SNHS 2006, SNHS 2011/2012 and SNHS 2017).
| Variables | Participants without Common Mental Disorders (n = 48,079) | ||||
|---|---|---|---|---|---|
| Poor/Moderate Diet Quality (n = 32,008) | |||||
| n (%) | OR (CI 95%) | p-Value | ORa (CI 95%) 1 | p-Value | |
| Gender | |||||
| Female | 15,288 (47.76%) | 0.63 (0.60–0.65) | <0.001 | 0.62 (0.59–0.65) | <0.001 |
| Male | 16,720 (52.24%) | Reference | Reference | ||
| Age groups (years) | |||||
| Emerging adults | 2564 (8.01%) | 2.19 (1.93–2.47) | <0.001 | 1.77 (1.56–2.01) | <0.001 |
| Young adults | 13,655 (42.66%) | Reference | Reference | ||
| Middle-aged adults | 10,193 (31.85%) | 0.45 (0.43–0.47) | <0.001 | 0.48 (0.45–0.50) | <0.001 |
| Older adults | 5596 (17.48%) | 0.26 (0.24–0.27) | <0.001 | 0.29 (0.26–0.31) | <0.001 |
| Marital status | |||||
| Never-married | 9765 (30.51%) | 2.07 (1.97–2.18) | <0.001 | 1.31 (1024–1.38) | <0.001 |
| Married | 18,144 (56.68%) | Reference | Reference | ||
| Widowed | 2099 (6.56%) | 0.55 (0.51–0.58) | <0.001 | 1.06 (0.99–1.14) | 0.11 |
| Separated/divorced | 2000 (6.25%) | 1.25 (1.15–1.36) | <0.001 | 1.20 (1.10–1.31) | <0.001 |
| Social class | |||||
| Classes I and II | 6309 (19.71%) | 0.89 (0.84–0.93) | <0.001 | 0.89 (0.84–0.94) | <0.001 |
| Classes III and IV | 13,452 (42.03%) | Reference | Reference | ||
| Classes V and VI | 12,247 (38.26%) | 1.09 (1.05–1.14) | <0.001 | 1.08 (1.03–1.13) | <0.01 |
| Educational level | |||||
| Without formal education | 2543 (7.95%) | 0.49 (0.46–0.52) | <0.001 | 1.00 (0.93–1.08) | 0.99 |
| Completed primary studies | 6473 (20.22%) | 0.63 (0.60–0.66) | <0.001 | 1.02 (0.96–1.08) | 0.53 |
| Completed secondary studies or professional training | 16,933 (52.90%) | Reference | Reference | ||
| University studies | 6059 (18.93%) | 0.79 (0.75–0.83) | <0.001 | 0.90 (0.84–0.95) | <0.01 |
| Nationality | |||||
| Spanish | 29,539 (92.29%) | Reference | Reference | ||
| Foreign | 2469 (7.71%) | 1.89 (1.73–2.06) | <0.001 | 1.23 (1.12–1.34) | <0.001 |
| Population of town/city | |||||
| <10,000 inhabitants | 7933 (24,78%) | 1.01 (0.96–1.10) | 0.82 | ||
| ≥10,000 inhabitants | 24,075 (75.22%) | Reference | |||
| Body Mass Index | |||||
| Underweight | 632 (1.97%) | 1.69 (1.42–2.01) | <0.001 | 1.47 (1.23–1.77) | <0.001 |
| Normal-weight | 14,397 (44.98%) | Reference | Reference | ||
| Overweight | 11,894 (37.16%) | 0.83 (0.79–0.86) | <0.001 | 0.98 (0.93–1.02) | 0.55 |
| Obese | 5085 (15.89%) | 0.78 (0.74–0.82) | <0.001 | 0.98 (0.93–1.04) | 0.32 |
| Self-perceived health status | |||||
| Very good | 6876 (21.48%) | 1.27 (1.20–1.33) | <0.001 | 1.02 (0.96–1.07) | 0.61 |
| Good | 17,988 (56.20%) | Reference | Reference | ||
| Fair | 5910 (18.47%) | 0.70 (0.66–0.73) | <0.001 | 0.93 (0.88–0.98) | <0.01 |
| Poor | 1048 (3.27%) | 0.63 (0.58–0.70) | <0.001 | 0.91 (0.82–1.03) | 0.06 |
| Very poor | 186 (0.58%) | 0.57 (0.46–0.70) | <0.001 | 0.80 (0.64–0.99) | 0.04 |
| Current smokers | |||||
| Yes | 9952 (31.09%) | 2.01 (1.92–2.10) | <0.001 | 1.42 (1.36–1.50) | <0.001 |
| No | 22,056 (68.91%) | Reference | Reference | ||
| Alcohol consumption in the past twelve months | |||||
| Yes | 14,321 (44.74%) | 1.16 (1.11–1.20) | <0.001 | 1.04 (1.01–1.09) | 0.04 |
| No | 17,687 (55.26%) | Reference | Reference | ||
| Physical activity in main activity | |||||
| Physically active | 21,164 (66.12%) | Reference | |||
| Not physically active | 10,844 (33.88%) | 1.01 (0.97–1.06) | 0.52 | ||
| Leisure-time physical activity | |||||
| Yes | 19,381 (60.55%) | Reference | Reference | ||
| No | 12,627 (39.45%) | 1.47 (1.42–1.53) | <0.001 | 1.47 (1.40–1.53) | <0.001 |
1 OR = odds ratio; Ora = odds ratio adjusted for all sociodemographic, lifestyle and health-related factors; CI 95% = confidence interval; n = number of people with a poor or moderate diet quality; Hosmer–Lemeshow test χ2 = 19.53, p = 0.12; Nagelkerke’s R2: 0.14; p-value < 0.001.
Publisher’s Note: MDPI stays neutral with regard to jurisdictional claims in published maps and institutional affiliations. |
© 2021 by the authors. Licensee MDPI, Basel, Switzerland. This article is an open access article distributed under the terms and conditions of the Creative Commons Attribution (CC BY) license (https://creativecommons.org/licenses/by/4.0/).
Share and Cite
MDPI and ACS Style
Cebrino, J.; Portero de la Cruz, S. Diet Quality According to Mental Status and Associated Factors during Adulthood in Spain. Nutrients 2021, 13, 1727. https://0-doi-org.brum.beds.ac.uk/10.3390/nu13051727
AMA Style
Cebrino J, Portero de la Cruz S. Diet Quality According to Mental Status and Associated Factors during Adulthood in Spain. Nutrients. 2021; 13(5):1727. https://0-doi-org.brum.beds.ac.uk/10.3390/nu13051727
Chicago/Turabian StyleCebrino, Jesús, and Silvia Portero de la Cruz. 2021. "Diet Quality According to Mental Status and Associated Factors during Adulthood in Spain" Nutrients 13, no. 5: 1727. https://0-doi-org.brum.beds.ac.uk/10.3390/nu13051727
Note that from the first issue of 2016, this journal uses article numbers instead of page numbers. See further details here.