
Comparative Assessment of the Acute Effects of Whey, Rice and Potato Protein Isolate Intake on Markers of Glycaemic Regulation and Appetite in Healthy Males Using a Randomised Study Design

 ,
,
Abstract
:
1. Introduction
2. Materials and Methods
2.1. Participants
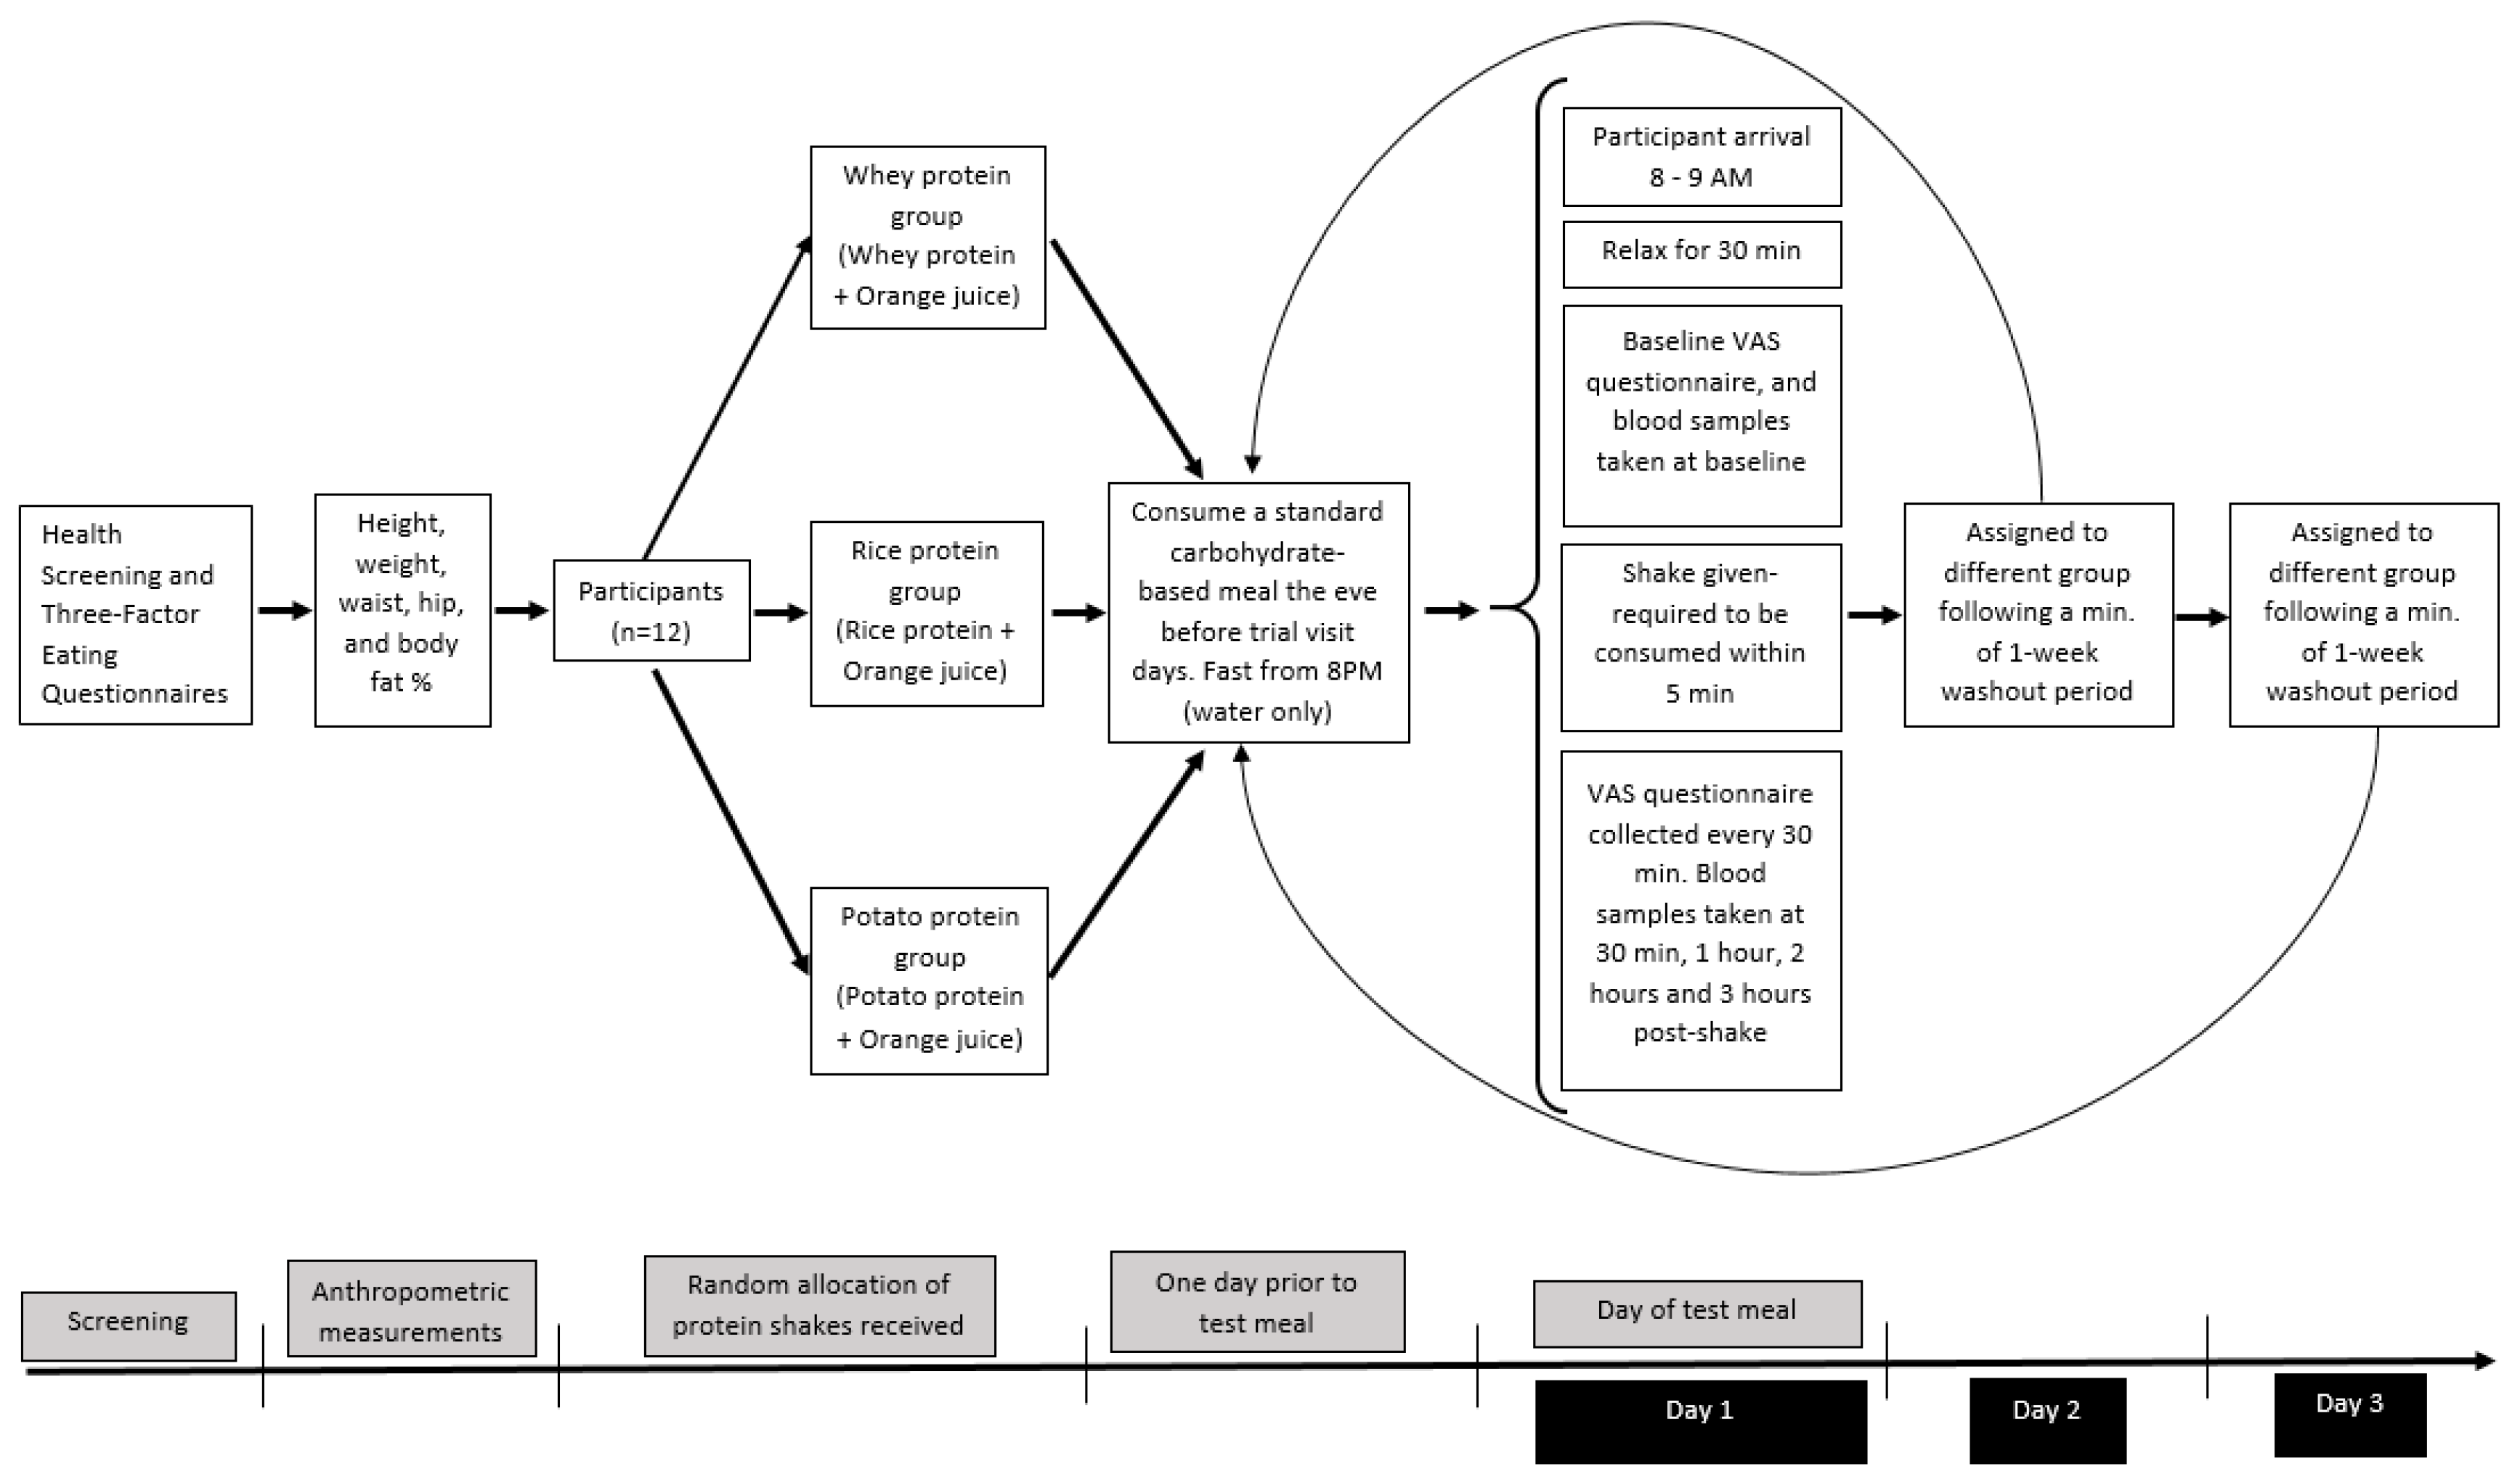
2.2. Study Design
2.3. Study Protocol
2.4. Protein Shake Intervention
2.5. Plasma Analysis
2.6. Satiety and Palatability
2.7. Statistical Analysis
3. Results
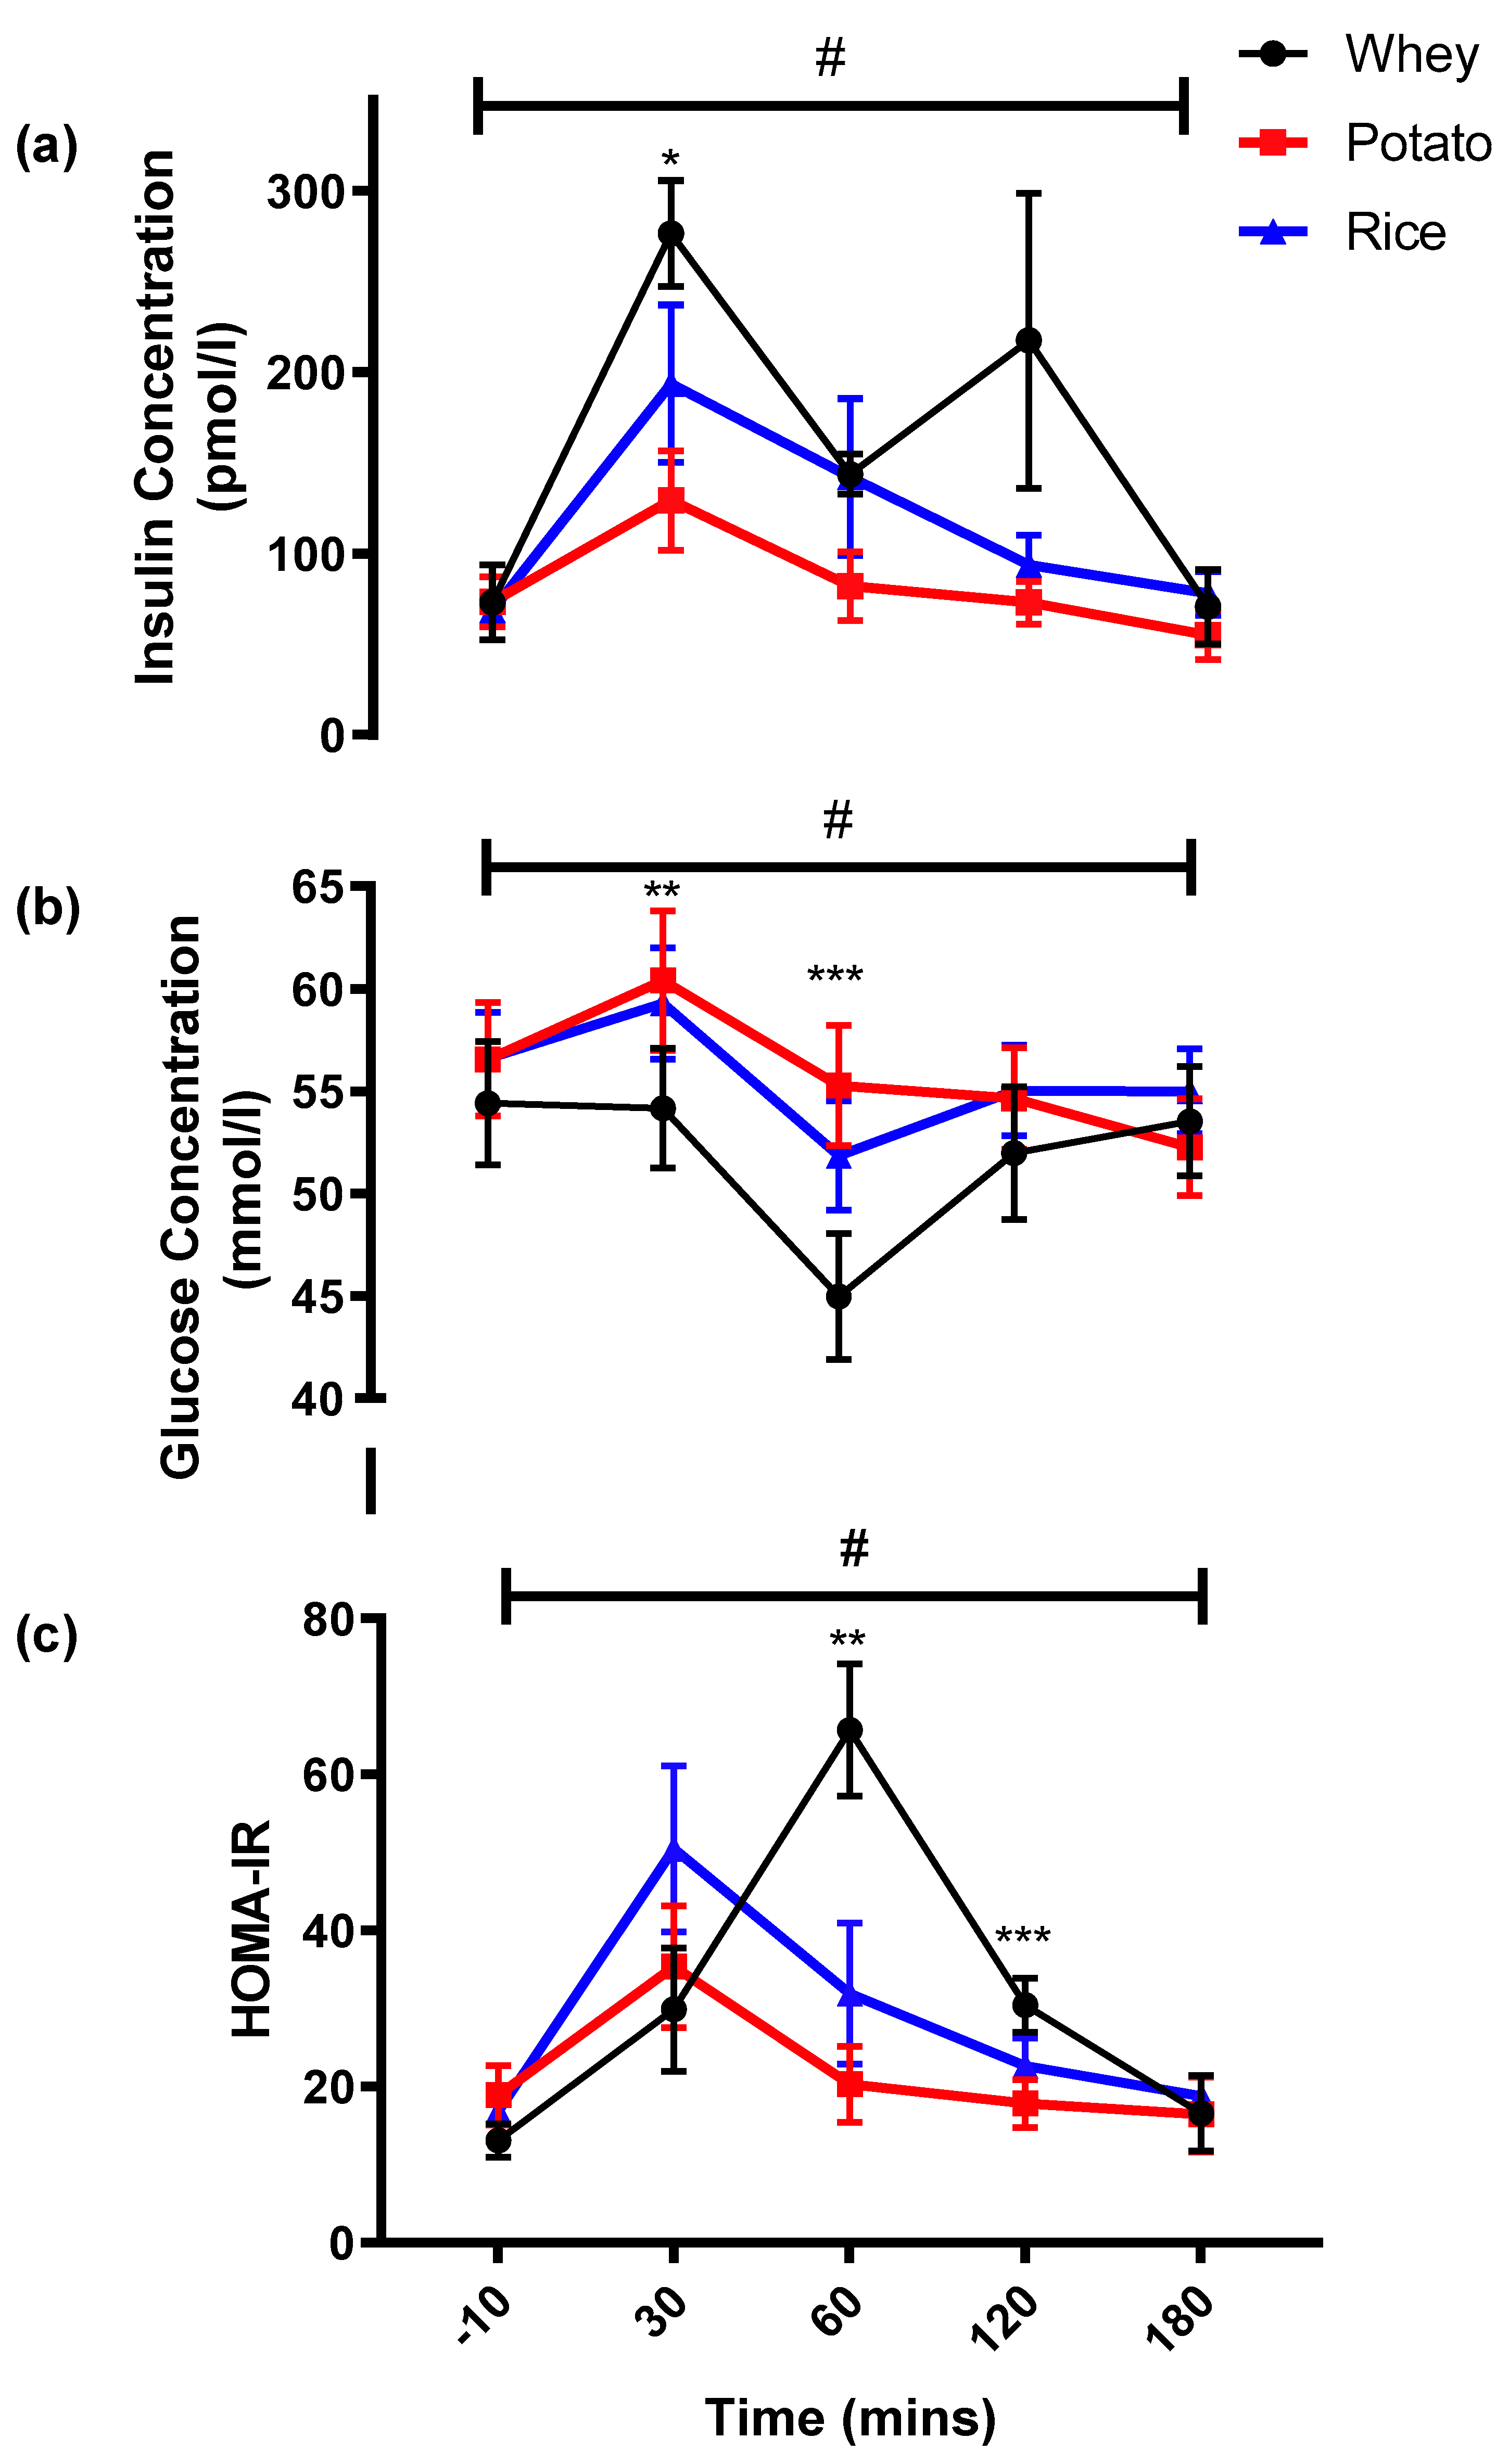
3.1. Glycemic and Insulinaemic Response
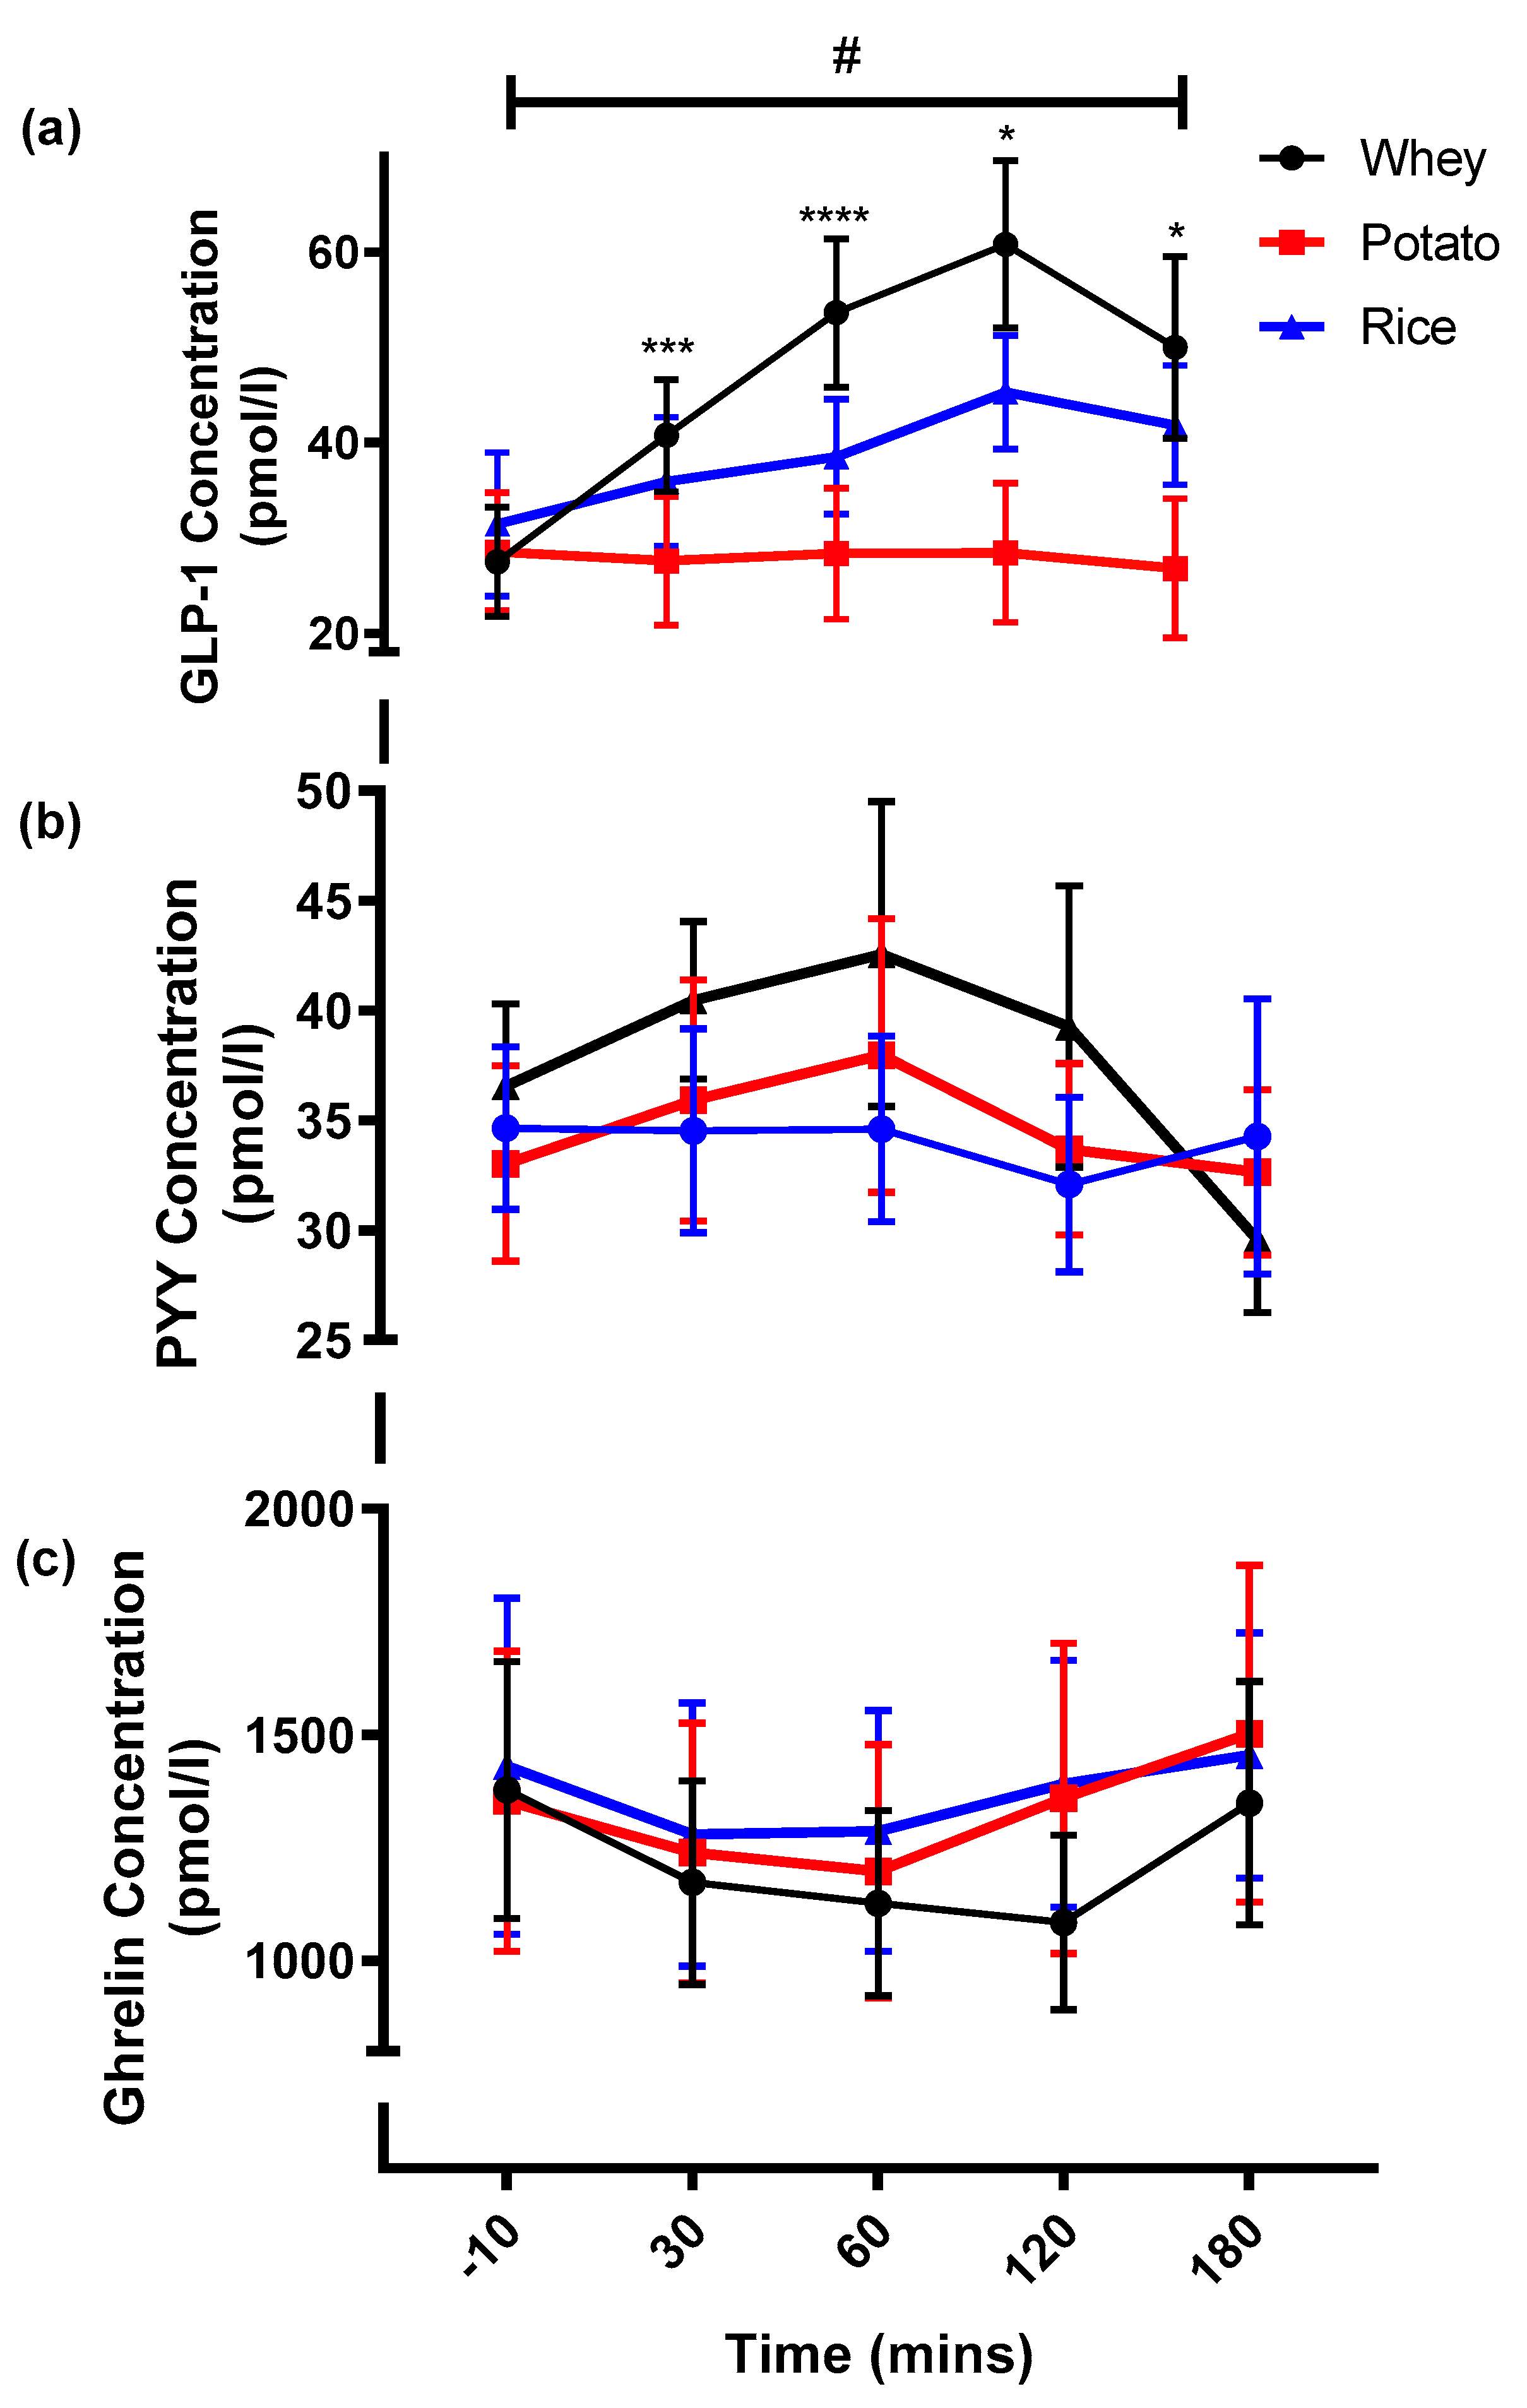
3.2. Appetite Related Hormones
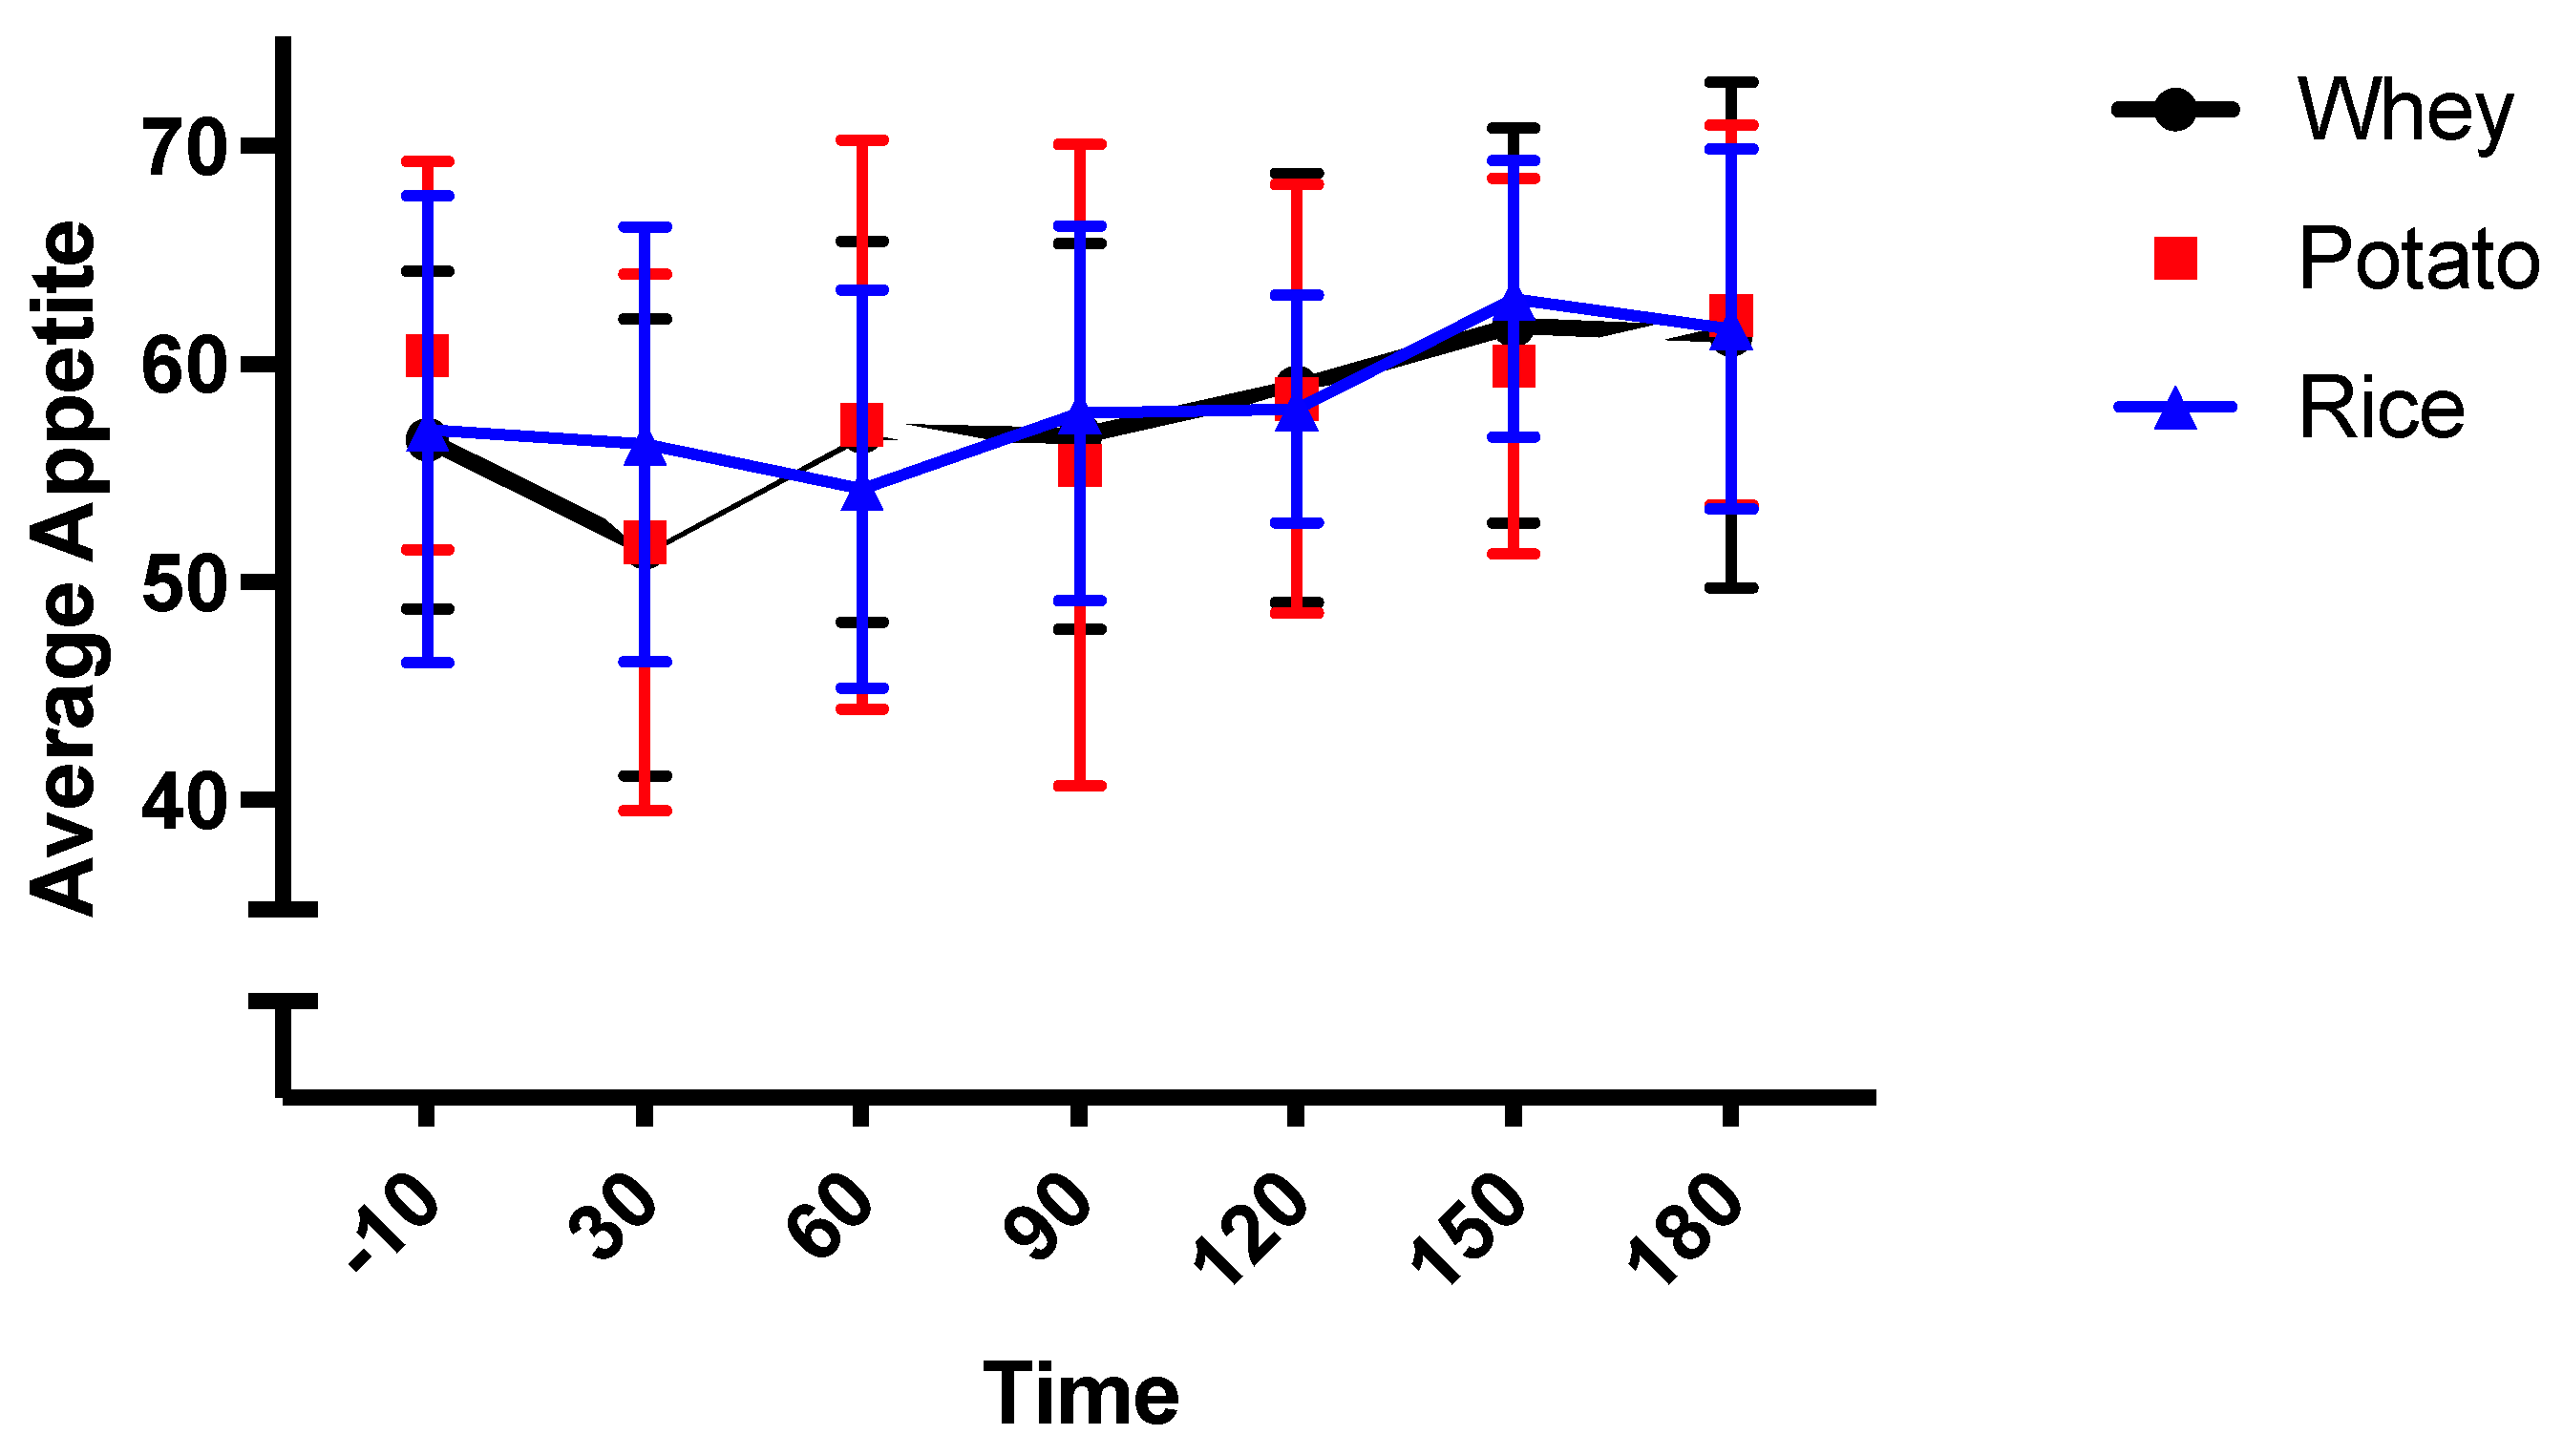
3.3. Palatability and Satiety
4. Discussion
5. Conclusions
Supplementary Materials
Author Contributions
Funding
Institutional Review Board Statement
Informed Consent Statement
Data Availability Statement
Acknowledgments
Conflicts of Interest
References
- Food and Agriculture Organization. World Agriculture: Towards 2015/2030: An FAO Perspective; FAO: Rome, Italy, 2003. [Google Scholar]
- Henchion, M.; Hayes, M.; Mullen, A.M.; Fenelon, M.; Tiwari, B. Future protein supply and demand: Strategies and factors influencing a sustainable equilibrium. Foods 2017, 6, 53. [Google Scholar] [CrossRef] [Green Version]
- Hertzler, S.R.; Lieblein-Boff, J.C.; Weiler, M.; Allgeier, C. Plant Proteins: Assessing Their Nutritional Quality and Effects on Health and Physical Function. Nutrients 2020, 12, 3704. [Google Scholar] [CrossRef] [PubMed]
- Houston, D.K.; Nicklas, B.J.; Ding, J.; Harris, T.B.; Tylavsky, F.A.; Newman, A.B.; Jung, S.L.; Sahyoun, N.R.; Visser, M.; Kritchevsky, S.B. Dietary protein intake is associated with lean mass change in older, community-dwelling adults: The Health, Aging, and Body Composition (Health ABC) study. Am. J. Clin. Nutr. 2008, 87, 150–155. [Google Scholar] [CrossRef] [PubMed] [Green Version]
- McLean, R.R.; Mangano, K.M.; Hannan, M.T.; Kiel, D.P.; Sahni, S. Dietary Protein Intake Is Protective Against Loss of Grip Strength Among Older Adults in the Framingham Offspring Cohort. J. Gerontol. Ser. A Biol. Sci. Med. Sci. 2016, 71, 356–361. [Google Scholar] [CrossRef] [Green Version]
- Mishra, S.; Goldman, J.D.; Sahyoun, N.R.; Moshfegh, A.J. Association between dietary protein intake and grip strength among adults aged 51 years and over: What We Eat in America, National Health and Nutrition Examination Survey 2011–2014. PLoS ONE 2018, 13, e0191368. [Google Scholar] [CrossRef] [PubMed] [Green Version]
- Mustafa, J.; Ellison, R.C.; Singer, M.R.; Bradlee, M.L.; Kalesan, B.; Holick, M.F.; Moore, L.L. Dietary Protein and Preservation of Physical Functioning among Middle-Aged and Older Adults in the Framingham Offspring Study. Am. J. Epidemiol. 2018, 187, 1411–1419. [Google Scholar] [CrossRef] [PubMed] [Green Version]
- de Castro, J.M. Macronutrient relationships with meal patterns and mood in the spontaneous feeding behavior of humans. Physiol. Behav. 1987, 39, 561–569. [Google Scholar] [CrossRef]
- Hill, A.J.; Blundell, J.E. Comparison of the Action of Macronutrients on the Expression of Appetite in Lean and Obese Human Subjects. Ann. N. Y. Acad. Sci. 1989, 575, 529–531. [Google Scholar] [CrossRef]
- Latner, J.D.; Schwartz, M. The effects of a high-carbohydrate, high-protein or balanced lunch upon later food intake and hunger ratings. Appetite 1999, 33, 119–128. [Google Scholar] [CrossRef] [Green Version]
- Paddon-Jones, D.; Westman, E.; Mattes, R.D.; Wolfe, R.R.; Astrup, A.; Westerterp-Plantenga, M. Protein, weight management, and satiety. Am. J. Clin. Nutr. 2008, 87, 1558S–1561S. [Google Scholar] [CrossRef] [Green Version]
- Hall, W.L.; Millward, D.J.; Long, S.J.; Morgan, L.M. Casein and whey exert different effects on plasma amino acid profiles, gastrointestinal hormone secretion and appetite. Br. J. Nutr. 2003, 89, 239–248. [Google Scholar] [CrossRef]
- De Graaf, C.; Blom, W.A.M.; Smeets, P.A.M.; Stafleu, A.; Hendriks, H.F.J. Biomarkers of satiation and satiety. Am. J. Clin. Nutr. 2004, 79, 946–961. [Google Scholar] [CrossRef] [PubMed] [Green Version]
- Karhunen, L.J.; Juvonen, K.R.; Huotari, A.; Purhonen, A.K.; Herzig, K.H. Effect of protein, fat, carbohydrate and fibre on gastrointestinal peptide release in humans. Regul. Pept. 2008, 149, 70–78. [Google Scholar] [CrossRef] [PubMed]
- Fromentin, G.; Darcel, N.; Chaumontet, C.; Marsset-Baglieri, A.; Nadkarni, N.; Tomé, D. Peripheral and central mechanisms involved in the control of food intake by dietary amino acids and proteins. Nutr. Res. Rev. 2012, 25, 29–39. [Google Scholar] [CrossRef] [Green Version]
- Pal, S.; Ellis, V. The acute effects of four protein meals on insulin, glucose, appetite and energy intake in lean men. Br. J. Nutr. 2010, 104, 1241–1248. [Google Scholar] [CrossRef]
- Górska-Warsewicz, H.; Laskowski, W.; Kulykovets, O.; Kudlińska-Chylak, A.; Czeczotko, M.; Rejman, K. Food products as sources of protein and amino acids—The case of Poland. Nutrients 2018, 10, 1977. [Google Scholar] [CrossRef] [PubMed] [Green Version]
- Moore, D.R.; Churchward-Venne, T.A.; Witard, O.; Breen, L.; Burd, N.A.; Tipton, K.D.; Phillips, S.M. Protein Ingestion to Stimulate Myofibrillar Protein Synthesis Requires Greater Relative Protein Intakes in Healthy Older Versus Younger Men. J. Gerontol. Ser. A Biol. Sci. Med. Sci. 2015, 70, 57–62. [Google Scholar] [CrossRef] [Green Version]
- Pal, S.; Radavelli-Bagatini, S.; Hagger, M.; Ellis, V. Comparative effects of whey and casein proteins on satiety in overweight and obese individuals: A randomized controlled trial. Eur. J. Clin. Nutr. 2014, 68, 980–986. [Google Scholar] [CrossRef] [PubMed] [Green Version]
- Alfenas, R.C.G.; Bressan, J.; de Paiva, A.C. Efeitos da qualidade proteica no apetite e metabolismo energético de indivíduos eutróficos. Arq. Bras. Endocrinol. Metabol. 2010, 54, 45–51. [Google Scholar] [CrossRef] [Green Version]
- Astbury, N.M.; Stevenson, E.J.; Morris, P.; Taylor, M.A.; MacDonald, I.A. Dose-response effect of a whey protein preload on within-day energy intake in lean subjects. Br. J. Nutr. 2010, 104, 1858–1867. [Google Scholar] [CrossRef] [Green Version]
- Veldhorst, M.A.B.; Westerterp-Plantenga, M.S.; Westerterp, K.R. Gluconeogenesis and energy expenditure after a high-protein, carbohydrate-free diet. Am. J. Clin. Nutr. 2009, 90, 519–526. [Google Scholar] [CrossRef] [Green Version]
- Patel, S. Emerging trends in nutraceutical applications of whey protein and its derivatives. J. Food Sci. Technol. 2015, 52, 6847–6858. [Google Scholar] [CrossRef] [PubMed] [Green Version]
- Medawar, E.; Huhn, S.; Villringer, A.; Veronica Witte, A. The effects of plant-based diets on the body and the brain: A systematic review. Transl. Psychiatry 2019, 9, 1–17. [Google Scholar] [CrossRef] [PubMed]
- Ahnen, R.T.; Jonnalagadda, S.S.; Slavin, J.L. Role of plant protein in nutrition, wellness, and health. Nutr. Rev. 2019, 77, 735–747. [Google Scholar] [CrossRef] [PubMed]
- Gorissen, S.H.M.; Crombag, J.J.R.; Senden, J.M.G.; Waterval, W.A.H.; Bierau, J.; Verdijk, L.B.; van Loon, L.J.C. Protein content and amino acid composition of commercially available plant-based protein isolates. Amino Acids 2018, 50, 1685–1695. [Google Scholar] [CrossRef] [PubMed] [Green Version]
- Levy, R.; Okun, Z.; Davidovich-Pinhas, M.; Shpigelman, A. Utilization of high-pressure homogenization of potato protein isolate for the production of dairy-free yogurt-like fermented product. Food Hydrocoll. 2021, 113, 106442. [Google Scholar] [CrossRef]
- Acheson, K.J.; Blondel-Lubrano, A.; Oguey-Araymon, S.; Beaumont, M.; Emady-Azar, S.; Ammon-Zufferey, C.; Monnard, I.; Pinaud, S.; Nielsen-Moennoz, C.; Bovetto, L. Protein choices targeting thermogenesis and metabolism. Am. J. Clin. Nutr. 2011, 93, 525–534. [Google Scholar] [CrossRef] [PubMed]
- Schaafsma, G. The protein digestibility-corrected amino acid score. J. Nutr. 2000, 130, 1865–1867. [Google Scholar] [CrossRef] [Green Version]
- Mathai, J.K.; Liu, Y.; Stein, H.H. Values for digestible indispensable amino acid scores (DIAAS) for some dairy and plant proteins may better describe protein quality than values calculated using the concept for protein digestibility-corrected amino acid scores (PDCAAS). Br. J. Nutr. 2017, 117, 490–499. [Google Scholar] [CrossRef]
- Newgard, C.B.; An, J.; Bain, J.R.; Muehlbauer, M.J.; Stevens, R.D.; Lien, L.F.; Haqq, A.M.; Shah, S.H.; Arlotto, M.; Slentz, C.A.; et al. A Branched-Chain Amino Acid-Related Metabolic Signature that Differentiates Obese and Lean Humans and Contributes to Insulin Resistance. Cell Metab. 2009, 9, 311–326. [Google Scholar] [CrossRef] [Green Version]
- Rigamonti, A.E.; Leoncini, R.; De Col, A.; Tamini, S.; Cicolini, S.; Abbruzzese, L.; Cella, S.G.; Sartorio, A. The Appetite−Suppressant and GLP-1-Stimulating Effects of Whey Proteins in Obese Subjects are Associated with Increased Circulating Levels of Specific Amino Acids. Nutrients 2020, 12, 775. [Google Scholar] [CrossRef] [PubMed] [Green Version]
- Melson, C.E.; Nepocatych, S.; Madzima, T.A. The effects of whey and soy liquid breakfast on appetite response, energy metabolism, and subsequent energy intake. Nutrition 2019, 61, 179–186. [Google Scholar] [CrossRef]
- Crowder, C.M.; Neumann, B.L.; Baum, J.I. Breakfast Protein Source Does Not Influence Postprandial Appetite Response and Food Intake in Normal Weight and Overweight Young Women. J. Nutr. Metab. 2016, 2016. [Google Scholar] [CrossRef] [PubMed] [Green Version]
- Hawley, A.L.; Gbur, E.; Tacinelli, A.M.; Walker, S.; Murphy, A.; Burgess, R.; Baum, J.I. The Short-Term Effect of Whey Compared with Pea Protein on Appetite, Food Intake, and Energy Expenditure in Young and Older Men. Curr. Dev. Nutr. 2020, 4. [Google Scholar] [CrossRef] [PubMed]
- Randomization.com. Available online: http://www.randomization.com (accessed on 11 May 2021).
- Flint, A.; Raben, A.; Blundell, J.E.; Astrup, A. Reproducibility, power and validity of visual analogue scales in assessment of appetite sensations in single test meal studies. Int. J. Obes. 2000, 24, 38–48. [Google Scholar] [CrossRef] [Green Version]
- Nepocatych, S.; Melson, C.E.; Madzima, T.A.; Balilionis, G. Comparison of the effects of a liquid breakfast meal with varying doses of plant-based soy protein on appetite profile, energy metabolism and intake. Appetite 2019, 141. [Google Scholar] [CrossRef]
- MacKenzie-Shalders, K.L.; Byrne, N.M.; Slater, G.J.; King, N.A. The effect of a whey protein supplement dose on satiety and food intake in resistance training athletes. Appetite 2015, 92, 178–184. [Google Scholar] [CrossRef]
- My Diabetes My Way. Available online: https://www.mydiabetesmyway.scot.nhs.uk/#gsc.tab=0 (accessed on 28 April 2021).
- Ohr, L.M. Proteins Pick Up the Pace. Food Technol. 2014, 68, 60–67. [Google Scholar]
- Kalman, D.S. Amino acid composition of an organic brown rice protein concentrate and isolate compared to soy and whey concentrates and isolates. Foods 2014, 3, 394–402. [Google Scholar] [CrossRef]
- Consultation, F.E. Dietary protein quality evaluation in human nutrition. Report of an FAQ Expert Consultation-PubMed. FAO Food Nutr. Pap. 2013, 92, 1–66. [Google Scholar]
- Lindquist, K.A.; Chow, K.; West, A.; Pyle, L.; Isbell, T.S.; Cree-Green, M.; Nadeau, K.J. The StatStrip Glucose Monitor Is Suitable for Use During Hyperinsulinemic Euglycemic Clamps in a Pediatric Population. Diabetes Technol. Ther. 2014, 16, 298–302. [Google Scholar] [CrossRef] [PubMed] [Green Version]
- Matthews, D.R.; Hosker, J.P.; Rudenski, A.S.; Naylor, B.A.; Treacher, D.F.; Turner, R.C. Homeostasis model assessment: Insulin resistance and β-cell function from fasting plasma glucose and insulin concentrations in man. Diabetologia 1985, 28, 412–419. [Google Scholar] [CrossRef] [PubMed] [Green Version]
- Zafar, T.A.; Waslien, C.; AlRaefaei, A.; Alrashidi, N.; AlMahmoud, E. Whey protein sweetened beverages reduce glycemic and appetite responses and food intake in young females. Nutr. Res. 2013, 33, 303–310. [Google Scholar] [CrossRef]
- Joy, J.M.; Lowery, R.P.; Wilson, J.M.; Purpura, M.; De Souza, E.O.; Wilson, S.M.; Kalman, D.S.; Dudeck, J.E.; Jäger, R. The effects of 8 weeks of whey or rice protein supplementation on body composition and exercise performance. Nutr. J. 2013, 12, 86. [Google Scholar] [CrossRef] [PubMed] [Green Version]
- He, T.; Spelbrink, R.E.J.; Witteman, B.J.; Giuseppin, M.L.F. Digestion kinetics of potato protein isolates in vitro and in vivo. Int. J. Food Sci. Nutr. 2013, 64, 787–793. [Google Scholar] [CrossRef]
- Tremblay, F.; Lavigne, C.; Jacques, H.; Marette, A. Role of dietary proteins and amino acids in the pathogenesis of insulin resistance. Annu. Rev. Nutr. 2007, 27, 293–310. [Google Scholar] [CrossRef] [PubMed]
- Gannon, M.C.; Nuttall, F.Q. Amino acid ingestion and glucose metabolism-A review. IUBMB Life 2010, 62, 660–668. [Google Scholar] [CrossRef]
- Calbet, J.A.L.; MacLean, D.A. Plasma glucagon and insulin responses depend on the rate of appearance of amino acids after ingestion of different protein solutions in humans. J. Nutr. 2002, 132, 2174–2182. [Google Scholar] [CrossRef] [Green Version]
- Nilsson, M.; Stenberg, M.; Frid, A.H.; Holst, J.J.; Björck, I.M.E. Glycemia and insulinemia in healthy subjects after lactose-equivalent meals of milk and other food proteins: The role of plasma amino acids and incretins. Am. J. Clin. Nutr. 2004, 80, 1246–1253. [Google Scholar] [CrossRef]
- Van Loon, L.J.C.; Saris, W.H.M.; Verhagen, H.; Wagenmakers, A.J.M. Plasma insulin responses after ingestion of different amino acid or protein mixtures with carbohydrate. Am. J. Clin. Nutr. 2000, 72, 96–105. [Google Scholar] [CrossRef] [Green Version]
- Nair, K.S.; Short, K.R. Hormonal and signaling role of branched-chain amino acids. J. Nutr. 2005, 135, 1547S–1552S. [Google Scholar] [CrossRef] [PubMed]
- Nilsson, M.; Holst, J.J.; Björck, I.M.E. Metabolic effects of amino acid mixtures and whey protein in healthy subjects: Studies using glucose-equivalent drinks. Am. J. Clin. Nutr. 2007, 85, 996–1004. [Google Scholar] [CrossRef] [Green Version]
- Nuttall, F.Q.; Gannon, M.C.; Wald, J.L.; Ahmed, M. Plasma glucose and insulin profiles in normal subjects ingesting diets of varying carbohydrate, fat, and protein content. J. Am. Coll. Nutr. 1982, 4, 437–450. [Google Scholar] [CrossRef]
- Reimann, F.; Ward, P.S.; Gribble, F.M. Signaling mechanisms underlying the release of glucagon-like peptide 1. Diabetes 2006, 55, S78–S85. [Google Scholar] [CrossRef] [Green Version]
- Theodorakis, M.J.; Carlson, O.; Michopoulos, S.; Doyle, M.E.; Juhaszova, M.; Petraki, K.; Egan, J.M. Human duodenal enteroendocrine cells: Source of both incretin peptides, GLP-1 and GIP. Am. J. Physiol. Endocrinol. Metab. 2006, 290. [Google Scholar] [CrossRef] [PubMed] [Green Version]
- Larsson, L.I.; Holst, J.; Håkanson, R.; Sundler, F. Distribution and properties of glucagon immunoreactivity in the digestive tract of various mammals: An immunohistochemical and immunochemical study. Histochemistry 1975, 44, 281–290. [Google Scholar] [CrossRef] [PubMed]
- Oikawa, S.Y.; Bahniwal, R.; Holloway, T.M.; Lim, C.; McLeod, J.C.; McGlory, C.; Baker, S.K.; Phillips, S.M. Potato Protein Isolate Stimulates Muscle Protein Synthesis at Rest and with Resistance Exercise in Young Women. Nutrients 2020, 12, 1235. [Google Scholar] [CrossRef]
- Blundell, J.; De Graaf, C.; Hulshof, T.; Jebb, S.; Livingstone, B.; Lluch, A.; Mela, D.; Salah, S.; Schuring, E.; Van Der Knaap, H.; et al. Appetite control: Methodological aspects of the evaluation of foods. Obes. Rev. 2010, 11, 251–270. [Google Scholar] [CrossRef] [Green Version]


| Protein Product | Product (g) in Shake | Protein (g) in Shake | Nutritional Composition of Orange Juice | Water (mL) | Total Energy Per Drink (Kcal) |
|---|---|---|---|---|---|
| Instantized BiPRO® (Whey Protein Isolate) | 50 | 45.5 | Volume: 207 mL Calories: 43.5 kcal Carbohydrates: 8.0 g Protein: 0.6 g | 43 | 233.5 |
| OryzateinTM 90 (Rice Protein Isolate) | 50 | 45.5 | Volume: 183 mL Calories: 43.5 kcal Carbohydrates: 7.1 g Protein: 0.5 g | 67 | 233.4 |
| Solanic®100 (Potato Protein Isolate) | 48 | 45.3 | Volume: 250 mL Calories: 52.4 kcal Carbohydrates: 9.8 g Protein: 0.75 g | 0 | 233.5 |
| Amino Acids (AA) | Whey Protein Isolate (%) | Rice Protein Concentrate (%) | Potato Protein Isolate (%) |
|---|---|---|---|
| Histidine * | 2.0 | 2.2 | 1.8 |
| Isoleucine *,+ | 5.6 | 4.2 | 5.9 |
| Leucine *,+ | 12.7 | 8.3 | 9.8 |
| Lysine * | 10.2 | 2.9 | 7.6 |
| Methionine * | 2.3 | 3.0 | 1.1 |
| Phenylalanine * | 3.5 | 5.6 | 7.0 |
| Threonine * | 4.7 | 3.7 | 4.7 |
| Tryptophan * | 2.9 | 1.5 | 1.5 |
| Valine *,+ | 5.4 | 5.6 | 8.6 |
| Arginine | 2.4 | 8.3 | 4.8 |
| Cysteine | 2.8 | 2.4 | 2.4 |
| Glutamic Acid/Glutamine | 16.1 | 17.9 | 7.9 |
| Glycine | 1.7 | 4.5 | 5.7 |
| Proline | 4.7 | 4.8 | 5.4 |
| Tyrosine | 3.6 | 5.6 | 5.4 |
| Alanine | 4.9 | 5.7 | 2.5 |
| Aspartic Acid/Asparagine | 11.4 | 8.9 | 13.1 |
| Serine | 3.3 | 5.1 | 4.8 |
| Total EAA | 49.3 | 37 | 48 |
| Total BCAA | 23.7 | 18.1 | 24.3 |
| Whey | Potato | Rice | Overall Significance | |
|---|---|---|---|---|
| Glucose | 2.16 ± 3.8 * | 14.01 ± 11.50 | 13.24 ± 12.3 | 0.013 |
| Insulin | 20,290.71 ± 14,222.9 # | 3293.2 ± 2179.5 | 9002.8 ± 9564.8 | <0.001 |
| GLP-1 | 4248.5 ± 1323.1 # | 325.1 ± 596.7 | 1646.4 ± 1289.1 | <0.001 |
| PYY | 511.7 ± 930.1 | 794.7 ± 923.8 | 905.4 ± 1076.9 | 0.697 |
| Ghrelin | 1433.9 ± 22268.8 | 4668.3 ± 5540.3 | 17,186.1 ± 24,893.6 | 0.130 |
| Whey | Potato | Rice | Overall Significance | |
|---|---|---|---|---|
| Smell | 27.9 ± 21.8 | 38.4 ± 30.4 | 36.7 ± 18.4 | 0.102 |
| Taste | 36.9 ± 26.6 | 52.3 ± 36.2 | 53.5 ± 22.0 | 0.173 |
| Aftertaste | 44.7 ± 32.7 | 56.6 ± 31.0 | 56.1 ± 31.0 | 0.06 |
| Visual appeal | 24.3 ± 23.0 * | 37.3 ± 29.6 | 42.6 ± 27.4 | 0.022 |
| Palatability | 33.7 ± 21.9 * | 54.1 ± 35.5 | 67.0 ± 27.7 | 0.009 |
Publisher’s Note: MDPI stays neutral with regard to jurisdictional claims in published maps and institutional affiliations. |
© 2021 by the authors. Licensee MDPI, Basel, Switzerland. This article is an open access article distributed under the terms and conditions of the Creative Commons Attribution (CC BY) license (https://creativecommons.org/licenses/by/4.0/).
Share and Cite
Tiekou Lorinczova, H.; Deb, S.; Begum, G.; Renshaw, D.; Zariwala, M.G. Comparative Assessment of the Acute Effects of Whey, Rice and Potato Protein Isolate Intake on Markers of Glycaemic Regulation and Appetite in Healthy Males Using a Randomised Study Design. Nutrients 2021, 13, 2157. https://0-doi-org.brum.beds.ac.uk/10.3390/nu13072157
Tiekou Lorinczova H, Deb S, Begum G, Renshaw D, Zariwala MG. Comparative Assessment of the Acute Effects of Whey, Rice and Potato Protein Isolate Intake on Markers of Glycaemic Regulation and Appetite in Healthy Males Using a Randomised Study Design. Nutrients. 2021; 13(7):2157. https://0-doi-org.brum.beds.ac.uk/10.3390/nu13072157
Chicago/Turabian StyleTiekou Lorinczova, Helena, Sanjoy Deb, Gulshanara Begum, Derek Renshaw, and Mohammed Gulrez Zariwala. 2021. "Comparative Assessment of the Acute Effects of Whey, Rice and Potato Protein Isolate Intake on Markers of Glycaemic Regulation and Appetite in Healthy Males Using a Randomised Study Design" Nutrients 13, no. 7: 2157. https://0-doi-org.brum.beds.ac.uk/10.3390/nu13072157