
Whey Protein Supplementation Improves the Glycemic Response and May Reduce Non-Alcoholic Fatty Liver Disease Related Biomarkers in Women with Polycystic Ovary Syndrome (PCOS)

 ,
, 
Abstract
:1. Introduction
2. Materials and Methods
2.1. Participants
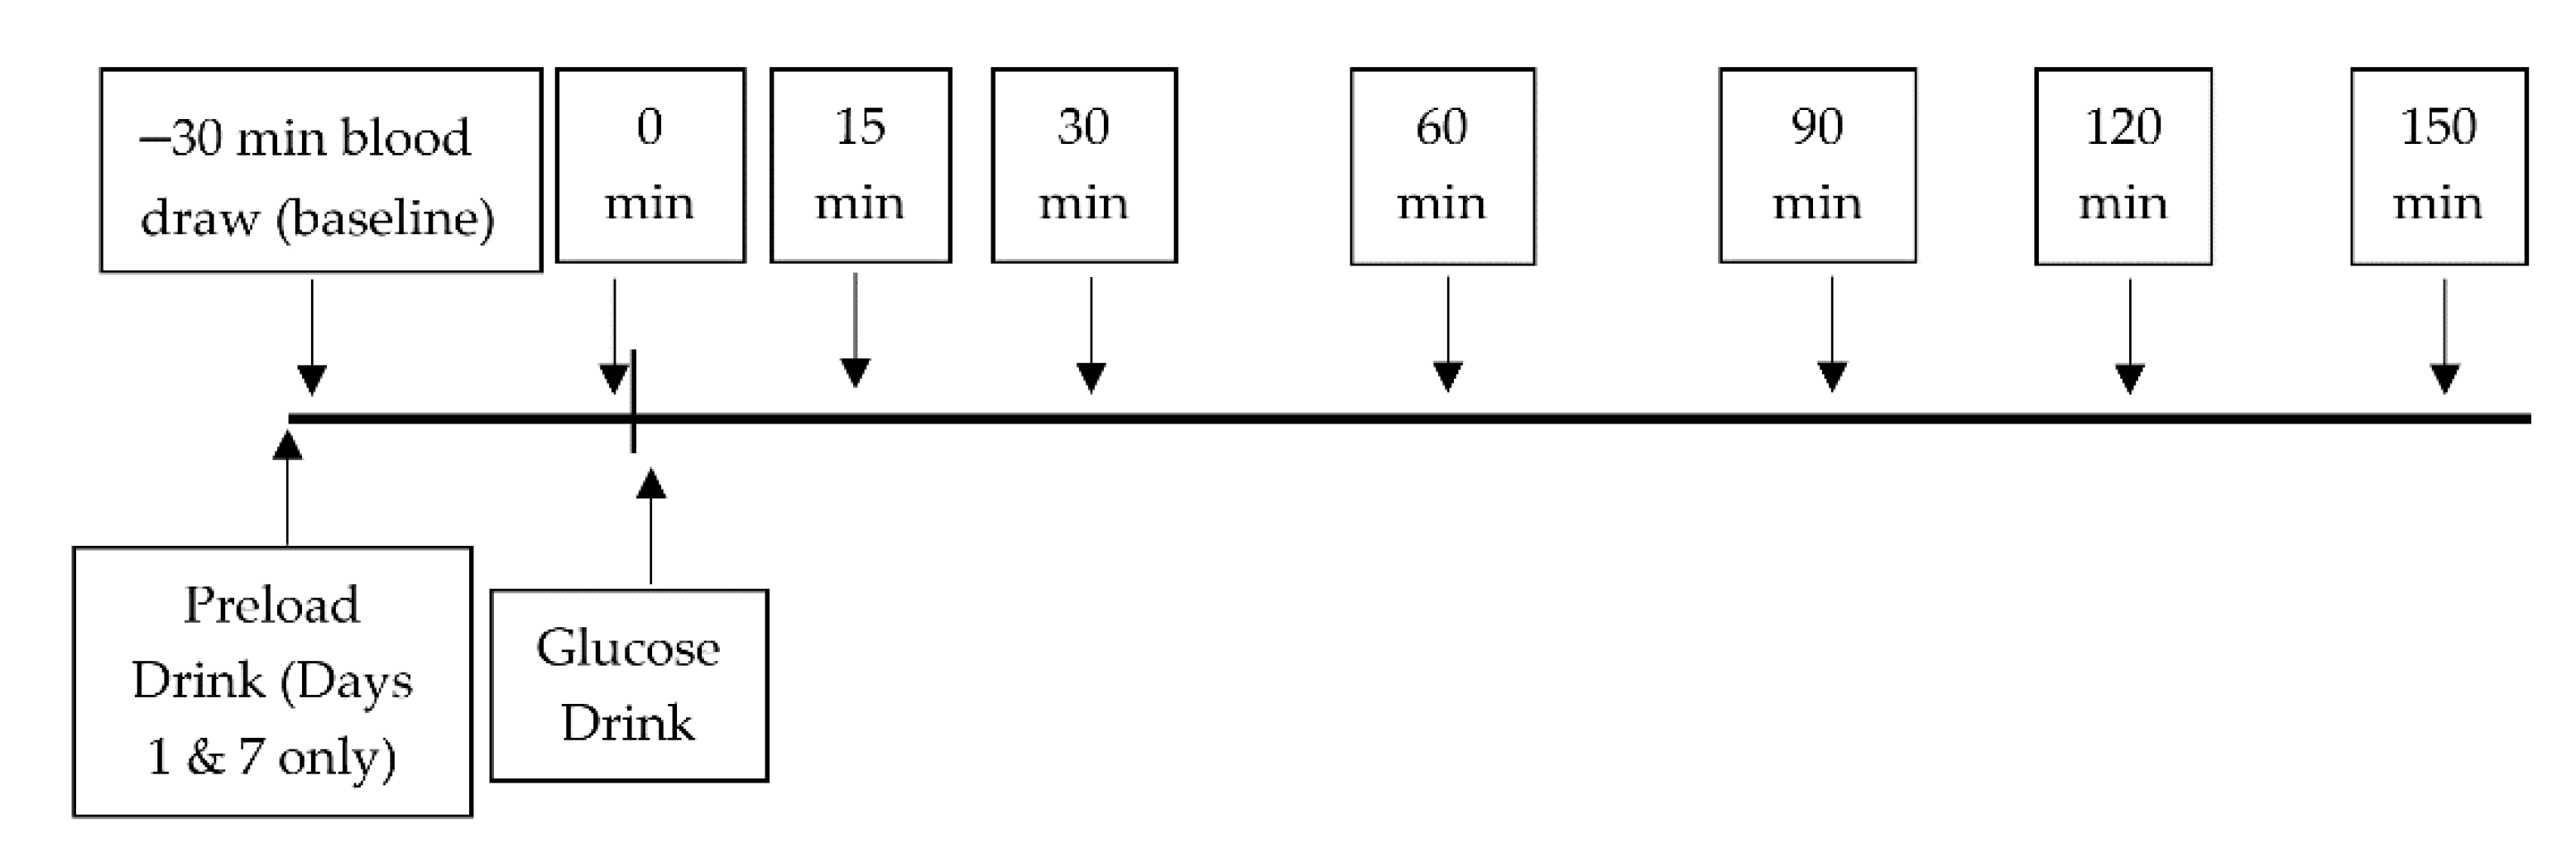
2.2. Study Design
2.3. Blood Sampling
2.4. Biochemical Analyses
2.5. HepG2 Lipid Accumulation
2.6. Calculations
2.7. Statistics
3. Results
3.1. Participants
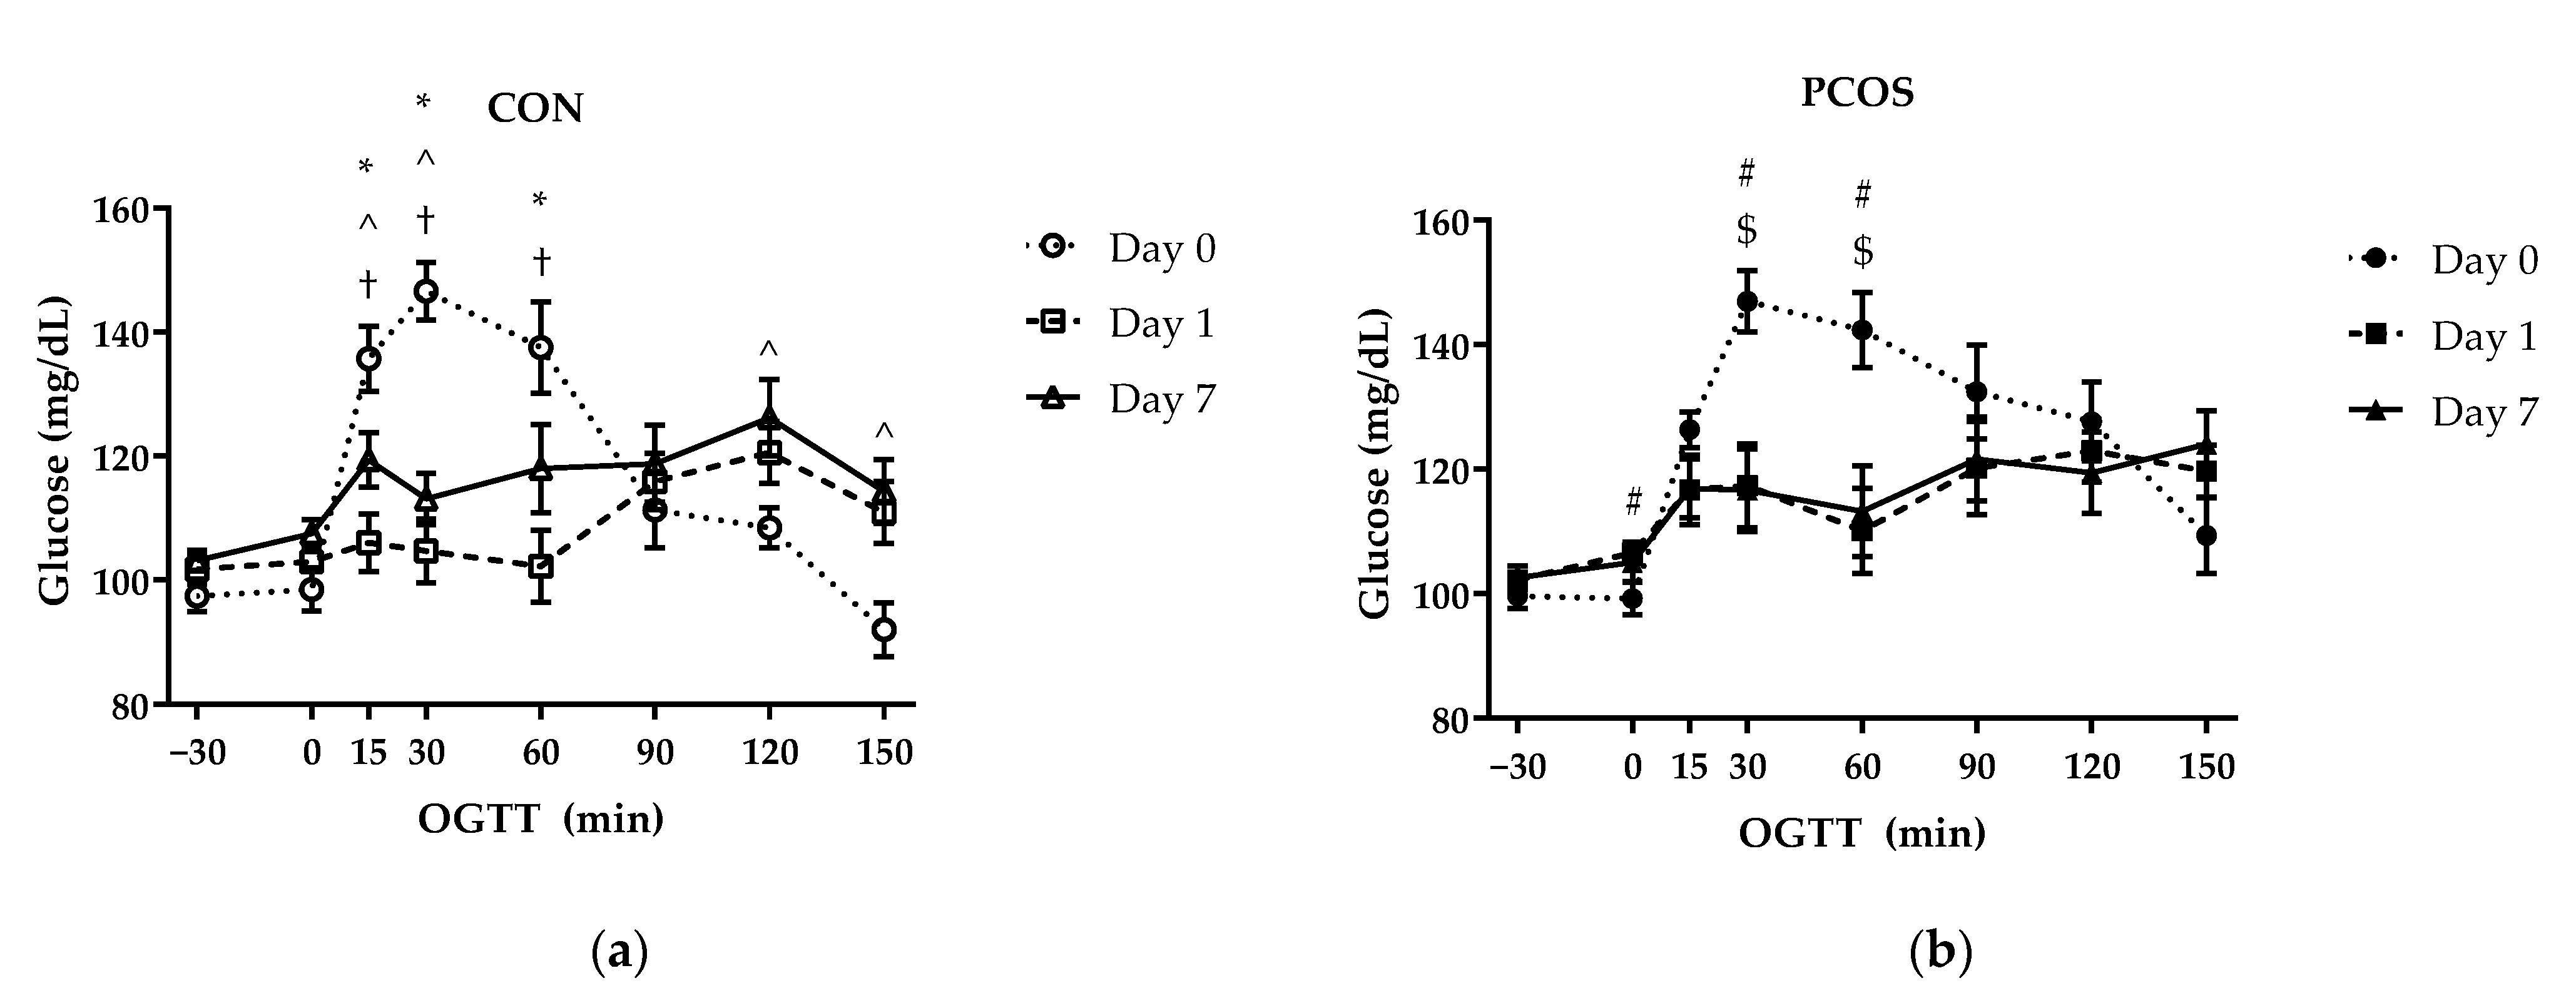
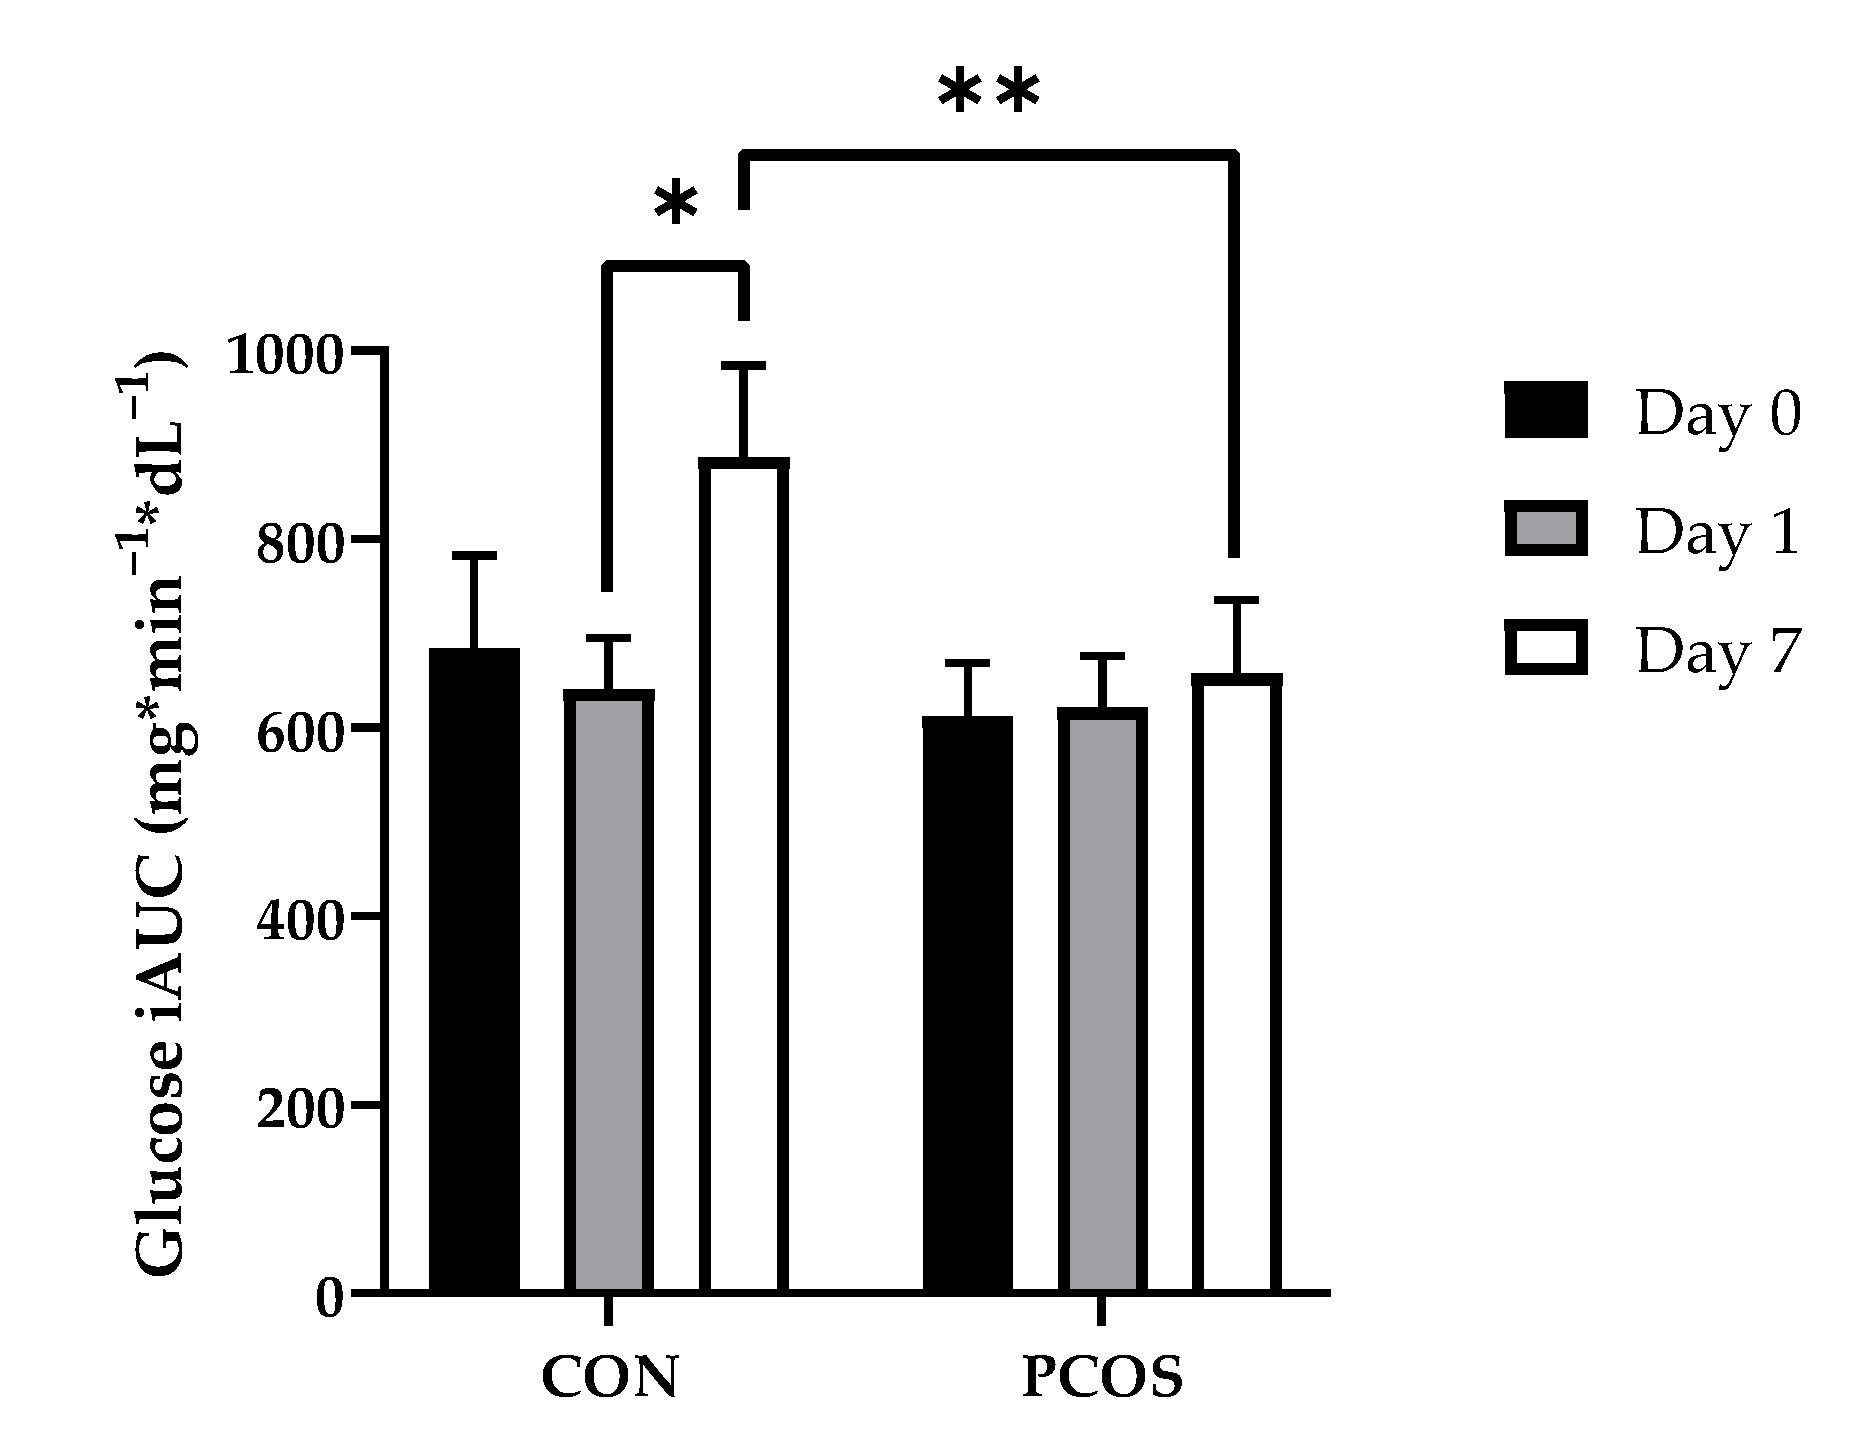
3.2. Glucose and Glucose IAUC
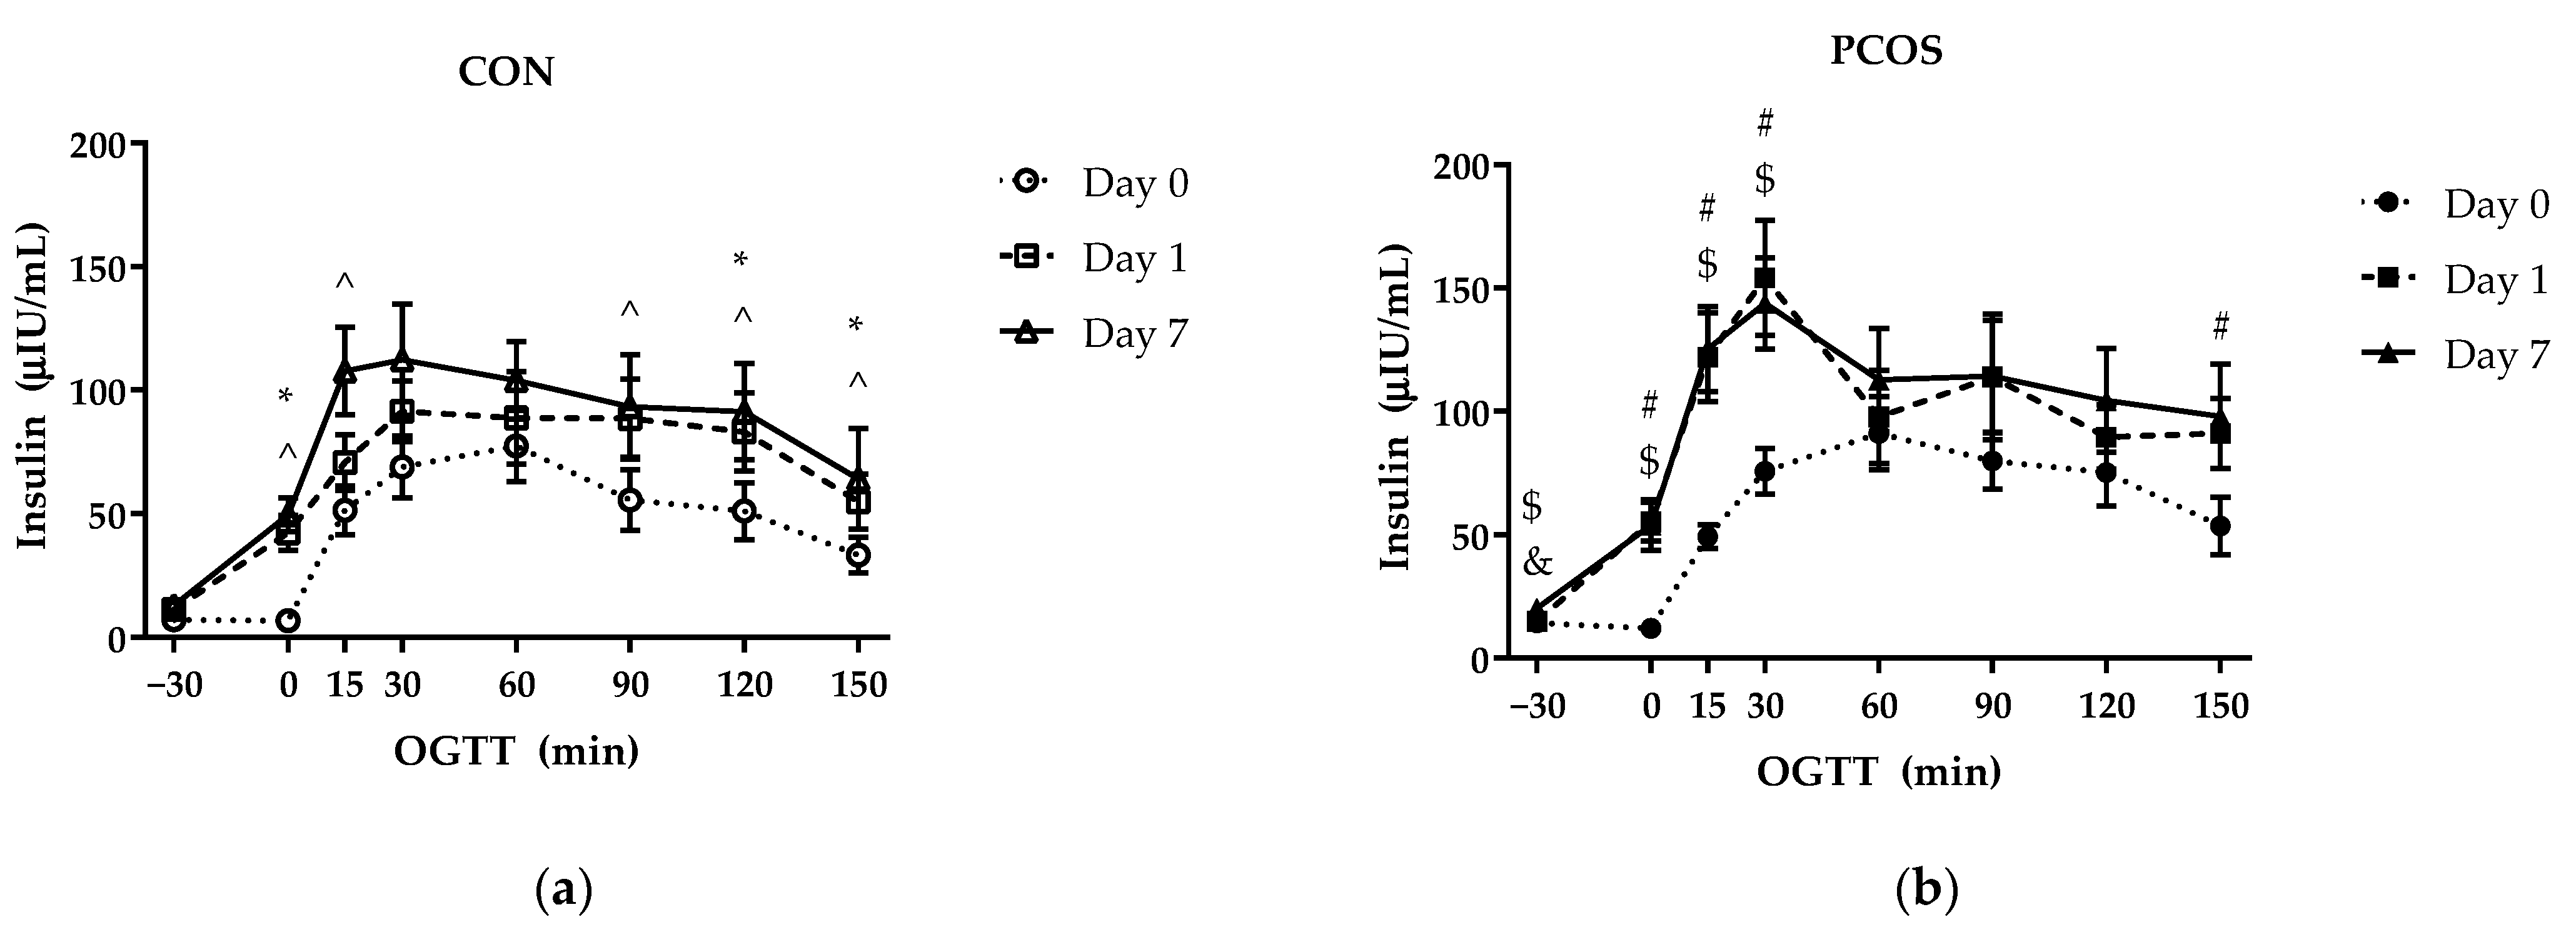
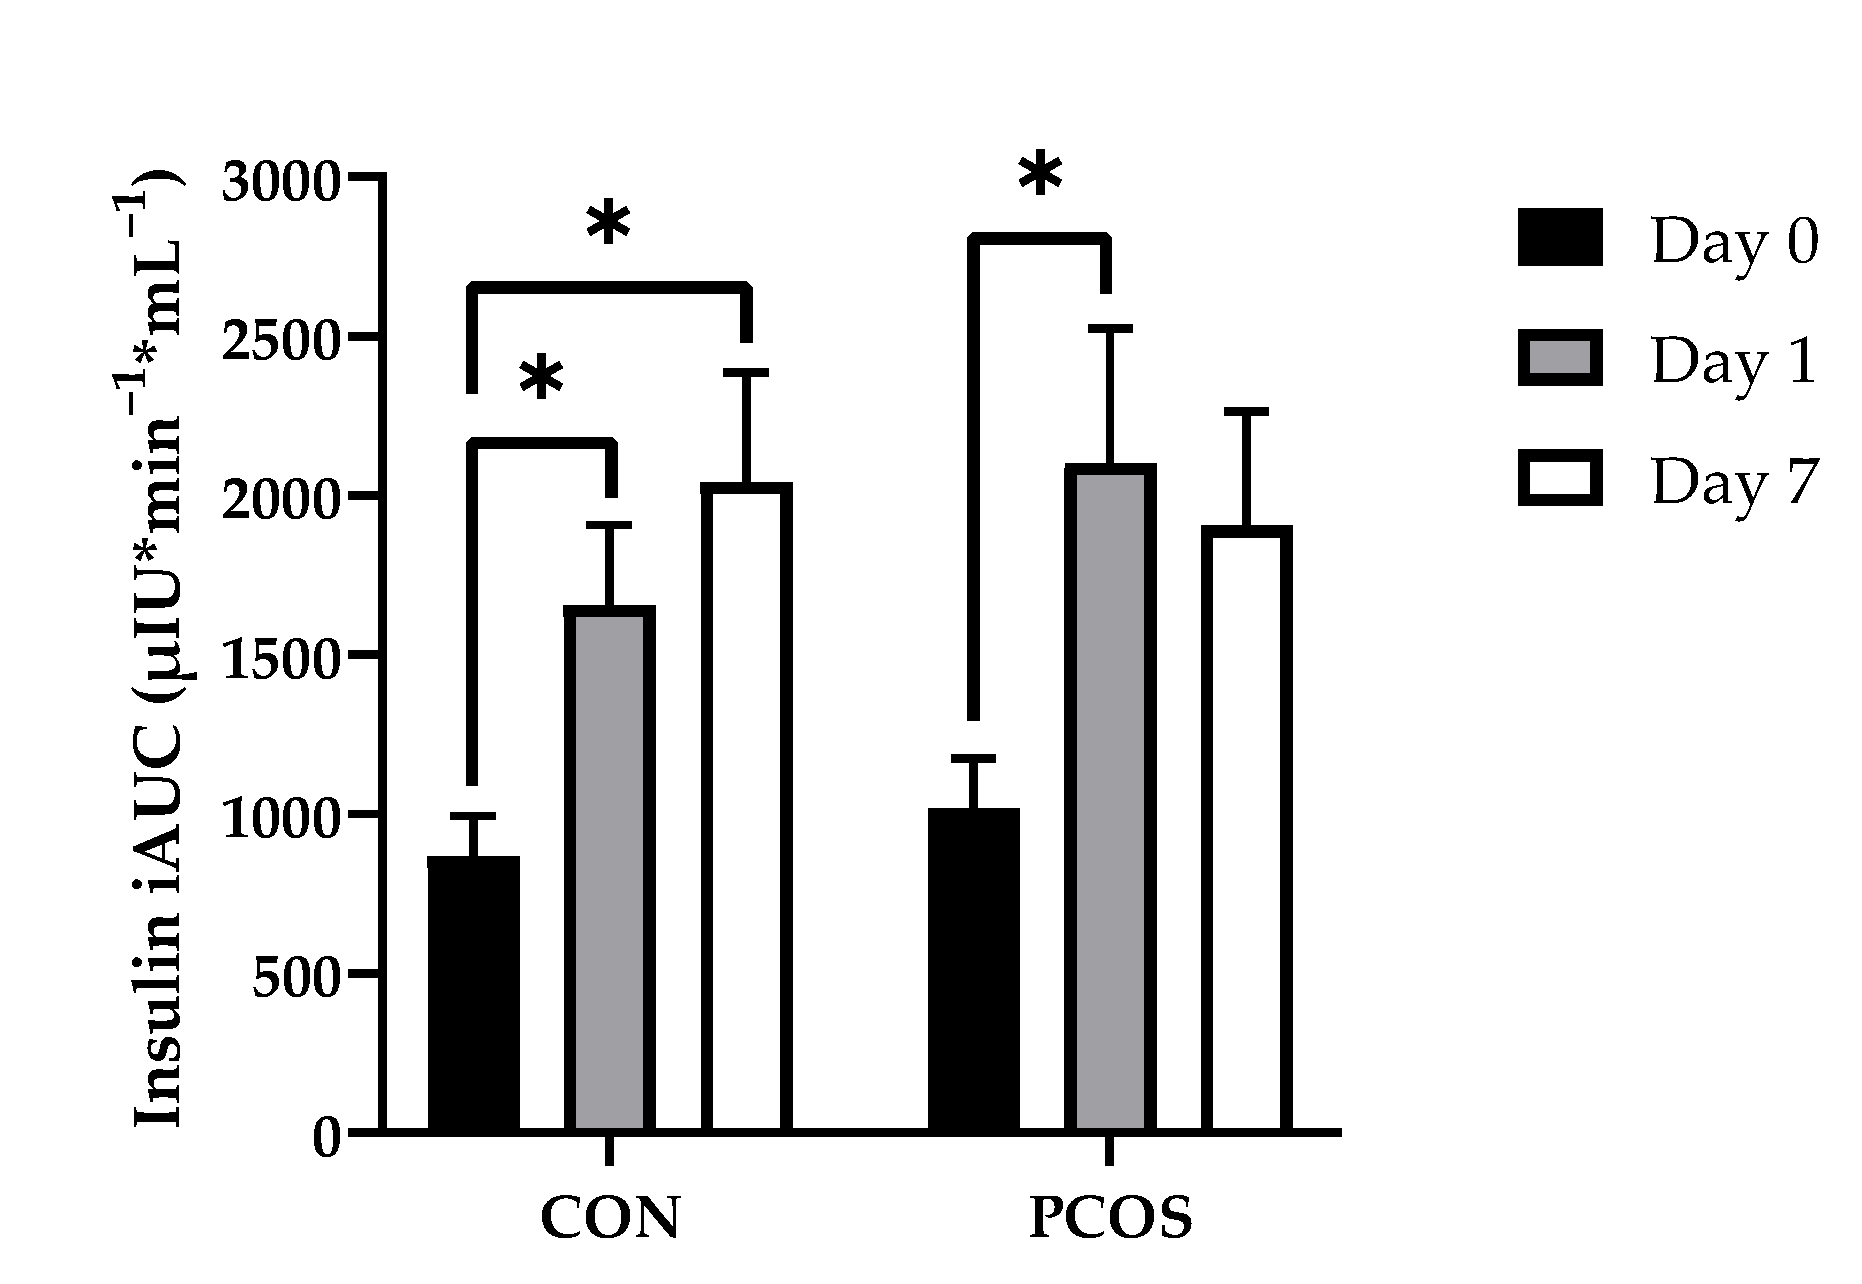
3.3. Insulin and Insulin IAUC
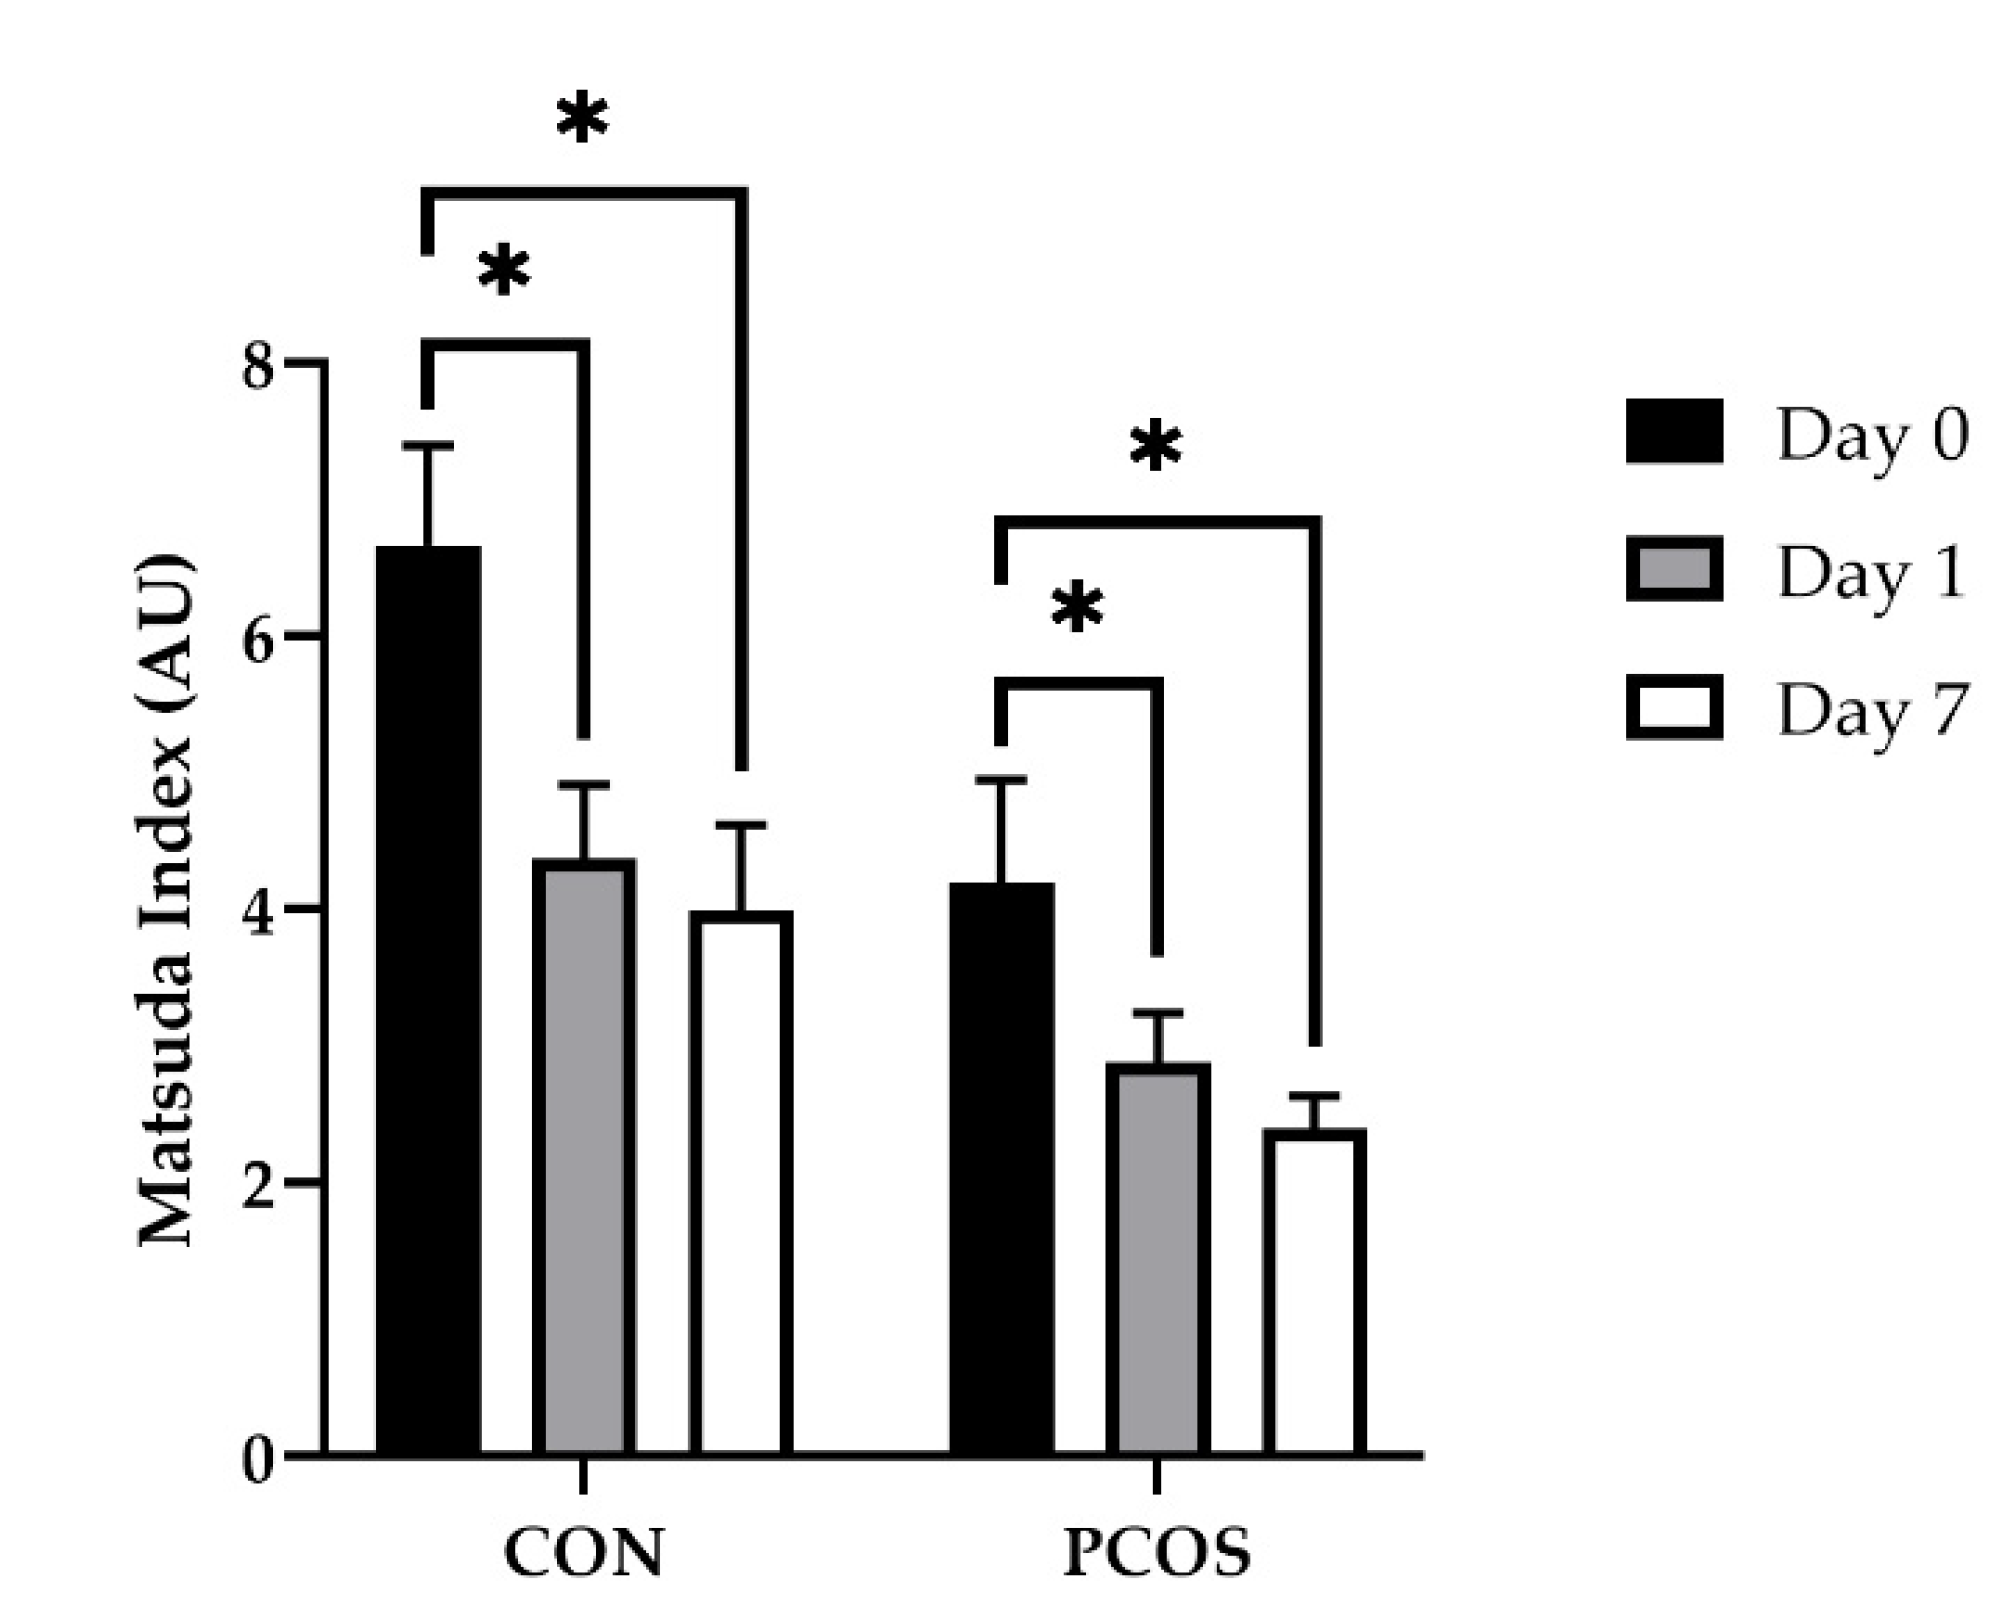
3.4. Insulin Sensitivity
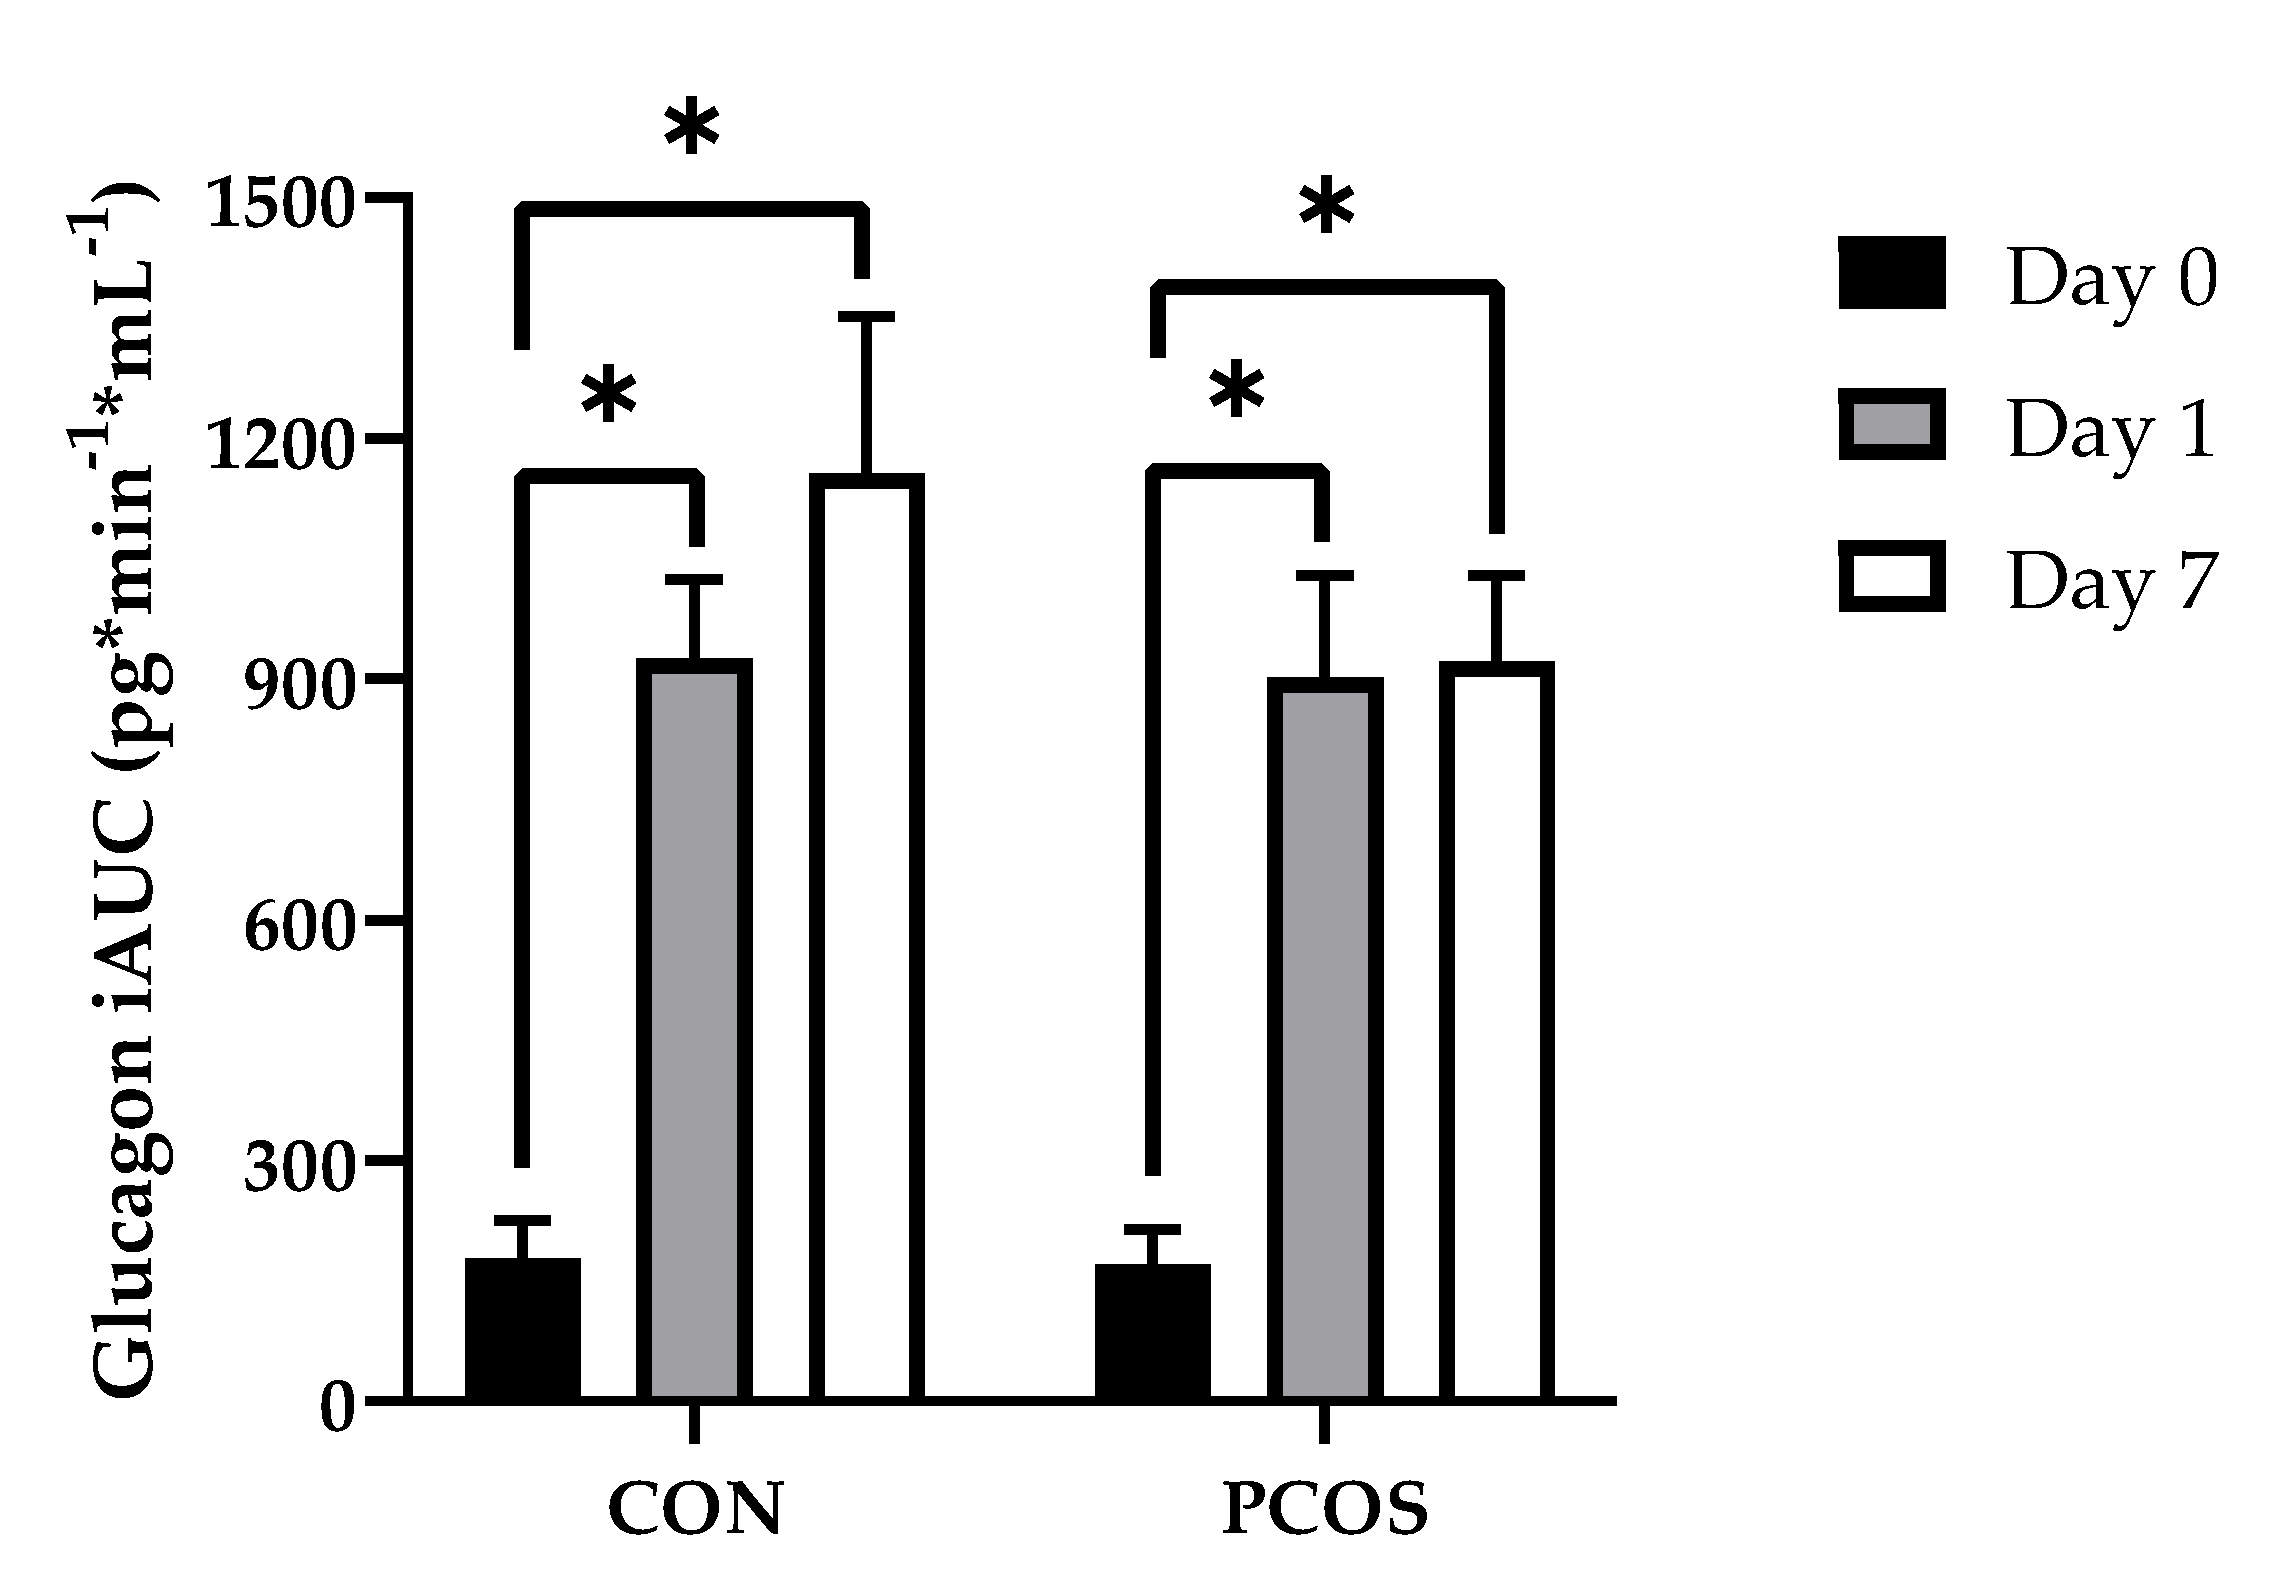
3.5. Glucagon and Glucagon IAUC
3.6. AST, ALT, and AST:ALT
3.7. SHBG
3.8. Total Cholesterol and Triglycerides
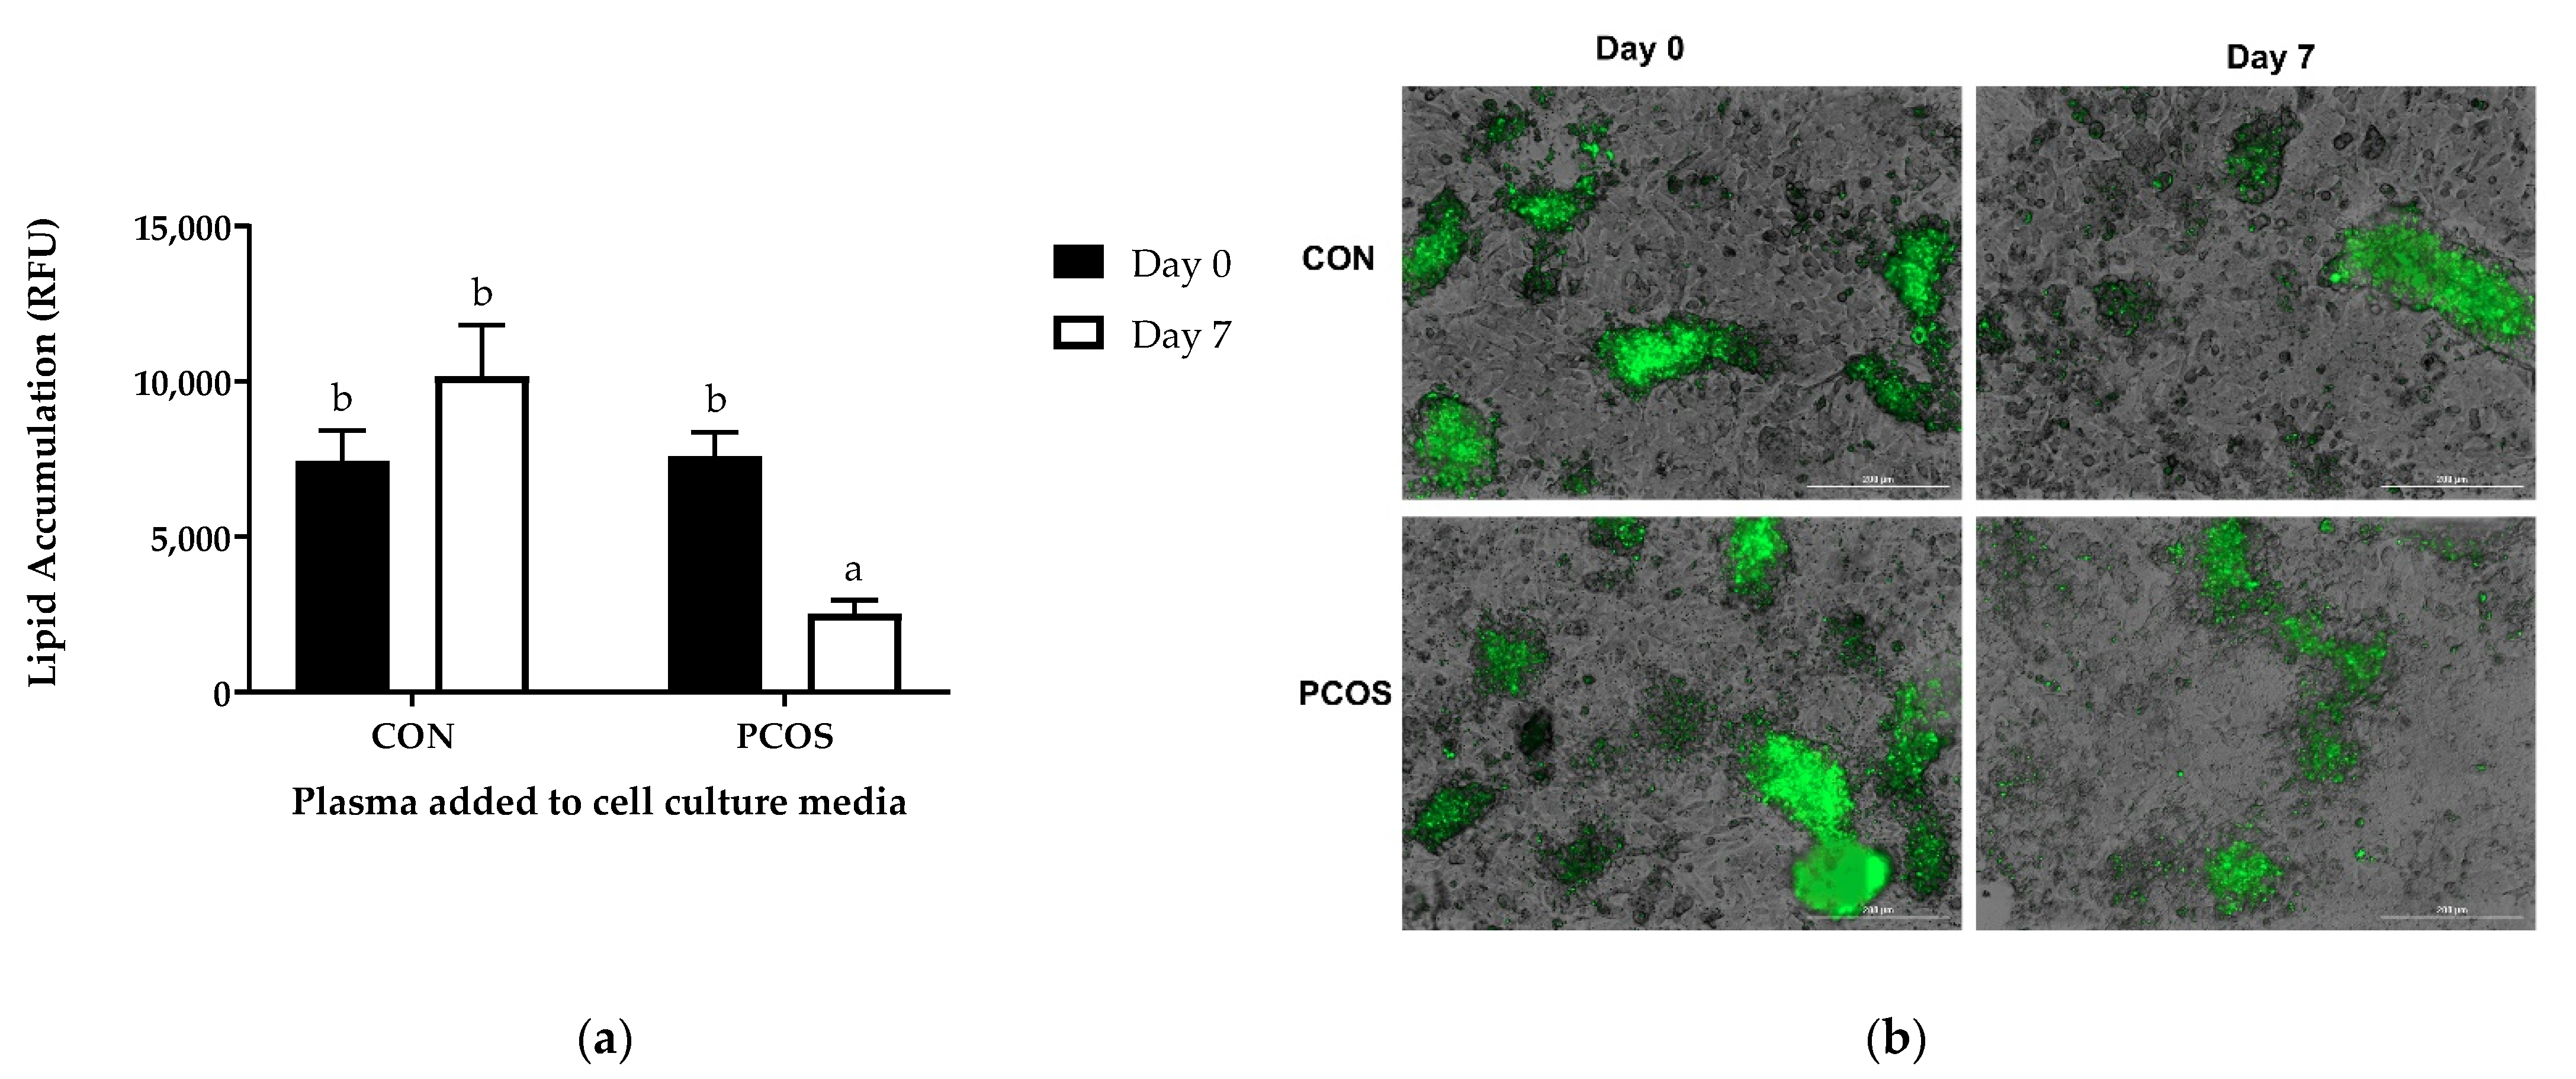
3.9. Lipid Accumulation
4. Discussion
5. Conclusions
Author Contributions
Funding
Institutional Review Board Statement
Informed Consent Statement
Data Availability Statement
Acknowledgments
Conflicts of Interest
References
- Wolf, W.M.; Wattick, R.A.; Kinkade, O.N.; Olfert, M.D. Geographical prevalence of polycystic ovary syndrome as determined by region and race/ethnicity. Int. J. Environ. Res. Public Health 2018, 15, 2589. [Google Scholar] [CrossRef] [Green Version]
- Okoroh, E.M.; Hooper, W.C.; Atrash, H.K.; Yusuf, H.R.; Boulet, S.L. Prevalence of polycystic ovary syndrome among the privately insured, United States, 2003-2008. Am. J. Obstet. Gynecol. 2012, 207, 299.e1–299.e7. [Google Scholar] [CrossRef]
- March, W.A.; Moore, V.M.; Willson, K.J.; Phillips, D.I.W.; Norman, R.J.; Davies, M.J. The prevalence of polycystic ovary syndrome in a community sample assessed under contrasting diagnostic criteria. Hum. Reprod. 2010, 25, 544–551. [Google Scholar] [CrossRef] [Green Version]
- Azziz, R.; Carmina, E.; Dewailly, D.; Diamanti-Kandarakis, E.; Escobar-Morreale, H.F.; Futterweit, W.; Janssen, O.E.; Legro, R.S.; Norman, R.J.; Taylor, A.E.; et al. The Androgen Excess and PCOS Society criteria for the polycystic ovary syndrome: The complete task force report. Fertil. Steril. 2009, 91, 456–488. [Google Scholar] [CrossRef] [PubMed]
- Dahlgren, E.; Janson, P.O.; Johansson, S.; Lapidus, L.; Odén, A. Polycystic ovary syndrome and risk for myocardial infarction: Evaluated from a risk factor model based on a prospective population study of women. Acta Obstet. Gynecol. Scand. 1992, 71, 599–604. [Google Scholar] [CrossRef] [PubMed]
- Talbott, E.O.; Zborowski, J.V.; Sutton-Tyrrell, K.; McHugh-Pemu, K.P.; Guzick, D.S. Cardiovascular risk in women with polycystic ovary syndrome. Obstet. Gynecol. Clin. N. Am. 2001, 28, 111–133. [Google Scholar] [CrossRef]
- Gambineri, A.; Patton, L.; Altieri, P.; Pagotto, U.; Pizzi, C.; Manzoli, L.; Pasquali, R. Polycystic ovary syndrome is a risk factor for type 2 diabetes: Results from a long-term prospective study. Diabetes 2012, 61, 2369–2374. [Google Scholar] [CrossRef] [PubMed] [Green Version]
- Rubin, K.H.; Glintborg, D.; Nybo, M.; Abrahamsen, B.; Andersen, M. Development and risk factors of type 2 diabetes in a nationwide population of women with polycystic ovary syndrome. J. Clin. Endocrinol. Metab. 2017, 102, 3848–3857. [Google Scholar] [CrossRef] [Green Version]
- Cai, J.; Wu, C.H.; Zhang, Y.; Wang, Y.Y.; Xu, W.D.; Lin, T.C.; Li, S.X.; Wang, L.H.; Zheng, J.; Sun, Y.; et al. High-free androgen index is associated with increased risk of non-Alcoholic fatty liver disease in women with polycystic ovary syndrome, independent of obesity and insulin resistance. Int. J. Obes. 2017, 41, 1341–1347. [Google Scholar] [CrossRef] [PubMed]
- Rocha, A.L.L.; Faria, L.C.; Guimarães, T.C.M.; Moreira, G.V.; Cândido, A.L.; Couto, C.A.; Reis, F.M. Non-alcoholic fatty liver disease in women with polycystic ovary syndrome: Systematic review and meta-analysis. J. Endocrinol. Investig. 2017, 40, 1279–1288. [Google Scholar] [CrossRef] [PubMed]
- Wu, J.; Yao, X.Y.; Shi, R.X.; Liu, S.F.; Wang, X.Y. A potential link between polycystic ovary syndrome and non-alcoholic fatty liver disease: An update meta-analysis. Reprod. Health 2018, 15. [Google Scholar] [CrossRef] [Green Version]
- Li, C.; Ford, E.S.; Li, B.; Giles, W.H.; Liu, S. Association of testosterone and sex hormone-binding globulin with metabolic syndrome and insulin resistance in men. Diabetes Care 2010, 33, 1618–1624. [Google Scholar] [CrossRef] [Green Version]
- Akin, F.; Bastemir, M.; Alkis, E. Effect of insulin sensitivity on SHBG levels in premenopausal versus postmenopausal obese women. Adv. Ther. 2007, 24, 1210–1220. [Google Scholar] [CrossRef]
- Akin, F.; Bastemir, M.; Alkiş, E.; Kaptanoglu, B. SHBG levels correlate with insulin resistance in postmenopausal women. Eur. J. Intern. Med. 2009, 20, 162–167. [Google Scholar] [CrossRef] [PubMed]
- Færch, K.; Vistisen, D.; Pacini, G.; Torekov, S.S.; Johansen, N.B.; Witte, D.R.; Jonsson, A.; Pedersen, O.; Hansen, T.; Lauritzen, T.; et al. Insulin resistance is accompanied by increased fasting glucagon and delayed glucagon suppression in individuals with normal and impaired glucose regulation. Diabetes 2016, 65, 3473–3481. [Google Scholar] [CrossRef] [Green Version]
- Bonnet, F.; Ducluzeau, P.H.; Gastaldelli, A.; Laville, M.; Anderwald, C.H.; Konrad, T.; Mari, A.; Balkau, B. Liver enzymes are associated with hepatic insulin resistance, insulin secretion, and glucagon concentration in healthy men and women. Diabetes 2011, 60, 1660–1667. [Google Scholar] [CrossRef] [PubMed] [Green Version]
- Abu-Hijleh, T.M.; Gammoh, E.; Al-Busaidi, A.S.; Malalla, Z.H.; Madan, S.; Mahmood, N.; Almawi, W.Y. Common Variants in the Sex Hormone-Binding Globulin (SHBG) Gene Influence SHBG Levels in Women with Polycystic Ovary Syndrome. Ann. Nutr. Metab. 2016, 68, 66–74. [Google Scholar] [CrossRef]
- Nestler, J.E.; Powers, L.P.; Matt, D.W.; Steingold, K.A.; Plymate, S.R.; Rittmaster, R.S.; Clore, J.N.; Blackard, W.G. A direct effect of hyperinsulinemia on serum sex hormone-binding globulin levels in obese women with the polycystic ovary syndrome. J. Clin. Endocrinol. Metab. 1991, 72, 83–89. [Google Scholar] [CrossRef] [PubMed]
- Schwimmer, J.B.; Khorram, O.; Chiu, V.; Schwimmer, W.B. Abnormal aminotransferase activity in women with polycystic ovary syndrome. Fertil. Steril. 2005, 83, 494–497. [Google Scholar] [CrossRef] [PubMed]
- Sam, S.; Vellanki, P.; Yalamanchi, S.K.; Bergman, R.N.; Dunaif, A. Exaggerated glucagon responses to hypoglycemia in women with polycystic ovary syndrome. Metabolism 2017, 71, 125–131. [Google Scholar] [CrossRef] [PubMed]
- Vassilatou, E. Nonalcoholic fatty liver disease and polycystic ovary syndrome. World J. Gastroenterol. 2014, 20, 8351–8363. [Google Scholar] [CrossRef]
- Sattar, N.; Forrest, E.; Preiss, D. Non-alcoholic fatty liver disease. BMJ 2014, 349, g4596. [Google Scholar] [CrossRef] [PubMed]
- Chen, Z.; Tian, R.; She, Z.; Cai, J.; Li, H. Role of oxidative stress in the pathogenesis of nonalcoholic fatty liver disease. Free Radic. Biol. Med. 2020, 152, 116–141. [Google Scholar] [CrossRef] [PubMed]
- Schindhelm, R.K.; Diamant, M.; Dekker, J.M.; Tushuizen, M.E.; Teerlink, T.; Heine, R.J. Alanine aminotransferase as a marker of non-alcoholic fatty liver disease in relation to type 2 diabetes mellitus and cardiovascular disease. Diabetes. Metab. Res. Rev. 2006, 22, 437–443. [Google Scholar] [CrossRef]
- Chen, M.J.; Chiu, H.M.; Chen, C.L.; Yang, W.S.; Yang, Y.S.; Ho, H.N. Hyperandrogenemia is independently associated with elevated alanine aminotransferase activity in young women with polycystic ovary syndrome. J. Clin. Endocrinol. Metab. 2010, 95, 3332–3341. [Google Scholar] [CrossRef] [PubMed] [Green Version]
- Brzozowska, M.M.; Ostapowicz, G.; Weltman, M.D. An association between non-alcoholic fatty liver disease and polycystic ovarian syndrome. J. Gastroenterol. Hepatol. 2009, 24, 243–247. [Google Scholar] [CrossRef] [PubMed]
- Hossain, N.; Stepanova, M.; Afendy, A.; Nader, F.; Younossi, Y.; Rafiq, N.; Goodman, Z.; Younossi, Z.M. Non-alcoholic steatohepatitis (NASH) in patients with polycystic ovarian syndrome (PCOS). Scand. J. Gastroenterol. 2011, 46, 479–484. [Google Scholar] [CrossRef] [PubMed]
- Nascimbeni, F.; Ballestri, S.; Di Tommaso, L.; Piccoli, M.; Lonardo, A. Inflammatory hepatocellular adenomatosis, metabolic syndrome, polycystic ovary syndrome and non-alcoholic steatohepatitis: Chance tetrad or association by necessity? Dig. Liver Dis. 2014, 46, 288–289. [Google Scholar] [CrossRef]
- Roe, A.; Hillman, J.; Butts, S.; Smith, M.; Rader, D.; Playford, M.; Mehta, N.N.; Dokras, A. Decreased cholesterol efflux capacity and atherogenic lipid profile in young women with PCOS. J. Clin. Endocrinol. Metab. 2014, 99, E841. [Google Scholar] [CrossRef]
- Min, H.K.; Kapoor, A.; Fuchs, M.; Mirshahi, F.; Zhou, H.; Maher, J.; Kellum, J.; Warnick, R.; Contos, M.J.; Sanyal, A.J. Increased hepatic synthesis and dysregulation of cholesterol metabolism is associated with the severity of nonalcoholic fatty liver disease. Cell Metab. 2012, 15, 665–674. [Google Scholar] [CrossRef] [Green Version]
- Hamilton-Fairley, D.; Kiddy, D.; Anyaoku, V.; Koistinen, R.; Seppala, M.; Franks, S. Response of sex hormone binding globulin and insulin-like growth factor binding protein-1 to an oral glucose tolerance test in obese women with polycystic ovary syndrome before and after calorie restriction. Clin. Endocrinol. 1993, 39, 363–367. [Google Scholar] [CrossRef] [PubMed]
- Huber-Buchholz, M.-M.; Carey, D.G.P.; Norman, R.J. Restoration of Reproductive Potential by Lifestyle Modification in Obese Polycystic Ovary Syndrome: Role of Insulin Sensitivity and Luteinizing Hormone1. J. Clin. Endocrinol. Metab. 1999, 84, 1470–1474. [Google Scholar] [CrossRef]
- Leidy, H.J.; Carnell, N.S.; Mattes, R.D.; Campbell, W.W. Higher protein intake preserves lean mass and satiety with weight loss in pre-obese and obese women. Obesity 2007, 15, 421–429. [Google Scholar] [CrossRef]
- Bowen, J.; Noakes, M.; Clifton, P.M. Appetite regulatory hormone responses to various dietary proteins differ by body mass index status despite similar reductions in ad Libitum energy intake. J. Clin. Endocrinol. Metab. 2006, 91, 2913–2919. [Google Scholar] [CrossRef] [PubMed] [Green Version]
- Pal, S.; Ellis, V.; Dhaliwal, S. Effects of whey protein isolate on body composition, lipids, insulin and glucose in overweight and obese individuals. Br. J. Nutr. 2010, 104, 716–723. [Google Scholar] [CrossRef] [PubMed]
- Petersen, B.L.; Ward, L.S.; Bastian, E.D.; Jenkins, A.L.; Campbell, J.; Vuksan, V. A whey protein supplement decreases post-prandial glycemia. Nutr. J. 2009, 8, 1–5. [Google Scholar] [CrossRef] [Green Version]
- Stancliffe, R.A.; Thorpe, T.; Zemel, M.B. Dairy attentuates oxidative and inflammatory stress in metabolic syndrome. Am. J. Clin. Nutr. 2011, 94, 422–430. [Google Scholar] [CrossRef] [Green Version]
- Wennersberg, M.H.; Smedman, A.; Turpeinen, A.M.; Retterstøl, K.; Tengblad, S.; Lipre, E.; Aro, A.; Mutanen, P.; Seljeflot, I.; Basu, S.; et al. Dairy products and metabolic effects in overweight men and women: Results from a 6-mo intervention study. Am. J. Clin. Nutr. 2009, 90, 960–968. [Google Scholar] [CrossRef]
- Hamad, E.M.; Taha, S.H.; Abou Dawood, A.G.I.; Sitohy, M.Z.; Abdel-Hamid, M. Protective effect of whey proteins against nonalcoholic fatty liver in rats. Lipids Health Dis. 2011, 10, 1–7. [Google Scholar] [CrossRef] [PubMed] [Green Version]
- Kume, H.; Okazaki, K.; Sasaki, H. Hepatoprotective effects of whey protein on D-galactosamine-induced hepatitis and liver fibrosis in rats. Biosci. Biotechnol. Biochem. 2006, 70, 1281–1285. [Google Scholar] [CrossRef] [PubMed]
- Azziz, R. Diagnosis of polycystic ovarian syndrome: The Rotterdam criteria are premature. J. Clin. Endocrinol. Metab. 2006, 91, 781–785. [Google Scholar] [CrossRef] [PubMed] [Green Version]
- Jakubowicz, D.; Froy, O.; Ahrén, B.; Boaz, M.; Landau, Z.; Bar-Dayan, Y.; Ganz, T.; Barnea, M.; Wainstein, J. Incretin, insulinotropic and glucose-lowering effects of whey protein pre-load in type 2 diabetes: A randomised clinical trial. Diabetologia 2014, 57, 1807–1811. [Google Scholar] [CrossRef]
- Ma, J.; Stevens, J.E.; Cukier, K.; Maddox, A.F.; Wishart, J.M.; Jones, K.L.; Clifton, P.M.; Horowitz, M.; Rayner, C.K. Effects of a protein preload on gastric emptying, glycemia, and gut hormones after a carbohydrate meal in diet-controlled type 2 diabetes. Diabetes Care 2009, 32, 1600–1602. [Google Scholar] [CrossRef] [PubMed] [Green Version]
- Ma, J.; Jesudason, D.R.; Stevens, J.E.; Keogh, J.B.; Jones, K.L.; Clifton, P.M.; Horowitz, M.; Rayner, C.K. Sustained effects of a protein “preload” on glycaemia and gastric emptying over 4 weeks in patients with type 2 diabetes: A randomized clinical trial. Diabetes Res. Clin. Pract. 2015, 108, e31–e34. [Google Scholar] [CrossRef] [PubMed]
- Mignone, L.E. Whey protein: The “whey” forward for treatment of type 2 diabetes? World J. Diabetes 2015, 6, 1274. [Google Scholar] [CrossRef] [PubMed]
- Karamanlis, A.; Chaikomin, R.; Doran, S.; Bellon, M.; Bartholomeusz, F.D.; Wishart, J.M.; Jones, K.L.; Horowitz, M.; Rayner, C.K. Effects of protein on glycemic and incretin responses and gastric emptying after oral glucose in healthy subjects. Am. J. Clin. Nutr. 2007, 86, 1364–1368. [Google Scholar] [CrossRef]
- Lonza Walkersville Inc AdipoRedTM Assay Reagent: Instructions for Use. Available online: https://bioscience.lonza.com/lonza_bs/US/en/download/product/asset/29644 (accessed on 27 January 2021).
- Polak, K.; Czyzyk, A.; Simoncini, T.; Meczekalski, B. New markers of insulin resistance in polycystic ovary syndrome. J. Endocrinol. Investig. 2017, 40, 1. [Google Scholar] [CrossRef] [Green Version]
- Utzschneider, K.M.; Prigeon, R.L.; Faulenbach, M.V.; Tong, J.; Carr, D.B.; Boyko, E.J.; Leonetti, D.L.; McNeely, M.J.; Fujimoto, W.Y.; Kahn, S.E. Oral Disposition index predicts the development of future diabetes above and beyond fasting and 2-h glucose levels. Diabetes Care 2009, 32, 335–341. [Google Scholar] [CrossRef] [Green Version]
- Giezenaar, C.; Hutchison, A.T.; Luscombe-Marsh, N.D.; Chapman, I.; Horowitz, M.; Soenen, S. Effect of age on blood glucose and plasma insulin, glucagon, ghrelin, CCK, GIP, and GLP-1 responses to whey protein ingestion. Nutrients 2018, 10, 2. [Google Scholar] [CrossRef] [Green Version]
- Hutchison, A.T.; Feinle-Bisset, C.; Fitzgerald, P.C.E.; Standfield, S.; Horowitz, M.; Clifton, P.M.; Luscombe-Marsh, N.D. Comparative effects of intraduodenal whey protein hydrolysate on antropyloroduodenal motility, gut hormones, glycemia, appetite, and energy intake in lean and obese men. Am. J. Clin. Nutr. 2015, 102, 1323–1331. [Google Scholar] [CrossRef] [PubMed]
- Kraemer, W.J.; Solomon-Hill, G.; Volk, B.M.; Kupchak, B.R.; Looney, D.P.; Dunn-Lewis, C.; Comstock, B.A.; Szivak, T.K.; Hooper, D.R.; Flanagan, S.D.; et al. The Effects of Soy and Whey Protein Supplementation on Acute Hormonal Responses to Resistance Exercise in Men. J. Am. Coll. Nutr. 2013, 32, 66–74. [Google Scholar] [CrossRef]
- Stoddart, M.L.; Blevins, K.S.; Lee, E.T.; Wang, W.; Blackett, P.R. Association of acanthosis nigricans with hyperinsulinemia compared with other selected risk factors for type 2 diabetes in Cherokee Indians: The Cherokee diabetes study. Diabetes Care 2002, 25, 1009–1014. [Google Scholar] [CrossRef] [PubMed] [Green Version]
- Pattamadilok, B.; Devpura, S.; Syed, Z.U.; Agbai, O.N.; Vemulapalli, P.; Henderson, M.; Rehse, S.J.; Mahmoud, B.H.; Lim, H.W.; Naik, R.; et al. Quantitative skin color measurements in acanthosis nigricans patients: Colorimetry and diffuse reflectance spectroscopy. Photodermatol. Photoimmunol. Photomed. 2012, 28, 213–215. [Google Scholar] [CrossRef] [PubMed]
- Araújo, L.M.B.; Porto, M.V.; Netto, E.M.; Ursich, M.J. Association of acanthosis nigricans with race and metabolic disturbances in obese women. Braz. J. Med. Biol. Res. 2002, 35, 59–64. [Google Scholar] [CrossRef] [PubMed] [Green Version]
- Rao, M.; Zumbro, E.L.; Broughton, K.S.; LeMieux, M.J. Whey Protein Preload enhances the aGLP-1 response and reduces circulating glucose in women with polycystic ovarian syndrome. Nutr. Res. 2021. [Google Scholar] [CrossRef]
- Pal, S.; Ellis, V. The chronic effects of whey proteins on blood pressure, vascular function, and inflammatory markers in overweight individuals. Obesity 2010, 18, 1354–1359. [Google Scholar] [CrossRef] [PubMed]
- Frid, A.H.; Nilsson, M.; Holst, J.J.; Björck, I.M. Effect of whey on blood glucose and insulin responses to composite breakfast and lunch meals in type 2 diabetic subjects. Am. J. Clin. Nutr. 2005, 82, 69–75. [Google Scholar] [CrossRef]
- Li, C.; Chen, P.; Palladino, A.; Narayan, S.; Russell, L.K.; Sayed, S.; Xiong, G.; Chen, J.; Stokes, D.; Butt, Y.M.; et al. Mechanism of hyperinsulinism in short-chain 3-hydroxyacyl-CoA dehydrogenase deficiency involves activation of glutamate dehydrogenase. J. Biol. Chem. 2010, 285, 31806–31818. [Google Scholar] [CrossRef] [Green Version]
- Mortensen, L.S.; Holmer-Jensen, J.; Hartvigsen, M.L.; Jensen, V.K.; Astrup, A.; De Vrese, M.; Holst, J.J.; Thomsen, C.; Hermansen, K. Effects of different fractions of whey protein on postprandial lipid and hormone responses in type 2 diabetes. Eur. J. Clin. Nutr. 2012, 66, 799–805. [Google Scholar] [CrossRef]
- Zhang, J.W.; Tong, X.; Wan, Z.; Wang, Y.; Qin, L.Q.; Szeto, I.M.Y. Effect of whey protein on blood lipid profiles: A meta-analysis of randomized controlled trials. Eur. J. Clin. Nutr. 2016, 70, 879–885. [Google Scholar] [CrossRef]
- Kasim-Karakas, S.E.; Almario, R.U.; Cunningham, W. Effects of protein versus simple sugar intake on weight loss in polycystic ovary syndrome (according to the National Institutes of Health criteria). Fertil. Steril. 2009. [Google Scholar] [CrossRef]
- Pilvi, T.K.; Seppänen-Laakso, T.; Simolin, H.; Finckenberg, P.; Huotari, A.; Herzig, K.H.; Korpela, R.; Orešiče, M.; Mervaala, E.M. Metabolomic changes in fatty liver can be modified by dietary protein and calcium during energy restriction. World J. Gastroenterol. 2008, 14, 4462–4472. [Google Scholar] [CrossRef] [PubMed]
- Morifuji, M.; Sakai, K.; Sanbongi, C.; Sugiura, K. Dietary whey protein downregulates fatty acid synthesis in the liver, but upregulates it in skeletal muscle of exercise-trained rats. Nutrition 2005, 21, 1052–1058. [Google Scholar] [CrossRef] [PubMed]


| CON Mean ± S.E. | PCOS Mean ± S.E. | p-Value | |
|---|---|---|---|
| Total calorie intake (kcal/d) | 1616.6 ± 83.4 | 1705.9 ± 127.5 | 0.56 |
| Carbohydrate intake (g/d) | 192.3 ± 11.4 | 212.7 ± 15.4 | 0.29 |
| Fat intake (g/d) | 61.8 ± 4.4 | 68.6 ± 7.3 | 0.42 |
| Protein intake (g/d) | 60.9 ± 4.1 | 57.1 ± 5.0 | 0.56 |
| CON Mean ± S.E. | PCOS Mean ± S.E. | p-Value | |
|---|---|---|---|
| Age (year) | 21.1 ± 0.8 | 22.9 ± 1.6 | 0.31 |
| Weight (kg) * | 63.5 ± 2.4 | 92.2 ± 7.1 | <0.01 |
| Height (cm) | 161.3 ± 1.9 | 165.0 ± 2.2 | 0.29 |
| BMI (kg/m2) * | 24.4 ± 1.0 | 33.7 ± 2.5 | <0.01 |
| WHR | 0.8 ± 0.0 | 0.9 ± 0.0 | 0.48 |
| BF% * | 38.4 ± 1.5 | 46.2 ± 2.0 | <0.01 |
| LBM (kg) * | 24.7 ± 1.7 | 44.3 ± 5.0 | <0.01 |
| Ethnicity: | |||
| Asian | 7 (47%) | 2 (14%) | |
| Caucasian | 2 (13%) | 9 (64%) | |
| Hispanic | 3 (20%) | 3 (21%) | |
| Other | 3 (20%) |
| CON Mean ± SE | PCOS Mean ± SE | P-Value | |
|---|---|---|---|
| AN: Severity at neck * | 0.07 ± 0.07 | 1.21 ± 0.39 | <0.01 |
| AN: Texture at neck * | 0.07 ± 0.07 | 1.00 ± 0.30 | <0.01 |
| AN: Severity at axillae | 0.60 ± 0.25 | 1.29 ± 0.35 | 0.12 |
| AN: Knuckles | 0.07 ± 0.07 | 0.29 ± 0.13 | 0.13 |
| AN: Elbows | 0.07 ± 0.07 | 0.21 ± 0.11 | 0.27 |
| AN: Knees | 0.07 ± 0.07 | 0.14 ± 0.10 | 0.52 |
| HS: Upper lip * | 0.07 ± 0.07 | 0.86 ± 0.31 | 0.02 |
| HS: Chin * | 0.07 ± 0.07 | 0.86 ± 0.31 | 0.02 |
| HS: Chest | 0.40 ± 0.24 | 0.71 ± 0.24 | 0.36 |
| HS: Upper back | 0.07 ± 0.07 | 0.14 ± 0.10 | 0.52 |
| HS: Lower back | 0.13 ± 0.13 | 0.64 ± 0.25 | 0.08 |
| HS: Upper arm | 0.20 ± 0.14 | 0.07 ± 0.07 | 0.44 |
| HS: Upper abdomen * | 0.20 ± 0.11 | 0.93 ± 0.30 | 0.03 |
| HS: Lower abdomen | 0.33 ± 0.13 | 0.64 ± 0.25 | 0.27 |
| HS: Thighs * | 0.53 ± 0.22 | 1.21 ± 0.24 | 0.04 |
| HS: Total mFG score * | 2.00 ± 0.83 | 6.07 ± 1.75 | 0.04 |
| CON Mean ± SE | PCOS Mean ± SE | P-Value | |
|---|---|---|---|
| AST | 0.81 | ||
| Day 0 | 23.6 ± 1.2 | 25.2 ± 1.3 | 0.42 |
| Day 1 | 24.8 ± 1.8 | 23.9 ± 1.9 | 0.76 |
| Day 7 | 25.4 ±1.9 | 23.1 ±2.0 | 0.44 |
| ASTact | 0.85 | ||
| Day 0 | 5.4 ± 1.9 | 5.3 ± 1.4 | 0.52 |
| Day 7 | 5.3 ± 1.4 | 7.6 ± 1.7 | 0.43 |
| ALT | 0.99 | ||
| Day 0 | 15.3 ± 1.8 | 17.5 ± 1.9 | 0.44 |
| Day 1 | 18.3 ± 2.4 | 16.6 ± 2.5 | 0.65 |
| Day 7 | 16.8 ±1.7 | 16.3 ±1.8 | 0.85 |
| CON Mean ± SE | PCOS Mean ± SE | p-Value | |
|---|---|---|---|
| SHBG a | 0.047 | ||
| Day 0 | 38.2 ± 15.3 | 83.1 ± 15.9 | 0.07 |
| Day 7 b | 29.2 ± 19.7 | 94.2 ± 20.5 | 0.043 |
| TG | 0.08 | ||
| Day 0 | 112.2 ± 16.9 | 162.4 ± 15.4 | 0.07 |
| Day 7 | 123.9 ± 20.5 | 134.6 ± 16.4 | 0.73 |
| TC | 0.44 | ||
| Day 0 | 186.1 ± 13.2 | 170.0 ± 12.0 | 0.44 |
| Day 7 | 161.2 ± 9.8 | 157.7 ± 8.9 | 0.81 |
Publisher’s Note: MDPI stays neutral with regard to jurisdictional claims in published maps and institutional affiliations. |
© 2021 by the authors. Licensee MDPI, Basel, Switzerland. This article is an open access article distributed under the terms and conditions of the Creative Commons Attribution (CC BY) license (https://creativecommons.org/licenses/by/4.0/).
Share and Cite
Zumbro, E.L.; Rao, M.; Balcom-Luker, S.; Broughton, K.S.; LeMieux, M.J. Whey Protein Supplementation Improves the Glycemic Response and May Reduce Non-Alcoholic Fatty Liver Disease Related Biomarkers in Women with Polycystic Ovary Syndrome (PCOS). Nutrients 2021, 13, 2451. https://0-doi-org.brum.beds.ac.uk/10.3390/nu13072451
Zumbro EL, Rao M, Balcom-Luker S, Broughton KS, LeMieux MJ. Whey Protein Supplementation Improves the Glycemic Response and May Reduce Non-Alcoholic Fatty Liver Disease Related Biomarkers in Women with Polycystic Ovary Syndrome (PCOS). Nutrients. 2021; 13(7):2451. https://0-doi-org.brum.beds.ac.uk/10.3390/nu13072451
Chicago/Turabian StyleZumbro, Emily L., Manisha Rao, Shenavia Balcom-Luker, K. Shane Broughton, and Monique J. LeMieux. 2021. "Whey Protein Supplementation Improves the Glycemic Response and May Reduce Non-Alcoholic Fatty Liver Disease Related Biomarkers in Women with Polycystic Ovary Syndrome (PCOS)" Nutrients 13, no. 7: 2451. https://0-doi-org.brum.beds.ac.uk/10.3390/nu13072451