
Sugar- and Artificially Sweetened Beverages Consumption Linked to Type 2 Diabetes, Cardiovascular Diseases, and All-Cause Mortality: A Systematic Review and Dose-Response Meta-Analysis of Prospective Cohort Studies

 ,
,  and
and 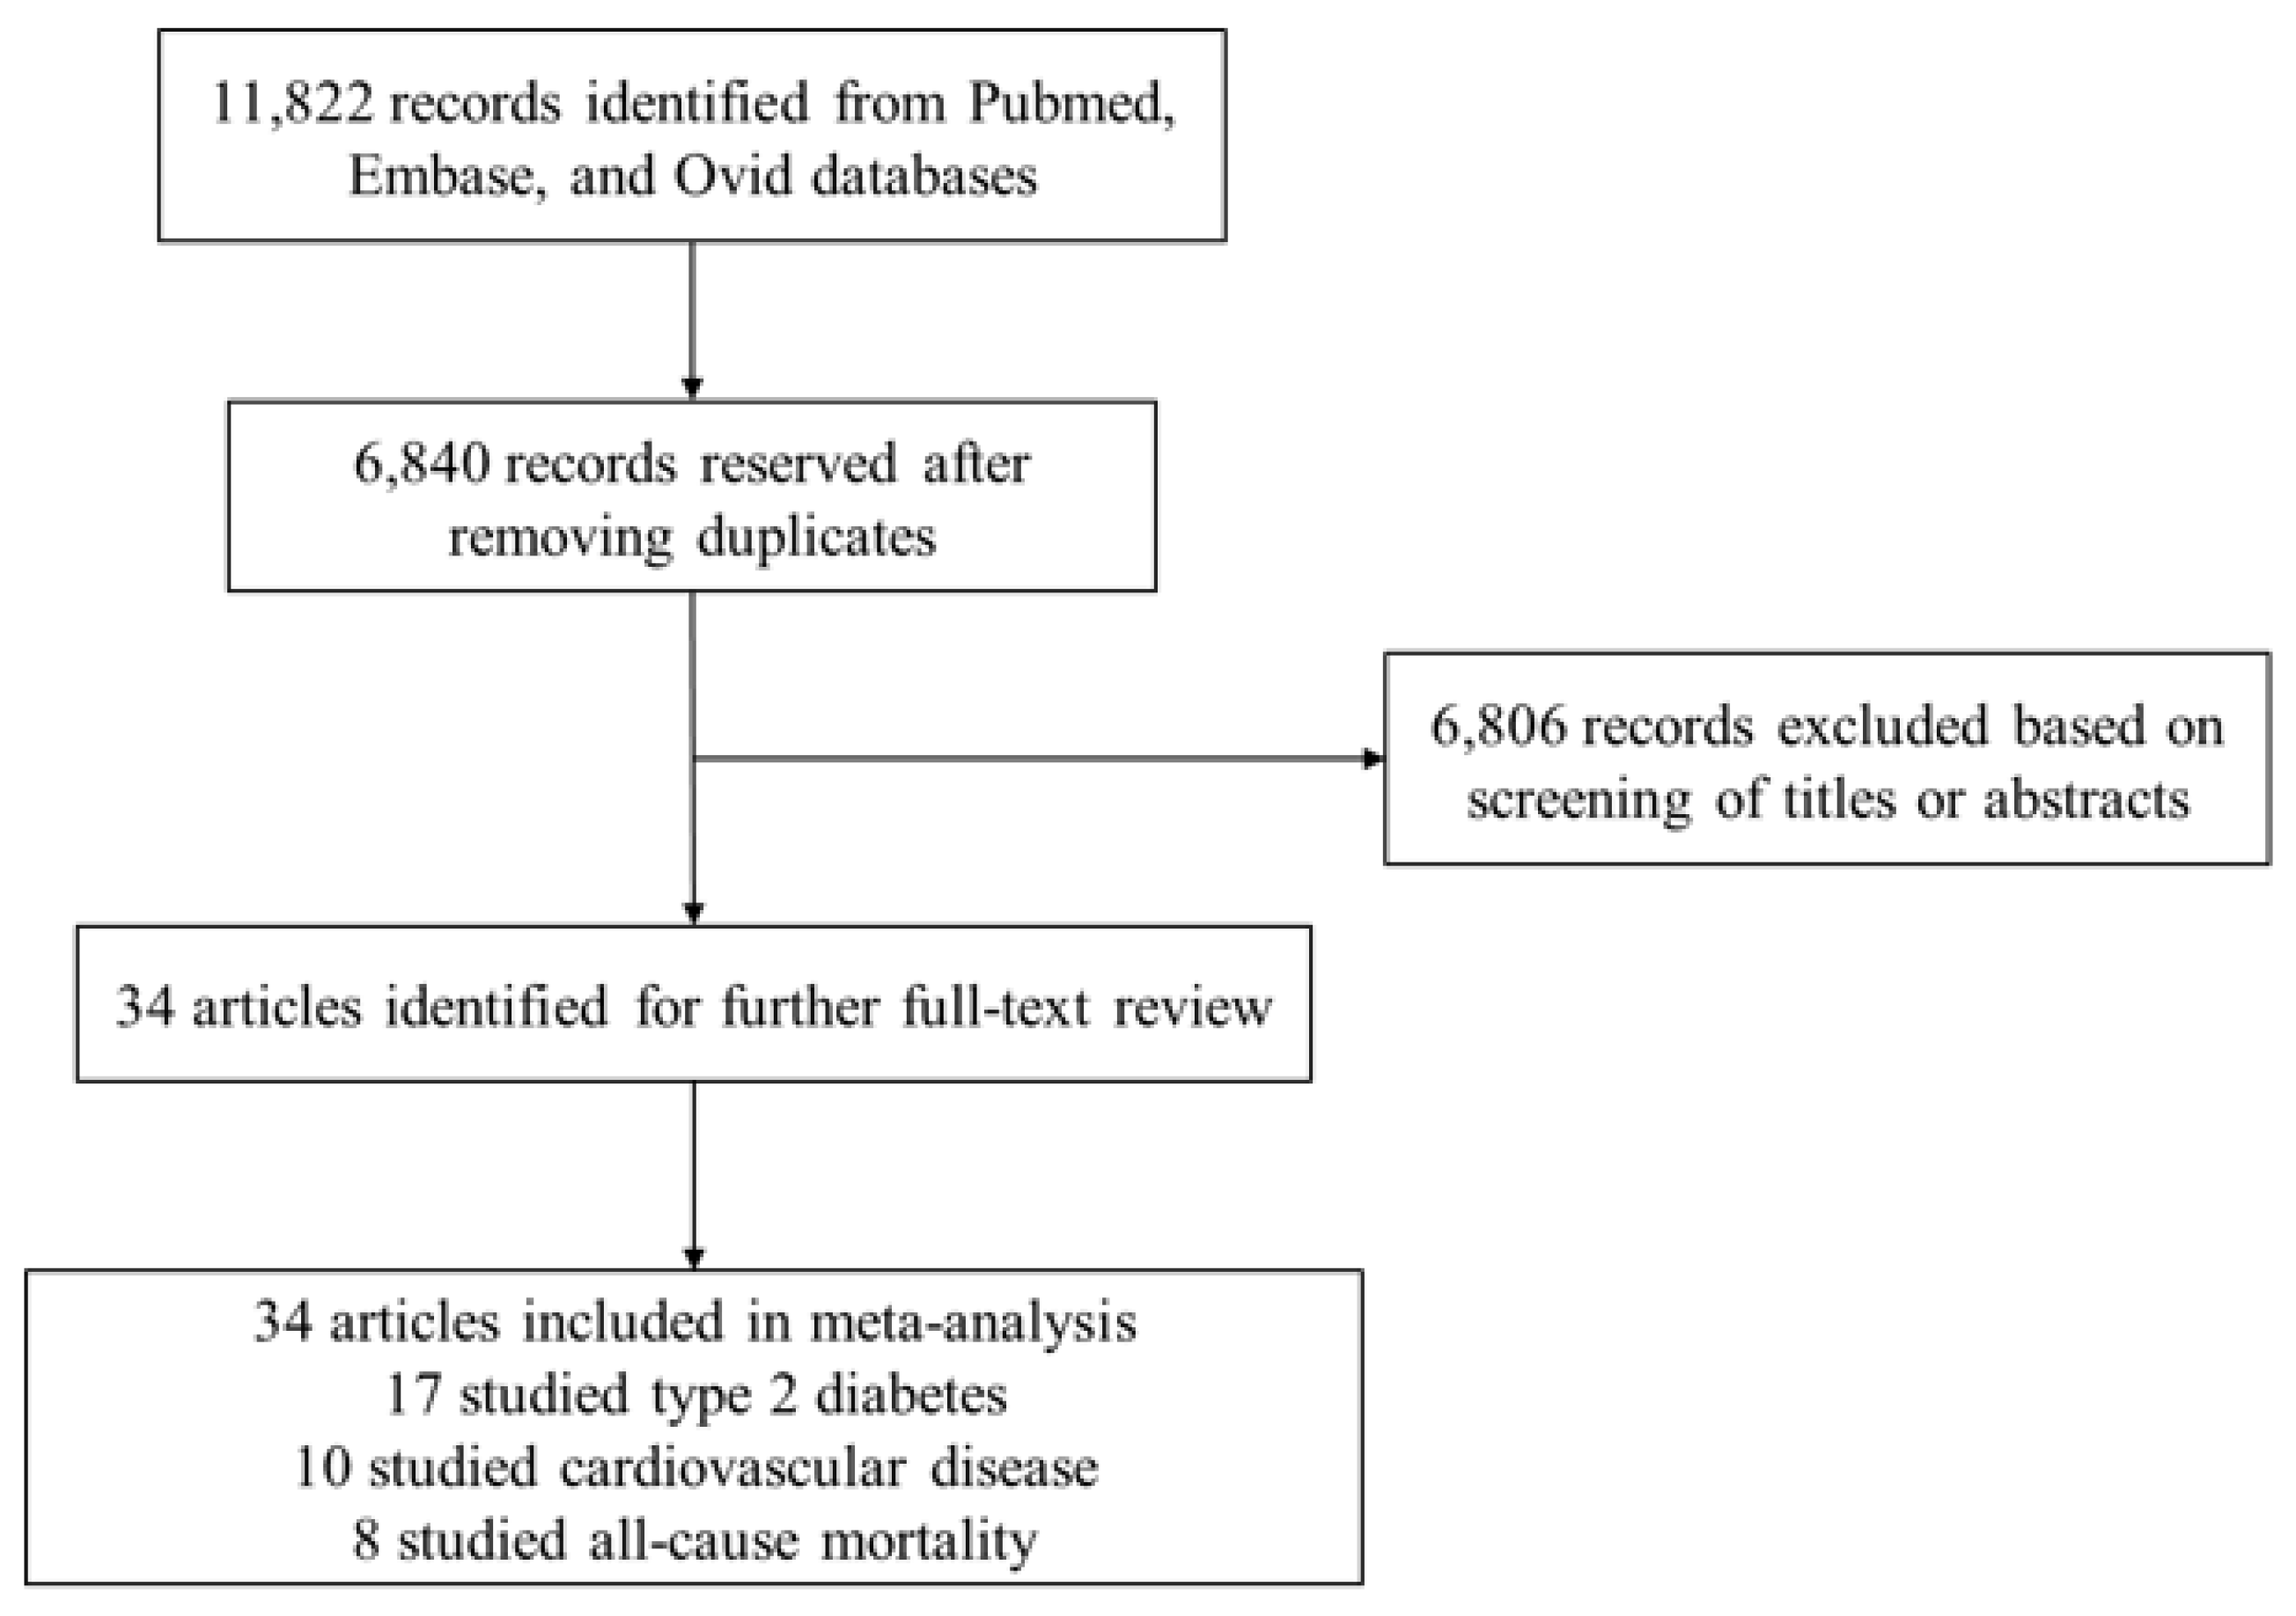
Abstract
:1. Introduction
2. Materials and Methods
2.1. Search Strategy
2.2. Eligibility and Study Selection
2.3. Data Extraction and Quality Assessment
2.4. Statistical Methods
3. Results
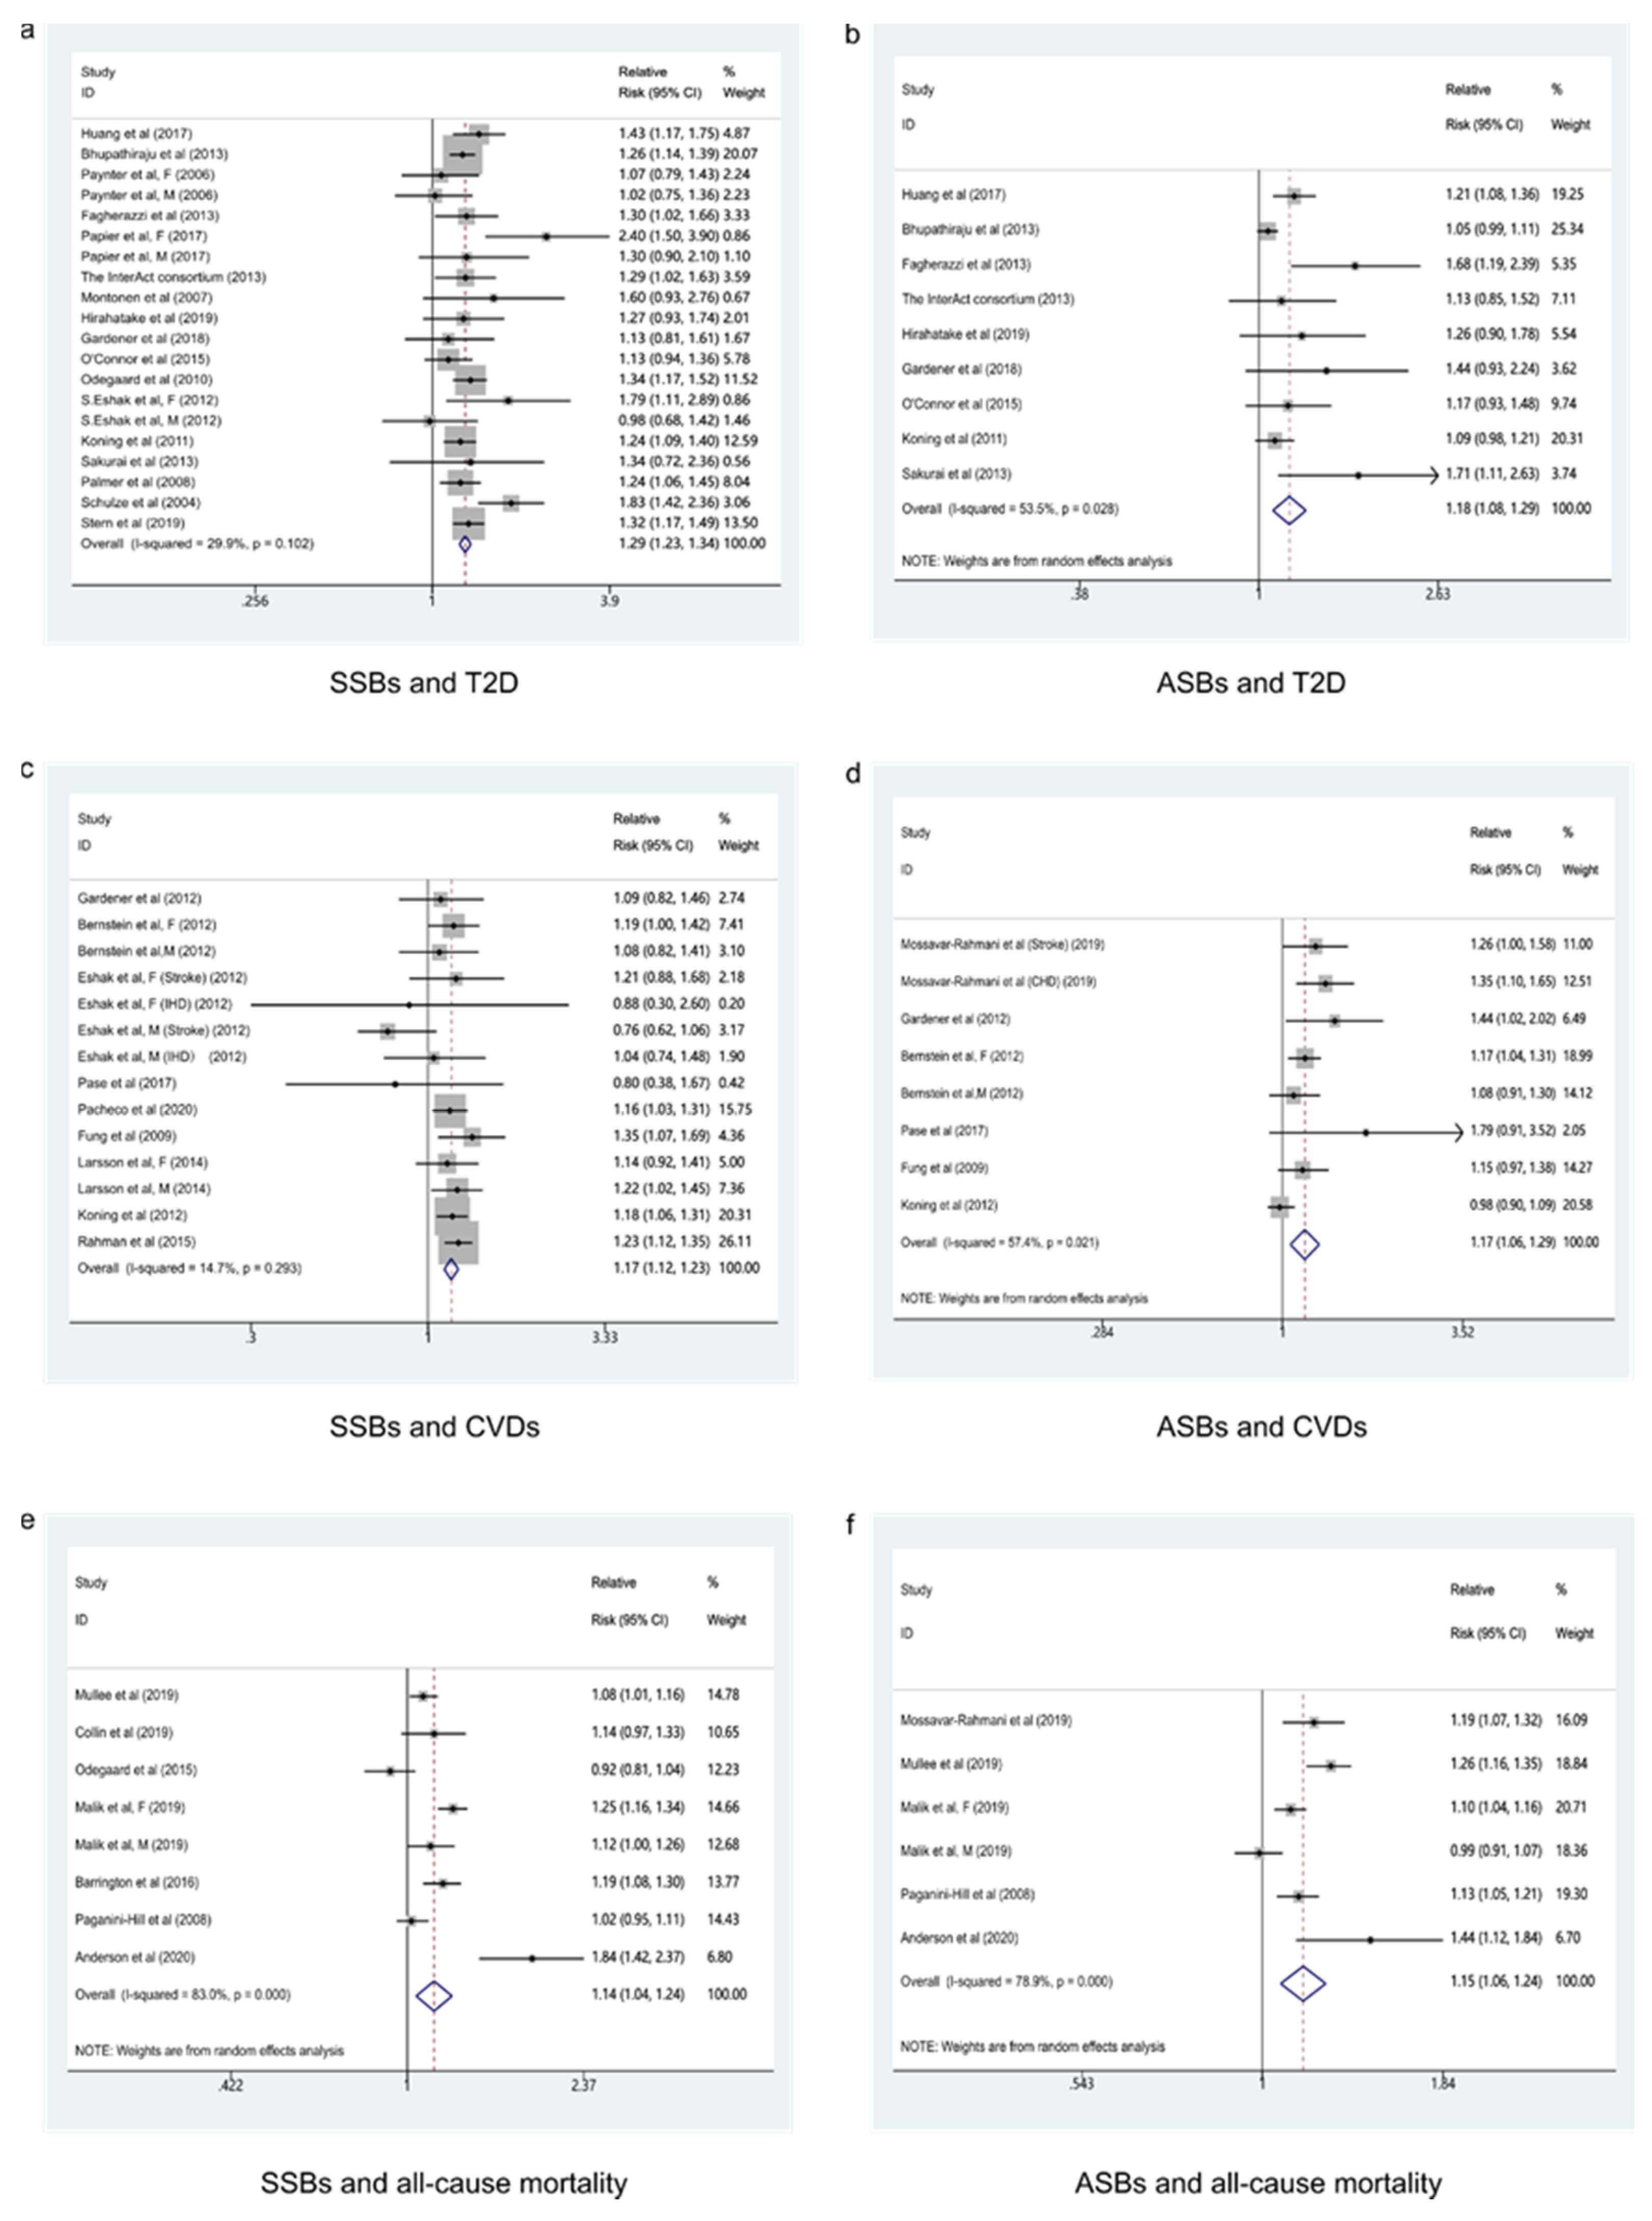
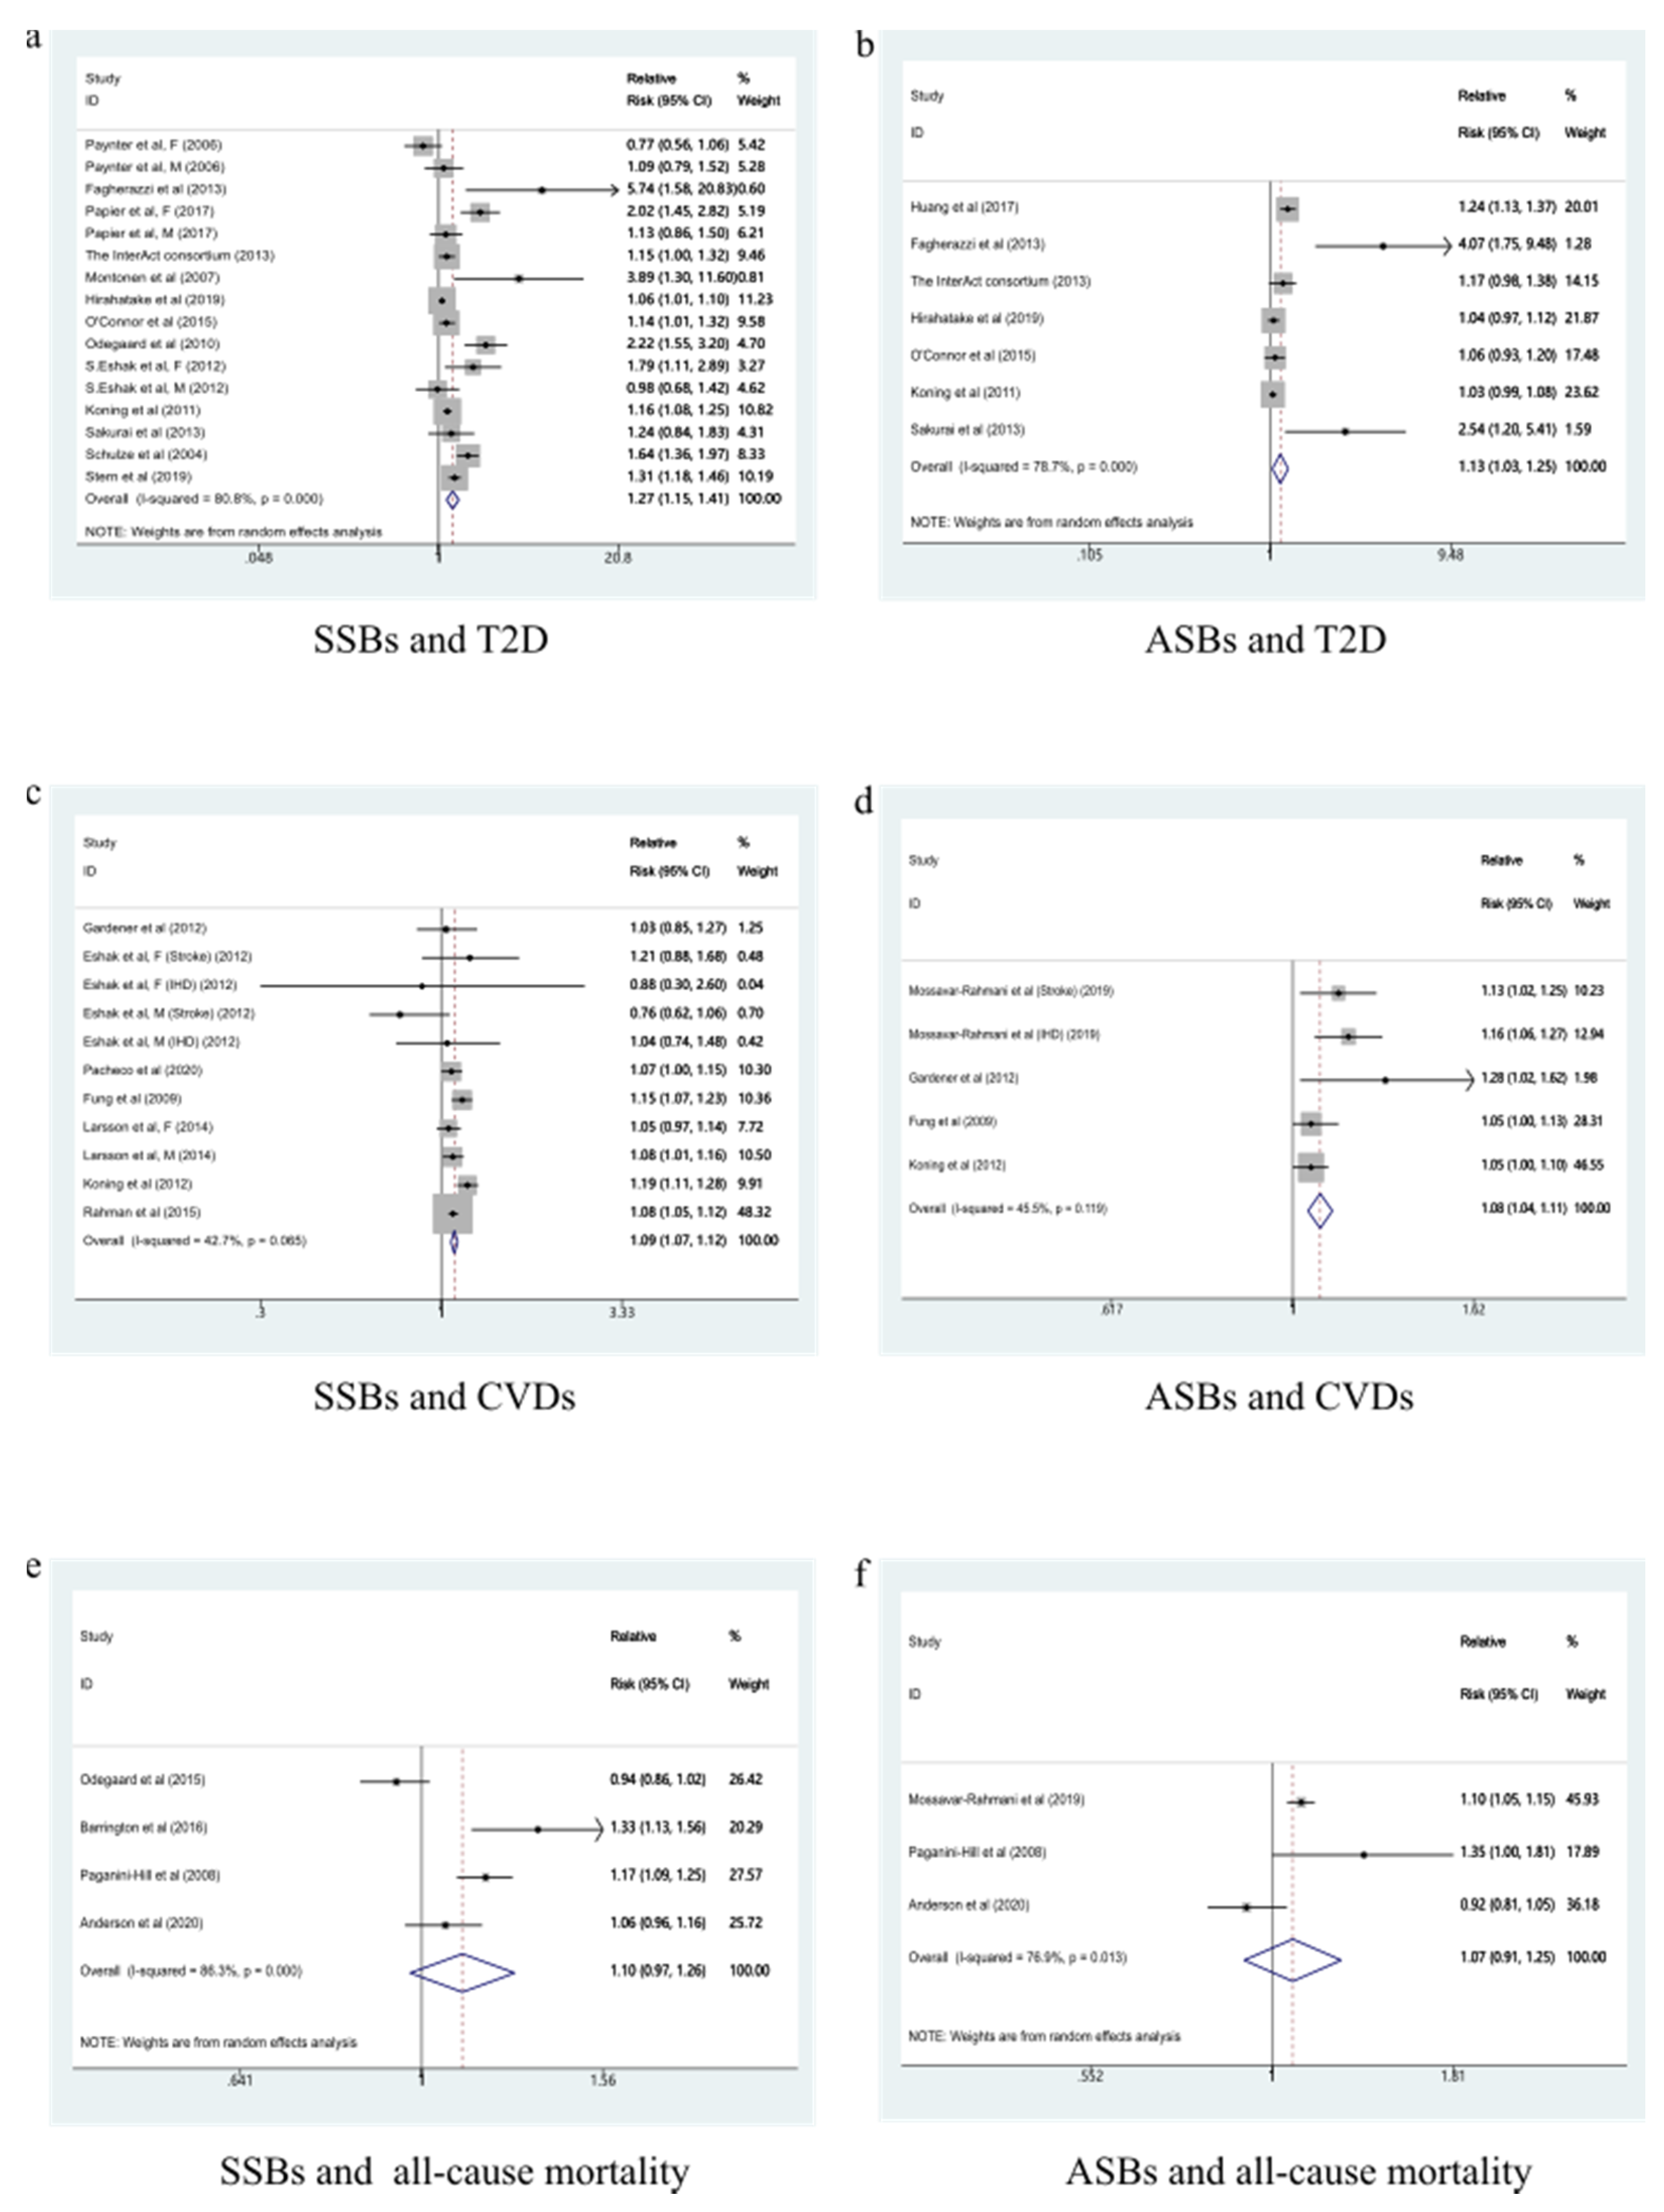
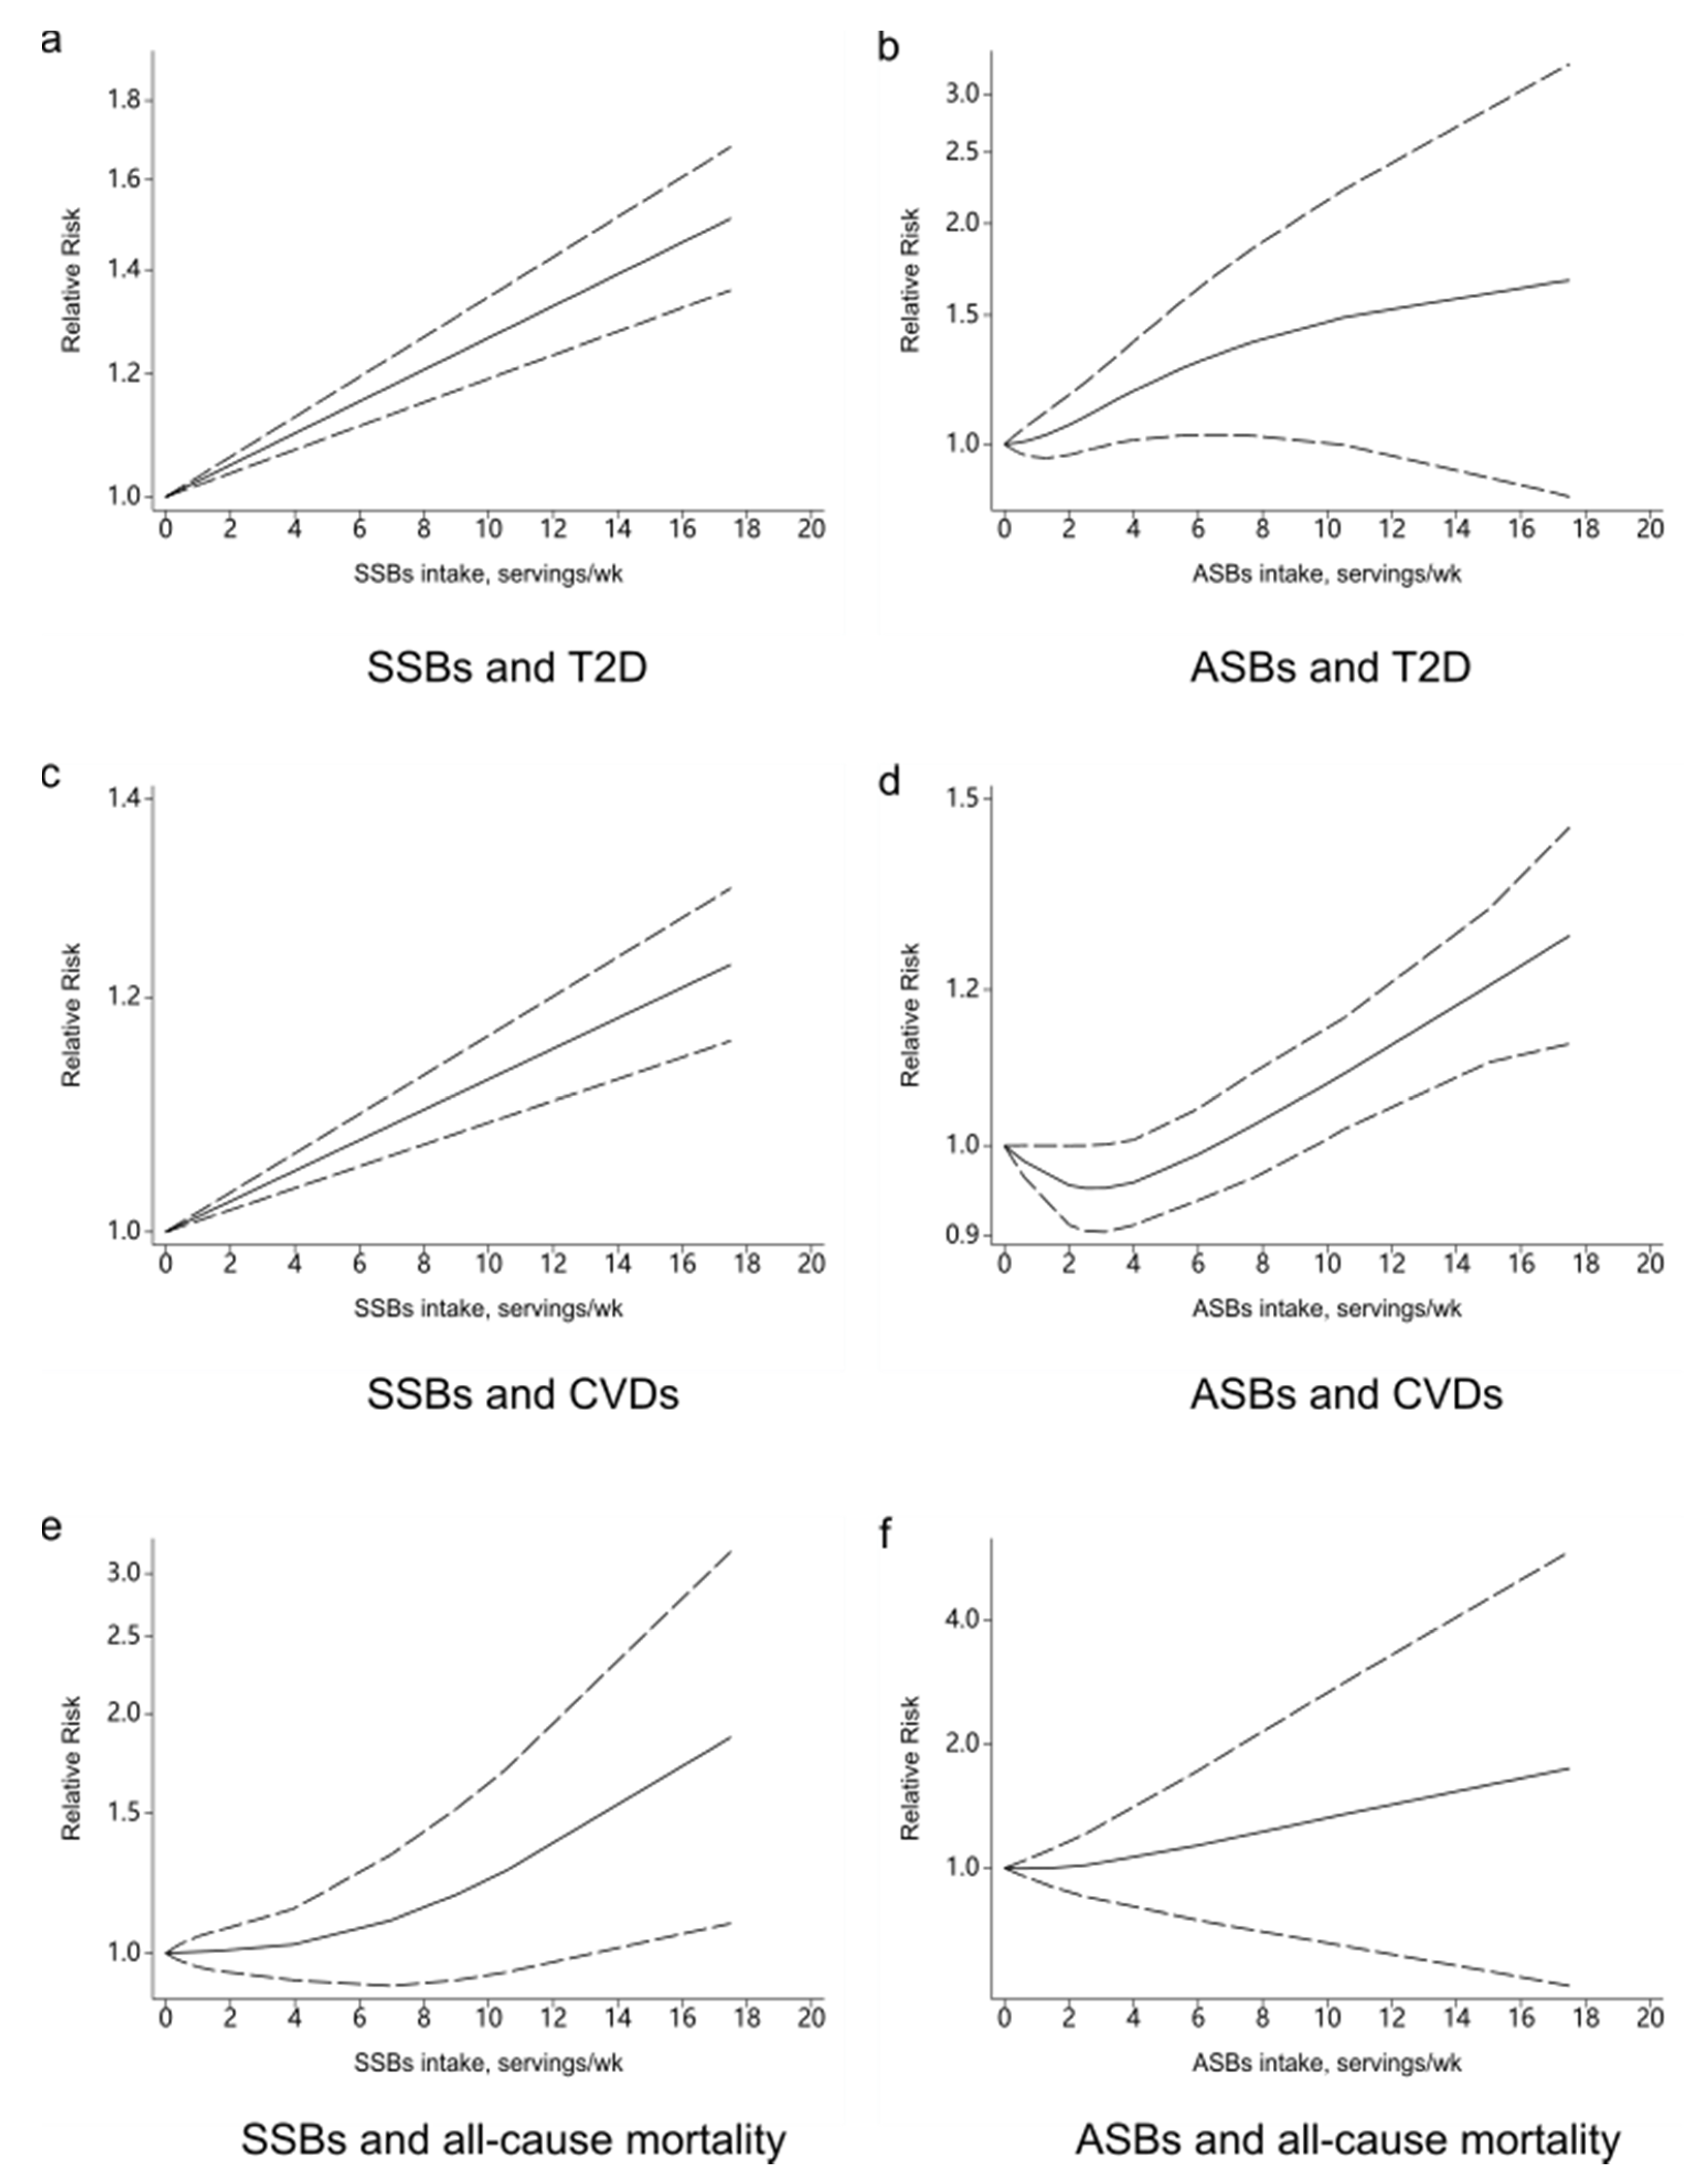
3.1. Beverage Intake and T2D
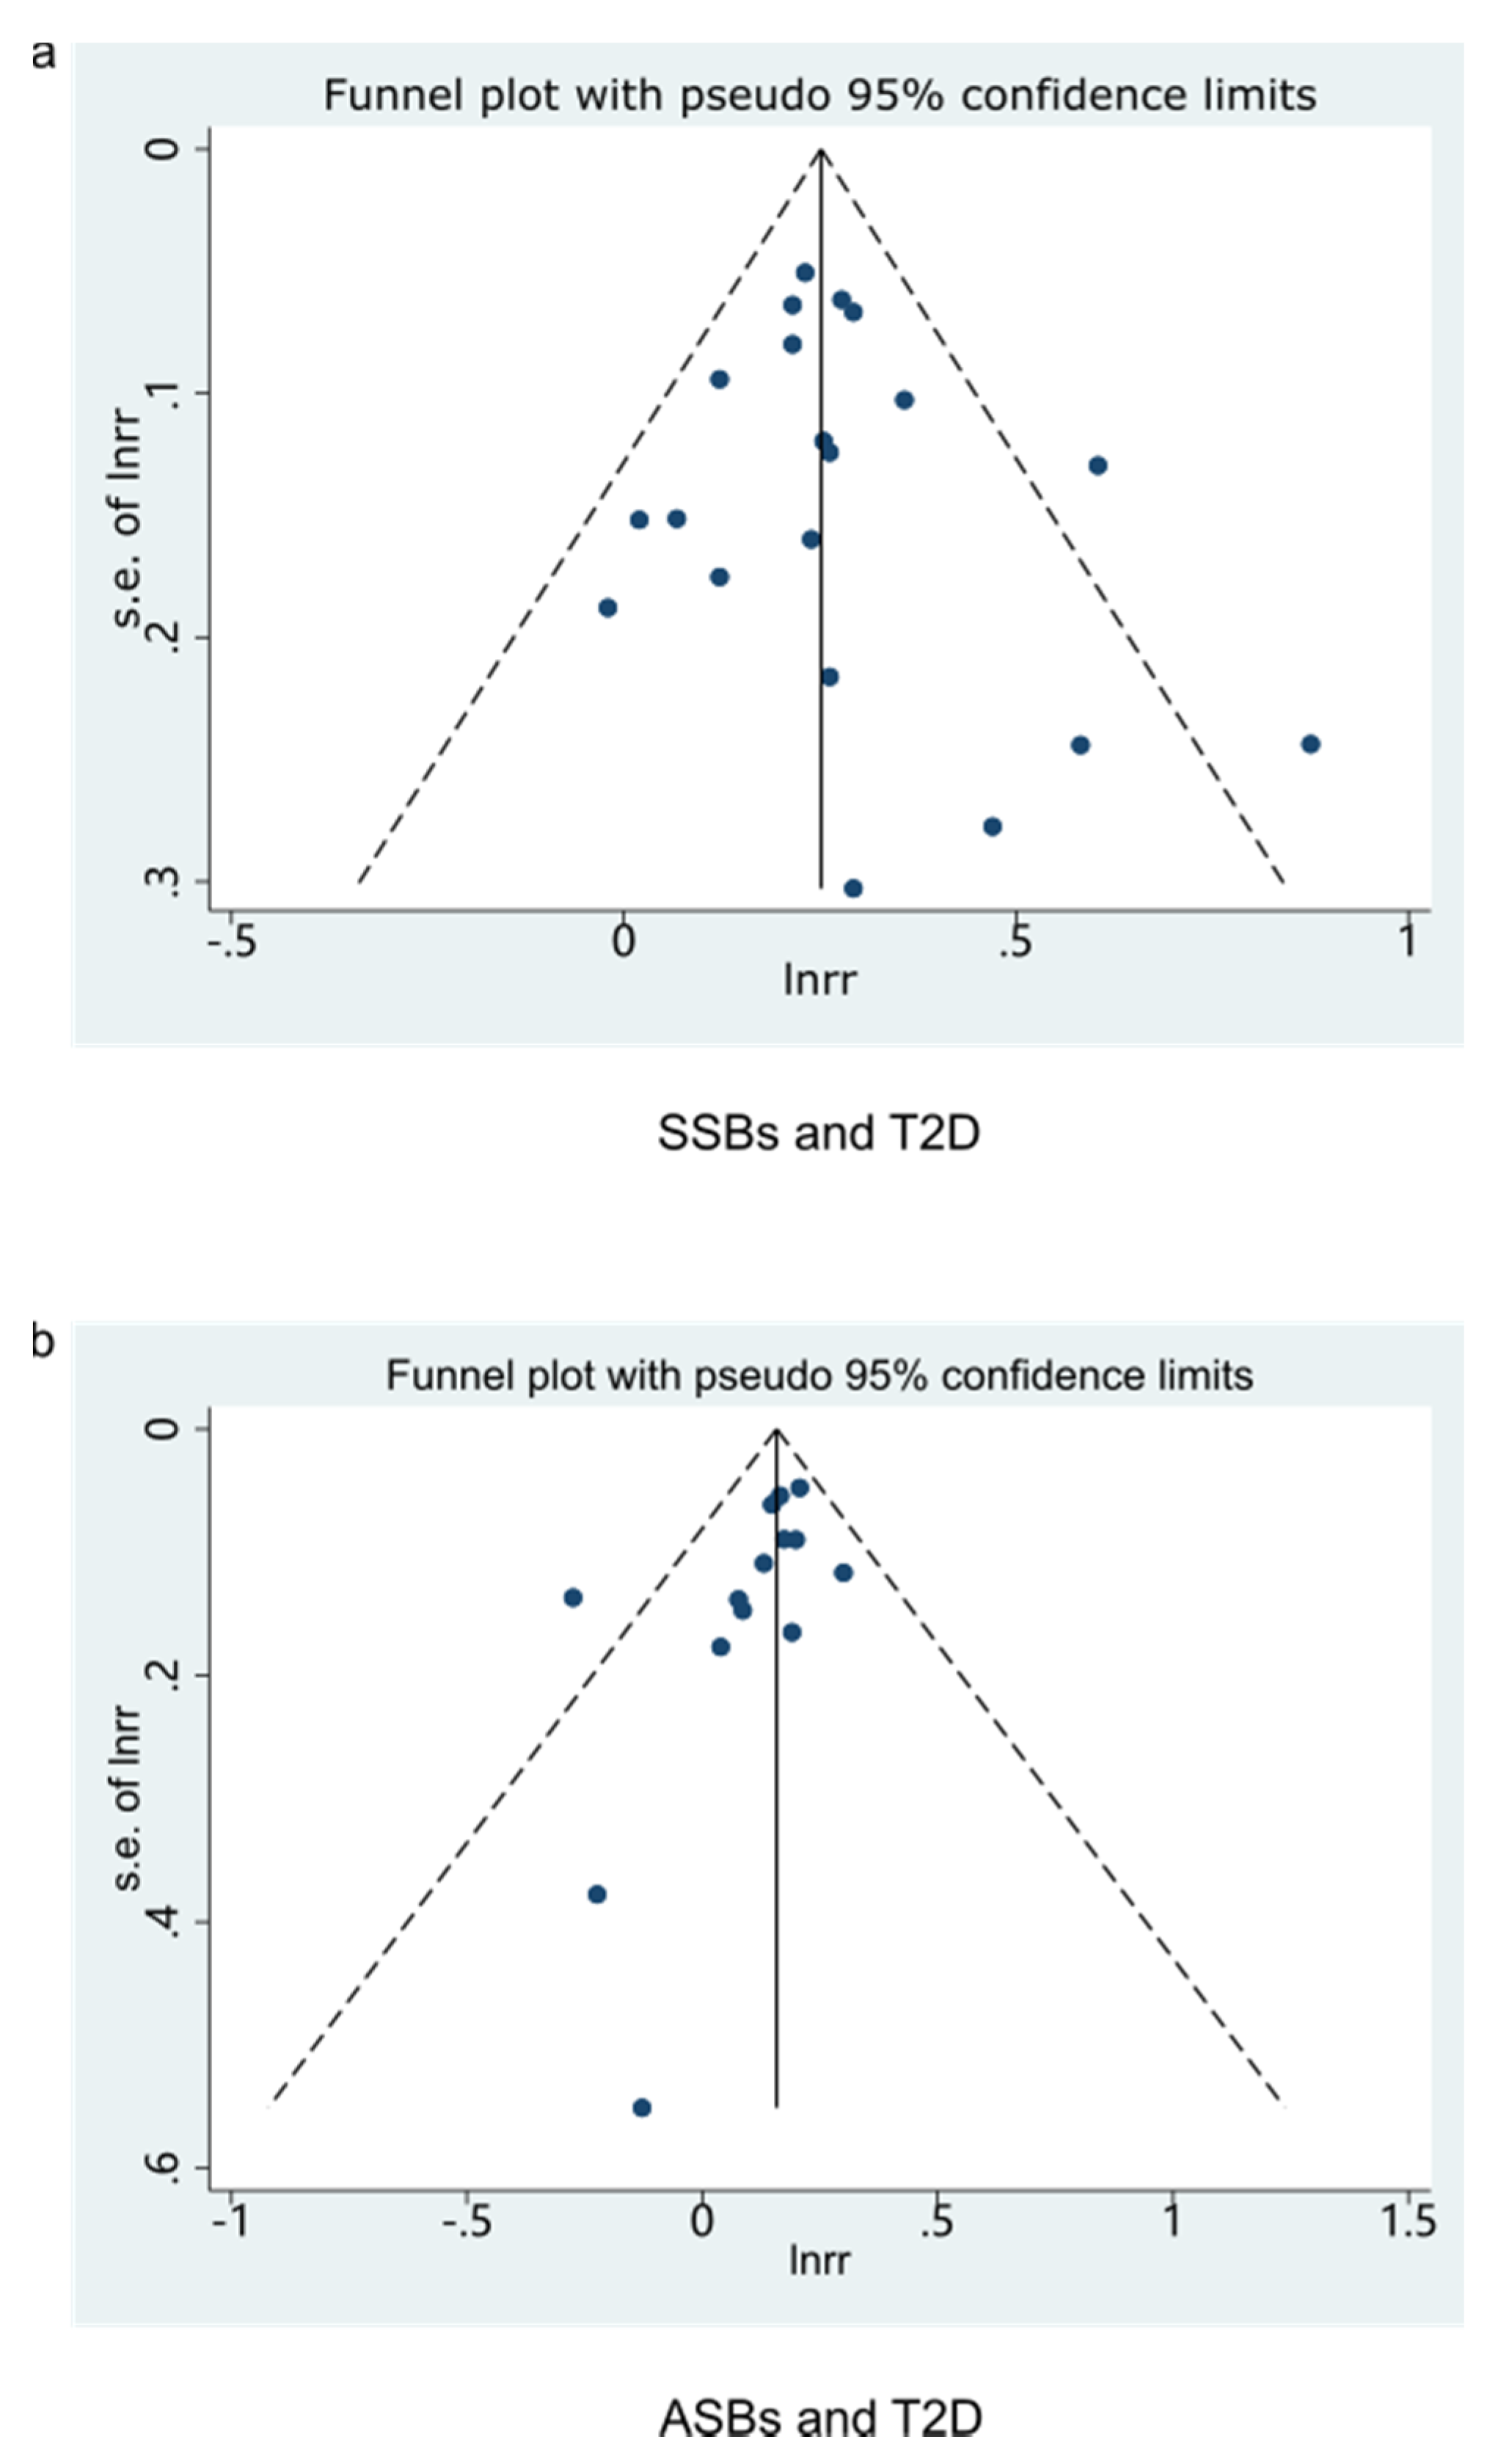
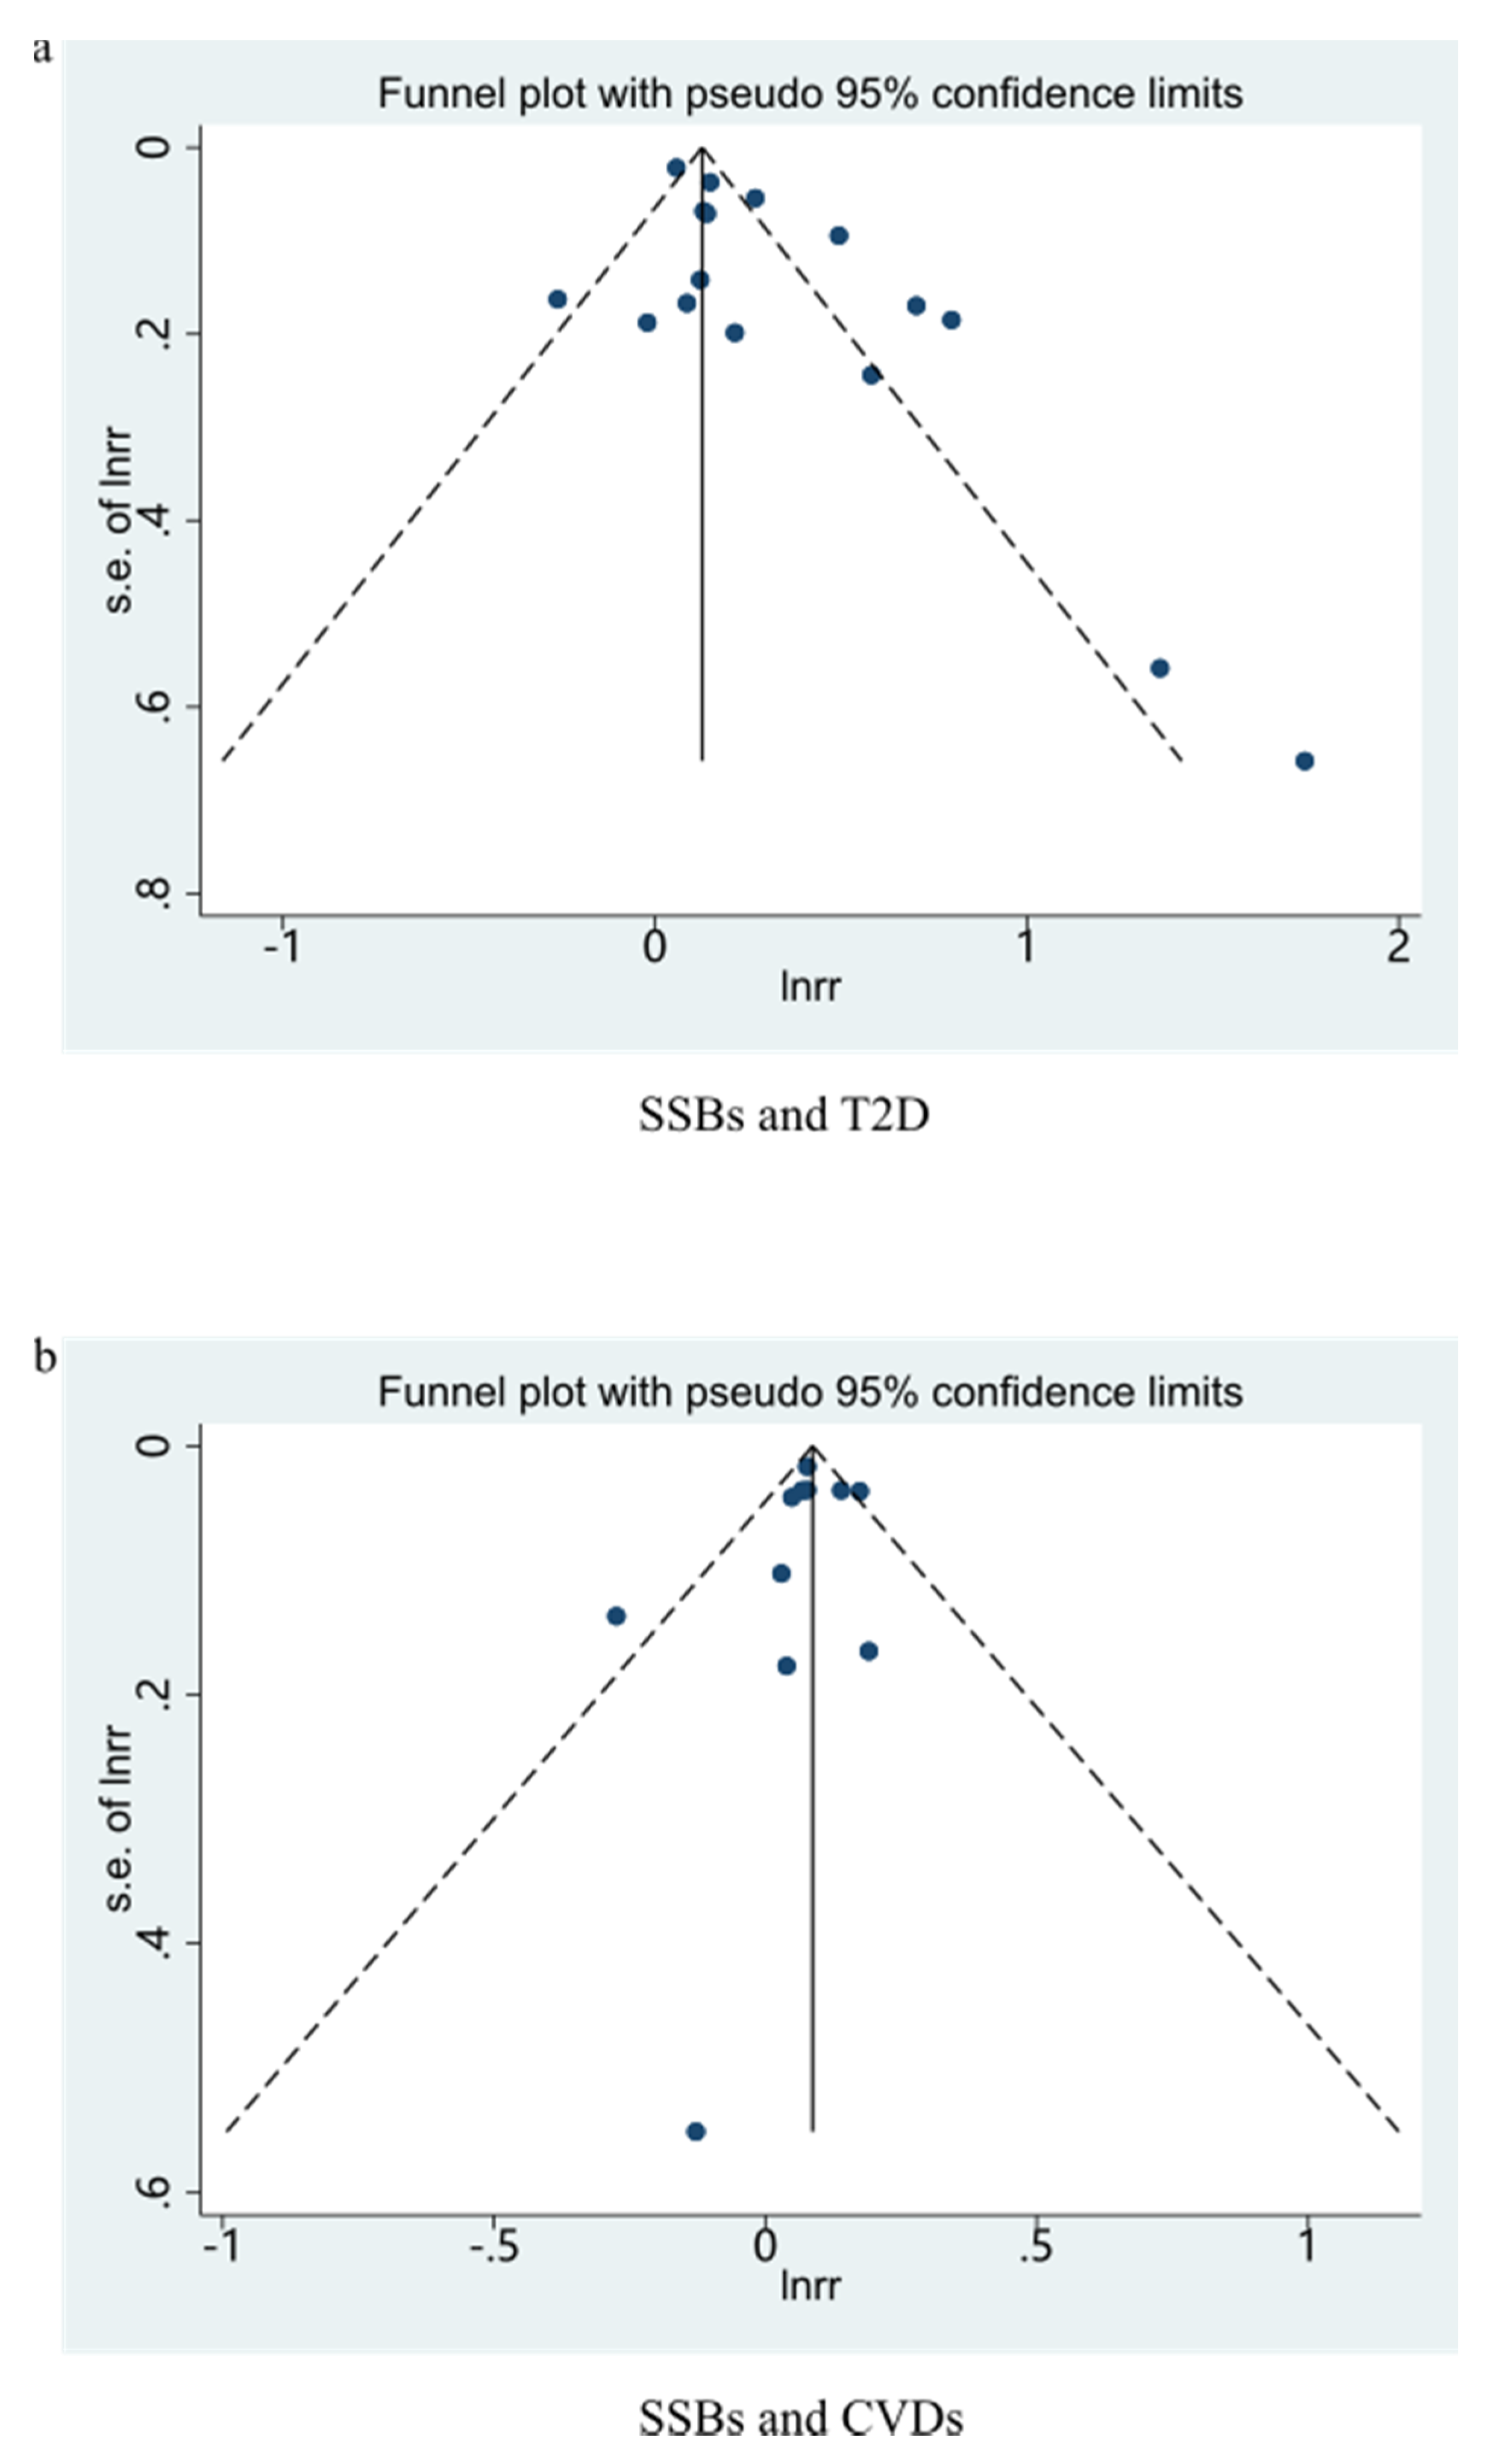
3.1.1. SSBs and T2D
3.1.2. ASBs and T2D
3.2. Beverage Intake and CVDs
3.2.1. SSBs and CVDs
3.2.2. ASBs and CVDs
3.3. Beverage Intake and All-Cause Mortality
3.3.1. SSBs and All-Cause Mortality
3.3.2. ASBs and All-Cause Mortality
3.4. Subgroup Analysis
4. Discussion
5. Conclusions
Supplementary Materials
Author Contributions
Funding
Institutional Review Board Statement
Informed Consent Statement
Data Availability Statement
Conflicts of Interest
References
- Singh, G.M.; Micha, R.; Khatibzadeh, S.; Shi, P.; Lim, S.; Andrews, K.G.; Engell, R.E.; Ezzati, M.; Mozaffarian, D. Global, regional, and national consumption of sugar-sweetened beverages, fruit juices, and milk: A systematic assessment of beverage intake in 187 countries. PLoS ONE 2015, 10, e124845. [Google Scholar] [CrossRef] [Green Version]
- Piernas, C.; Popkin, B.M. Increased portion sizes from energy-dense foods affect total energy intake at eating occasions in US children and adolescents: Patterns and trends by age group and sociodemographic characteristics, 1977–2006. Am. J. Clin. Nutr. 2011, 94, 1324–1332. [Google Scholar] [CrossRef]
- Greenwood, D.C.; Threapleton, D.E.; Evans, C.E.L.; Cleghorn, C.L.; Nykjaer, C.; Woodhead, C.; Burley, V.J. Association between sugar-sweetened and artificially sweetened soft drinks and type 2 diabetes: Systematic review and dose–response meta-analysis of prospective studies. Br. J. Nutr. 2014, 112, 725–734. [Google Scholar] [CrossRef]
- Dawes, E.; D’Onise, K.; Spurrier, N. Trends in soft drink and sugar-sweetened beverage consumption among South Australians, focusing on distribution of intake by subpopulation. Aust. N. Z. J. Public Health 2020, 44, 410–418. [Google Scholar] [CrossRef]
- Marriott, B.P.; Hunt, K.J.; Malek, A.M.; Newman, J.C. Trends in intake of energy and total sugar from sugar-sweetened beverages in the United States among children and adults, NHANES 2003–2016. Nutrients 2019, 11, 2004. [Google Scholar] [CrossRef] [PubMed] [Green Version]
- Bleich, S.N.; Wang, Y.C.; Wang, Y.; Gortmaker, S.L. Increasing consumption of sugar-sweetened beverages among US adults: 1988–1994 to 1999–2004. Am. J. Clin. Nutr. 2009, 89, 372–381. [Google Scholar] [CrossRef] [PubMed] [Green Version]
- Rosinger, A.; Herrick, K.; Gahche, J.; Park, S. Sugar-Sweetened Beverage Consumption among U.S. Adults, 2011–2014. NCHS Data Brief. 2017, 217, 1–8. [Google Scholar]
- Drewnowski, A.; Rehm, C.D. Consumption of added sugars among US children and adults by food purchase location and food source. Am. J. Clin. Nutr. 2014, 100, 901–907. [Google Scholar] [CrossRef] [Green Version]
- Lim, H.; Lee, H.J.; Choue, R.; Wang, Y. Trends in fast-food and sugar-sweetened beverage consumption and their association with social environmental status in South Korea. J. Acad. Nutr. Diet. 2018, 118, 1228–1236. [Google Scholar] [CrossRef]
- Guo, H.; Zhao, L.; Xu, X.; Yu, W.; Ju, L.; Yu, D. Consumption of sugar-sweetened beverages among 18 years old and over adults in 2010–2012 in China. Wei Sheng Yan Jiu 2018, 47, 22–26. [Google Scholar]
- Popkin, B.M.; Hawkes, C. Sweetening of the global diet, particularly beverages: Patterns, trends, and policy responses. Lancet Diabetes Endocrinol. 2016, 4, 174–186. [Google Scholar] [CrossRef] [Green Version]
- Ruanpeng, D.; Thongprayoon, C.; Cheungpasitporn, W.; Harindhanavudhi, T. Sugar and artificially sweetened beverages linked to obesity: A systematic review and meta-analysis. QJM 2017, 110, 513–520. [Google Scholar] [CrossRef] [Green Version]
- Sylvetsky, A.C.; Welsh, J.A.; Brown, R.J.; Vos, M.B. Low-calorie sweetener consumption is increasing in the United States. Am. J. Clin. Nutr. 2012, 96, 640–646. [Google Scholar] [CrossRef] [Green Version]
- Shrapnel, W.S.; Butcher, B.E. Sales of sugar-sweetened beverages in Australia: A trend analysis from 1997 to 2018. Nutrients 2020, 12, 1016. [Google Scholar] [CrossRef] [PubMed] [Green Version]
- Einarson, T.R.; Acs, A.; Ludwig, C.; Panton, U.H. Prevalence of cardiovascular disease in type 2 diabetes: A systematic literature review of scientific evidence from across the world in 2007–2017. Cardiovasc. Diabetol. 2018, 17, 83. [Google Scholar] [CrossRef] [PubMed] [Green Version]
- Brunkwall, L.; Chen, Y.; Hindy, G.; Rukh, G.; Ericson, U.; Barroso, I.; Johansson, I.; Franks, P.W.; Orho-Melander, M.; Renström, F. Sugar-sweetened beverage consumption and genetic predisposition to obesity in 2 Swedish cohorts. Am. J. Clin. Nutr. 2016, 104, 809–815. [Google Scholar] [CrossRef]
- De Koning, L.; Malik, V.S.; Rimm, E.B.; Willett, W.C.; Hu, F.B. Sugar-sweetened and artificially sweetened beverage consumption and risk of type 2 diabetes in men. Am. J. Clin. Nutr. 2011, 93, 1321–1327. [Google Scholar] [CrossRef] [PubMed] [Green Version]
- Keller, A.; O’Reilly, E.J.; Malik, V.; Buring, J.E.; Andersen, I.; Steffen, L.; Robien, K.; Männistö, S.; Rimm, E.B.; Willett, W.; et al. Substitution of sugar-sweetened beverages for other beverages and the risk of developing coronary heart disease: Results from the Harvard Pooling Project of Diet and Coronary Disease. Prev. Med. 2020, 131, 105970. [Google Scholar] [CrossRef] [PubMed]
- Pase, M.P.; Himali, J.J.; Beiser, A.S.; Aparicio, H.J.; Satizabal, C.L.; Vasan, R.S.; Seshadri, S.; Jacques, P.F. Sugar- and artificially sweetened beverages and the risks of incident stroke and dementia. Stroke 2017, 48, 1139–1146. [Google Scholar] [CrossRef] [Green Version]
- Malik, V.S.; Li, Y.; Pan, A.; De Koning, L.; Schernhammer, E.; Willett, W.C.; Hu, F.B. Long-term consumption of sugar-sweetened and artificially sweetened beverages and risk of mortality in US adults. Circulation 2019, 139, 2113–2125. [Google Scholar] [CrossRef]
- Paynter, N.P.; Yeh, H.C.; Voutilainen, S.; Schmidt, M.I.; Heiss, G.; Folsom, A.R.; Brancati, F.L.; Kao, W.H. Coffee and sweetened beverage consumption and the risk of type 2 diabetes mellitus: The atherosclerosis risk in communities study. Am. J. Epidemiol. 2006, 164, 1075–1084. [Google Scholar] [CrossRef] [PubMed] [Green Version]
- Odegaard, A.O.; Koh, W.P.; Yuan, J.M.; Pereira, M.A. Beverage habits and mortality in Chinese adults. J. Nutr. 2015, 145, 595–604. [Google Scholar] [CrossRef] [Green Version]
- Ferreira-Pêgo, C.; Babio, N.; Bes-Rastrollo, M.; Corella, D.; Estruch, R.; Ros, E.; Fitó, M.; Serra-Majem, L.; Arós, F.; Fiol, M.; et al. Frequent consumption of sugar- and artificially sweetened beverages and natural and bottled fruit juices is associated with an increased risk of metabolic syndrome in a Mediterranean population at high cardiovascular disease risk. J. Nutr. 2016, 146, 1528–1536. [Google Scholar] [CrossRef] [PubMed] [Green Version]
- Mossavar-Rahmani, Y.; Kamensky, V.; Manson, J.E.; Silver, B.; Rapp, S.R.; Haring, B.; Beresford, S.; Snetselaar, L.; Wassertheil-Smoller, S. Artificially sweetened beverages and stroke, coronary heart disease, and all-cause mortality in the women’s health initiative. Stroke 2019, 50, 555–562. [Google Scholar] [CrossRef] [PubMed]
- Imamura, F.; O’Connor, L.; Ye, Z.; Mursu, J.; Hayashino, Y.; Bhupathiraju, S.N.; Forouhi, N.G. Consumption of sugar sweetened beverages, artificially sweetened beverages, and fruit juice and incidence of type 2 diabetes: Systematic review, meta-analysis, and estimation of population attributable fraction. Br. J. Sports Med. 2016, 50, 496–504. [Google Scholar] [CrossRef]
- Malik, V.S.; Popkin, B.M.; Bray, G.A.; Despres, J.P.; Willett, W.C.; Hu, F.B. Sugar-sweetened beverages and risk of metabolic syndrome and type 2 diabetes: A meta-analysis. Diabetes Care 2010, 33, 2477–2483. [Google Scholar] [CrossRef] [PubMed] [Green Version]
- Yin, J.; Zhu, Y.; Malik, V.; Li, X.; Peng, X.; Zhang, F.F.; Shan, Z.; Liu, L. Intake of sugar-sweetened and low-calorie sweetened beverages and risk of cardiovascular disease: A meta-analysis and systematic review. Adv. Nutr. 2020, 12, 89–101. [Google Scholar] [CrossRef]
- Qin, P.; Li, Q.; Zhao, Y.; Chen, Q.; Sun, X.; Liu, Y.; Li, H.; Wang, T.; Chen, X.; Zhou, Q.; et al. Sugar and artificially sweetened beverages and risk of obesity, type 2 diabetes mellitus, hypertension, and all-cause mortality: A dose-response meta-analysis of prospective cohort studies. Eur. J. Epidemiol. 2020, 35, 655–671. [Google Scholar] [CrossRef] [PubMed]
- Liberati, A.; Altman, D.G.; Tetzlaff, J.; Mulrow, C.; Gøtzsche, P.C.; Ioannidis, J.P.; Clarke, M.; Devereaux, P.J.; Kleijnen, J.; Moher, D. The PRISMA statement for reporting systematic reviews and meta-analyses of studies that evaluate healthcare interventions: Explanation and elaboration. BMJ 2009, 339, b2700. [Google Scholar] [CrossRef] [Green Version]
- DerSimonian, R.; Laird, N. Meta-analysis in clinical trials. Control Clin. Trials 1986, 7, 177–188. [Google Scholar] [CrossRef]
- Higgins, J.P.; Thompson, S.G. Quantifying heterogeneity in a meta-analysis. Stat. Med. 2002, 21, 1539–1558. [Google Scholar] [CrossRef] [PubMed]
- Naghshi, S.; Sadeghi, O.; Willett, W.C.; Esmaillzadeh, A. Dietary intake of total, animal, and plant proteins and risk of all cause, cardiovascular, and cancer mortality: Systematic review and dose-response meta-analysis of prospective cohort studies. BMJ 2020, 370, m2412. [Google Scholar] [CrossRef] [PubMed]
- Begg, C.B.; Mazumdar, M. Operating characteristics of a rank correlation test for publication bias. Biometrics 1994, 50, 1088–1101. [Google Scholar] [CrossRef]
- Egger, M.; Davey, S.G.; Schneider, M.; Minder, C. Bias in meta-analysis detected by a simple, graphical test. BMJ 1997, 315, 629–634. [Google Scholar] [CrossRef] [Green Version]
- Aune, D.; Chan, D.S.; Lau, R.; Vieira, R.; Greenwood, D.C.; Kampman, E.; Norat, T. Dietary fibre, whole grains, and risk of colorectal cancer: Systematic review and dose-response meta-analysis of prospective studies. BMJ 2011, 343, d6617. [Google Scholar] [CrossRef] [PubMed] [Green Version]
- Schwingshackl, L.; Schwedhelm, C.; Hoffmann, G.; Lampousi, A.M.; Knuppel, S.; Iqbal, K.; Bechthold, A.; Schlesinger, S.; Boeing, H. Food groups and risk of all-cause mortality: A systematic review and meta-analysis of prospective studies. Am. J. Clin. Nutr. 2017, 105, 1462–1473. [Google Scholar] [CrossRef] [PubMed] [Green Version]
- Jayedi, A.; Shab-Bidar, S.; Eimeri, S.; Djafarian, K. Fish consumption and risk of all-cause and cardiovascular mortality: A dose-response meta-analysis of prospective observational studies. Public Health Nutr. 2018, 21, 1297–1306. [Google Scholar] [CrossRef] [PubMed]
- Bhupathiraju, S.N.; Pan, A.; Malik, V.S.; Manson, J.E.; Willett, W.C.; van Dam, R.M.; Hu, F.B. Caffeinated and caffeine-free beverages and risk of type 2 diabetes. Am. J. Clin. Nutr. 2013, 97, 155–166. [Google Scholar] [CrossRef] [Green Version]
- Gardener, H.; Moon, Y.P.; Rundek, T.; Elkind, M.; Sacco, R.L. Diet soda and sugar-sweetened soda consumption in relation to incident diabetes in the Northern Manhattan study. Curr. Dev. Nutr. 2018, 2, y8. [Google Scholar] [CrossRef] [Green Version]
- Palmer, J.R.; Boggs, D.A.; Krishnan, S.; Hu, F.B.; Singer, M.; Rosenberg, L. Sugar-sweetened beverages and incidence of type 2 diabetes mellitus in African American women. Arch. Intern. Med. 2008, 168, 1487–1492. [Google Scholar] [CrossRef]
- Bernstein, A.M.; de Koning, L.; Flint, A.J.; Rexrode, K.M.; Willett, W.C. Soda consumption and the risk of stroke in men and women. Am. J. Clin. Nutr. 2012, 95, 1190–1199. [Google Scholar] [CrossRef] [PubMed]
- Mullee, A.; Romaguera, D.; Pearson-Stuttard, J.; Viallon, V.; Stepien, M.; Freisling, H.; Fagherazzi, G.; Mancini, F.R.; Boutron-Ruault, M.; Kühn, T.; et al. Association between soft drink consumption and mortality in 10 European countries. JAMA Intern. Med. 2019, 179, 1479. [Google Scholar] [CrossRef] [PubMed] [Green Version]
- Collin, L.J.; Judd, S.; Safford, M.; Vaccarino, V.; Welsh, J.A. Association of sugary beverage consumption with mortality risk in US Adults. JAMA Netw. Open 2019, 2, e193121. [Google Scholar] [CrossRef] [PubMed]
- Berlin, J.A.; Longnecker, M.P.; Greenland, S. Meta-analysis of epidemiologic dose-response data. Epidemiology 1993, 4, 218–228. [Google Scholar] [CrossRef]
- Xi, B.; Huang, Y.; Reilly, K.H.; Li, S.; Zheng, R.; Barrio-Lopez, M.T.; Martinez-Gonzalez, M.A.; Zhou, D. Sugar-sweetened beverages and risk of hypertension and CVD: A dose-response meta-analysis. Br. J. Nutr. 2015, 113, 709–717. [Google Scholar] [CrossRef] [Green Version]
- Sakurai, M.; Nakamura, K.; Miura, K.; Takamura, T.; Yoshita, K.; Nagasawa, S.Y.; Morikawa, Y.; Ishizaki, M.; Kido, T.; Naruse, Y.; et al. Sugar-sweetened beverage and diet soda consumption and the 7-year risk for type 2 diabetes mellitus in middle-aged Japanese men. Eur. J. Nutr. 2014, 53, 251–258. [Google Scholar] [CrossRef]
- Huang, M.; Quddus, A.; Stinson, L.; Shikany, J.M.; Howard, B.V.; Kutob, R.M.; Lu, B.; Manson, J.E.; Eaton, C.B. Artificially sweetened beverages, sugar-sweetened beverages, plain water, and incident diabetes mellitus in postmenopausal women: The prospective Women’s Health Initiative observational study. Am. J. Clin. Nutr. 2017, 106, 614–622. [Google Scholar] [CrossRef] [Green Version]
- Fagherazzi, G.; Vilier, A.; Saes Sartorelli, D.; Lajous, M.; Balkau, B.; Clavel-Chapelon, F. Consumption of artificially and sugar-sweetened beverages and incident type 2 diabetes in the Etude Epidémiologique auprès des femmes de la Mutuelle Générale de l’Education Nationale–European Prospective Investigation into Cancer and Nutrition cohort. Am. J. Clin. Nutr. 2013, 97, 517–523. [Google Scholar] [CrossRef] [PubMed] [Green Version]
- Schulze, M.B.; Manson, J.E.; Ludwig, D.S.; Colditz, G.A.; Stampfer, M.J.; Willett, W.C.; Hu, F.B. Sugar-sweetened beverages, weight gain, and incidence of type 2 diabetes in young and middle-aged women. JAMA 2004, 292, 927–934. [Google Scholar] [CrossRef]
- Stern, D.; Mazariegos, M.; Ortiz-Panozo, E.; Campos, H.; Malik, V.S.; Lajous, M.; López-Ridaura, R. Sugar-sweetened soda consumption increases diabetes risk among mexican women. J. Nutr. 2019, 149, 795–803. [Google Scholar] [CrossRef]
- Papier, K.; D’Este, C.; Bain, C.; Banwell, C.; Seubsman, S.; Sleigh, A.; Jordan, S. Consumption of sugar-sweetened beverages and type 2 diabetes incidence in Thai adults: Results from an 8-year prospective study. Nutr. Diabetes 2017, 7, e283. [Google Scholar] [CrossRef] [Green Version]
- InterAct Consortium; Romaguera, D.; Norat, T.; Wark, P.A.; Vergnaud, A.C.; Schulze, M.B.; van Woudenbergh, G.J.; Drogan, D.; Amiano, P.; Molina-Montes, E.; et al. Consumption of sweet beverages and type 2 diabetes incidence in European adults: Results from EPIC-InterAct. Diabetologia 2013, 56, 1520–1530. [Google Scholar] [CrossRef]
- Montonen, J.; Järvinen, R.; Knekt, P.; Heliövaara, M.; Reunanen, A. Consumption of sweetened beverages and intakes of fructose and glucose predict type 2 diabetes occurrence. J. Nutr. 2007, 137, 1447. [Google Scholar] [CrossRef] [Green Version]
- Hirahatake, K.M.; Jacobs, D.R., Jr.; Shikany, J.M.; Jiang, L.; Wong, N.D.; Steffen, L.M.; Odegaard, A.O. Cumulative intake of artificially sweetened and sugar-sweetened beverages and risk of incident type 2 diabetes in young adults: The Coronary Artery Risk Development in Young Adults (CARDIA) Study. Am. J. Clin. Nutr. 2019, 110, 733–741. [Google Scholar] [CrossRef]
- O’Connor, L.; Imamura, F.; Lentjes, M.A.H.; Khaw, K.; Wareham, N.J.; Forouhi, N.G. Prospective associations and population impact of sweet beverage intake and type 2 diabetes, and effects of substitutions with alternative beverages. Diabetologia 2015, 58, 1474–1483. [Google Scholar] [CrossRef] [Green Version]
- Odegaard, A.O.; Koh, W.P.; Arakawa, K.; Yu, M.C.; Pereira, M.A. Soft drink and juice consumption and risk of physician-diagnosed incident type 2 diabetes: The Singapore Chinese Health Study. Am. J. Epidemiol. 2010, 171, 701–708. [Google Scholar] [CrossRef] [PubMed] [Green Version]
- Eshak, E.S.; Iso, H.; Mizoue, T.; Inoue, M.; Noda, M.; Tsugane, S. Soft drink, 100% fruit juice, and vegetable juice intakes and risk of diabetes mellitus. Clin. Nutr. 2013, 32, 300–308. [Google Scholar] [CrossRef] [PubMed]
- Gardener, H.; Rundek, T.; Markert, M.; Wright, C.B.; Elkind, M.S.V.; Sacco, R.L. Diet soft drink consumption is associated with an increased risk of vascular events in the Northern Manhattan Study. J. Gen. Intern. Med. 2012, 27, 1120–1126. [Google Scholar] [CrossRef] [Green Version]
- Eshak, E.S.; Iso, H.; Kokubo, Y.; Saito, I.; Yamagishi, K.; Inoue, M.; Tsugane, S. Soft drink intake in relation to incident ischemic heart disease, stroke, and stroke subtypes in Japanese men and women: The Japan Public Health Centre–based study cohort I. Am. J. Clin. Nutr. 2012, 96, 1390–1397. [Google Scholar] [CrossRef] [Green Version]
- Pacheco, L.S.; Lacey, J.V.; Martinez, M.E.; Lemus, H.; Araneta, M.R.G.; Sears, D.D.; Talavera, G.A.; Anderson, C.A.M. Sugar-sweetened beverage intake and cardiovascular disease risk in the California Teachers Study. J. Am. Heart Assoc. 2020, 9, e014883. [Google Scholar] [CrossRef] [PubMed]
- Fung, T.T.; Malik, V.; Rexrode, K.M.; Manson, J.E.; Willett, W.C.; Hu, F.B. Sweetened beverage consumption and risk of coronary heart disease in women. Am. J. Clin. Nutr. 2009, 89, 1037–1042. [Google Scholar] [CrossRef] [PubMed] [Green Version]
- Larsson, S.C.; Åkesson, A.; Wolk, A. Sweetened beverage consumption is associated with increased risk of stroke in women and men. J. Nutr. 2014, 144, 856–860. [Google Scholar] [CrossRef] [PubMed] [Green Version]
- De Koning, L.; Malik, V.S.; Kellogg, M.D.; Rimm, E.B.; Willett, W.C.; Hu, F.B. Sweetened beverage consumption, incident coronary heart disease, and biomarkers of risk in men. Circulation 2012, 125, 1735–1741. [Google Scholar] [CrossRef] [PubMed] [Green Version]
- Rahman, I.; Wolk, A.; Larsson, S.C. The relationship between sweetened beverage consumption and risk of heart failure in men. Heart 2015, 101, 1961–1965. [Google Scholar] [CrossRef] [PubMed] [Green Version]
- Barrington, W.E.; White, E. Mortality outcomes associated with intake of fast-food items and sugar-sweetened drinks among older adults in the Vitamins and Lifestyle (VITAL) study. Public Health Nutr. 2016, 19, 3319–3326. [Google Scholar] [CrossRef] [PubMed] [Green Version]
- Paganini-Hill, A.; Kawas, C.H.; Corrada, M.M. Non-alcoholic beverage and caffeine consumption and mortality: The Leisure World Cohort Study. Prev. Med. 2006, 44, 305–310. [Google Scholar] [CrossRef] [Green Version]
- Anderson, J.J.; Gray, S.R.; Welsh, P.; Mackay, D.F.; Celis-Morales, C.A.; Lyall, D.M.; Forbes, J.; Sattar, N.; Gill, J.M.R.; Pell, J.P. The associations of sugar-sweetened, artificially sweetened and naturally sweet juices with all-cause mortality in 198,285 UK Biobank participants: A prospective cohort study. BMC Med. 2020, 18, 97. [Google Scholar] [CrossRef] [Green Version]
- Stanhope, K.L. Role of fructose-containing sugars in the epidemics of obesity and metabolic syndrome. Annu. Rev. Med. 2012, 63, 329–343. [Google Scholar] [CrossRef]
- Hu, F.B.; Malik, V.S. Sugar-sweetened beverages and risk of obesity and type 2 diabetes: Epidemiologic evidence. Physiol. Behav. 2010, 100, 47–54. [Google Scholar] [CrossRef] [Green Version]
- Atkinson, F.S.; Foster-Powell, K.; Brand-Miller, J.C. International tables of glycemic index and glycemic load values: 2008. Diabetes Care 2008, 31, 2281–2283. [Google Scholar] [CrossRef] [Green Version]
- Livesey, G.; Taylor, R.; Livesey, H.F.; Buyken, A.E.; Jenkins, D.; Augustin, L.; Sievenpiper, J.L.; Barclay, A.W.; Liu, S.; Wolever, T.; et al. Dietary glycemic index and load and the risk of type 2 diabetes: A systematic review and updated meta-analyses of prospective cohort studies. Nutrients 2019, 11, 1280. [Google Scholar] [CrossRef] [Green Version]
- Nakagawa, T.; Tuttle, K.R.; Short, R.A.; Johnson, R.J. Hypothesis: Fructose-induced hyperuricemia as a causal mechanism for the epidemic of the metabolic syndrome. Nat. Clin. Pract. Nephrol. 2005, 1, 80–86. [Google Scholar] [CrossRef] [PubMed]
- Choi, J.W.; Ford, E.S.; Gao, X.; Choi, H.K. Sugar-sweetened soft drinks, diet soft drinks, and serum uric acid level: The Third National Health and Nutrition Examination Survey. Arthritis Rheum. 2008, 59, 109–116. [Google Scholar] [CrossRef] [PubMed]
- Sasso, F.C.; Rinaldi, L.; Lascar, N.; Marrone, A.; Pafundi, P.C.; Adinolfi, L.E.; Marfella, R. Role of tight glycemic control during acute coronary syndrome on CV outcome in type 2 diabetes. J. Diabetes Res. 2018, 2018, 1–8. [Google Scholar] [CrossRef] [Green Version]
- Marfella, R.; Sasso, F.C.; Cacciapuoti, F.; Portoghese, M.; Rizzo, M.R.; Siniscalchi, M.; Carbonara, O.; Ferraraccio, F.; Torella, M.; Petrella, A.; et al. Tight glycemic control may increase regenerative potential of myocardium during acute infarction. J. Clin. Endocrinol. Metab. 2012, 97, 933–942. [Google Scholar] [CrossRef] [Green Version]
- Swithers, S.E. Artificial sweeteners produce the counterintuitive effect of inducing metabolic derangements. Trends Endocrinol. Metab. 2013, 24, 431–441. [Google Scholar] [CrossRef] [PubMed] [Green Version]
- Fowler, S.P.; Williams, K.; Resendez, R.G.; Hunt, K.J.; Hazuda, H.P.; Stern, M.P. Fueling the obesity epidemic? Artificially sweetened beverage use and long-term weight gain. Obesity 2008, 16, 1894–1900. [Google Scholar] [CrossRef]
- Suez, J.; Korem, T.; Zeevi, D.; Zilberman-Schapira, G.; Thaiss, C.A.; Maza, O.; Israeli, D.; Zmora, N.; Gilad, S.; Weinberger, A.; et al. Artificial sweeteners induce glucose intolerance by altering the gut microbiota. Nature 2014, 514, 181–186. [Google Scholar] [CrossRef]
- Gardner, C.; Wylie-Rosett, J.; Gidding, S.S.; Steffen, L.M.; Johnson, R.K.; Reader, D.; Lichtenstein, A.H. Nonnutritive sweeteners: Current use and health perspectives: A scientific statement from the American Heart Association and the American Diabetes Association. Circulation 2012, 126, 509–519. [Google Scholar] [CrossRef]
- Pepino, M.Y.; Bourne, C. Non-nutritive sweeteners, energy balance, and glucose homeostasis. Curr. Opin. Clin. Nutr. Metab. Care 2011, 14, 391–395. [Google Scholar] [CrossRef]
- Suez, J.; Korem, T.; Zilberman-Schapira, G.; Segal, E.; Elinav, E. Non-caloric artificial sweeteners and the microbiome: Findings and challenges. Gut Microbes 2015, 6, 149–155. [Google Scholar] [CrossRef] [PubMed] [Green Version]


Publisher’s Note: MDPI stays neutral with regard to jurisdictional claims in published maps and institutional affiliations. |
© 2021 by the authors. Licensee MDPI, Basel, Switzerland. This article is an open access article distributed under the terms and conditions of the Creative Commons Attribution (CC BY) license (https://creativecommons.org/licenses/by/4.0/).
Share and Cite
Meng, Y.; Li, S.; Khan, J.; Dai, Z.; Li, C.; Hu, X.; Shen, Q.; Xue, Y. Sugar- and Artificially Sweetened Beverages Consumption Linked to Type 2 Diabetes, Cardiovascular Diseases, and All-Cause Mortality: A Systematic Review and Dose-Response Meta-Analysis of Prospective Cohort Studies. Nutrients 2021, 13, 2636. https://0-doi-org.brum.beds.ac.uk/10.3390/nu13082636
Meng Y, Li S, Khan J, Dai Z, Li C, Hu X, Shen Q, Xue Y. Sugar- and Artificially Sweetened Beverages Consumption Linked to Type 2 Diabetes, Cardiovascular Diseases, and All-Cause Mortality: A Systematic Review and Dose-Response Meta-Analysis of Prospective Cohort Studies. Nutrients. 2021; 13(8):2636. https://0-doi-org.brum.beds.ac.uk/10.3390/nu13082636
Chicago/Turabian StyleMeng, Yantong, Siqi Li, Jabir Khan, Zijian Dai, Chang Li, Xiaosong Hu, Qun Shen, and Yong Xue. 2021. "Sugar- and Artificially Sweetened Beverages Consumption Linked to Type 2 Diabetes, Cardiovascular Diseases, and All-Cause Mortality: A Systematic Review and Dose-Response Meta-Analysis of Prospective Cohort Studies" Nutrients 13, no. 8: 2636. https://0-doi-org.brum.beds.ac.uk/10.3390/nu13082636