
The Impact of Lifestyle Intervention on Dietary Quality among Rural Women with Previous Gestational Diabetes Mellitus—A Randomized Controlled Study

 , , ,
, , ,
Abstract
:1. Introduction
2. Materials and Methods
2.1. Study Design
2.2. Participants
2.3. Randomization
2.4. Lifestyle Intervention
2.5. Control Group
2.6. Data Collection
2.6.1. Dietary Intake
2.6.2. Dietary Quality
2.6.3. Anthropometric Parameters
2.6.4. Physical Activity
2.6.5. Sociodemographic Information
2.7. Outcomes
2.8. Sample Size
2.9. Statistical Analysis
3. Results
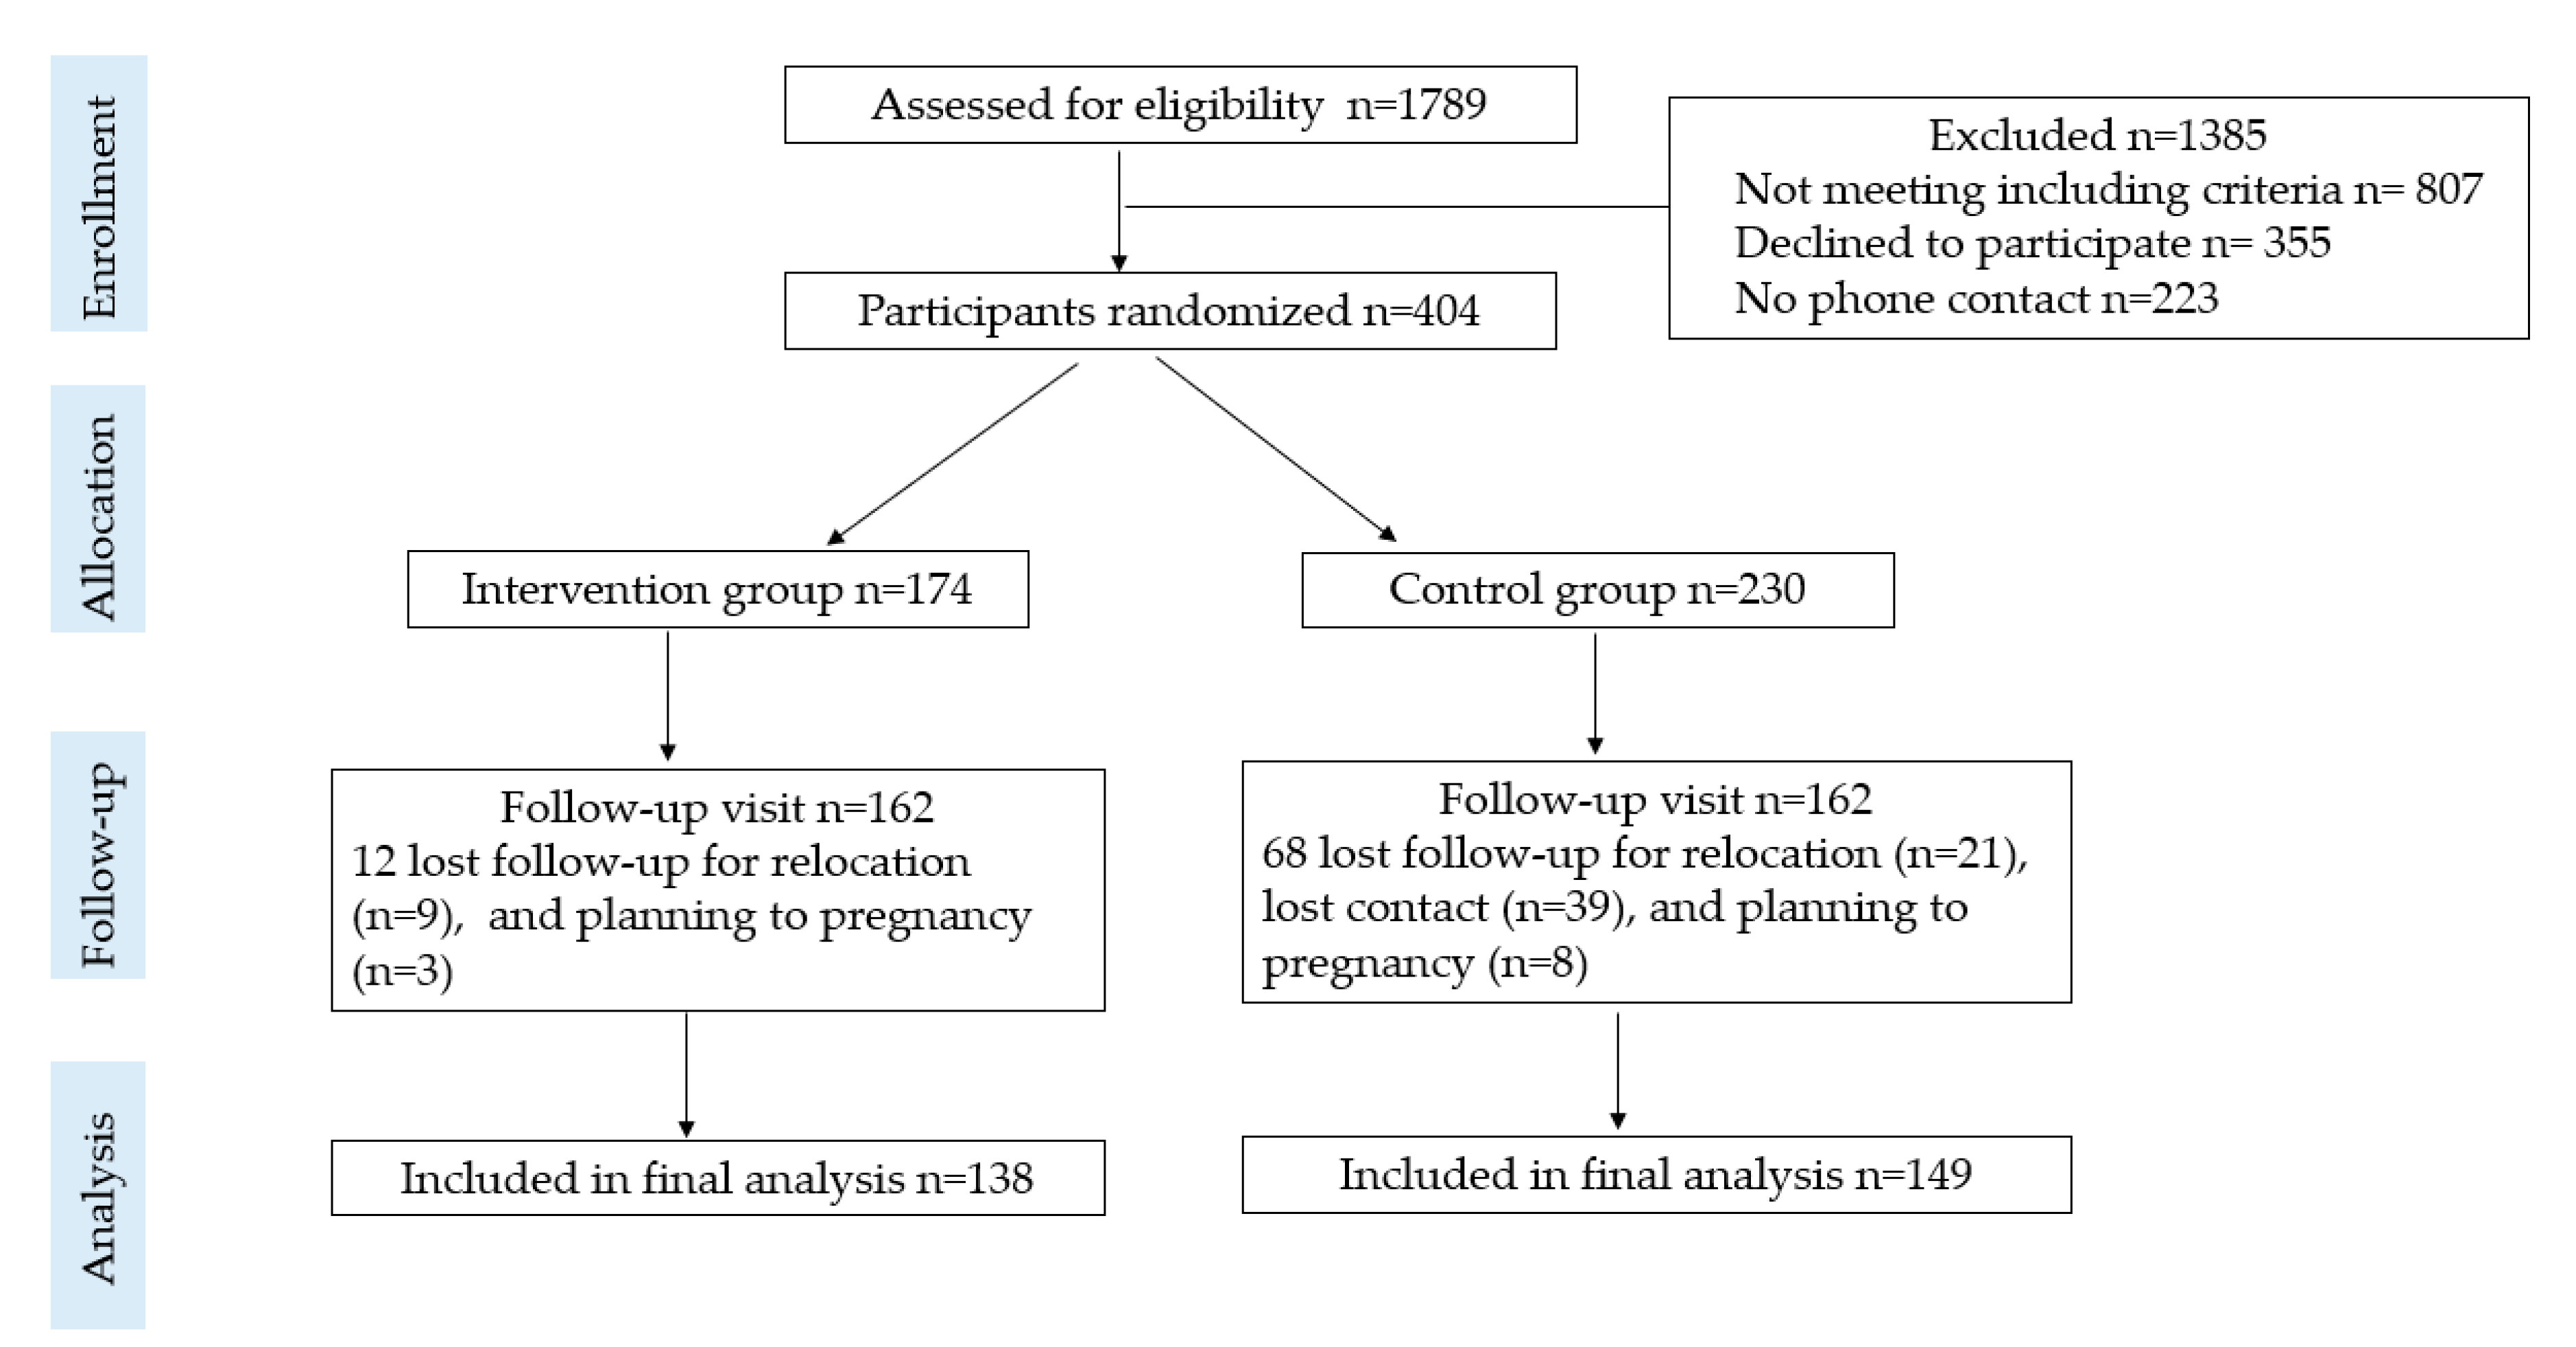
3.1. Participants
3.2. CHEI
3.3. MDD-W
3.4. Association of CHEI, MDD-W with Lifestyle Intervention
3.5. Energy and Nutrient Intake
4. Discussion
5. Conclusions
Supplementary Materials
Author Contributions
Funding
Institutional Review Board Statement
Informed Consent Statement
Data Availability Statement
Acknowledgments
Conflicts of Interest
References
- Chinese Diabetes Society. Standars of Care for Type 2 Diabetes in China. Chin. J. Diabetes Mellitus 2018, 20, 4–67. [Google Scholar] [CrossRef]
- American Diabetes Association. Standards of Medical Care in Diabetes—2019; Volume 42, pp. S1–S193. Available online: https://care.diabetesjournals.org/content/diacare/suppl/2018/12/17/42.Supplement_1.DC1/DC_42_S1_2019_UPDATED.pdf (accessed on 29 July 2021).
- Huvinen, E.; Eriksson, J.G.; Koivusalo, S.B.; Grotenfelt, N.; Tiitinen, A.; Stach-Lempinen, B.; Rono, K. Heterogeneity of gestational diabetes (GDM) and long-term risk of diabetes and metabolic syndrome: Findings from the RADIEL study follow-up. Acta Diabetol. 2018, 55, 493–501. [Google Scholar] [CrossRef] [PubMed] [Green Version]
- Vounzoulaki, E.; Khunti, K.; Abner, S.C.; Tan, B.K.; Davies, M.J.; Gillies, C.L. Progression to type 2 diabetes in women with a known history of gestational diabetes: Systematic review and meta-analysis. BMJ 2020, 369, m1361. [Google Scholar] [CrossRef]
- Lauenborg, J.; Hansen, T.; Jensen, D.M.; Vestergaard, H.; Molsted-Pedersen, L.; Hornnes, P.; Locht, H.; Pedersen, O.; Damm, P. Increasing incidence of diabetes after gestational diabetes: A long-term follow-up in a Danish population. Diabetes Care 2004, 27, 1194–1199. [Google Scholar] [CrossRef] [PubMed] [Green Version]
- Li, Z.; Cheng, Y.; Wang, D.; Chen, H.; Chen, H.; Ming, W.K.; Wang, Z. Incidence Rate of Type 2 Diabetes Mellitus after Gestational Diabetes Mellitus: A Systematic Review and Meta-Analysis of 170,139 Women. J. Diabetes Res. 2020, 2020, 3076463. [Google Scholar] [CrossRef] [PubMed]
- D’Arcy, E.; Rayner, J.; Hodge, A.; Ross, L.J.; Schoenaker, D. The Role of Diet in the Prevention of Diabetes among Women with Prior Gestational Diabetes: A Systematic Review of Intervention and Observational Studies. J. Acad. Nutr. Diet. 2020, 120, 69–85 e67. [Google Scholar] [CrossRef] [Green Version]
- Schwingshackl, L.; Hoffmann, G.; Lampousi, A.M.; Knuppel, S.; Iqbal, K.; Schwedhelm, C.; Bechthold, A.; Schlesinger, S.; Boeing, H. Food groups and risk of type 2 diabetes mellitus: A systematic review and meta-analysis of prospective studies. Eur. J. Epidemiol. 2017, 32, 363–375. [Google Scholar] [CrossRef] [Green Version]
- Ojo, O. Dietary Intake and Type 2 Diabetes. Nutrients 2019, 11, 2177. [Google Scholar] [CrossRef] [Green Version]
- Tobias, D.K.; Hu, F.B.; Chavarro, J.; Rosner, B.; Mozaffarian, D.; Zhang, C. Healthful dietary patterns and type 2 diabetes mellitus risk among women with a history of gestational diabetes mellitus. Arch. Intern. Med. 2012, 172, 1566–1572. [Google Scholar] [CrossRef] [Green Version]
- Gholizadeh, F.; Moludi, J.; Lotfi Yagin, N.; Alizadeh, M.; Mostafa Nachvak, S.; Abdollahzad, H.; Mirzaei, K.; Mostafazadeh, M. The relation of Dietary diversity score and food insecurity to metabolic syndrome features and glucose level among pre-diabetes subjects. Prim. Care Diabetes 2018, 12, 338–344. [Google Scholar] [CrossRef]
- Li, G.; Zhang, P.; Wang, J.; Gregg, E.W.; Yang, W.; Gong, Q.; Li, H.; Li, H.; Jiang, Y.; An, Y.; et al. The long-term effect of lifestyle interventions to prevent diabetes in the China Da Qing Diabetes Prevention Study: A 20-year follow-up study. Lancet 2008, 371, 1783–1789. [Google Scholar] [CrossRef]
- Knowler, W.C.; Fowler, S.E.; Hamman, R.F.; Christophi, C.A.; Hoffman, H.J.; Brenneman, A.T.; Brown-Friday, J.O.; Goldberg, R.; Venditti, E.; et al.; Diabetes Prevention Program Research Group 10-year follow-up of diabetes incidence and weight loss in the Diabetes Prevention Program Outcomes Study. Lancet 2009, 374, 1677–1686. [Google Scholar] [CrossRef] [PubMed] [Green Version]
- Hemmingsen, B.; Gimenez-Perez, G.; Mauricio, D.; Roque, I.F.M.; Metzendorf, M.I.; Richter, B. Diet, physical activity or both for prevention or delay of type 2 diabetes mellitus and its associated complications in people at increased risk of developing type 2 diabetes mellitus. Cochrane Database Syst. Rev. 2017, 12, CD003054. [Google Scholar] [CrossRef] [Green Version]
- Aroda, V.R.; Christophi, C.A.; Edelstein, S.L.; Zhang, P.; Herman, W.H.; Barrett-Connor, E.; Delahanty, L.M.; Montez, M.G.; Ackermann, R.T.; Zhuo, X.; et al. The effect of lifestyle intervention and metformin on preventing or delaying diabetes among women with and without gestational diabetes: The Diabetes Prevention Program outcomes study 10-year follow-up. J. Clin. Endocrinol. Metab. 2015, 100, 1646–1653. [Google Scholar] [CrossRef]
- Koning, S.H.; Lutgers, H.L.; Hoogenberg, K.; Trompert, C.A.; van den Berg, P.P.; Wolffenbuttel, B.H. Postpartum glucose follow-up and lifestyle management after gestational diabetes mellitus: General practitioner and patient perspectives. J. Diabetes Metab. Disord. 2016, 15, 56. [Google Scholar] [CrossRef] [Green Version]
- Parsons, J.; Sparrow, K.; Ismail, K.; Hunt, K.; Rogers, H.; Forbes, A. A qualitative study exploring women’s health behaviours after a pregnancy with gestational diabetes to inform the development of a diabetes prevention strategy. Diabet. Med. 2019, 36, 203–213. [Google Scholar] [CrossRef]
- Sundarapperuma, T.D.; Wijesinghe, C.J.; Hettiarachchi, P.; Wasalathanthri, S. Perceptions on Diet and Dietary Modifications during Postpartum Period Aiming at Attenuating Progression of GDM to DM: A Qualitative Study of Mothers and Health Care Workers. J. Diabetes Res. 2018, 2018, 6459364. [Google Scholar] [CrossRef] [PubMed] [Green Version]
- Hjelm, K.; Bard, K.; Apelqvist, J. A qualitative study of developing beliefs about health, illness and healthcare in migrant African women with gestational diabetes living in Sweden. BMC Womens Health 2018, 18, 34. [Google Scholar] [CrossRef] [PubMed] [Green Version]
- Zhang, N.; Du, S.M.; Ma, G.S. Current lifestyle factors that increase risk of T2DM in China. Eur. J. Clin. Nutr. 2017, 71, 832–838. [Google Scholar] [CrossRef]
- Shen, X.; Fang, A.; He, J.; Liu, Z.; Guo, M.; Gao, R.; Li, K. Trends in dietary fat and fatty acid intakes and related food sources among Chinese adults: A longitudinal study from the China Health and Nutrition Survey (1997–2011). Public Health Nutr. 2017, 20, 2927–2936. [Google Scholar] [CrossRef] [PubMed] [Green Version]
- Song, S.; Yuan, B.; Zhang, L.; Cheng, G.; Zhu, W.; Hou, Z.; He, L.; Ma, X.; Meng, Q. Increased Inequalities in Health Resource and Access to Health Care in Rural China. Int. J. Environ. Res. Public Health 2018, 16, 49. [Google Scholar] [CrossRef] [PubMed] [Green Version]
- Wang, W.; Zhang, Y.; Lin, B.; Mei, Y.; Ping, Z.; Zhang, Z. The Urban-Rural Disparity in the Status and Risk Factors of Health Literacy: A Cross-Sectional Survey in Central China. Int. J. Environ. Res. Public Health 2020, 17, 3848. [Google Scholar] [CrossRef] [PubMed]
- Li, M.; Shi, J.; Luo, J.; Long, Q.; Yang, Q.; OuYang, Y.; Liu, H.; Lin, Q.; Guo, J. Diet Quality among Women with Previous Gestational Diabetes Mellitus in Rural Areas of Hunan Province. Int. J. Environ. Res. Public Health 2020, 17, 5942. [Google Scholar] [CrossRef] [PubMed]
- Guo, J.; Tang, Y.; Wiley, J.; Whittemore, R.; Chen, J.L. Effectiveness of a diabetes prevention program for rural women with prior gestational diabetes mellitus: Study protocol of a multi-site randomized clinical trial. BMC Public Health 2018, 18, 809. [Google Scholar] [CrossRef]
- Ajzen, I. The Theory of Planned behavior. Organ. Behav. Hum. Decis. Process. 1991, 50, 179–211. [Google Scholar] [CrossRef]
- Maleki, F.; Hosseini Nodeh, Z.; Rahnavard, Z.; Arab, M. Effectiveness of training on preventative nutritional behaviors for type-2 diabetes among the female adolescents: Examination of theory of planned behavior. Med. J. Islam Repub. Iran. 2016, 30, 349. [Google Scholar]
- Harrington, M.R.; Ickes, M.; Bradley, K.; Noland, M. The Theory of Planned Behavior and the USDA Summer Food Service Program. J. Nutr. Educ. Behav. 2020, 52, 944–951. [Google Scholar] [CrossRef]
- Stolte, E.; Hopman-Rock, M.; Aartsen, M.J.; van Tilburg, T.G.; Chorus, A. The Theory of Planned Behavior and Physical Activity Change: Outcomes of the Aging Well and Healthily Intervention Program for Older Adults. J. Aging Phys. Act. 2017, 25, 438–445. [Google Scholar] [CrossRef]
- Yang, Y.X.; Wang, X.L.; Leong, P.M.; Zhang, H.M.; Yang, X.G.; Kong, L.Z.; Zhai, F.Y.; Cheng, Y.Y.; Guo, J.S.; Su, Y.X. New Chinese dietary guidelines: Healthy eating patterns and food-based dietary recommendations. Asia Pac. J. Clin. Nutr. 2018, 27, 908–913. [Google Scholar] [CrossRef]
- National Insititue for Nutrition and Health. China Food Composition Tables Standard Edition; Peking University Medical Press: Beijing, China, 2018. [Google Scholar]
- Yuan, Y.Q.; Li, F.; Dong, R.H.; Chen, J.S.; He, G.S.; Li, S.G.; Chen, B. The Development of a Chinese Healthy Eating Index and Its Application in the General Population. Nutrients 2017, 9, 977. [Google Scholar] [CrossRef] [PubMed] [Green Version]
- FAO. FHI Minumun Dietary Diversity for Women: A Guide for Measurement; FAO: Rome, Italy, 2016. [Google Scholar]
- Department of Disease Control Ministry of Health, P.R.C. The guidelines for prevention and control of overweight and obesity in Chinese adults. Biomed. Environ. Sci. 2004, 17, 1–36. [Google Scholar]
- Lee, P.H.; Macfarlane, D.J.; Lam, T.H.; Stewart, S.M. Validity of the International Physical Activity Questionnaire Short Form (IPAQ-SF): A systematic review. Int. J. Behav. Nutr. Phys. Act. 2011, 8, 115. [Google Scholar] [CrossRef] [Green Version]
- Per Capita Annual Income of Rural Households by Source. 2018. Available online: http://222.240.193.190/18tjnj/indexch.htm (accessed on 12 December 2018).
- Wang, L.; Zhou, B.; Zhao, Z.; Yang, L.; Zhang, M.; Jiang, Y.; Li, Y.; Zhou, M.; Wang, L.; Huang, Z.; et al. Body-mass index and obesity in urban and rural China: Findings from consecutive nationally representative surveys during 2004-18. Lancet 2021, 398, 53–63. [Google Scholar] [CrossRef]
- Holmes, V.A.; Draffin, C.R.; Patterson, C.C.; Francis, L.; Irwin, J.; McConnell, M.; Farrell, B.; Brennan, S.F.; McSorley, O.; Wotherspoon, A.C.; et al. Postnatal Lifestyle Intervention for Overweight Women With Previous Gestational Diabetes: A Randomized Controlled Trial. J. Clin. Endocrinol. Metab. 2018, 103, 2478–2487. [Google Scholar] [CrossRef] [PubMed] [Green Version]
- Peacock, A.S.; Bogossian, F.E.; Wilkinson, S.A.; Gibbons, K.S.; Kim, C.; McIntyre, H.D. A Randomised Controlled Trial to Delay or Prevent Type 2 Diabetes after Gestational Diabetes: Walking for Exercise and Nutrition to Prevent Diabetes for You. Int. J. Endocrinol. 2015, 2015, 423717. [Google Scholar] [CrossRef] [PubMed]
- Hu, G.; Tian, H.; Zhang, F.; Liu, H.; Zhang, C.; Zhang, S.; Wang, L.; Liu, G.; Yu, Z.; Yang, X.; et al. Tianjin Gestational Diabetes Mellitus Prevention Program: Study design, methods, and 1-year interim report on the feasibility of lifestyle intervention program. Diabetes Res. Clin. Pract. 2012, 98, 508–517. [Google Scholar] [CrossRef]
- O’Reilly, S.; Versace, V.; Mohebbi, M.; Lim, S.; Janus, E.; Dunbar, J. The effect of a diabetes prevention program on dietary quality in women with previous gestational diabetes. BMC Womens Health 2019, 19, 88. [Google Scholar] [CrossRef] [PubMed] [Green Version]
- Sedgwick, P.; Greenwood, N. Understanding the Hawthorne effect. BMJ 2015, 351, h4672. [Google Scholar] [CrossRef] [Green Version]
- He, F.Y.; You, L.L.; Liang, P.; Chen, C.G. Association between Chinese Healthy Eating Index (CHEI) and metabolic syndrome (MetS) in middle-aged and elderly Chinese adults: A cross-sectional study. In Proceedings of the 14th China Nutrition Science Congress, Nanjing, China, 20 September 2019. [Google Scholar]
- Gicevic, S.; Gaskins, A.J.; Fung, T.T.; Rosner, B.; Tobias, D.K.; Isanaka, S.; Willett, W.C. Evaluating pre-pregnancy dietary diversity vs. dietary quality scores as predictors of gestational diabetes and hypertensive disorders of pregnancy. PLoS ONE 2018, 13, e0195103. [Google Scholar] [CrossRef] [PubMed] [Green Version]
- Boeing, H.; Bechthold, A.; Bub, A.; Ellinger, S.; Haller, D.; Kroke, A.; Leschik-Bonnet, E.; Muller, M.J.; Oberritter, H.; Schulze, M.; et al. Critical review: Vegetables and fruit in the prevention of chronic diseases. Eur. J. Nutr. 2012, 51, 637–663. [Google Scholar] [CrossRef] [Green Version]
- Du, H.; Guo, Y.; Bennett, D.A.; Bragg, F.; Bian, Z.; Chadni, M.; Yu, C.; Chen, Y.; Tan, Y.; Millwood, I.Y.; et al. Red meat, poultry and fish consumption and risk of diabetes: A 9 year prospective cohort study of the China Kadoorie Biobank. Diabetologia 2020, 63, 767–779. [Google Scholar] [CrossRef] [Green Version]
- Sathyapalan, T.; Rigby, A.S.; Bhasin, S.; Thatcher, N.J.; Kilpatrick, E.S.; Atkin, S.L. Effect of Soy in Men With Type 2 Diabetes Mellitus and Subclinical Hypogonadism: A Randomized Controlled Study. J. Clin. Endocrinol. Metab. 2017, 102, 425–433. [Google Scholar] [CrossRef] [Green Version]
- Zhao, L.; Ma, G.; Piao, J.; Zhang, J.; Yu, D.; He, Y.; Huo, J.; Hu, X.; Yang, Z.; Yang, X. Scheme of the 2010-2012 Chinese nutrition and health surveillance. Zhonghua Yu Fang Yi Xue Za Zhi 2016, 50, 204–207. [Google Scholar] [CrossRef] [PubMed]
- Huang, L.; Wang, Z.; Wang, H.; Zhao, L.; Jiang, H.; Zhang, B.; Ding, G. Nutrition transition and related health challenges over decades in China. Eur. J. Clin. Nutr. 2021, 75, 247–252. [Google Scholar] [CrossRef] [PubMed]
- Du, W.; Wang, H.; Chen, S.; Su, C.; Zhang, H.; Zhang, B. Trend of dietary nutrient intake among adult females in 9 provinces in China, 2000–2011. Zhonghua Liu Xing Bing Xue Za Zhi 2015, 36, 715–719. [Google Scholar]
- Li, Y.; Wang, D.D.; Ley, S.H.; Vasanti, M.; Howard, A.G.; He, Y.; Hu, F.B. Time Trends of Dietary and Lifestyle Factors and Their Potential Impact on Diabetes Burden in China. Diabetes Care 2017, 40, 1685–1694. [Google Scholar] [CrossRef] [Green Version]
- Jakubowicz, D.; Froy, O. Biochemical and metabolic mechanisms by which dietary whey protein may combat obesity and Type 2 diabetes. J. Nutr. Biochem. 2013, 24, 1–5. [Google Scholar] [CrossRef] [PubMed]
- Comerford, K.B.; Pasin, G. Emerging Evidence for the Importance of Dietary Protein Source on Glucoregulatory Markers and Type 2 Diabetes: Different Effects of Dairy, Meat, Fish, Egg, and Plant Protein Foods. Nutrients 2016, 8, 446. [Google Scholar] [CrossRef] [Green Version]
- Wang, Y.; Li, S. Worldwide trends in dairy production and consumption and calcium intake: Is promoting consumption of dairy products a sustainable solution for inadequate calcium intake? Food Nutr. Bull. 2008, 29, 172–185. [Google Scholar] [CrossRef] [PubMed]
- Hao, L.; Liang, Y. The Spatial and Career Mobility of China’s Urban and Rural Labor Force. Manag. Organ. Rev. 2016, 12, 135–158. [Google Scholar] [CrossRef] [PubMed] [Green Version]
- Peng, X. China’s demographic history and future challenges. Science 2011, 333, 581–587. [Google Scholar] [CrossRef] [PubMed] [Green Version]
- Gibson, R.S.; Charrondiere, U.R.; Bell, W. Measurement Errors in Dietary Assessment Using Self-Reported 24-Hour Recalls in Low-Income Countries and Strategies for Their Prevention. Adv. Nutr. Int. Rev. J. 2017, 8, 980–991. [Google Scholar] [CrossRef] [PubMed] [Green Version]
- Alemayehu, A.A.; Abebe, Y.; Gibson, R.S. A 24-h recall does not provide a valid estimate of absolute nutrient intakes for rural women in southern Ethiopia. Nutrition 2011, 27, 919–924. [Google Scholar] [CrossRef] [PubMed]


| Variables | Participants Randomized (n = 404) | Participants Included in Final Analysis (n = 287) | ||||
|---|---|---|---|---|---|---|
| Intervention n = 174 | Control n = 230 | p | Intervention n = 138 | Control n = 149 | p | |
| Age (years) | 31.7 (5.1) | 30.9 (5.1) | 0.104 | 32.1 (5.1) | 31.6 (5.0) | 0.376 |
| Ethnic (%) | 0.105 | 0.980 | ||||
| Han ethnicity | 49.7 | 57.8 | 51.8 | 51.7 | ||
| Other ethnicities | 50.3 | 42.2 | 48.2 | 48.3 | ||
| Education (%) | 0.530 | 0.712 | ||||
| senior high school or above (9–12 years) | 78.7 | 76.1 | 79.0 | 77.2 | ||
| junior high school or below (≤9 years) | 21.3 | 23.9 | 21.0 | 22.8 | ||
| Monthly family income ($) (%) | 0.214 | 0.828 | ||||
| ≤420 | 29.7 | 25.7 | 31.8 | 30.6 | ||
| >420 | 70.3 | 74.3 | 68.2 | 69.4 | ||
| Occupation (%) | 0.938 | 0.745 | ||||
| Unemployed | 34.3 | 34.0 | 33.6 | 435.5 | ||
| Employed | 65.9 | 66.0 | 66.4 | 64.5 | ||
| BMI | 24.0 (3.6) | 23.9 (3.7) | 0.756 | 23.7 (3.4) | 24.1 (3.7) | 0.424 |
| BMI (%) | 0.091 | 0.026 | ||||
| Underweight | 3.5 | 5.3 | 2.9 | 5.5 | ||
| Normal | 54.7 | 45.1 | 59.6 | 43.4 | ||
| Overweight | 26.2 | 36.7 | 24.3 | 38.6 | ||
| Obesity | 15.7 | 12.8 | 13.2 | 12.4 | ||
| Parity (%) | 0.408 | 0.385 | ||||
| 1 | 35.1 | 38.9 | 41.5 | 39.5 | ||
| 2 | 62.1 | 58.1 | 51.0 | 51.3 | ||
| >2 | 2.8 | 3 | 7.5 | 9.2 | ||
| Components/Total CHEI | Intervention | Control | p (Intervention vs. Control at Follow-Up Visit) | ||
|---|---|---|---|---|---|
| Baseline | Follow-Up | Baseline | Follow-Up | ||
| total grains | 4.2 (0.9) | 4.5 (0.9) | 4.4 (0.8) | 4.7 (0.6) * | 0.116 |
| whole grains and mixed beans | 0.3 (0.8) | 0.9 (1.7) | 0.2 (0.6) | 0.7 (1.5) * | 0.300 |
| tubers | 1.8 (2.0) | 1.3 (1.9) * | 1.2 (1.8) | 1.0 (1.6) | 0.157 |
| total vegetables | 2.5 (1.2) | 3.3(1.2) * | 2.6 (1.3) | 2.9 (1.4) * | 0.024 |
| dark vegetables | 2.0 (1.6) | 2.7 (1.8) * | 2.1 (1.6) | 2.4 (1.7) | 0.105 |
| fruits | 2.3 (2.9) | 4.7 (3.9) * | 2.7 (3.2) | 4.5 (3.7) * | 0.591 |
| eggs | 2.1 (1.9) | 2.9 (2.1) * | 2.3(2.0) | 2.9 (2.0) * | 0.802 |
| soybeans | 2.4 (2.0) | 2.8 (2.2) | 1.8 (1.9) | 2.2 (2.1) | 0.015 |
| dairy | 0.4 (1.1) | 0.9 (1.6) * | 0.6(1.3) | 0.8 (1.4) | 0.290 |
| seeds and nuts | 1.7 (2.3) | 0.9 (1.9) * | 1.3 (2.2) | 0.8 (1.8) * | 0.635 |
| fish and seafood | 2.0 (2.1) | 2.7 (2.2) * | 1.6 (1.9) | 2.4 (2.2) * | 0.273 |
| poultry | 1.5 (2.2) | 2.4 (2.4) * | 1.4 (2.0) | 1.9 (2.4) * | 0.081 |
| red meat | 3.7 (0.9) | 4.3 (0.8) * | 3.9 (0.8) | 4.1 (0.8) * | 0.025 |
| added sugars | 5.0 (0.0) | 5.0 (0.0) ** | 4.9 (0.3) | 5.0 (0.1) | 0.337 |
| cooking oils | 9.4 (1.5) | 9.1 (1.5) | 9.4 (1.6) | 9.1 (1.7) | 0.997 |
| alcohol | 5.0 (0.0) | 5.0 (0.0) | 5.0 (0.0) | 5.0 (0.0) ** | 0.300 |
| sodium | 8.4 (2.6) | 8.7 (2.3) | 8.4 (2.6) | 8.6 (2.4) | 0.557 |
| Total CHEI score | 54.4 (7.4) | 62.2 (8.9) * | 53.5(7.6) | 58.9 (8.4) * | 0.001 |
| Proportion | Intervention | Control | p (Intervention vs. Control at Follow-Up Visit) | ||
|---|---|---|---|---|---|
| Baseline | Follow-Up | Baseline | Follow-Up | ||
| Grains, white roots, and tubers | 99.2 | 99.3 | 99.3 | 100 | 0.298 |
| Meat, poultry, and fish | 55.4 | 99.3 * | 62.1 | 96.6 * | 0.120 |
| Dairy | 23.1 | 31.9 | 26.2 | 26.2 | 0.286 |
| Pulses | 23.1 | 33.3 | 19.3 | 19.5 | 0.008 |
| Nuts and seeds | 26.2 | 9.4 * | 14.5 | 9.4 | 0.994 |
| Dark green leafy vegetables | 72.3 | 73.9 | 73.1 | 69.8 | 0.439 |
| Other vitamin A-rich fruits and vegetables | 30.8 | 43.5 * | 35.2 | 40.9 | 0.663 |
| Other vegetables | 85.4 | 94.9 * | 93.1 | 94.6 | 0.910 |
| Other fruits | 48.5 | 65.2 * | 52.4 | 62.4 | 0.622 |
| Eggs | 61.5 | 69.6 | 64.1 | 71.1 | 0.770 |
| At least 5 groups | 73.8 | 90.6 | 74.5 | 81.2 | 0.023 |
Publisher’s Note: MDPI stays neutral with regard to jurisdictional claims in published maps and institutional affiliations. |
© 2021 by the authors. Licensee MDPI, Basel, Switzerland. This article is an open access article distributed under the terms and conditions of the Creative Commons Attribution (CC BY) license (https://creativecommons.org/licenses/by/4.0/).
Share and Cite
Li, M.; Lin, Q.; Shi, J.; Xi, Y.; Xiang, C.; Yong, C.; Guo, J. The Impact of Lifestyle Intervention on Dietary Quality among Rural Women with Previous Gestational Diabetes Mellitus—A Randomized Controlled Study. Nutrients 2021, 13, 2642. https://0-doi-org.brum.beds.ac.uk/10.3390/nu13082642
Li M, Lin Q, Shi J, Xi Y, Xiang C, Yong C, Guo J. The Impact of Lifestyle Intervention on Dietary Quality among Rural Women with Previous Gestational Diabetes Mellitus—A Randomized Controlled Study. Nutrients. 2021; 13(8):2642. https://0-doi-org.brum.beds.ac.uk/10.3390/nu13082642
Chicago/Turabian StyleLi, Mingshu, Qian Lin, Jingcheng Shi, Yue Xi, Caihong Xiang, Cuiting Yong, and Jia Guo. 2021. "The Impact of Lifestyle Intervention on Dietary Quality among Rural Women with Previous Gestational Diabetes Mellitus—A Randomized Controlled Study" Nutrients 13, no. 8: 2642. https://0-doi-org.brum.beds.ac.uk/10.3390/nu13082642