
Feeding Children and Maintaining Food Service Operations during COVID-19: A Mixed Methods Investigation of Implementation and Financial Challenges


 and
and
Abstract
:1. Introduction
2. Materials and Methods
2.1. Study Design
2.2. Recruitment and Study Population
2.3. Qualitative Measure Development, Data Collection, and Analysis
2.3.1. Interview Guide Development
2.3.2. Data Collection
2.3.3. Qualitative Data Analysis
2.4. Quantitative Component: Measures, Data Collection, and Analysis
2.4.1. Cost and Revenue Data Sources
2.4.2. Quantitative Data Analysis
2.4.3. Data Triangulation
3. Results
3.1. Sample Description
3.2. Qualitative Findings
3.2.1. Theme 1: Serving Meals during COVID-19 Was a Highly Complicated Process
3.2.2. Theme 2: The Usual Financial Model of School Food Service Is Untenable during School Closures
“I’ve been in the hospitality business now 41 years. And anybody who’s been in that business, you understand that [if] you control your food and your labor, you’re good. If you don’t have a control on them, you’re toast….our labor cost is extremely high and our reimbursement is still the same.”
“This is one of the instances in which the benefits of CEP… showed itself because we did not have to engage in the theatrics of accountability and just ridiculous compliance exercises that other districts had to do at a time when you’re trying to minimize interaction between people during a crisis.”
3.2.3. Theme 3: The Existing Culture of School Food Authorities Sustained Morale throughout the Pandemic
“We’re here for kids and we’re going to take care of our kids, whether they’re in school or not in school, whether school was open or it’s closed… We have a responsibility here and an obligation.”
3.2.4. Theme 4: External Policies and Factors That Influenced Implementation
“One of the most important elements was the Urban School Food Alliance and our peer school districts. We did a lot of sharing of best ideas, best approaches, what works, what doesn’t work. And so we were really able to learn from each other’s experience and really kind of kind of, you know, raise the boat for children across the entire country in our respective cities and school districts.”
3.3. Quantitative Findings on Financial Health
3.4. Concurrent Triangulation of Qualitative and Quantitative Findings
4. Discussion
5. Conclusions
Author Contributions
Funding
Institutional Review Board Statement
Informed Consent Statement
Data Availability Statement
Acknowledgments
Conflicts of Interest
Disclaimers
Appendix A. Qualitative Interview Guide
- To start, please you tell me a little more about your role in school food service in [DISTRICT]? How many schools do you oversee?
- Prior to the pandemic, what approach did your district use for preparing and serving meals–do you have a central kitchen from which meals are distributed to schools in the district, or a contract with a larger food service provider (e.g., Aramark, Sodexho), or do schools prepare their own foods in on-site kitchens, or some mixture of these strategies? Something else?
- Are students in [DISTRICT] currently attending school:
- Fully in person;
- Fully virtual/online;
- In a hybrid model (e.g., some in person, some virtual; half day in person half day virtual); or
- Something else?
- Please tell me about your district’s plan to change how students attend school (e.g., switch from fully remote to hybrid once appropriate safety steps are in place).
- In the USFA meeting minutes, I saw that your district made changes to they way that you were preparing and serving meals in spring, summer, and now [Research team will populate with examples for each district, taken from meeting notes]. What implications has this had for your team–have you had to conduct extra trainings, hire or release any staff, pay more overtime, investigate different packaging materials, develop communication materials for families?
- Probe: Are there other major changes I didn’t mention that have had implications for your team?
- Why did you choose the approaches that you did [Research team will populate with examples from each district, taken from meeting notes]? Let’s first start with spring. Now summer. And finally reopening.
- Probe: What went into your decisionmaking process? E.g. financial constraints, community input?
- How did you and your team assess whether your new approaches were working and what needed to be done differently? Did the transition from summer to fall impact lead to additional changes?
- Going forward, what new or different approaches to preparing or serving meals will your district keep or start implementing in the future?
- Probe: Why will you continue using these new approaches?
- Probe: What financial impact will these approaches have on your operations?
- Going forward, what support does your district need in order to continuing feeding children?
- Probe: Can you tell me more about what group or organizations would need to provide this support (USDA, the state, your local community)?
- Now, let’s talk about key partners. What individuals or groups were consulted when your district made changes to food service operations during spring closures, summer and reopening?
- Now, let’s turn to challenges of making these changes to school meal service. Please share with us what challenges your district faced in the spring. And any different or unique ones for the summer? And now, this fall, any different or unique challenges?
- Since the spring closures, please share with any insights related to the needs of students and families in your district to your program during COVID? How has your district tried to address any of these needs? How did student or family input shape your reopening meal service approach?
- Please discuss further the impacts of the financial or operational challenges you mentioned earlier had on meal service during closures and reopening.
- Please tell me more about any changes that made it easier or supported your district’s capacity to serve meals during school closures and reopening. Any best practices or lessons learned you would want to carry forward for reopening? Future school closures? Or, in a normal school meal service operation?
- Please share with us what operational changes could be considered to ensure the financial health of your district’s program, now and in the future.
- Please share with us how much and what type of financial relief is most needed at this time and in the future?
Appendix B

References
- Banfield, E.C.; Liu, Y.; Davis, J.S.; Chang, S.; Frazier-Wood, A.C. Poor adherence to US dietary guidelines for children and adolescents in the national health and nutrition examination survey population. J. Acad. Nutr. Diet. 2016, 116, 21–27. [Google Scholar] [CrossRef] [PubMed] [Green Version]
- Larson, N.; Story, M. Barriers to equity in nutritional health for US children and adolescents: A review of the literature. Curr. Nutr. Rep. 2015, 4, 102–110. [Google Scholar] [CrossRef]
- Thomson, J.L.; Tussing-Humphreys, L.M.; Goodman, M.H.; Landry, A.S. Diet quality in a nationally representative sample of American children by sociodemographic characteristics. Am. J. Clin. Nutr. 2019, 109, 127–138. [Google Scholar] [CrossRef] [Green Version]
- United States Department of Agriculture Economic Research Service. Food Security in the U.S.: Key Statistics and Graphics. 2020. Available online: https://www.ers.usda.gov/topics/food-nutrition-assistance/food-security-in-the-us/key-statistics-graphics/ (accessed on 2 August 2021).
- United States Department of Agriculture Economic Research Service. Definitions of Food Security. 2020. Available online: https://www.ers.usda.gov/topics/food-nutrition-assistance/food-security-in-the-us/definitions-of-food-security.aspx%0A (accessed on 2 August 2021).
- Cullen, K.W.; Chen, T.-A. The contribution of the USDA school breakfast and lunch program meals to student daily dietary intake. Prev. Med. Rep. 2017, 5, 82–85. [Google Scholar] [CrossRef]
- United States Department of Agriculture Food and Nutrition Service. Child Nutrition Programs. 2021. Available online: https://www.fns.usda.gov/cn (accessed on 20 July 2021).
- National School Lunch Program: Participation and Lunches Served. Washington, DC, USA. 2019. Available online: https://fns-prod.azureedge.net/sites/default/files/resource-files/slsummar-12.19.pdf (accessed on 29 May 2020).
- United States Department of Agriculture Food and Nutrition Services. School Breakfast Program Participation and Meals Served. 2019. Available online: https://fns-prod.azureedge.net/sites/default/files/resource-files/sbsummar-12.19.pdf (accessed on 1 September 2020).
- Gundersen, C.; Kreider, B.; Pepper, J. The impact of the national school lunch program on child health: A nonparametric bounds analysis. J. Econom. 2012, 166, 79–91. [Google Scholar] [CrossRef] [Green Version]
- Fox, M.K.; Gearan, E. School Nutrition and Meal Cost Study: Summary of Findings. 2019. Available online: https://fns-prod.azureedge.net/sites/default/files/resource-files/SNMCS_Summary-Findings.pdf (accessed on 7 May 2020).
- Liu, J.; Micha, R.; Li, Y.; Mozaffarian, D. Trends in food sources and diet quality among US children and adults, 2003–2018. JAMA Netw. Open. 2021, 4, e215262. [Google Scholar] [CrossRef] [PubMed]
- Kenney, E.L.; Barrett, J.L.; Bleich, S.N.; Ward, Z.J.; Cradock, A.L.; Gortmaker, S.L. Impact of the healthy, hunger-free kids act on obesity trends. Health Aff. (Millwood) 2020, 39, 1122–1129. [Google Scholar] [CrossRef]
- Johnson, D.B.; Podrabsky, M.; Rocha, A.; Otten, J.J. Effect of the healthy hunger-free kids act on the nutritional quality of meals selected by students and school lunch participation rates. JAMA Pediatr. 2016, 170, e153918. [Google Scholar] [CrossRef] [Green Version]
- Kinderknecht, K.; Harris, C.; Jones-Smith, J. Association of the healthy, hunger-free kids act with dietary quality among children in the US national school lunch program. JAMA 2020, 324, 359–368. [Google Scholar] [CrossRef]
- Au, L.E.; Gurzo, K.; Gosliner, W.; Webb, K.L.; Crawford, P.B.; Ritchie, L.D. Eating school meals daily is associated with healthier dietary intakes: The healthy communities study. J. Acad. Nutr. Diet. 2018, 118, 1474–1481.e1. [Google Scholar] [CrossRef] [PubMed]
- Schwartz, A.E.; Rothbart, M.W. Let them eat lunch: The impact of universal free meals on student performance. J. Policy Anal. Manag. 2020, 39, 376–410. [Google Scholar] [CrossRef]
- Dunn, C.G.; Kenney, E.; Fleischhacker, S.E.; Bleich, S.N. Feeding low-income children during the COVID-19 pandemic. N. Engl. J. Med. 2020, 382, e40. [Google Scholar] [CrossRef]
- Bauer, L. About 14 MILLION CHILDREN in the US are not Getting Enough to Eat. 2020. Available online: https://www.brookings.edu/blog/up-front/2020/07/09/about-14-million-children-in-the-us-are-not-getting-enough-to-eat/ (accessed on 2 August 2021).
- United States Department of Agriculture Food and Nutrition Services. Child Nutrition Programs: COVID-19 Waivers by State. 2021. Available online: https://www.fns.usda.gov/disaster/pandemic/covid-19/cn-waivers-flexibilities (accessed on 2 August 2021).
- United States Department of Agriculture Food and Nutrition Services. Community Eligibility Provision. 2019. Available online: https://www.fns.usda.gov/cn/community-eligibility-provision (accessed on 2 August 2021).
- School Nutrition Association. School Nutrition Meals Served and Reimbursements during the COVID-19 Pandemic. Arlington, VA. 2021. Available online: https://schoolnutrition.org/uploadedFiles/News_and_Publications/Press_Releases/Press_Releases/School-Nutrition-Meals-Served-and-Reimbursements-During-the-COVID-19-Pandemic.pdf (accessed on 18 June 2021).
- Lane, H.G.; Turner, L.; Dunn, C.G.; Hager, E.R.; Fleischhacker, S. leveraging implementation science in the public health response to COVID-19: Child food insecurity and federal nutrition assistance programs. Public Health Rep. 2020, 135, 728–736. [Google Scholar] [CrossRef] [PubMed]
- Damschroder, L.J.; Aron, D.C.; Keith, R.E.; Kirsh, S.R.; Alexander, J.A.; Lowery, J.C. Fostering implementation of health services research findings into practice: A consolidated framework for advancing implementation science. Implement. Sci. 2009, 4, 50. [Google Scholar] [CrossRef] [PubMed] [Green Version]
- Creswell, J.W.; Plano Clark, V.; Clark, V.L.P. Designing and Conducting Mixed Methods Research, 2nd ed.; SAGE Publications: Los Angeles, CA, USA, 2011; Available online: https://books.google.com/books?id=YcdlPWPJRBcC (accessed on 2 August 2021).
- Lane, H.G.; HER NOPREN COVID-19 School Nutrition Implications Working Group. Question Bank for Organizational Stakeholders in COVID-19 Nutrition Response. 2020. [cited 7 December 2021]. Available online: https://bit.ly/2Y3pBgh (accessed on 8 July 2021).
- Gale, N.K.; Heath, G.; Cameron, E.; Rashid, S.; Redwood, S. Using the framework method for the analysis of qualitative data in multi-disciplinary health research. BMC Med. Res. Methodol. 2013, 13, 117. [Google Scholar] [CrossRef] [PubMed] [Green Version]
- Gortmaker, S.L.; Long, M.W.; Resch, S.C.; Ward, Z.J.; Cradock, A.L.; Barrett, J.L.; Wright, D.R.; Sonneville, K.R.; Giles, C.M.; Carter, R.C.; et al. Cost effectiveness of childhood obesity interventions: Evidence and methods for CHOICES. Am. J. Prev. Med. 2015, 49, 102–111. [Google Scholar] [CrossRef]
- Drummond, M.F.; Sculpher, M.J.; Claxton, K.; Stoddart, G.L.; Torrance, G.W. Methods for the Economic Evaluation of Health Care Programmes; Oxford University Press: Oxford, UK, 2015. [Google Scholar]
- Elementary/Secondary Information System. National Center for Education Statistics. Available online: http://nces.ed.gov/ccd/elsi/ (accessed on 2 August 2021).
- Patten, E.V.; Spruance, L.; Vaterlaus, J.M.; Jones, M.; Beckstead, E. Disaster management and school nutrition: A qualitative study of emergency feeding during the COVID-19 pandemic. J. Acad. Nutr. Diet. 2021, 121, 1441–1453. [Google Scholar] [CrossRef] [PubMed]
- Patten, E.V.; Beckstead, E.; Jones, M.; Spruance, L.A.; Hayes, D. School nutrition professionals’ employee safety experiences during the onset of the COVID-19 pandemic. J. Nutr. Educ. Behav. 2021, 53, 2–9. [Google Scholar] [CrossRef]
- McLoughlin, G.M.; McCarthy, J.A.; McGuirt, J.T.; Singleton, C.R.; Dunn, C.G.; Gadhoke, P. Addressing food insecurity through a health equity lens: A case study of large urban school districts during the COVID-19 pandemic. J. Urban Health. 2020, 97, 759–775. [Google Scholar] [CrossRef] [PubMed]
- McLoughlin, G.M.; Fleischhacker, S.; Hecht, A.A.; McGuirt, J.; Vega, C.; Read, M.; Colon-Ramos, U.; Dunn, C.G. Feeding students during COVID-19-related school closures: A nationwide assessment of initial responses. J. Nutr. Educ. Behav. 2020, 52, 1120–1130. [Google Scholar] [CrossRef] [PubMed]
- Long, M.W.; Marple, K.; Andreyeva, T. Universal free meals associated with lower meal costs while maintaining nutritional quality. Nutrients 2021, 13, 670. [Google Scholar] [CrossRef] [PubMed]
- Cohen, J.F.W.; Hecht, A.A.; McLoughlin, G.M.; Turner, L.; Schwartz, M.B. Universal school meals and associations with student participation, attendance, academic performance, diet quality, food security, and body mass index: A systematic review. Nutrients 2021, 13, 911. [Google Scholar] [CrossRef] [PubMed]
- Hecht, A.A.; Pollack Porter, K.M.; Turner, L. Impact of the community eligibility provision of the healthy, hunger-free kids act on student nutrition, behavior, and academic outcomes: 2011–2019. Am. J. Public Health. 2020, 110, 1405–1410. [Google Scholar] [CrossRef] [PubMed]


| Median (Range) | |
| Number of students enrolled, 2018–2019 | 192,278 (55,214; 1,130,000) |
| Number of students enrolled, 2019–2020 1 | 190,014 (51,433; 1,131,868) |
| Total number of schools in district | 242 (118; 1841) |
| Elementary | 143 (73; 800) |
| Middle | 35 (6; 400) |
| High | 35 (20; 330) |
| Mean% (±SD) | |
| Schools participating in Community Eligibility Provision 2 | 72.3% (40.1) |
| Students qualifying for free/reduced price meals 2 | 79.8% (15.5) |
| Race/Ethnicity of students 3 | |
| White, non Hispanic | 16.5% (8.0) |
| Black, non-Hispanic | 36.0% (19.9) |
| Hispanic | 39.3% (20.1) |
| American Indian/Alaska Native | 0.1% (0.08) |
| Asian | 4.6% (3.4) |
| Native Hawaiian/Other Pacific Islander | 0.0% (0.1) |
| Other race | 0.6% (0.4) |
| Two or more races | 2.8% (1.0) |
| School Year 2018–2019 | Spring 2020 | Fall 2020 | ||||
|---|---|---|---|---|---|---|
| Median | Range | Median | Range | Median | Range | |
| Total student meals served per week 1 | 1,005,888 | (302,857; 4,750,000) | 318,190 | (28,419; 1,975,886) | 318,424 | (104,530; 808,210) |
| Breakfast | 313,235 | (108,000; 1,657,583) | 159,517 | (13,803; 844,506) | 112,733 | (37,697; 248,994) |
| Lunch | 601,065 | (159,429; 2,944,444) | 158,673 | (14,616; 905,814) | 147,308 | (37,780; 357,425) |
| Snack | 20,429 | (0; 277,778) | 0.0 | (0; 287,773) | 22,650 | (0.0; 157,323) |
| Supper | 41,317 | (0; 375,917) | 0.0 | (0; 103,458) | 25,897 | (0.0; 118,459) |
| Total meals served per week for other community members | 0.0 | (0; 0) | 102 | (0; 903,160) | 0.0 | (0.0; 491,109) |
| Theme | Sub-Theme | Illustrative Quotation(s) |
|---|---|---|
| Serving meals during COVID-19 was a highly complicated process CFIR Construct: “Intervention Characteristics” | Rapidly setting up school meals-to-go was a complex process | “We were called on a Friday afternoon at about 4:00 and told that the school district was closing and that Monday morning we needed to open up and we needed to be able to feed families. So we had just about 48 h to change our whole method of distribution” “With distribution initially, because it was so sudden we were initially just preparing out of our production site and just curbside. Numbers were really low. We knew that there were people out there, students out there that couldn’t get to the food, so we increasing it. We added bus routes. I think we initially started with one-hundred and twenty-eight, what we called distribution points… trying to find those communities where there was a high density of students that we might be able to reach” |
| Complexity of keeping staff COVID-safe | “Like they are low paid, right. Which is not it’s not a job that people like fight to get into, but they have like really showed up and really been scared…. they are really like unsung heroes.” “The first part was really trying to pivot and get prepackaged meals that we could then package in bundles to hand out every day. We couldn’t even pivot to the once a week or two to three day model because the logistics of the volume of it was just too high. We either have to double or triple the amount of sites open in order to get the volume to do more packaged in fewer days. And that we couldn’t do. Because at the time, it was just too risky to have that many staff members working and wanted to limit our exposure” | |
| Theme 2: The usual financial model of school food service is untenable during school closures CFIR construct: “Intervention Processes” | Delivering meals was simpler–and COVID-safe–for CEP schools | “Having the experience feeding CEP and feeding everyone already no charge made it a much easier transition for us than like a typical district where you would have your free, reduced and paid. And for a long time, you know, the policy was no you’re paid, you still have to pay, which was insane. And finally they changed that. So, you know, that was a nice piece of continuity to be able to continue to offer all meals at no cost to all students. Yeah, that that was a positive.” |
| Financial model, depending on reimbursements, does not work during emergencies | “Funding needs to be probably looked at a little differently. You kind of got your regular mode of what you going, like if you have a captured audience, but if you don’t have a captive audience when it’s crisis emergency mode, we got to be able to pivot quickly to say we just need to you need to fund us for our expenses. I mean, obviously, we’re going to try with the help of whoever else. Right. But this current per meal model is awful. It’s awful for this crisis. It just doesn’t work.” “You know, I just give a quick reference, I’ve been in the hospitality business now 41 years. And anybody who’s been in that business, you understand that you control your food and your labor, you’re good. If you don’t have a control on them, you’re toast. Having said that, you know, our labor costs in our district are high. You might be aware that all our Part-Time workers are also fully benefited. So our labor cost is extremely high and our reimbursement is still the same.” | |
| Theme 3: The existing culture of School Food Authorities sustained morale throughout the pandemic CFIR Construct: “Inner Setting” | Culture of commitment to fighting hunger | “And so I wouldn’t say that the financial considerations they’re, they’re being considered. But at that moment it was, how do we make our meals accessible to the children and the families of our community?” “You’re just like, we’re going to work through this. I have a positive attitude, right. We going to work through it. I don’t know how yet. But the thing is we’re going to feed kids and we don’t want to turn people away.” “But I’m like we always feed. So it was just I mean, granted, we pivoted quickly, but we always feed and it’s kind of always our mindset… hey, we’re not going to turn families away.” |
| Demonstrated grit by underappreciated food service staff | “The one thing I will say, you know, I just need to call out our amazing people both here in [district] and I know in school districts all across the country. I’m just you know, I’ve said this one time on an interview and, you know, when I was young, my heroes were like Superman and stuff like that. And now my heroes are are these amazing men and women that just put themselves on the front line in a time where things were a lot more uncertain about how COVID spreads and and, you know, gearing up to try to take care of kids. And I’m just so proud of the men and women of our department. I just can’t say enough about them. They’re, they’re really my heroes.... And, you know, they, they just hit it. So they hit the nail on the head. You know, we’re here for kids and we’re going to take care of our kids, whether they’re in school or not in school, whether school was open or it’s closed. You know, we have a responsibility here and an obligation. And I’m just so proud of them. And I’ll never be able to say thank you enough for them.” | |
| Theme 4: External policies and factors that influenced implementation CFIR Construct: “Outer Setting” | Poor coordination and communication at multiple levels of government. Some SFAs reported that their city leadership announced that adults could pick up meals at meal distribution sites without telling them first | “[We had] to hold the superintendent back, as they are out there trying to encourage people to come and them to do more, but they have to give him a realistic picture of their capacity” “Even as I, we certainly appreciated USDA making all of these waivers and changes. It was wonderful that we created an ease and a burden for us, but not necessarily reflective of what we, how we could get [to] families.” |
| Relationship with other food safety net programs. Pandemic-EBT perceived as beneficial for families, but some districts also perceived that it caused reduced participation in school meals to go, while others perceived no change. | “And then secondly is that families said to me, “We would really love if we could just have more P-EBT funding, which is the pandemic EBT, because we could be able to make the meals that that my kids will recognize and that, that it’s much more convenient and that I can buy what I’m looking for. And then I can also go through like Amazon Fresh or Whole Foods and get it delivered, which is, you guys cannot.” “We actually reduced the amount of distribution sites. We saw towards the end of the spring that the numbers were starting to go down. The P-EBT pandemic card was being, students, families were being informed of that. So that was starting to occur.” “Yeah, I think the P-EBT program, I will also say, has been a good program in my opinion. It seems like families are really benefiting from it and people are trying to take advantage of having it. And I think that’s a great thing for families to have access to. So I hope that that is something that is considered so that if and when this happens in the future, you know, that that’s something that could just be counted on versus like the spotty... It would just be nice to know that that family has had that through the end of the pandemic, at least from that aspect. Fixing our bottom line is a different story.” | |
| Learning Communities | “We have a coalition, like I said, of about 50 partners, and we meet on a quarterly basis or every, I would say every two months or three months. So it might be four to five meetings a year, so I had those meetings throughout this process and we certainly listened to feedback that we had from our partners. Some of them are parent partners and some of them are educational or organizational partners. We also listened to the Urban School Food Alliance partners very closely. We had an emergency COVID call weekly during the spring and summer. And as a result, we would share best practices and concepts with each other about how we were doing the work.” “One of the most important elements was the Urban School Food Alliance and our peer school districts. We did a lot of sharing of best ideas, best approaches, what works, what doesn’t work. And so we were really able to learn from each other’s experience and really kind of kind of, you know, raise the boat for for children across the entire country in our respective cities and school districts. Just by that that sharing process and benchmarking, we would look at what is somebody’s participation down there in [state] and how are they doing in [district] and [district] and [district] and kind of gave us a sense excuse me, you know, gave us a sense of performance.” |
| School Year 2018–2019 | Spring 2020 | Fall 2020 1 | ||||
|---|---|---|---|---|---|---|
| Median | Range | Median | Range | Median | Range | |
| Total revenue, weekly | USD 3,137,289 | 971,429; 15,000,000 | USD 1,091,332 | 141,562; 5,022,718 | USD 1,115,780 | 316,726; 2,068,162 |
| Total expense, weekly | USD 3,119,768 | USD 986,221; USD 15,777,778 | USD 2,084,734 | 537,034; 16,450,042 | USD 1,314,836 | 947,713; 2,103,399 |
| Revenue per meal | USD 3.11 | 2.75; 3.21 | USD 3.48 | 2.21; 6.15 | USD 2.98 | 1.83; 3.85 |
| Reimbursement | USD 3.11 | 2.75; 3.21 | USD 3.20 | 1.78; 5.43 | USD 2.98 | 1.83; 3.85 |
| Donations received | USD 0.00 | 0.0; 0.0 | USD 0.07 | 0.00; 1.86 | USD 0.00 | 0.00; 0.00 |
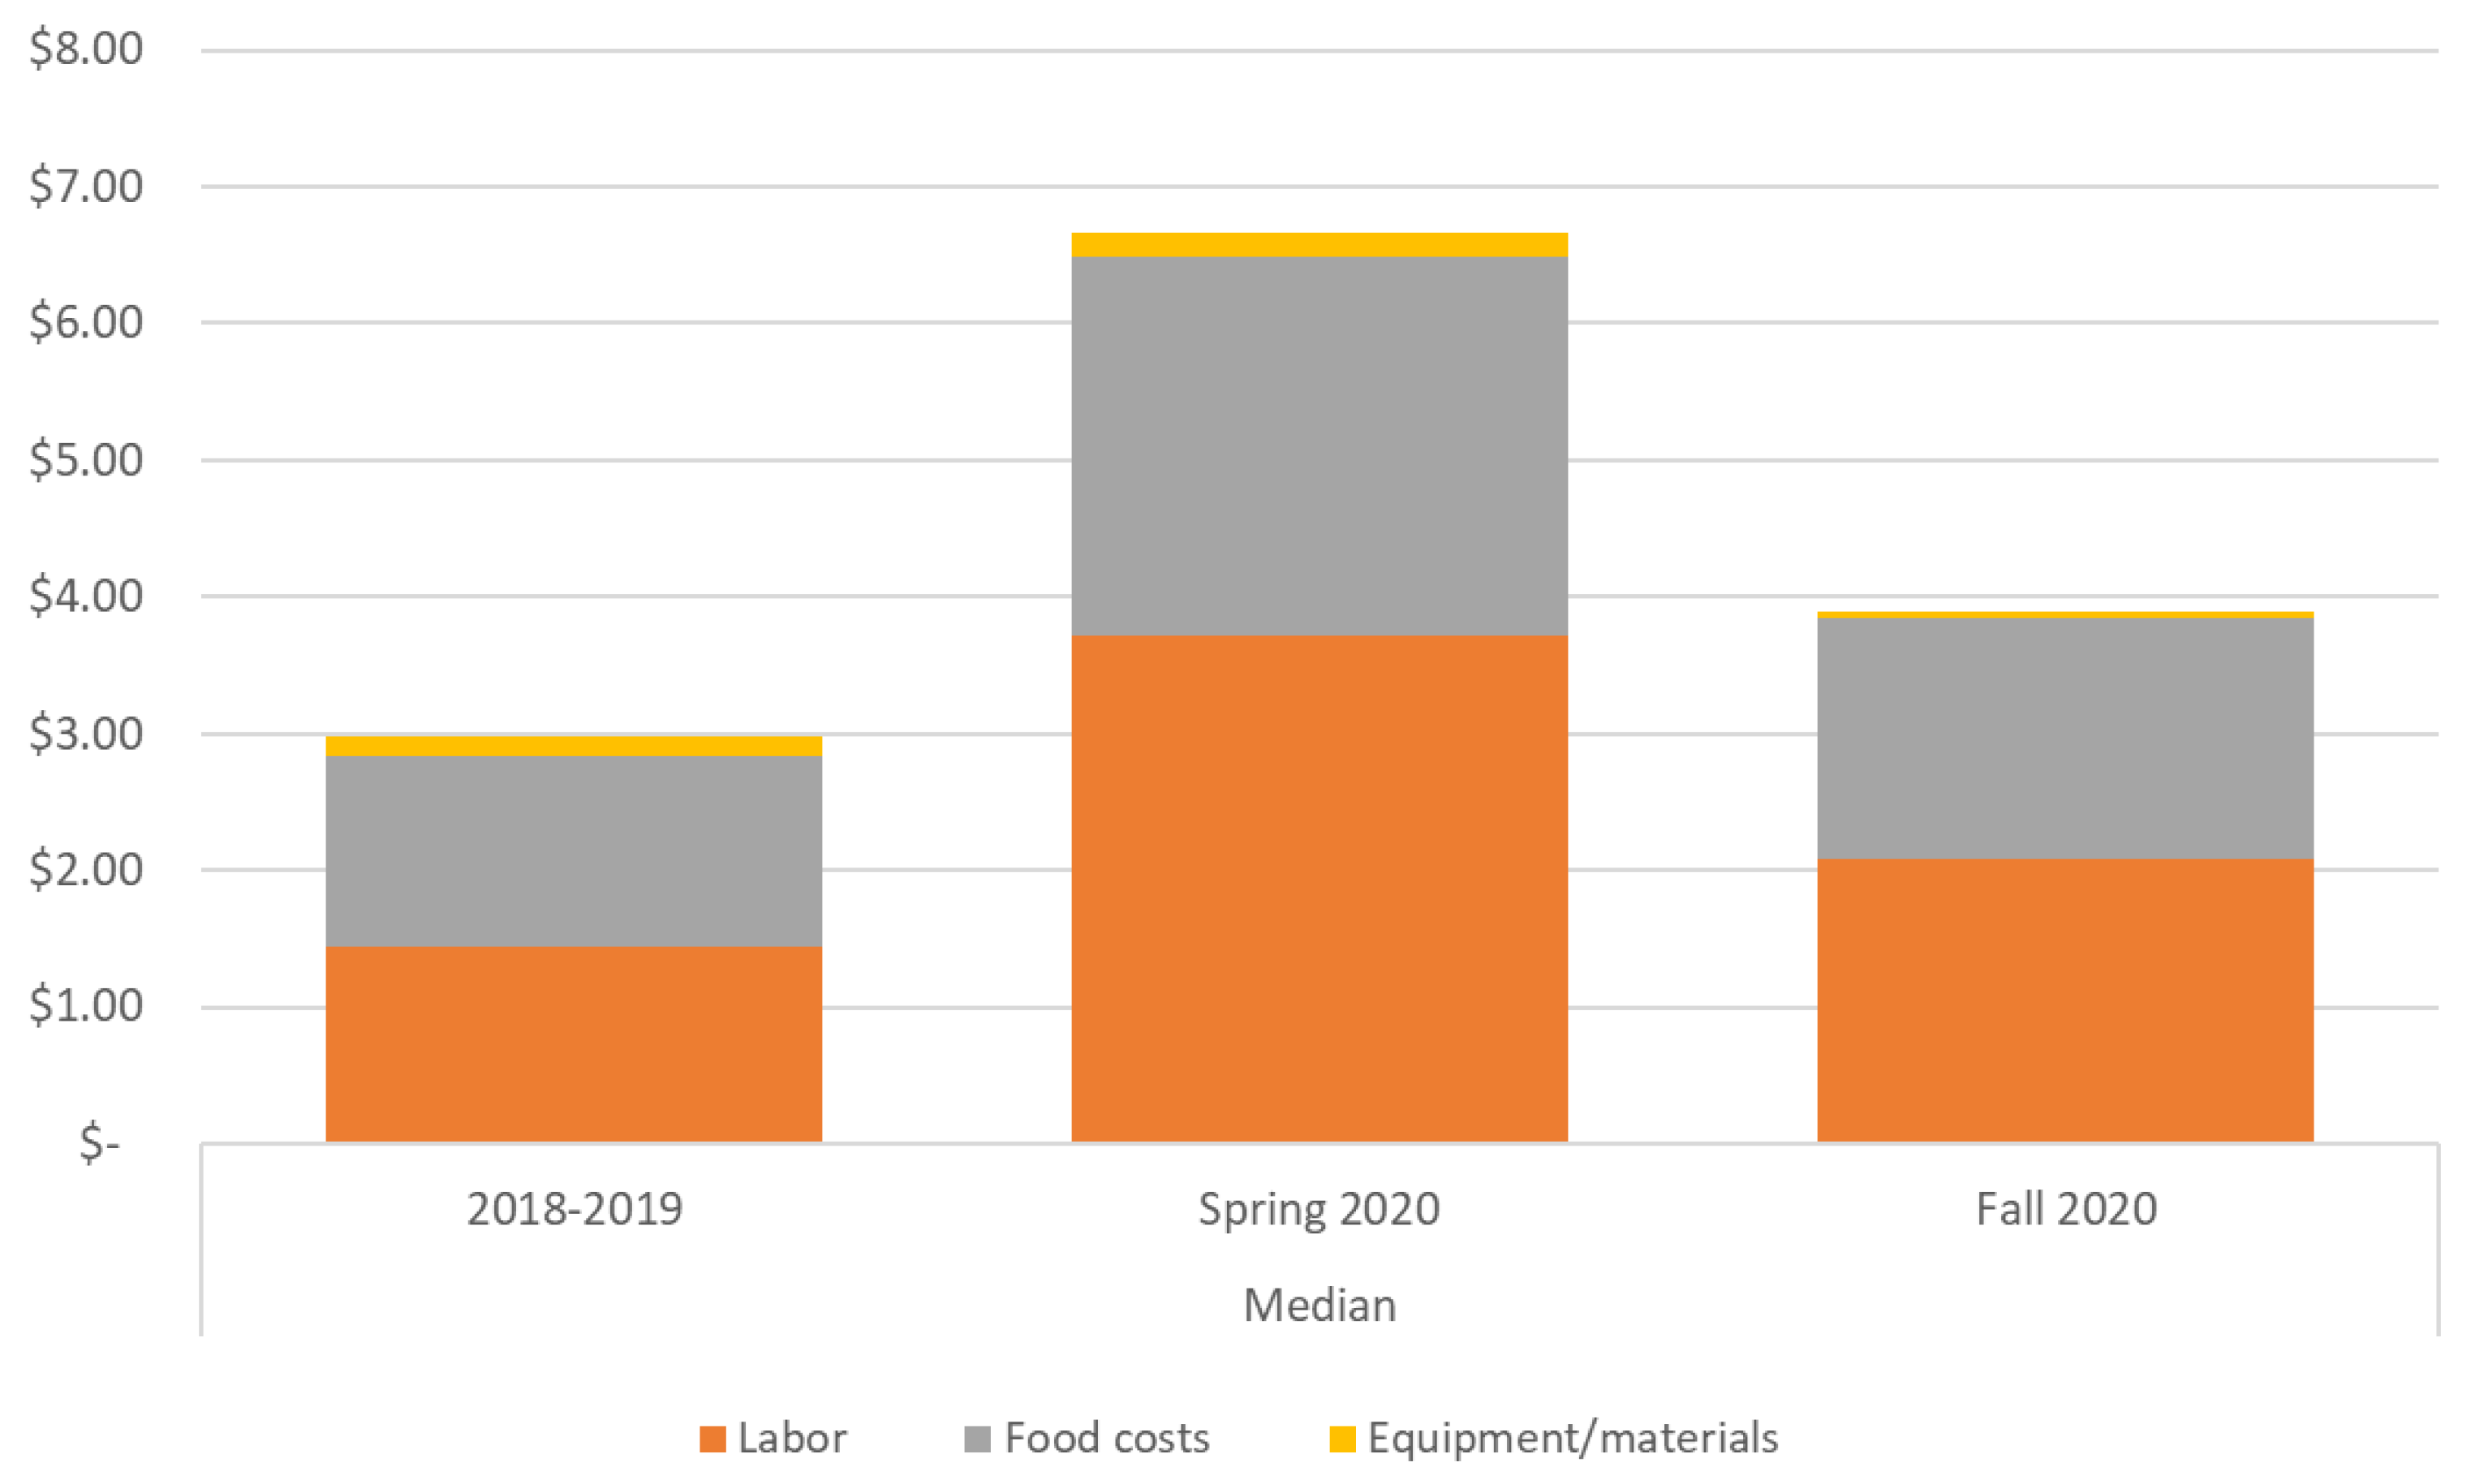
| Expenses per meal | USD 3.21 | 2.38; 4.32 | USD 6.61 | 2.92; 58.76 | USD 3.54 | 1.95; 12.57 |
| Labor | USD 1.44 | 1.18; 1.89 | USD 3.71 | 1.71; 42.83 | USD 2.08 | 0.67; 7.39 |
| Food costs | USD 1.40 | 1.13; 2.32 | USD 2.78 | 0.75; 7.45 | USD 1.76 | 0.62; 4.79 |
| Equipment/materials | USD 0.15 | 0.02; 0.58 | USD 0.18 | 0.01; 7.45 | USD 0.06 | 0.01; 1.39 |
| Community meal expenses | N/A | N/A | USD 0.00 | 0.00; 3.70 | USD 0.00 | 0.00; 0.00 |
| Net per meal | −USD 0.02 | −1.21; 0.43 | −USD 3.45 | −53.40; −0.38 | −USD 0.65 | −9.24; 0.87 |
Publisher’s Note: MDPI stays neutral with regard to jurisdictional claims in published maps and institutional affiliations. |
© 2021 by the authors. Licensee MDPI, Basel, Switzerland. This article is an open access article distributed under the terms and conditions of the Creative Commons Attribution (CC BY) license (https://creativecommons.org/licenses/by/4.0/).
Share and Cite
Kenney, E.L.; Dunn, C.G.; Mozaffarian, R.S.; Dai, J.; Wilson, K.; West, J.; Shen, Y.; Fleischhacker, S.; Bleich, S.N. Feeding Children and Maintaining Food Service Operations during COVID-19: A Mixed Methods Investigation of Implementation and Financial Challenges. Nutrients 2021, 13, 2691. https://0-doi-org.brum.beds.ac.uk/10.3390/nu13082691
Kenney EL, Dunn CG, Mozaffarian RS, Dai J, Wilson K, West J, Shen Y, Fleischhacker S, Bleich SN. Feeding Children and Maintaining Food Service Operations during COVID-19: A Mixed Methods Investigation of Implementation and Financial Challenges. Nutrients. 2021; 13(8):2691. https://0-doi-org.brum.beds.ac.uk/10.3390/nu13082691
Chicago/Turabian StyleKenney, Erica L., Caroline G. Dunn, Rebecca S. Mozaffarian, Jane Dai, Katie Wilson, Jeremy West, Ye Shen, Sheila Fleischhacker, and Sara N. Bleich. 2021. "Feeding Children and Maintaining Food Service Operations during COVID-19: A Mixed Methods Investigation of Implementation and Financial Challenges" Nutrients 13, no. 8: 2691. https://0-doi-org.brum.beds.ac.uk/10.3390/nu13082691