
Dietary and Health Correlates of Sweetened Beverage Intake: Sources of Variability in the National Health and Nutrition Examination Survey (NHANES)

 , ,
, ,
Abstract
:1. Introduction
2. Phase 1
2.1. Methods—Phase 1
2.2. Results—Phase 1
2.2.1. Strategy 1: Organizational Structure of FNDDS
2.2.2. Strategy 2: WWEIA Categories
2.2.3. Strategy 3: Caloric Density
2.2.4. Strategy 4: Text-Based Searches of FNDDS Food Code Descriptions and Other Combined Strategies
3. Phase 2
3.1. Methods—Phase 2
3.2. Results—Phase 2
3.2.1. Advantages and Disadvantages of Current Categorization Approaches
Numbers of LCSB Foodcodes Identified Using Strategy 1
Numbers of LCSB Foodcodes Identified Using Strategy 2
Numbers of LCSB Foodcodes Identified Using Strategy 3
Numbers of LCSB Foodcodes Identified Using Strategy 4
3.2.2. Additional Challenges of Using WWEIA/NHANES/FNDDS in Studies of LCSBs and Dietary and Health Outcomes
Ambiguous Foodcodes
Temporal Changes
Calculating Water Intake
Converting between Volume and Weight across Beverages
4. Phase 3
4.1. Methods—Phase 3
4.2. Results—Phase 3
5. Discussion
Supplementary Materials
Author Contributions
Funding
Institutional Review Board Statement
Informed Consent Statement
Data Availability Statement
Conflicts of Interest
References
- Hu, F.B. Resolved: There Is Sufficient Scientific Evidence That Decreasing Sugar-Sweetened Beverage Consumption Will Reduce the Prevalence of Obesity and Obesity-Related Diseases. Obes. Rev. 2013, 14, 606–619. [Google Scholar] [CrossRef] [PubMed]
- Centers for Disease Control and Prevention. National Center for Health Statistics (Hyattsville, MD) NHANES Questionnaires, Datasets, and Related Documentation. Available online: https://wwwn.cdc.gov/nchs/nhanes/continuousnhanes/default.aspx (accessed on 15 December 2020).
- U.S. Department of Agriculture. A.R.S. WWEIA/NHANES Overview: USDA ARS. Available online: https://www.ars.usda.gov/northeast-area/beltsville-md-bhnrc/beltsville-human-nutrition-research-center/food-surveys-research-group/docs/wweianhanes-overview/ (accessed on 15 December 2020).
- U.S. Department of Agriculture. A.R.S. USDA Food and Nutrient Database for Dietary Studies 2011–2012. Available online: https://www.ars.usda.gov/ARSUserFiles/80400530/pdf/fndds/fndds_2011_2012_doc.pdf (accessed on 9 March 2021).
- U.S. Department of Agriculture. A.R.S. USDA Food and Nutrient Database for Dietary Studies 2013–2014. Available online: https://www.ars.usda.gov/ARSUserFiles/80400530/pdf/fndds/fndds_2013_2014.pdf (accessed on 9 March 2021).
- U.S. Department of Agriculture. A.R.S. USDA Food and Nutrient Database for Dietary Studies 2015–2016. Available online: https://www.ars.usda.gov/ARSUserFiles/80400530/pdf/fndds/FNDDS_2015_2016_factsheet.pdf (accessed on 9 March 2021).
- Sylvetsky, A.C.; Figueroa, J.; Zimmerman, T.; Swithers, S.E.; Welsh, J.A. Consumption of Low-Calorie Sweetened Beverages Is Associated with Higher Total Energy and Sugar Intake among Children, NHANES 2011-2016. Pediatr. Obes. 2019, 14, e12535. [Google Scholar] [CrossRef] [PubMed]
- An, R. Beverage Consumption in Relation to Discretionary Food Intake and Diet Quality among US Adults, 2003 to 2012. J. Acad. Nutr. Diet 2015, 116, 28–37. [Google Scholar] [CrossRef]
- Bleich, S.N.; Wolfson, J.A.; Vine, S.; Wang, Y.C. Diet-Beverage Consumption and Caloric Intake among US Adults, Overall and by Body Weight. Am. J. Public Health 2014, 104, e72–e78. [Google Scholar] [CrossRef]
- DellaValle, D.M.; Malek, A.M.; Hunt, K.J.; St. Peter, J.V.; Greenberg, D.; Marriott, B.P. Low-Calorie Sweeteners in Foods, Beverages, and Food and Beverage Additions: NHANES 2007–2012. Curr. Dev. Nutr. 2018, 2, nzy024. [Google Scholar] [CrossRef] [PubMed]
- Demmer, E.; Cifelli, C.J.; Houchins, J.A.; Fulgoni, V.L. Ethnic Disparities of Beverage Consumption in Infants and Children 0–5 Years of Age; National Health and Nutrition Examination Survey 2011 to 2014. Nutr. J. 2018, 17, 78. [Google Scholar] [CrossRef] [PubMed] [Green Version]
- Drewnowski, A.; Rehm, C.D. Socio-Demographic Correlates and Trends in Low-Calorie Sweetener Use among Adults in the United States from 1999 to 2008. Eur. J. Clin. Nutr. 2015, 69, 1035–1041. [Google Scholar] [CrossRef]
- Ford, C.N.; Ng, S.W.; Popkin, B.M. Ten-Year Beverage Intake Trends among US Preschool Children: Rapid Declines between 2003 and 2010 but Stagnancy in Recent Years. Pediatr. Obes. 2016, 11, 47–53. [Google Scholar] [CrossRef] [Green Version]
- Grimes, C.A.; Szymlek-Gay, E.A.; Nicklas, T.A. Beverage Consumption among U.S. Children Aged 0-24 Months: National Health and Nutrition Examination Survey (NHANES). Nutrients 2017, 9, 264. [Google Scholar] [CrossRef]
- Leahy, M.; Ratliff, J.C.; Riedt, C.S.; Fulgoni, V.L. Consumption of Low-Calorie Sweetened Beverages Compared to Water Is Associated with Reduced Intake of Carbohydrates and Sugar, with No Adverse Relationships to Glycemic Responses: Results from the 2001-2012 National Health and Nutrition Examination Surveys. Nutrients 2017, 9, 928. [Google Scholar] [CrossRef] [Green Version]
- Maillot, M.; Vieux, F.; Rehm, C.D.; Rose, C.M.; Drewnowski, A. Consumption Patterns of Milk and 100% Juice in Relation to Diet Quality and Body Weight Among United States Children: Analyses of NHANES 2011-16 Data. Front. Nutr. 2019, 6, 117. [Google Scholar] [CrossRef] [PubMed] [Green Version]
- Malek, A.M.; Hunt, K.J.; DellaValle, D.M.; Greenberg, D.; St. Peter, J.V.; Marriott, B.P. Reported Consumption of Low-Calorie Sweetener in Foods, Beverages, and Food and Beverage Additions by US Adults: NHANES 2007–2012. Curr. Dev. Nutr. 2018, 2, nzy054. [Google Scholar] [CrossRef]
- Mesirow, M.S.C.; Welsh, J.A. Changing Beverage Consumption Patterns Have Resulted in Fewer Liquid Calories in the Diets of US Children: National Health and Nutrition Examination Survey 2001-2010. J. Acad. Nutr. Diet. 2015, 115, 559–566.e4. [Google Scholar] [CrossRef] [PubMed]
- Rusmevichientong, P.; Mitra, S.; McEligot, A.J.; Navajas, E. The Association between Types of Soda Consumption and Overall Diet Quality: Evidence from National Health and Nutrition Examination Survey (NHANES). Calif. J. Health Promot. 2018, 16, 12. [Google Scholar] [CrossRef] [Green Version]
- Shriver, L.H.; Marriage, B.J.; Bloch, T.D.; Spees, C.K.; Ramsay, S.A.; Watowicz, R.P.; Taylor, C.A. Contribution of Snacks to Dietary Intakes of Young Children in the United States. Matern. Child Nutr. 2018, 14, e12454. [Google Scholar] [CrossRef] [Green Version]
- Sylvetsky, A.C.; Jin, Y.; Clark, E.J.; Welsh, J.A.; Rother, K.I.; Talegawkar, S.A. Consumption of Low-Calorie Sweeteners among Children and Adults in the United States. J. Acad. Nutr. Diet. 2017, 117, 441–448.e2. [Google Scholar] [CrossRef] [PubMed]
- Watowicz, R.P.; Taylor, C.A. A Comparison of Beverage Intakes in US Children Based on WIC Participation and Eligibility. J. Nutr. Educ. Behav. 2014, 46, S59–S64. [Google Scholar] [CrossRef]
- U.S. Department of Agriculture, A.R.S. WWEIA Documentation and Data Sets: USDA ARS. Available online: https://www.ars.usda.gov/northeast-area/beltsville-md-bhnrc/beltsville-human-nutrition-research-center/food-surveys-research-group/docs/wweia-documentation-and-data-sets/ (accessed on 15 December 2020).
- CFR—Code of Federal Regulations Title 21. Available online: https://web.archive.org/web/20100116095434/https://www.accessdata.fda.gov/scripts/cdrh/cfdocs/cfcfr/CFRSearch.cfm?fr=101.12 (accessed on 28 December 2020).
- Wayback Machine. Available online: https://web.archive.org/ (accessed on 26 February 2021).
- Arora, S.K.; Li, Y.; Youtie, J.; Shapira, P. Using the Wayback Machine to Mine Websites in the Social Sciences: A Methodological Resource. J. Assoc. Inf. Sci. Technol. 2016, 67, 1904–1915. [Google Scholar] [CrossRef]
- Diet Snapple Juice. Available online: https://web.archive.org/web/20140608083430/http://www.dpsgproductfacts.com:80/product/SNAPPLE_DIET_CRANBERRY_RASPBERRY_JUICE_DRINK_16 (accessed on 28 December 2020).
- Dr Pepper Snapple Group Product Facts. Available online: https://web.archive.org/web/20160415035214/http://www.dpsgproductfacts.com/en/product/SNAPPLE_DIET_CRANBERRY_RASPBERRY_JUICE_DRINK_16 (accessed on 18 June 2021).
- Dr Pepper Snapple Group Product Facts. Available online: https://web.archive.org/web/20141025205315/http://www.dpsgproductfacts.com:80/product/PENAFIEL_APPLE_MINERAL_SPRING_WATER_12 (accessed on 23 March 2021).
- Auspurg, K.; Brüderl, J. Has the Credibility of the Social Sciences Been Credibly Destroyed? Reanalyzing the “Many Analysts, One Data Set” Project. Socius 2021, 7, 237802312110244. [Google Scholar] [CrossRef]
- Brandt, A.M. Inventing Conflicts of Interest: A History of Tobacco Industry Tactics. Am. J. Public Health 2012, 102, 63–71. [Google Scholar] [CrossRef] [PubMed]
- Schillinger, D.; Tran, J.; Mangurian, C.; Kearns, C. Do Sugar-Sweetened Beverages Cause Obesity and Diabetes? Industry and the Manufacture of Scientific Controversy. Ann. Intern. Med. 2016, 165, 895–897. [Google Scholar] [CrossRef]
- Nestle, M. Corporate Funding of Food and Nutrition Research: Science or Marketing? JAMA Intern. Med. 2016, 176, 13–14. [Google Scholar] [CrossRef] [PubMed]
- Mandrioli, D.; Kearns, C.E.; Bero, L.A. Relationship between Research Outcomes and Risk of Bias, Study Sponsorship, and Author Financial Conflicts of Interest in Reviews of the Effects of Artificially Sweetened Beverages on Weight Outcomes: A Systematic Review of Reviews. PLoS ONE 2016, 11, e0162198. [Google Scholar] [CrossRef] [PubMed] [Green Version]
- Lesser, L.I.; Ebbeling, C.B.; Goozner, M.; Wypij, D.; Ludwig, D.S. Relationship between Funding Source and Conclusion among Nutrition-Related Scientific Articles. PLoS Med 2007, 4, e5. [Google Scholar] [CrossRef] [PubMed]
- Sousa, A.; Sych, J.; Rohrmann, S.; Faeh, D. The Importance of Sweet Beverage Definitions When Targeting Health Policies-The Case of Switzerland. Nutrients 2020, 12, 1976. [Google Scholar] [CrossRef] [PubMed]


| Reference | NHANES Cycles Used | Foodcode Identity Reported | Number of Foodcodes | Unsweetened Beverages Included | Strategy |
|---|---|---|---|---|---|
| An, 2015 [8] | 2003–2012 | No | 25 * | No | 4 |
| Bleich et al., 2014 [9] | 2001–2010 | No | 14 * | No | 1 |
| DellaValle et al., 2018 [10] | 2007–2012 | No | Unknown | No | 4 |
| Demmer et al., 2018 [11] | 2011–2014 | No | 31 ** | No | 2 |
| Drewnowski and Rehm, 2015 [12] | 1999–2008 | No | Unknown | Unknown | 4 |
| Ford et al., 2016 [13] | 2003–2012 | Yes | 54 * | Yes | 4 |
| Grimes et al., 2017 [14] | 2005–2012 | Yes | 28 * | No | 2 |
| Leahy et al., 2017 [15] | 2001–2012 | Yes | 33 * | No | 3 |
| Maillot et al., 2019 [16] | 2011–2016 | No | Unknown | Unknown | 3 |
| Malek et al., 2018 [17] | 2007–2012 | No | Unknown | No | 4 |
| Mesirow and Welsh, 2015 [18] | 2001–2010 | Yes | 107 *** | Yes | 3 |
| Rusmevichientong et al., 2018 [19] | 2005–2012 | No | 14 ** | No | 1 |
| Shriver, 2018 [20] | 2005–2012 | No | Unknown | No | 2 |
| Sylvetsky, 2017 [21] | 2009–2012 | No | 136 *** | No | 4 |
| Sylvetsky, 2019 [7] | 2011–2016 | No | 148 *** | No | 4 |
| Watowicz, 2014 [22] | 2005–2010 | No | Unknown | Unknown | 2 |
| Foodcode | WWEIA Category | Main Food Description | Brands | LCS (as Listed by Mfr) | Kcal/8 oz | |
|---|---|---|---|---|---|---|
| Mfr | FNDDS | |||||
| 92550030 | 7204—Fruit drinks | Fruit juice drink, with high vitamin C, light | Light Hawaiian Punch | Sucralose, AceK | 10 | 46 |
| Minute Maid Light juice drinks | Aspartame, AceK | 15 | ||||
| Tropicana Light lemonade | Sucralose * Aspartame, AceK * | * 10 * 5 | ||||
| 92550035 | 7204—Fruit drinks | Fruit juice drink, light | Minute Maid Light fruit punch ** | Aspartame, AceK ** | 15 | 94 |
| Sunsweet prune juice light ** | Sucralose ** | 100 | ||||
| PlumsmartTM Light plum juice ** | ** Sucralose ** | 60 | ||||
| 92550040 | 7204—Fruit drinks | Fruit juice drink, diet | Diet Snapple juice drinks, all flavors | Aspartame | 10 | 46 |
| 92550110 | 7204—Fruit drinks | Cranberry juice drink, with high vitamin C, light | Ocean Spray Light Cranberry Juice Cocktail | Sucralose | 50 | 46 |
| Apple and Eve Light Cranberry juice drinks | Sucralose, AceK | 10 | ||||
| 92550200 | 7204—Fruit drinks | Grape juice drink, light | Welch’s Light juice drinks | Sucralose, AceK | 45 | 50 |
| 92550350 | 7204—Fruit drinks | Orange juice beverage, 40–50% juice, light | Tropicana Trop 50 | RebA | 50 | 50 |
| Minute Maid Light | Sucralose, AceK | 50 | ||||
| Dole Light | *** | *** | ||||
| 92550360 | 7204—Fruit drinks | Apple juice beverage, 40–50% juice, light | Tropicana Trop 50 | RebA | 50 | 55 |
| Mott’s Light | Sucralose | 50 | ||||
| 92550370 | 7204—Fruit drinks | Lemonade, fruit juice drink, light | Tropicana Trop 50 Lemonade | RebA | 50 | 52 |
| 92550380 | 7204—Fruit drinks | Pomegranate juice beverage, 40–50% juice, light | POM Lite, all flavors | None | 75 | 130 |
| 92550400 | 7106—Other diet drinks | Vegetable and fruit juice drink, with high vitamin C, diet | Diet V8 Splash, all flavors, low calorie | Sucralose, AceK | 10 | 10 |
| 92550405 | 7204—Fruit drinks | Vegetable and fruit juice drink, with high vitamin C, light | V8 V-Fusion Light, all flavors | Sucralose | 50 | 10 |
| 92550610 | 7106—Other diet drinks | Fruit flavored drink, with high vitamin C, diet | Diet Ocean Spray cranberry, blueberry, or pomegranate blends | AceK, Sucralose | 5 | 5 |
| 92550620 | 7106—Other diet drinks | Fruit flavored drink, diet | Crystal Light | Sucralose, AceK | 5 | 10 |
| Minute Maid Light | Aspartame, AceK | 15 | ||||
| 92552000 | 7106—Other diet drinks | Fruit flavored drink, with high vitamin C, powdered, reconstituted, diet | Sugar Free Tang (On-the-Go) | Aspartame, AceK | 5 | 5 |
| Country Time Lite lemonade ^ | Sucralose, AceK, Neotame ^ | 35 ^ | ||||
| Ocean Spray drink mix, low calorie | Aspartame, AceK | 5 | ||||
| 92552010 | 7106—Other diet drinks | Fruit flavored drink, powdered, reconstituted, diet | Crystal Light ^^ | Aspartame, AceK ^^ Rebiana ^^ | 5–15 ^^ | 5 |
| Sugar Free Kool-Aid | Aspartame, AceK | 5 | ||||
| Wyler’s Light | Aspartame, AceK | 5 | ||||
| 92552020 | 7204—Fruit drinks | Sunny D, reduced sugar | Reduced Sugar Sunny Delight fruit juice drink, all flavors ^ | Sucralose, AceK, Neotame ^ | 60 ^ | 5 |
| 92552030 | 7204—Fruit drinks | Capri Sun, fruit juice drink | Capri Sun, NFS, 25% less sugar | None | 94 | 97 |
| Brands Listed | LCS | Kcal/8 oz |
|---|---|---|
| Apple and Eve juice drinks | None | 110 |
| Florida’s Naturals juice cocktails | None | 130 |
| Hawaiian Punch | Sucralose, AceK * | 60 |
| Sucralose * | 60 | |
| Hi-C | None | 110 |
| Kool-Aid Jammers | Sucralose | 30 |
| Minute Maid | None ** | 110 ** |
| Sucralose ** | 90 ** | |
| Minute Maid Coolers | None | 120 |
| Ocean Spray juice drink or cocktail, flavors other than cranberry | None | 110 |
| Ssips | None | 120 |
| Tropicana fruit punch | None | 130 |
| Tropicana Lemonade, chilled carton | None | 120 |
| Tropicana Twister, all flavors except lemonade | None | 140 |
| Rank | Foodcode | Description | WWEIA Category | SBs oz Reported | LCSBs oz Reported | Number of Reports |
|---|---|---|---|---|---|---|
| 1 | 92410510 | Soft drink, fruit flavored, caffeine free | 7202 Soft drinks | 10,455 | - | 994 |
| 2 | 92410310 | Soft drink, cola | 7202 Soft drinks | 8355 | - | 763 |
| 3 | 64104010 | Apple juice, 100% | 7004 Apple juice | 6668 | - | 864 |
| 4 | 92530610 | Fruit juice drink, with high vitamin C | 7204 Fruit drinks | - | 6541 | 668 |
| 5 | 95320200 | Gatorade G sports drink | 7206 Sport and energy drinks | 5420 | - | 345 |
| 6 | 92541010 | Fruit flavored drink, powdered, reconstituted | 7204 Fruit drinks | 3430 | 1060 | 387 |
| 7 | 61210220 | Orange juice, 100%, canned, bottled or in a carton | 7002 Citrus juice | 4284 | - | 546 |
| 8 | 61210250 | Orange juice, 100%, with calcium added, canned, bottled or in a carton | 7002 Citrus juice | 3154 | - | 409 |
| 9 | 92552030 | Capri Sun, fruit juice drink | 7204 Fruit drinks | 2796 | - | 353 |
| 10 | 64100110 | Fruit juice blend, 100% juice | 7006 Other fruit juice | 2731 | - | 310 |
| Water 1 | LCSBs 2 | SBs 3 | SBs + LCSBs 4 | |||
|---|---|---|---|---|---|---|
| Sample Size | Original [20] | n = 1077 | n = 345 | n = 4907 | n = 697 | |
| Mixed—LCSB | n = 1038 | n = 589 | n = 4288 | n = 1093 | ||
| Mixed—SB | n = 1038 | n = 273 | n = 5160 | n = 549 | ||
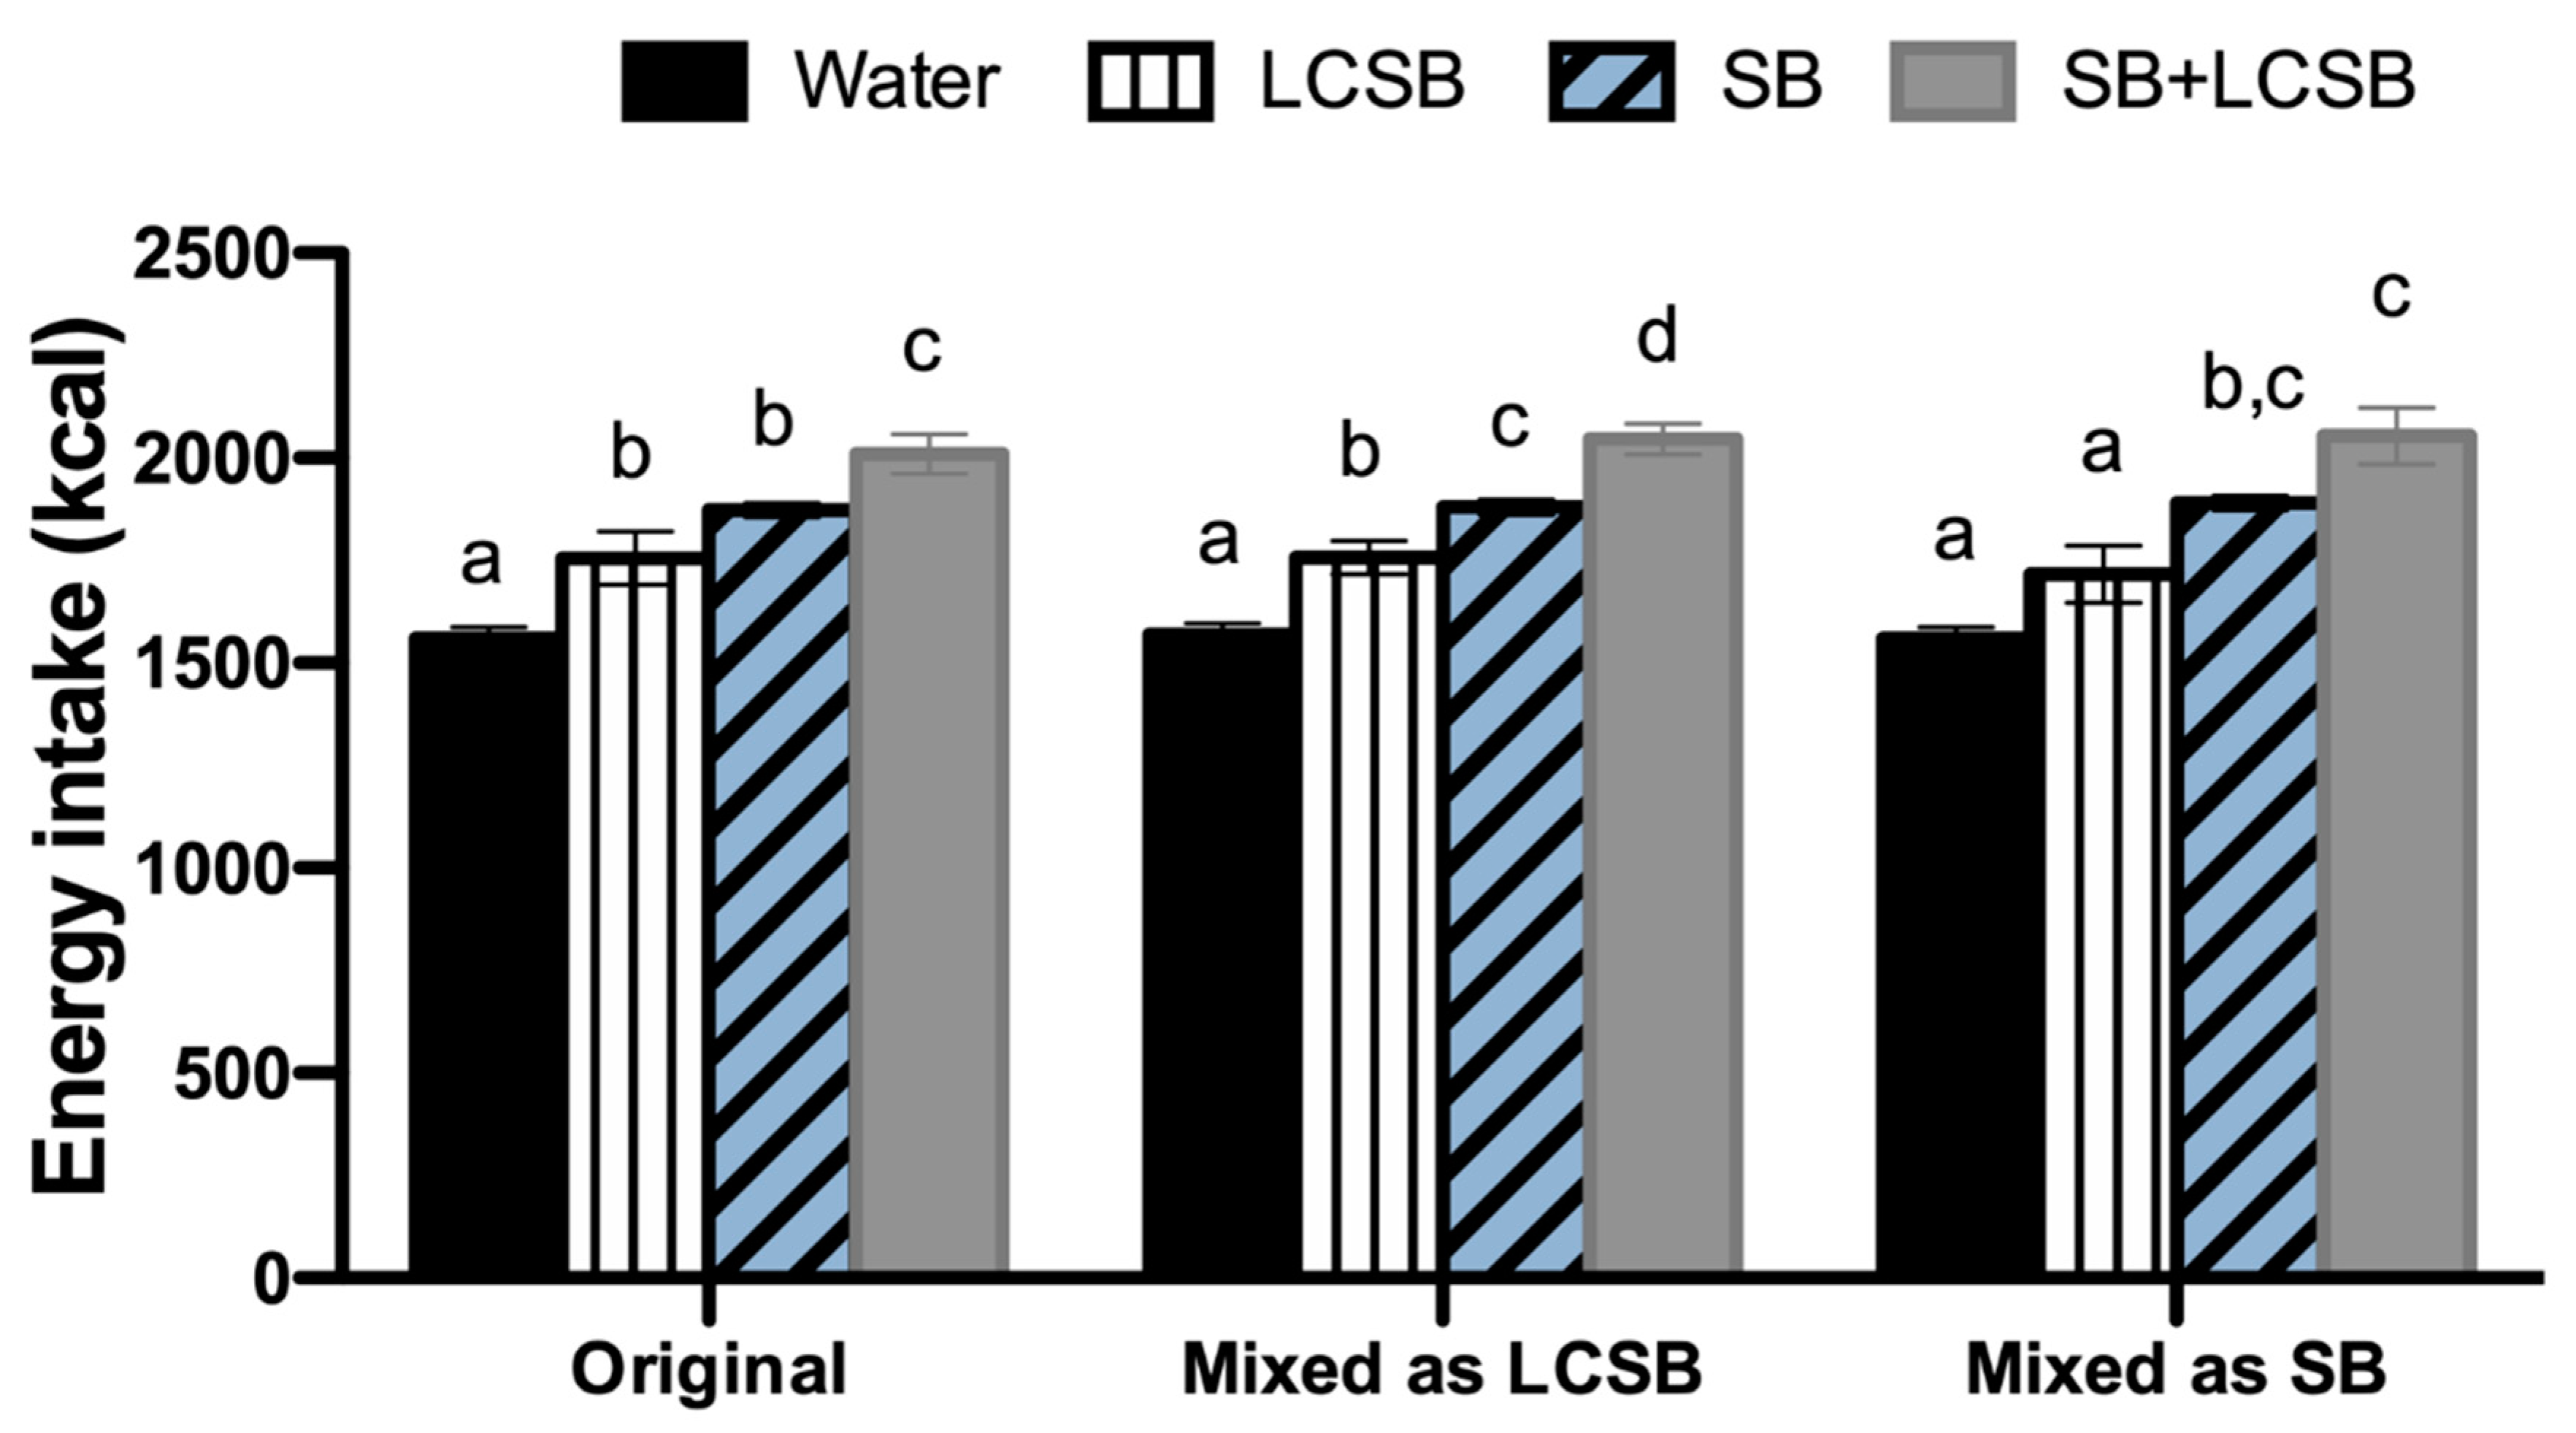
| Energy (kcal) | Model 1 | Original | 1561 ± 27 a | 1756 ± 64 b | 1873 ± 18 b | 2010 ± 49 c |
| Mixed—LCSB | 1569 ± 28 a | 1757 ± 41 b | 1880 ± 18 c | 2046 ± 37 d | ||
| Mixed—SB | 1560 ± 27 a | 1717 ± 70 a | 1891 ± 17 b,c | 2054 ± 68 c | ||
| Carbohydrates (g) | Model 1 | Original analysis | 192 ± 3.5 a | 222.3 ± 7.5 b | 252 ± 2.4 c | 271.9 ± 5.1 d |
| Mixed—LCSB | 192.5 ± 3.7 a | 226.0 ± 5.1 b | 252.1 ± 2.5 c | 281.0 ± 4.5 d | ||
| Mixed—SB | 191.3 ± 3.6 a | 216.1 ± 8.8 a | 254.2 ± 2.3 b | 278.4 ± 7.7 c | ||
| Model 2 | Original analysis | 228 ± 2.7 a | 235 ± 2.6 a | 251 ± 0.9 b | 255 ± 3.5 b | |
| Mixed—LCSB | 227.5 ± 2.8 a | 239.0 ± 2.4 b | 250.4 ± 1.0 c | 259.8 ± 2.3 d | ||
| Mixed—SB | 227.4 ± 2.8 a | 233.8 ± 3.4 a | 251.2 ± 0.9 b | 256.3 ± 3.8 b | ||
| Total Sugar (g) | Model 1 | Original analysis | 71.4 ± 2 a | 87.1 ± 3 b | 119.4 ± 1.5 c | 129.9 ± 3 d |
| Mixed—LCSB | 72.3 ± 2.1 a | 96.0 ± 2.6 b | 118.7 ± 1.6 c | 137.5 ± 2.7 d | ||
| Mixed—SB | 71.7 ± 2.1 a | 86.8 ± 3.9 a | 120.1 ± 1.5 b | 133.8 ± 3.5 c | ||
| Model 2 | Original analysis | 87.3 ± 1.6 a | 92.8 ± 3 a | 119 ± 0.9 b | 122.3 ± 3.5 b | |
| Mixed—LCSB | 87.8 ± 1.6 a | 101.7 ± 2.4 b | 118 ± 1.0 c | 128.2 ± 2.5 d | ||
| Mixed—SB | 87.8 ± 1.6 a | 94.7 ± 3.7 a | 118.8 ± 0.9 b | 124.0 ± 3.7 b | ||
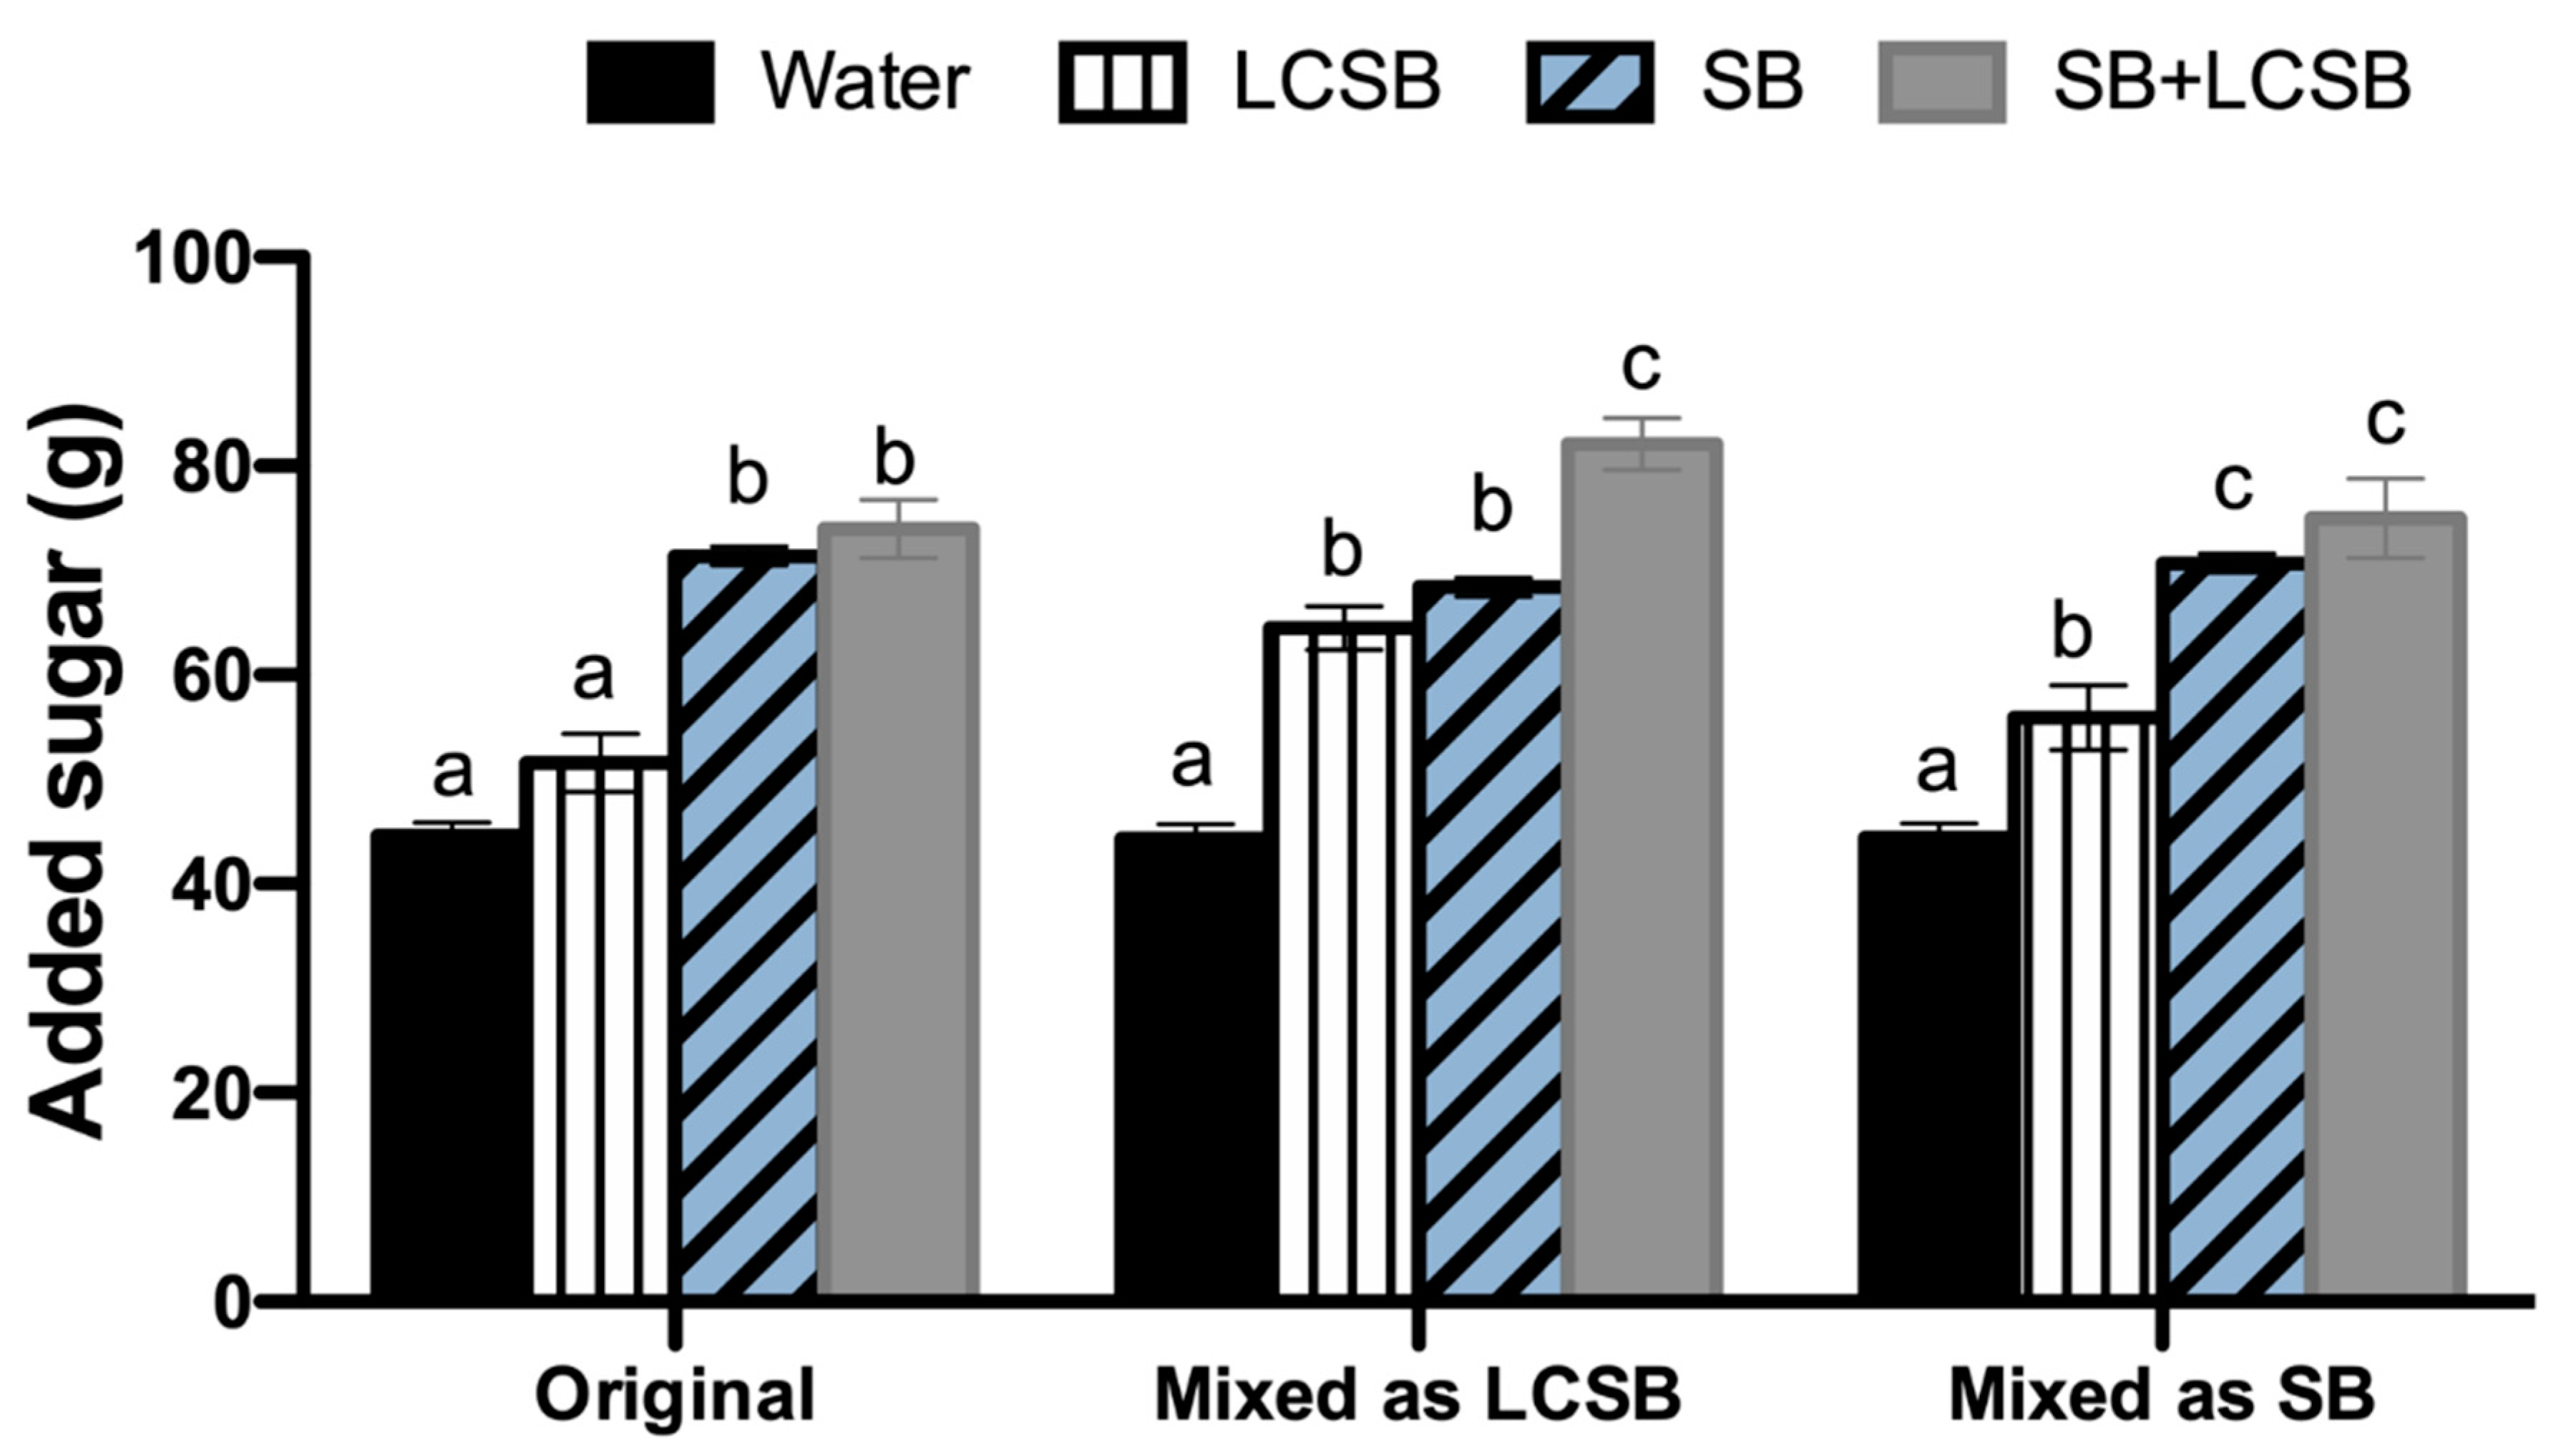
| Added Sugar (g) | Model 1 | Original analysis | 33.2 ± 1.2 a | 47.6 ± 2.1 b | 71.7 ± 1.2 c | 79.4 ± 2.5 d |
| Mixed—LCSB | 33.3 ± 1.4 a | 60.4 ± 2.1 b | 68.9 ± 132 c | 88.7 ± 2.7 d | ||
| Mixed—SB | 32.9 ± 1.5 a | 50.3 ± 3.0 b | 71.7 ± 1.2 c | 82 ± 3.5 d | ||
| Model 2 | Original analysis | 44.6 ± 1.3 a | 51.6 ± 2.8 a | 71.4 ± 0.9 b | 74.0 ± 2.8 b | |
| Mixed—LCSB | 44.3 ± 1.4 a | 64.5 ± 2.1 b | 68.4 ± 0.9 b | 82.1 ± 2.5 c | ||
| Mixed—SB | 44.4 ± 1.4 a | 55.9 ± 3.1 b | 70.7 ± 0.9 c | 75.0 ± 3.7 c |
Publisher’s Note: MDPI stays neutral with regard to jurisdictional claims in published maps and institutional affiliations. |
© 2021 by the authors. Licensee MDPI, Basel, Switzerland. This article is an open access article distributed under the terms and conditions of the Creative Commons Attribution (CC BY) license (https://creativecommons.org/licenses/by/4.0/).
Share and Cite
Swithers, S.E.; Bonanno, G.R.; Figueroa, J.; Welsh, J.A.; Sylvetsky, A.C. Dietary and Health Correlates of Sweetened Beverage Intake: Sources of Variability in the National Health and Nutrition Examination Survey (NHANES). Nutrients 2021, 13, 2703. https://0-doi-org.brum.beds.ac.uk/10.3390/nu13082703
Swithers SE, Bonanno GR, Figueroa J, Welsh JA, Sylvetsky AC. Dietary and Health Correlates of Sweetened Beverage Intake: Sources of Variability in the National Health and Nutrition Examination Survey (NHANES). Nutrients. 2021; 13(8):2703. https://0-doi-org.brum.beds.ac.uk/10.3390/nu13082703
Chicago/Turabian StyleSwithers, Susan E., G. R. Bonanno, Janet Figueroa, Jean A. Welsh, and Allison C. Sylvetsky. 2021. "Dietary and Health Correlates of Sweetened Beverage Intake: Sources of Variability in the National Health and Nutrition Examination Survey (NHANES)" Nutrients 13, no. 8: 2703. https://0-doi-org.brum.beds.ac.uk/10.3390/nu13082703