
Nutritional, Anthropometric and Sociodemographic Factors Affecting Fatty Acids Profile of Pregnant Women’s Serum at Labour—Chemometric Studies

 ,
,  , and
, and
Abstract
:
1. Introduction
2. Materials and Methods
2.1. Characteristic of Patients
2.2. Fatty Acids Analysis
2.3. Statistical Analysis
3. Results
3.1. Diet Analysis
3.2. Serum Fatty Acids Profile of Investigated Patients
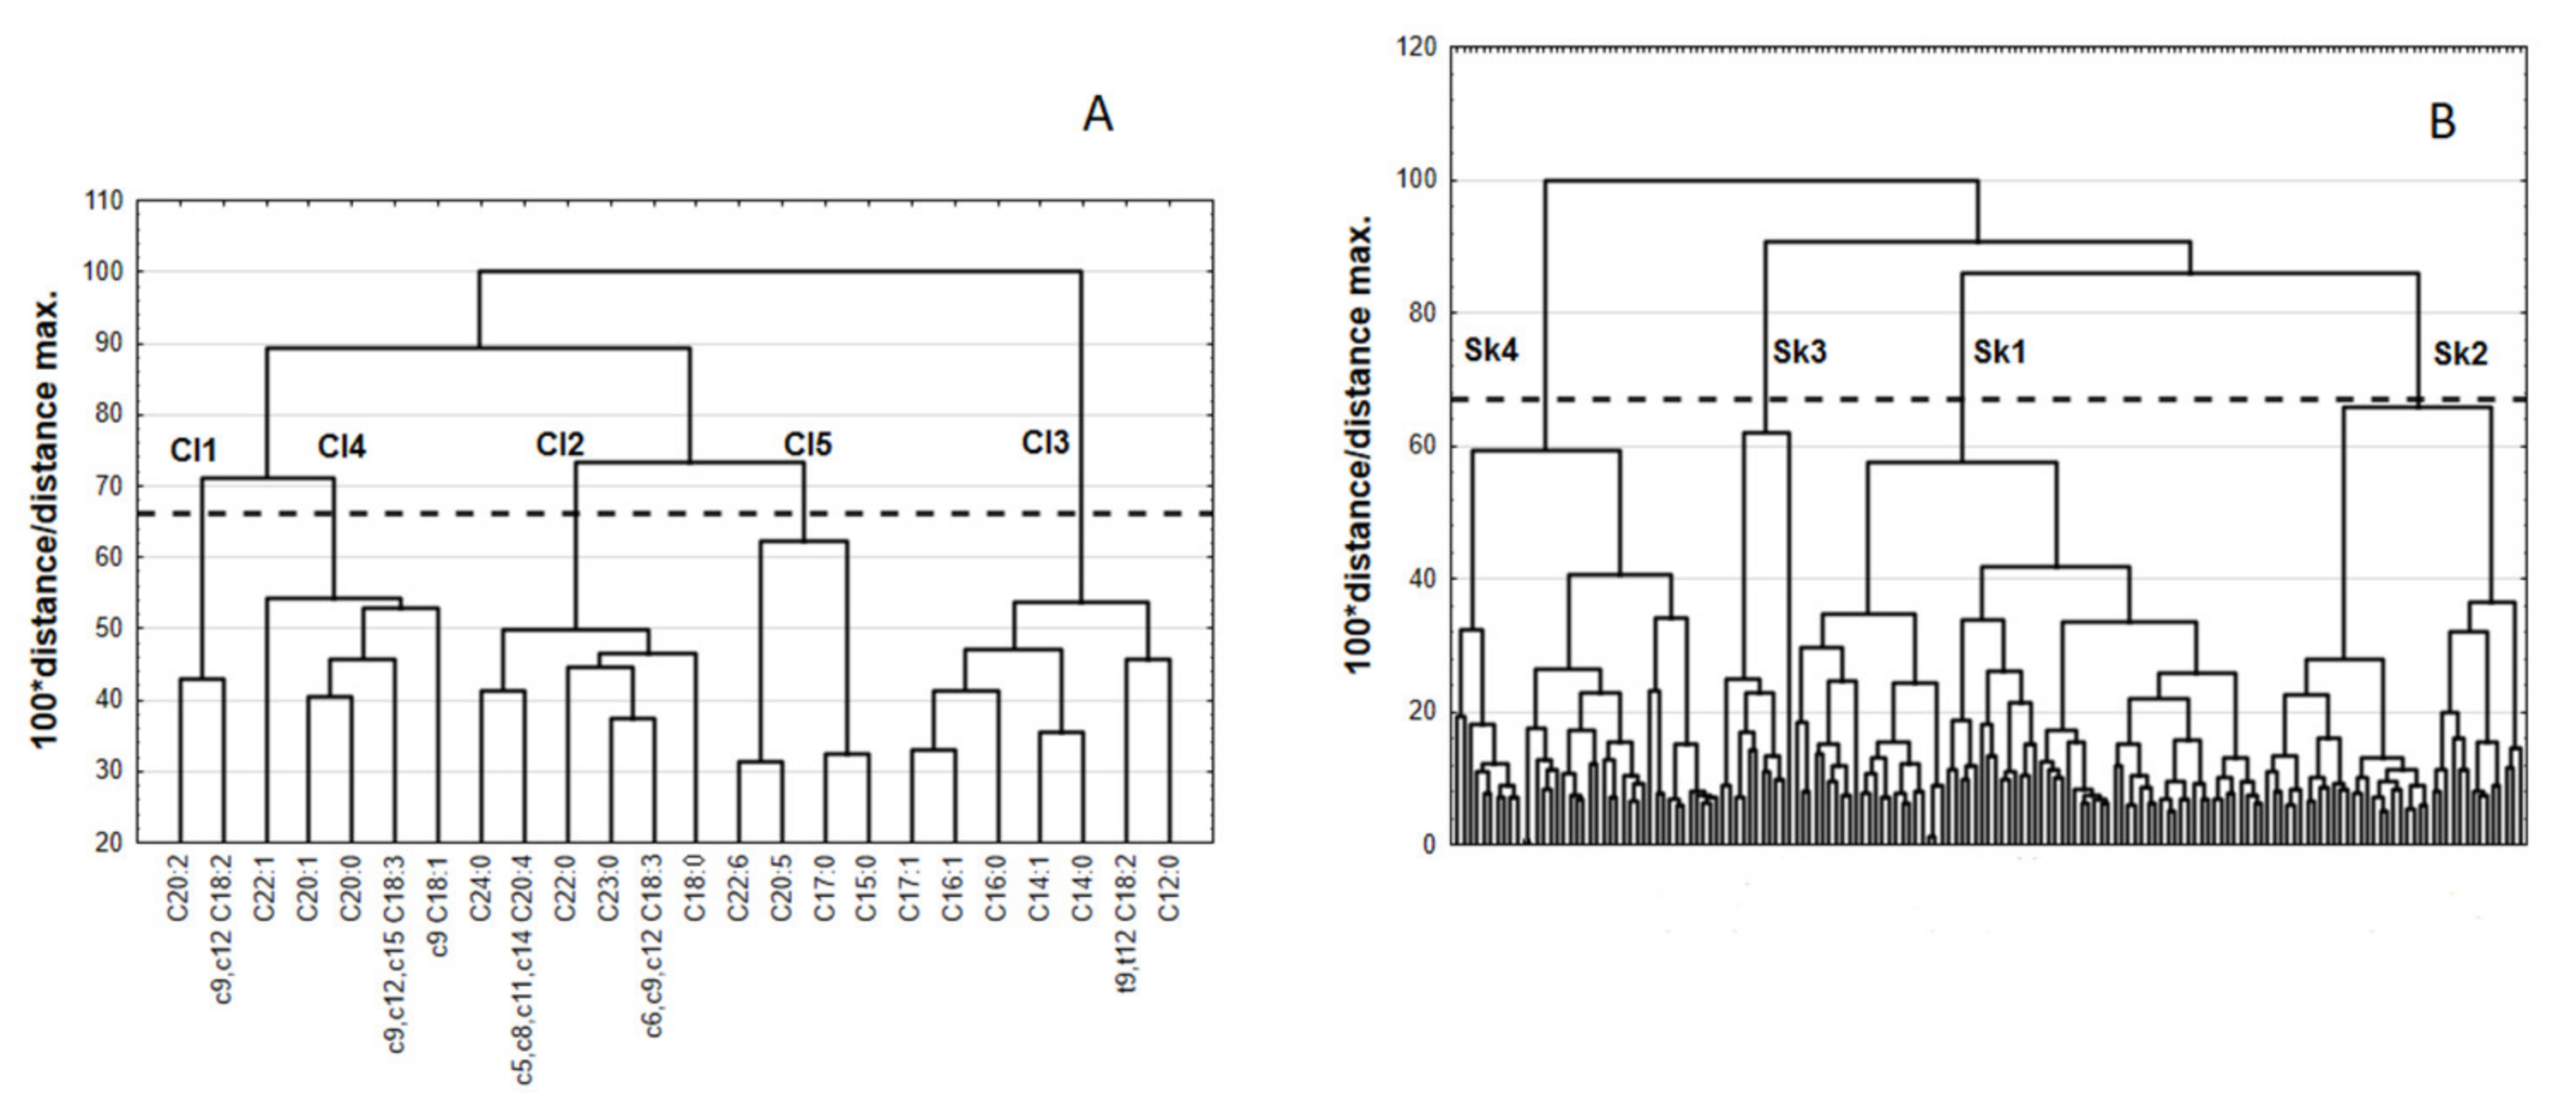
3.2.1. Cluster Analysis
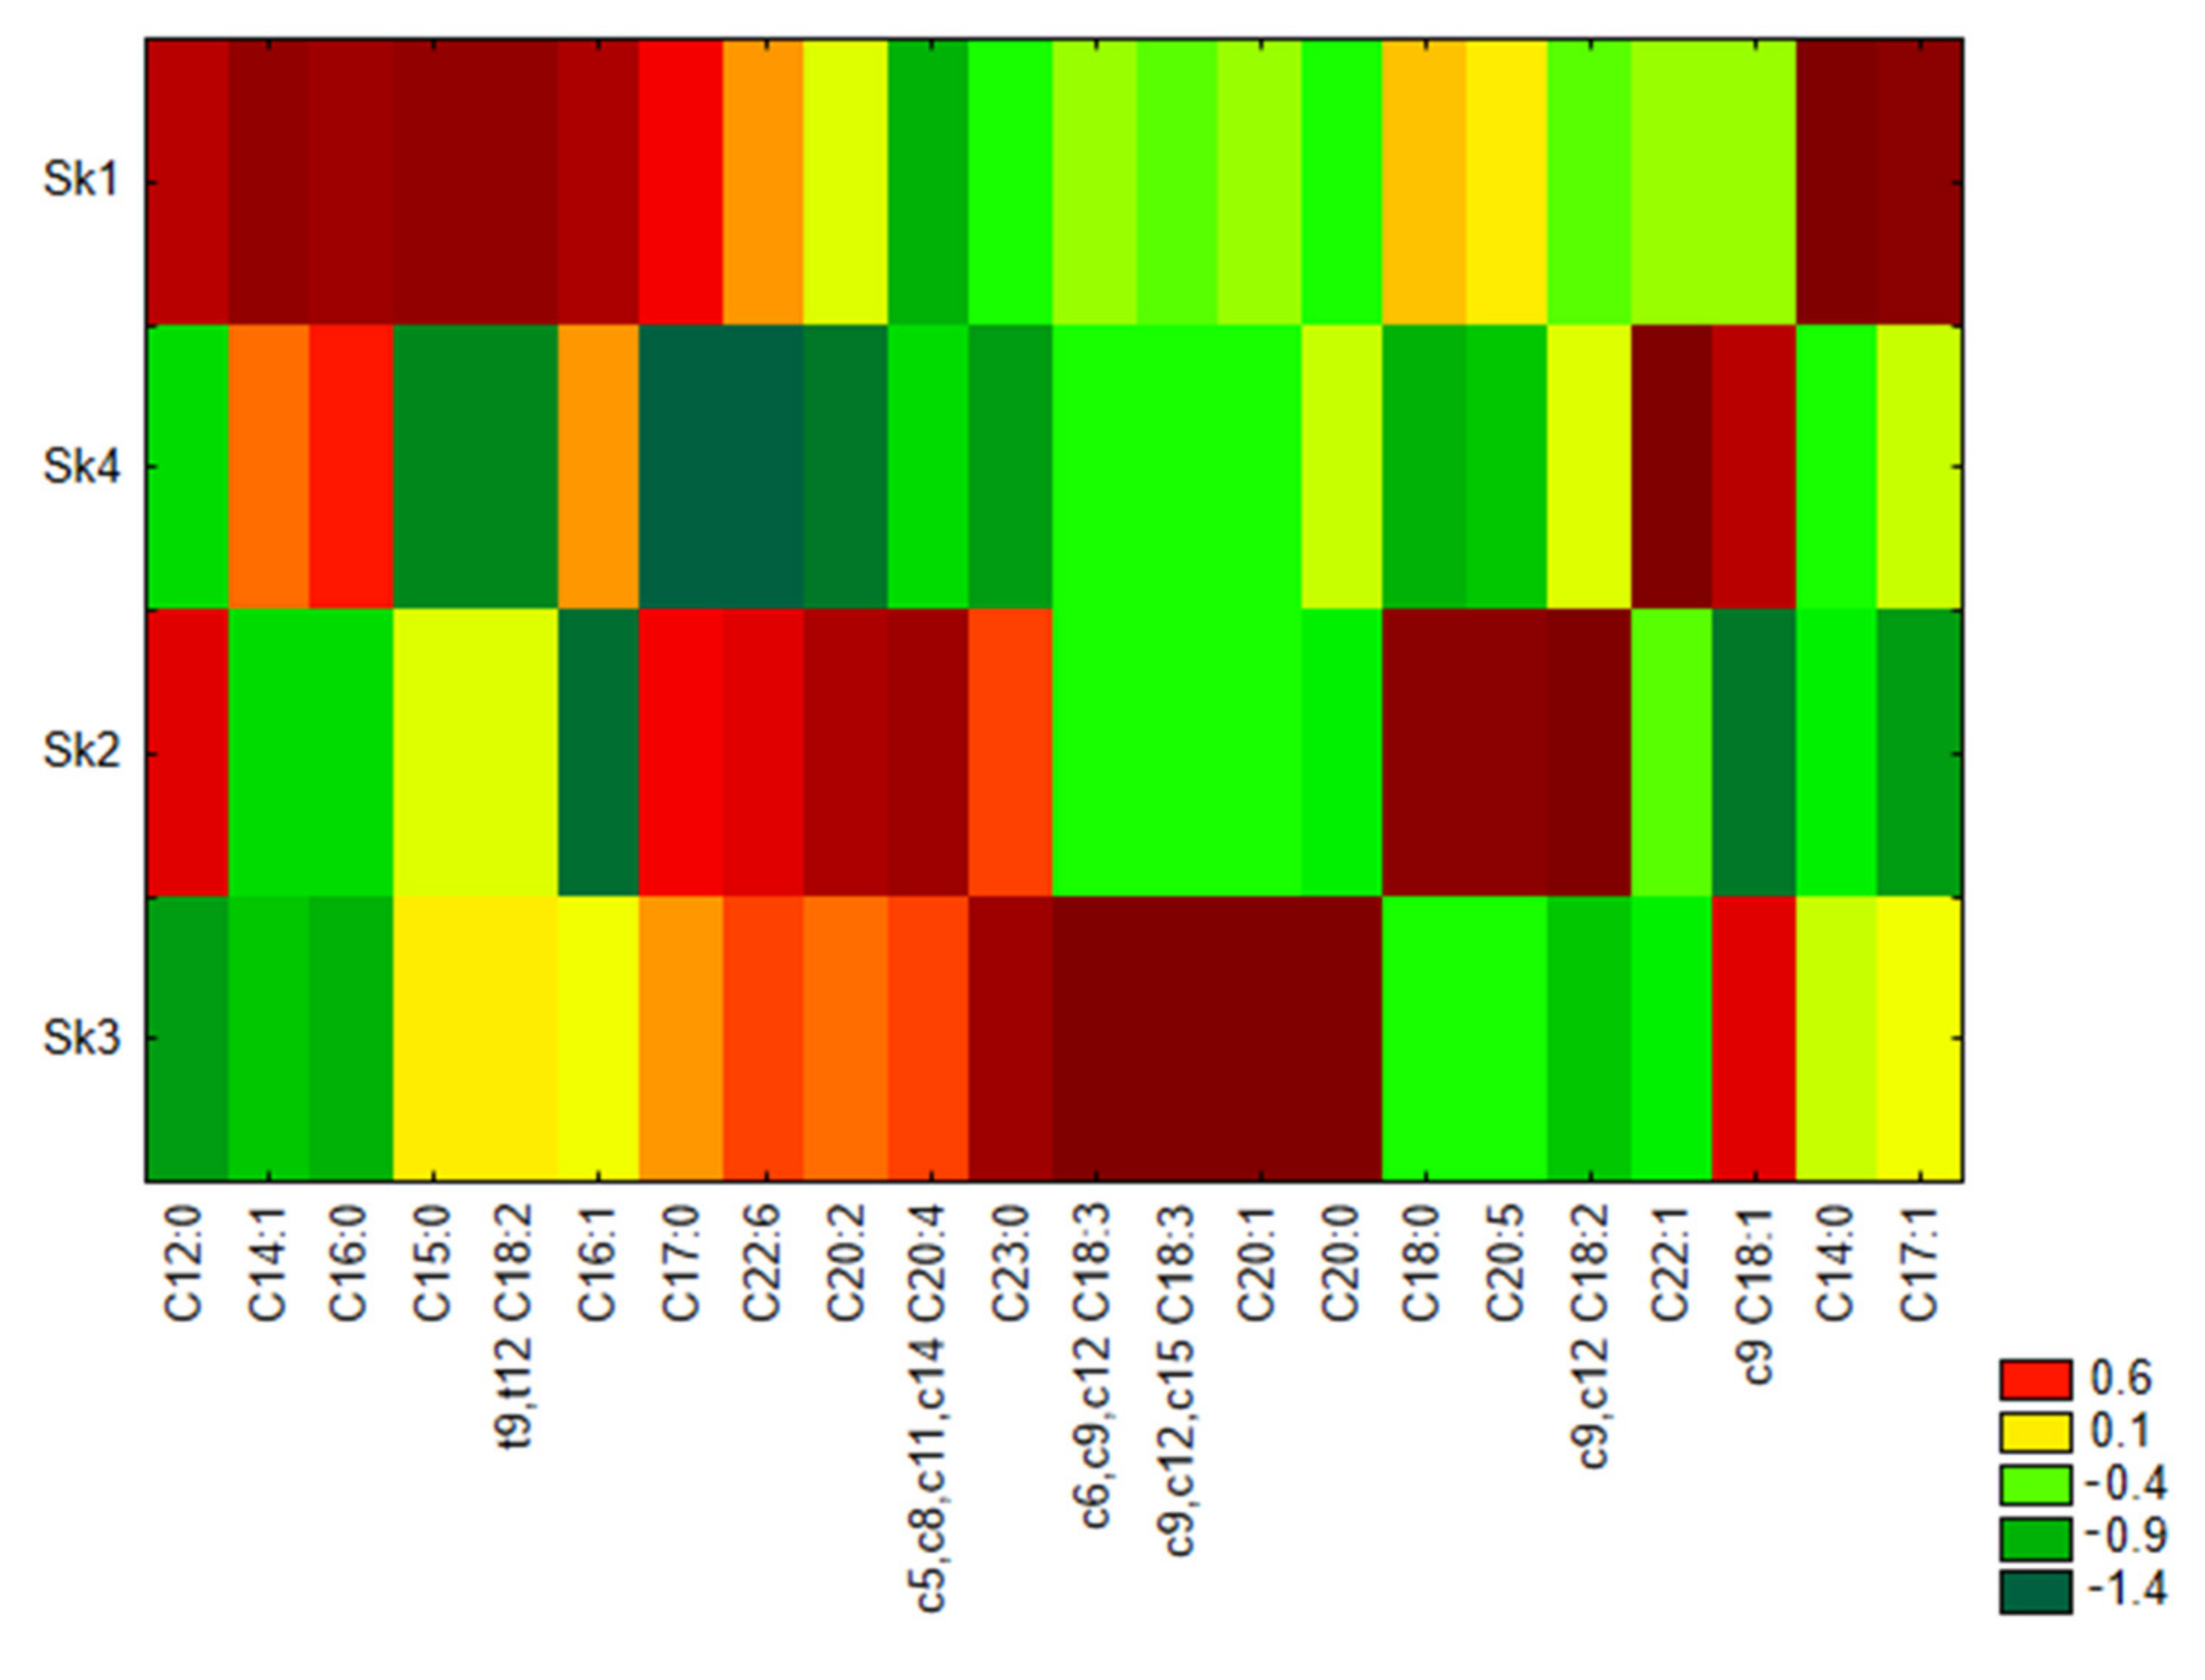
3.2.2. Grouping of Features and Objects—Similarity Analysis
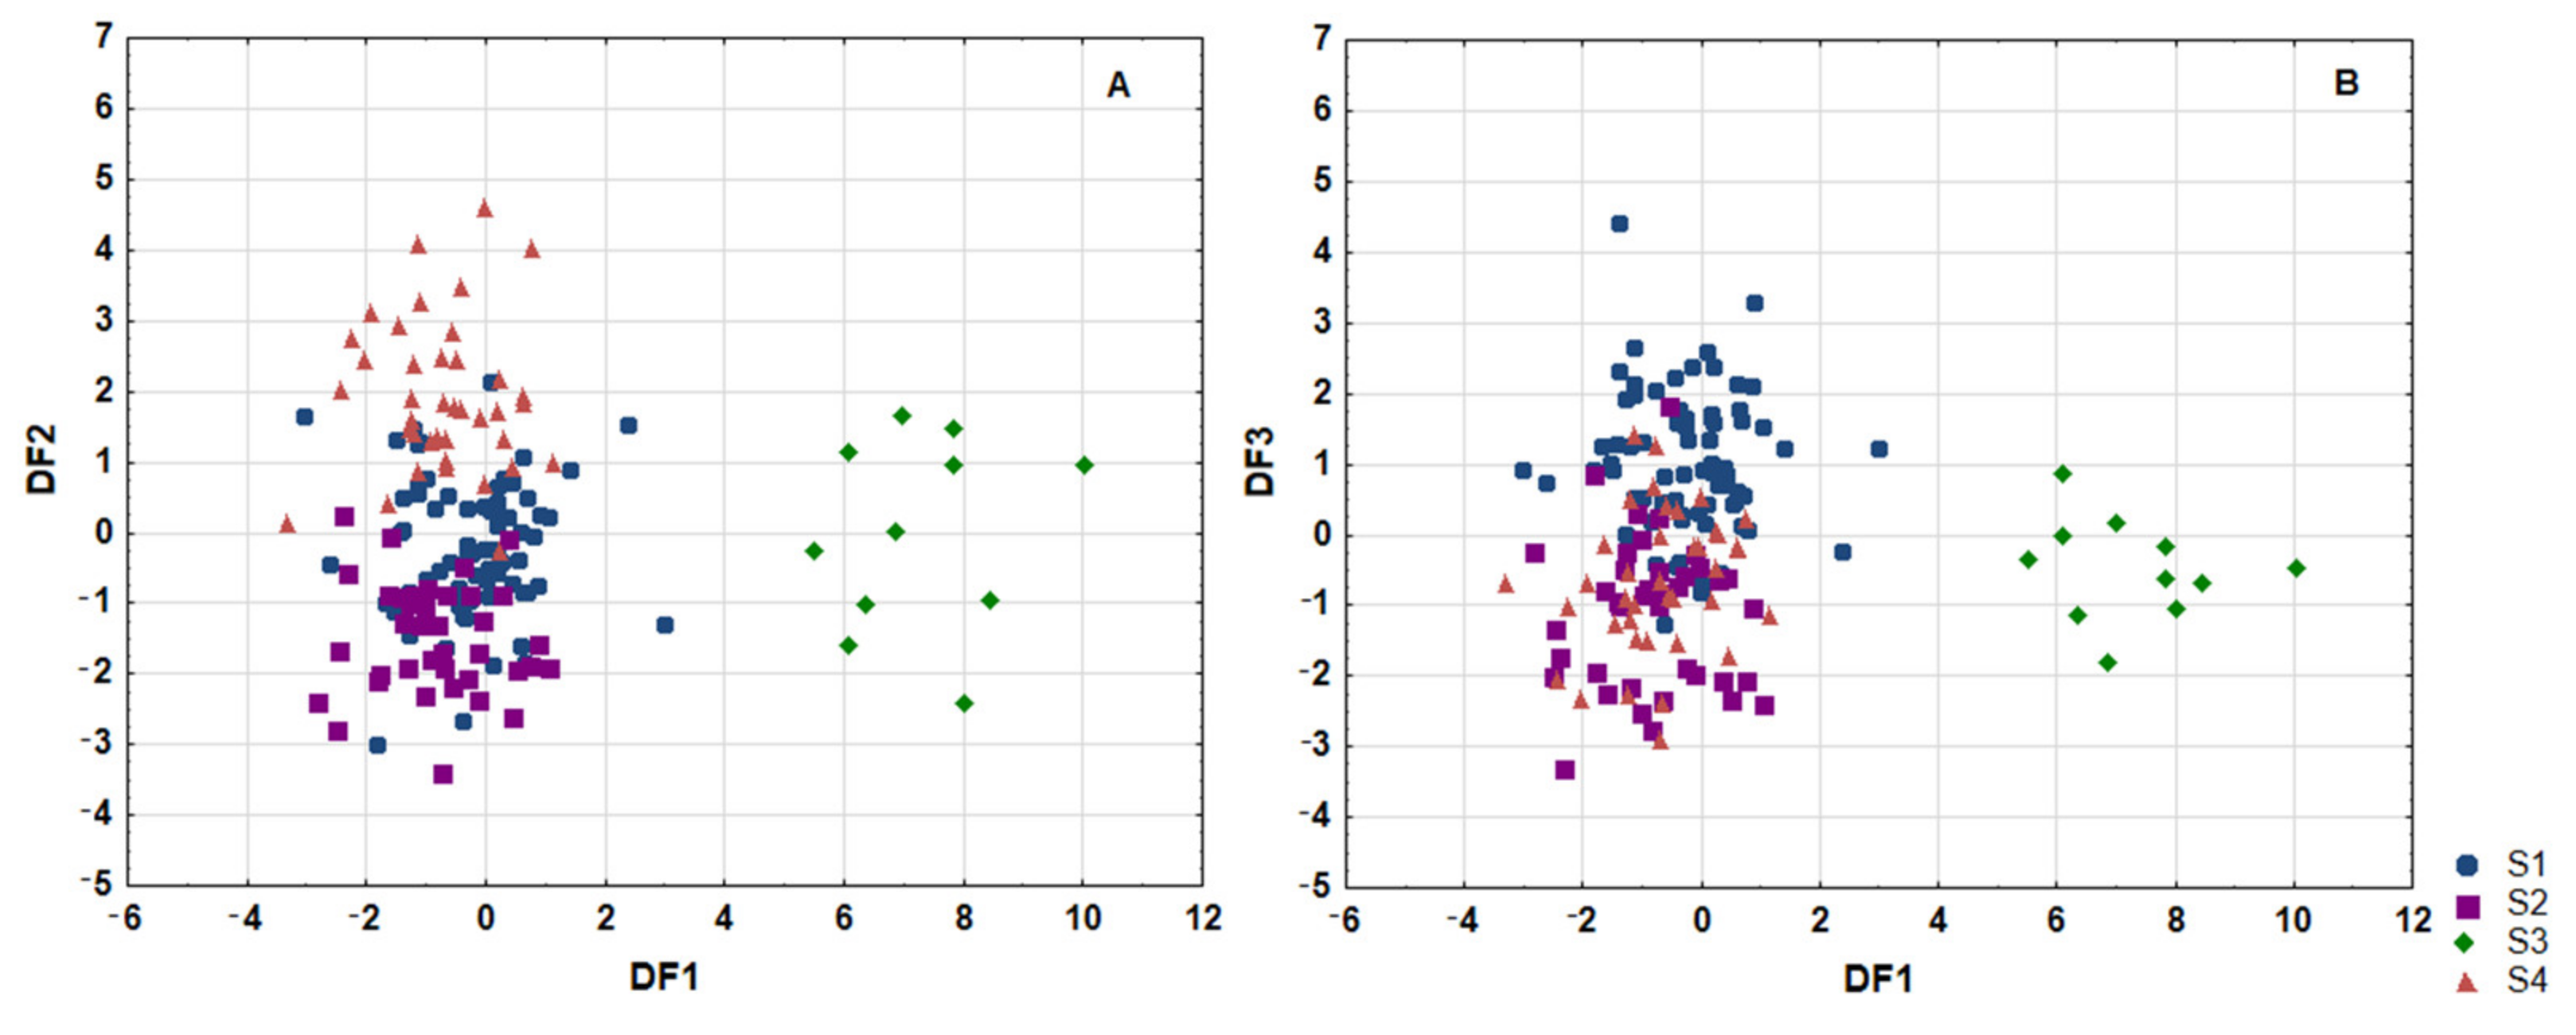
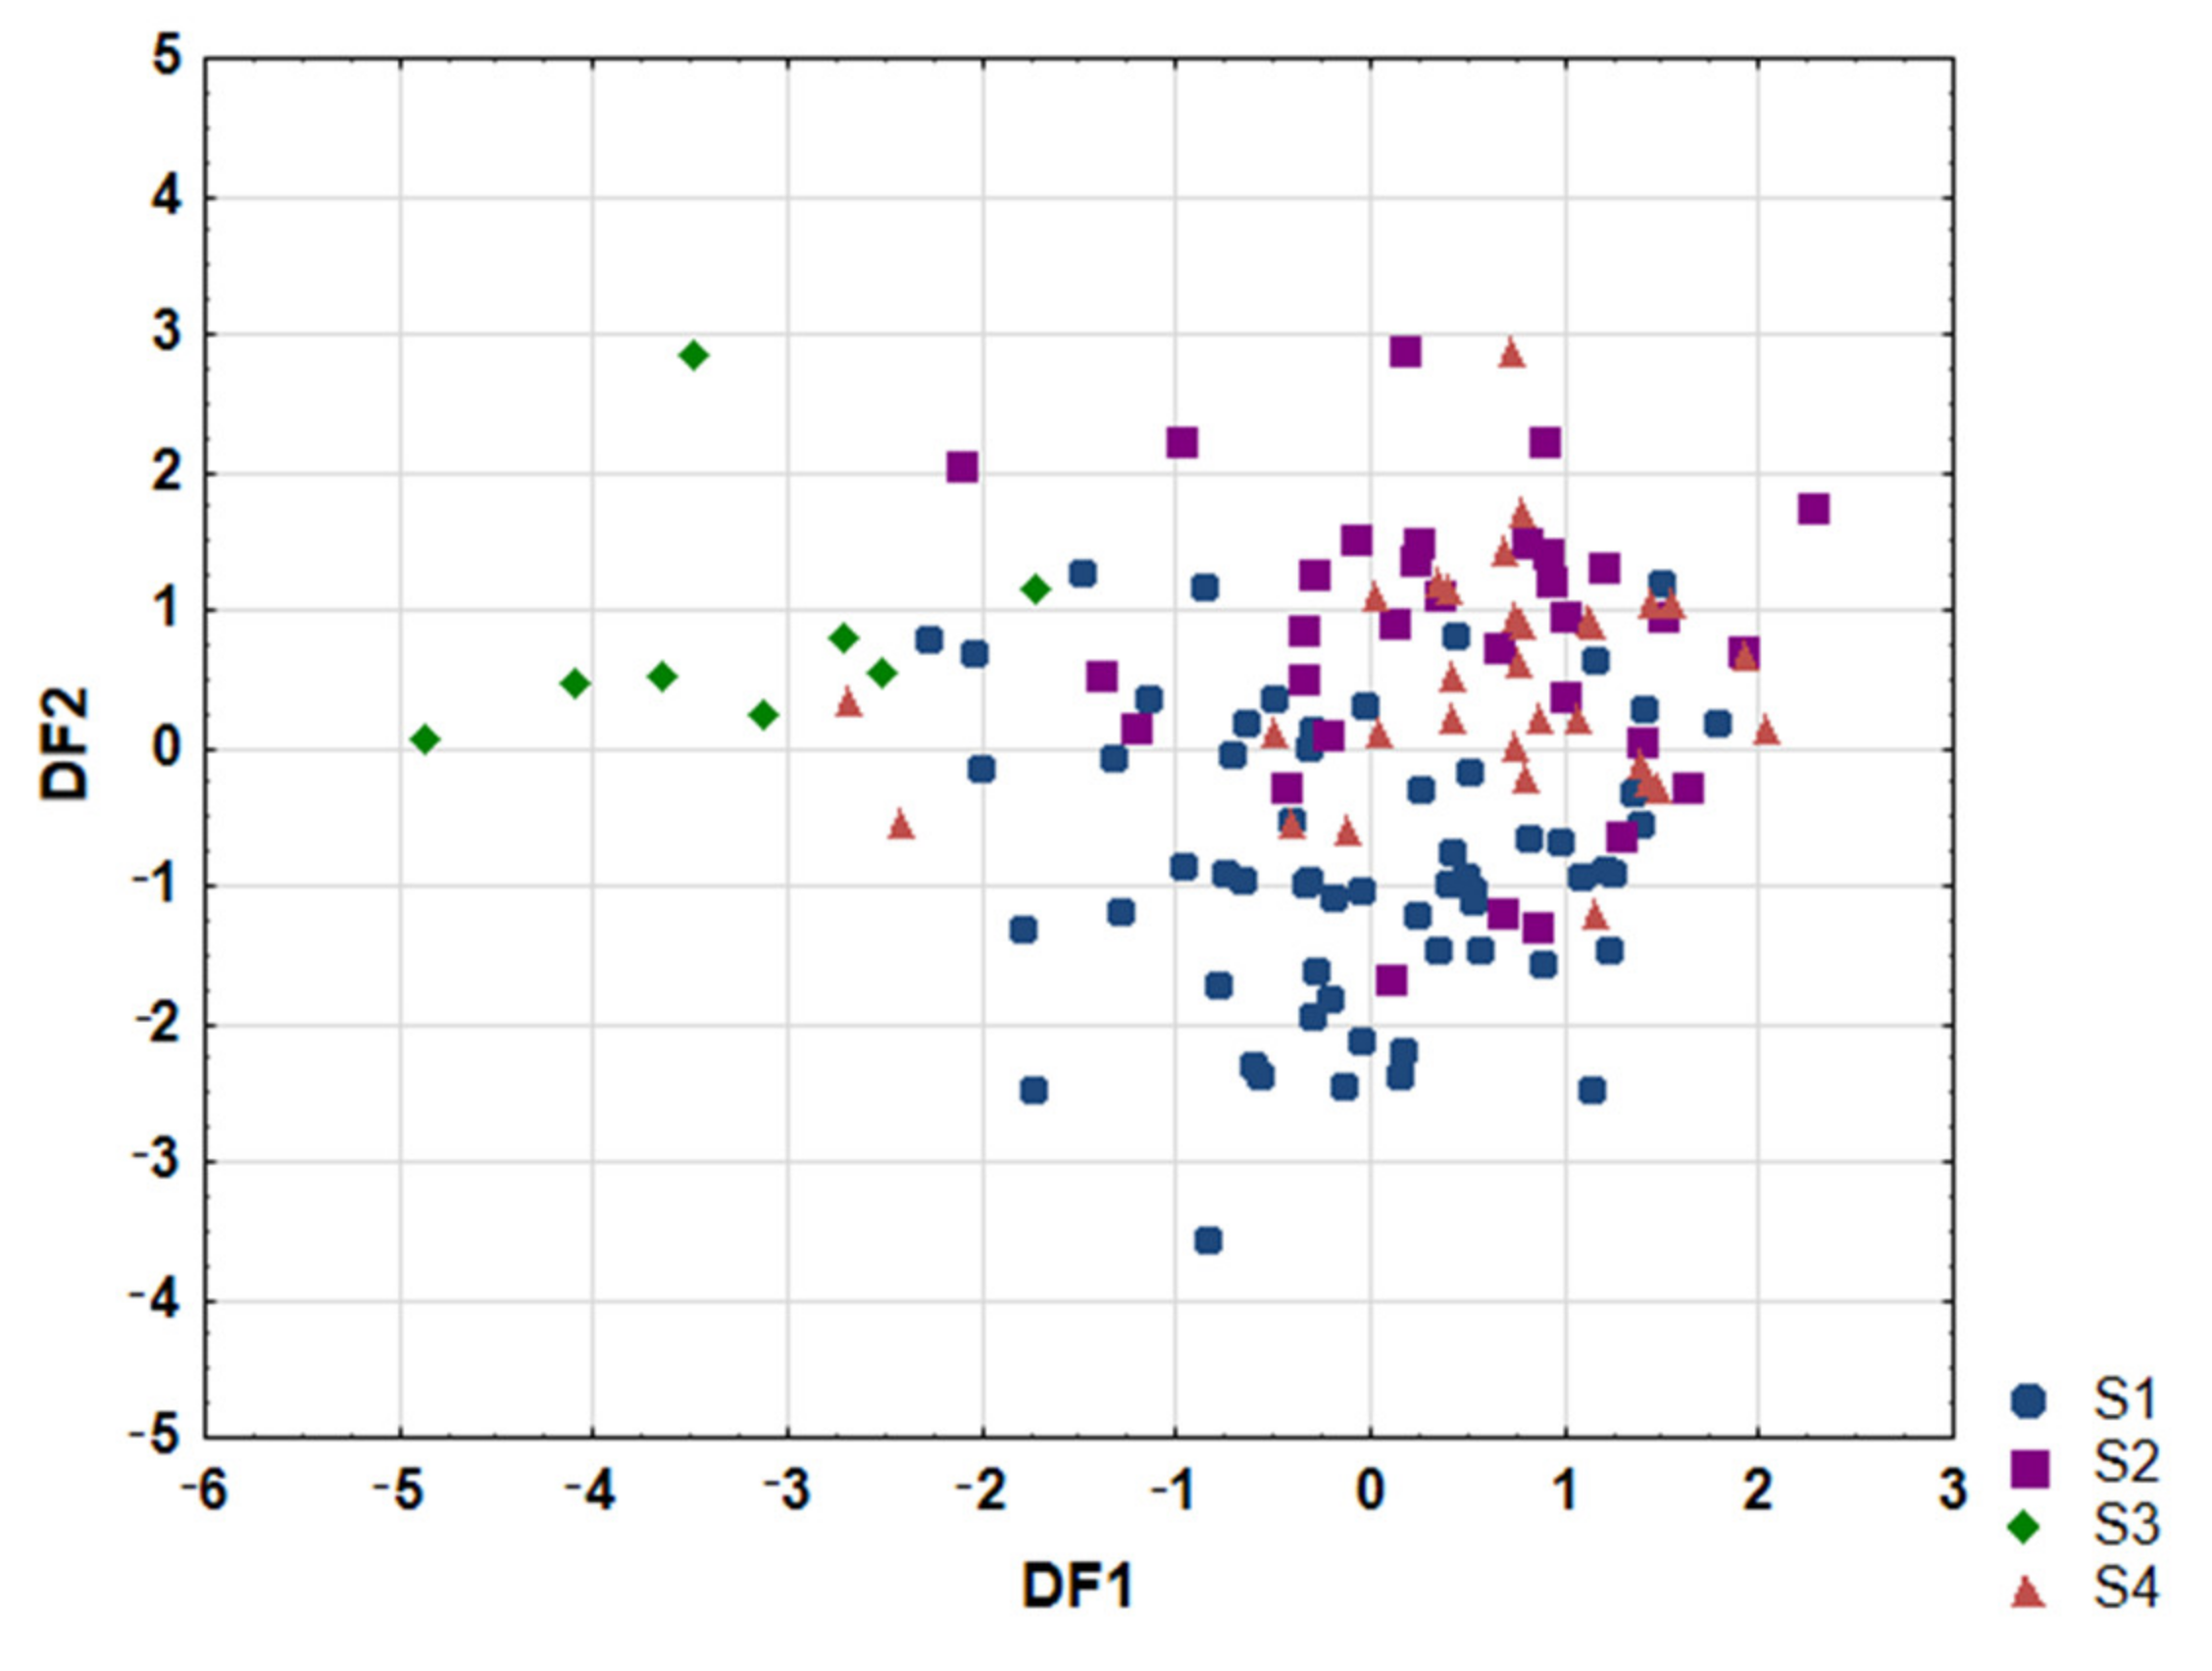
3.2.3. Linear Discriminant Analysis
3.3. Connection of Fatty Acids Profile and Diet
3.4. Characteristic Features of Revealed Clusters
4. Discussion
5. Conclusions
Author Contributions
Funding
Institutional Review Board Statement
Informed Consent Statement
Data Availability Statement
Conflicts of Interest
Appendix A

| Mother (n = 161) | mean ± SD | ||
| age (years) | 31.1 ± 4.5 | ||
| height (cm) | 167 ± 6 | ||
| body weight before pregnancy (kg) | 63.0 ± 11.8 | ||
| body weight on enrollment (kg) | 77.0 ± 13.1 | ||
| BMI before pregnancy (kg/m2) | 22.6 ± 3.8 | ||
| BMI on enrollment (kg/m2) | 27.7 ± 4.1 | ||
| week of delivery | 38.9 ± 1.2 | ||
| n | % | ||
| diseases before pregnancy | no | 124 | 77.0 |
| yes | 37 | 23.0 | |
| no data | 0 | 0.0 | |
| diseases in pregnancy | |||
| no | 103 | 64.0 | |
| yes | 58 | 36.0 | |
| no data | 0 | 0.0 | |
| education | |||
| higher | 122 | 75.8 | |
| secondary | 27 | 16.8 | |
| elementary | 2 | 1.2 | |
| vocational | 5 | 3.1 | |
| no data | 5 | 3.1 | |
| BMI before pregnancy classification | |||
| starvation | 0 | 0.0 | |
| emaciation | 5 | 3.1 | |
| underweight | 7 | 4.3 | |
| healthy range | 103 | 64.0 | |
| overweight | 31 | 19.3 | |
| 1st degree obesity | 10 | 6.2 | |
| 2nd degree obesity | 0 | 0.0 | |
| 3rd degree obesity | 0 | 0.0 | |
| no data | 5 | 3.1 | |
| sequence number of pregnancy | |||
| 1st | 61 | 37.9 | |
| 2nd | 51 | 31.7 | |
| 3rd | 32 | 19.9 | |
| 4th | 14 | 8.7 | |
| 5th | 2 | 1.2 | |
| 6th | 1 | 0.6 | |
| no data | 0 | 0.0 | |
| number of previous deliveries | |||
| 0 | 69 | 42.9 | |
| 1 | 61 | 37.9 | |
| 2 | 24 | 14.9 | |
| 3 | 6 | 3.7 | |
| 4 | 1 | 0.6 | |
| 5 | 0 | 0.0 | |
| no data | 0 | 0.0 | |
| number of miscarriages | |||
| 0 | 129 | 80.1 | |
| 1 | 25 | 15.5 | |
| 2 | 5 | 3.1 | |
| 3 | 2 | 1.2 | |
| no data | 0 | 0.0 | |
| tobacco smoking during pregnancy | |||
| no | 156 | 96.9 | |
| yes | 1 | 0.6 | |
| no data | 4 | 2.5 | |
| alcohol drinking during pregnancy | |||
| no | 156 | 96.9 | |
| yes | 0 | 0.0 | |
| no data | 5 | 3.1 | |
| delivery | |||
| <37th week | 5 | 3.1 | |
| ≥37th week | 156 | 96.9 | |
| no data | 0 | 0.0 | |
| mode of delivery | |||
| CC | 45 | 28.0 | |
| PNS | 114 | 70.8 | |
| VE | 2 | 1.2 | |
| no data | 0 | 0.0 | |
| gender of child | |||
| female | 87 | 54.0 | |
| male | 74 | 46.0 | |
| no data | 0 | 0.0 | |
| Child (n = 161) | mean± SD | ||
| head circumference (cm) | 34.6 ± 1.5 | ||
| chest circumference (cm) | 33.7 ± 1.8 | ||
| newborn’s weight (g) | 3464 ± 435 | ||
| newborn’s body length (cm) | 54.5 ± 2.9 | ||
| newborn’s Ponderal Index (kg/m3) | 21.6 ± 2.7 | ||
| Apgar 10’ | 9.9 ± 0.4 | ||
| n | % | ||
| Apgar scoring | |||
| good (8–10) | 161 | 100.0 | |
| average (4–7) | 0 | 0.0 | |
| severe (0–3) | 0 | 0.0 | |
| occurrence of developmental disorders | |||
| no | 130 | 80.7 | |
| yes | 31 | 19.3 | |
| no data | 0 | 0.0 |
| All | Sk1 | Sk2 | Sk3 | Sk4 | |||||||
|---|---|---|---|---|---|---|---|---|---|---|---|
| n | % | n | % | n | % | n | % | n | % | ||
| olive | |||||||||||
| everyday | 8 | 5.0 | 8 | 11.3 | 7 | 17.5 | 2 | 18.2 | 5 | 12.8 | |
| 4–6 times a week | 22 | 13.7 | 3 | 4.2 | 3 | 7.5 | 0 | 0.0 | 2 | 5.1 | |
| 2–3 times a week | 24 | 14.9 | 12 | 16.9 | 6 | 15.0 | 3 | 27.3 | 3 | 7.7 | |
| once a week | 18 | 11.2 | 14 | 19.7 | 1 | 2.5 | 1 | 9.1 | 2 | 5.1 | |
| once a two weeks | 20 | 12.4 | 10 | 14.1 | 5 | 12.5 | 1 | 9.1 | 4 | 10.3 | |
| never | 42 | 26.1 | 14 | 19.7 | 10 | 25.0 | 2 | 18.2 | 16 | 41.0 | |
| no data | 27 | 16.8 | 10 | 14.1 | 8 | 20.0 | 2 | 18.2 | 7 | 17.9 | |
| sunflower | |||||||||||
| everyday | 6 | 3.7 | 3 | 4.2 | 2 | 5.0 | 0 | 0.0 | 1 | 2.6 | |
| 4–6 times a week | 0 | 0.0 | 0 | 0.0 | 0 | 0.0 | 0 | 0.0 | 0 | 0.0 | |
| 2–3 times a week | 19 | 11.8 | 10 | 14.1 | 4 | 10.0 | 0 | 0.0 | 5 | 12.8 | |
| once a week | 15 | 9.3 | 11 | 15.5 | 1 | 2.5 | 0 | 0.0 | 3 | 7.7 | |
| once a two weeks | 17 | 10.6 | 4 | 5.6 | 5 | 12.5 | 1 | 9.1 | 7 | 17.9 | |
| never | 77 | 47.8 | 33 | 46.5 | 20 | 50.0 | 8 | 72.7 | 16 | 41.0 | |
| no data | 27 | 16.8 | 10 | 14.1 | 8 | 20.0 | 2 | 18.2 | 7 | 17.9 | |
| rapeseed | |||||||||||
| everyday | 11 | 6.8 | 1 | 1.4 | 6 | 15.0 | 0 | 0.0 | 4 | 10.3 | |
| 4–6 times a week | 9 | 5.6 | 4 | 5.6 | 3 | 7.5 | 1 | 9.1 | 1 | 2.6 | |
| 2–3 times a week | 18 | 11.2 | 11 | 15.5 | 3 | 7.5 | 2 | 18.2 | 2 | 5.1 | |
| once a week | 13 | 8.1 | 6 | 8.5 | 3 | 7.5 | 0 | 0.0 | 4 | 10.3 | |
| once a two weeks | 8 | 5.0 | 2 | 2.8 | 5 | 12.5 | 0 | 0.0 | 1 | 2.6 | |
| never | 75 | 46.6 | 37 | 52.1 | 12 | 30.0 | 6 | 54.5 | 20 | 51.3 | |
| no data | 27 | 16.8 | 10 | 14.1 | 8 | 20.0 | 2 | 18.2 | 7 | 17.9 | |
| linseed | |||||||||||
| everyday | 1 | 0.6 | 0 | 0.0 | 1 | 2.5 | 0 | 0.0 | 0 | 0.0 | |
| 4–6 times a week | 3 | 1.9 | 2 | 2.8 | 1 | 2.5 | 0 | 0.0 | 0 | 0.0 | |
| 2–3 times a week | 1 | 0.6 | 0 | 0.0 | 1 | 2.5 | 0 | 0.0 | 0 | 0.0 | |
| once a week | 0 | 0.0 | 0 | 0.0 | 0 | 0.0 | 0 | 0.0 | 0 | 0.0 | |
| once a two weeks | 1 | 0.6 | 1 | 1.4 | 0 | 0.0 | 0 | 0.0 | 0 | 0.0 | |
| never | 128 | 79.5 | 58 | 81.7 | 29 | 72.5 | 9 | 81.8 | 32 | 82.1 | |
| no data | 27 | 16.8 | 10 | 14.1 | 8 | 20.0 | 2 | 18.2 | 7 | 17.9 | |
| corn | |||||||||||
| everyday | 0 | 0.0 | 0 | 0.0 | 0 | 0.0 | 0 | 0.0 | 0 | 0.0 | |
| 4–6 times a week | 0 | 0.0 | 0 | 0.0 | 0 | 0.0 | 0 | 0.0 | 0 | 0.0 | |
| 2–3 times a week | 0 | 0.0 | 0 | 0.0 | 0 | 0.0 | 0 | 0.0 | 0 | 0.0 | |
| once a week | 0 | 0.0 | 0 | 0.0 | 0 | 0.0 | 0 | 0.0 | 0 | 0.0 | |
| once a two weeks | 0 | 0.0 | 0 | 0.0 | 0 | 0.0 | 0 | 0.0 | 0 | 0.0 | |
| never | 134 | 83.2 | 61 | 85.9 | 32 | 80.0 | 9 | 81.8 | 32 | 82.1 | |
| no data | 27 | 16.8 | 10 | 14.1 | 8 | 20.0 | 2 | 18.2 | 7 | 17.9 | |
| grapeseed | |||||||||||
| everyday | 1 | 0.6 | 1 | 1.4 | 0 | 0.0 | 0 | 0.0 | 0 | 0.0 | |
| 4–6 times a week | 1 | 0.6 | 1 | 1.4 | 0 | 0.0 | 0 | 0.0 | 0 | 0.0 | |
| 2–3 times a week | 1 | 0.6 | 1 | 1.4 | 0 | 0.0 | 0 | 0.0 | 0 | 0.0 | |
| once a week | 1 | 0.6 | 1 | 1.4 | 0 | 0.0 | 0 | 0.0 | 0 | 0.0 | |
| once a two weeks | 2 | 1.2 | 1 | 1.4 | 1 | 2.5 | 0 | 0.0 | 0 | 0.0 | |
| never | 128 | 79.5 | 56 | 78.9 | 31 | 77.5 | 9 | 81.8 | 32 | 82.1 | |
| no data | 27 | 16.8 | 10 | 14.1 | 8 | 20.0 | 2 | 18.2 | 7 | 17.9 | |
| coconut | |||||||||||
| everyday | 0 | 0.0 | 0 | 0.0 | 0 | 0.0 | 0 | 0.0 | 0 | 0.0 | |
| 4–6 times a week | 0 | 0.0 | 0 | 0.0 | 0 | 0.0 | 0 | 0.0 | 0 | 0.0 | |
| 2–3 times a week | 0 | 0.0 | 0 | 0.0 | 0 | 0.0 | 0 | 0.0 | 0 | 0.0 | |
| once a week | 0 | 0.0 | 0 | 0.0 | 0 | 0.0 | 0 | 0.0 | 0 | 0.0 | |
| once a two weeks | 0 | 0.0 | 0 | 0.0 | 0 | 0.0 | 0 | 0.0 | 0 | 0.0 | |
| never | 134 | 83.2 | 61 | 85.9 | 32 | 80.0 | 9 | 81.8 | 32 | 82.1 | |
| no data | 27 | 16.8 | 10 | 14.1 | 8 | 20.0 | 2 | 18.2 | 7 | 17.9 | |
| sesame | |||||||||||
| everyday | 0 | 0.0 | 0 | 0.0 | 0 | 0.0 | 0 | 0.0 | 0 | 0.0 | |
| 4–6 times a week | 0 | 0.0 | 0 | 0.0 | 0 | 0.0 | 0 | 0.0 | 0 | 0.0 | |
| 2–3 times a week | 0 | 0.0 | 0 | 0.0 | 0 | 0.0 | 0 | 0.0 | 0 | 0.0 | |
| once a week | 1 | 0.6 | 0 | 0.0 | 1 | 2.5 | 0 | 0.0 | 0 | 0.0 | |
| once a two weeks | 0 | 0.0 | 0 | 0.0 | 0 | 0.0 | 0 | 0.0 | 0 | 0.0 | |
| never | 133 | 82.6 | 61 | 85.9 | 31 | 77.5 | 9 | 81.8 | 32 | 82.1 | |
| no data | 27 | 16.8 | 10 | 14.1 | 8 | 20.0 | 2 | 18.2 | 7 | 17.9 | |
| soybean | |||||||||||
| everyday | 0 | 0.0 | 0 | 0.0 | 0 | 0.0 | 0 | 0.0 | 0 | 0.0 | |
| 4–6 times a week | 0 | 0.0 | 0 | 0.0 | 0 | 0.0 | 0 | 0.0 | 0 | 0.0 | |
| 2–3 times a week | 0 | 0.0 | 0 | 0.0 | 0 | 0.0 | 0 | 0.0 | 0 | 0.0 | |
| once a week | 1 | 0.6 | 0 | 0.0 | 1 | 2.5 | 0 | 0.0 | 0 | 0.0 | |
| once a two weeks | 1 | 0.6 | 0 | 0.0 | 1 | 2.5 | 0 | 0.0 | 0 | 0.0 | |
| never | 131 | 81.4 | 60 | 84.5 | 30 | 75.0 | 9 | 81.8 | 32 | 82.1 | |
| no data | 28 | 17.4 | 11 | 15.5 | 8 | 20.0 | 2 | 18.2 | 7 | 17.9 | |
| peanut | |||||||||||
| everyday | 0 | 0.0 | 0 | 0.0 | 0 | 0.0 | 0 | 0.0 | 0 | 0.0 | |
| 4–6 times a week | 0 | 0.0 | 0 | 0.0 | 0 | 0.0 | 0 | 0.0 | 0 | 0.0 | |
| 2–3 times a week | 0 | 0.0 | 0 | 0.0 | 0 | 0.0 | 0 | 0.0 | 0 | 0.0 | |
| once a week | 0 | 0.0 | 0 | 0.0 | 0 | 0.0 | 0 | 0.0 | 0 | 0.0 | |
| once a two weeks | 0 | 0.0 | 0 | 0.0 | 0 | 0.0 | 0 | 0.0 | 0 | 0.0 | |
| never | 134 | 83.2 | 61 | 85.9 | 32 | 80.0 | 9 | 81.8 | 32 | 82.1 | |
| no data | 27 | 16.8 | 10 | 14.1 | 8 | 20.0 | 2 | 18.2 | 7 | 17.9 | |
| hemp | |||||||||||
| everyday | 0 | 0.0 | 0 | 0.0 | 0 | 0.0 | 0 | 0.0 | 0 | 0.0 | |
| 4–6 times a week | 0 | 0.0 | 0 | 0.0 | 0 | 0.0 | 0 | 0.0 | 0 | 0.0 | |
| 2–3 times a week | 0 | 0.0 | 0 | 0.0 | 0 | 0.0 | 0 | 0.0 | 0 | 0.0 | |
| once a week | 0 | 0.0 | 0 | 0.0 | 0 | 0.0 | 0 | 0.0 | 0 | 0.0 | |
| once a two weeks | 0 | 0.0 | 0 | 0.0 | 0 | 0.0 | 0 | 0.0 | 0 | 0.0 | |
| never | 134 | 83.2 | 61 | 85.9 | 32 | 80.0 | 9 | 81.8 | 32 | 82.1 | |
| no data | 27 | 16.8 | 10 | 14.1 | 8 | 20.0 | 2 | 18.2 | 7 | 17.9 | |
| pumpkin | |||||||||||
| everyday | 0 | 0.0 | 0 | 0.0 | 0 | 0.0 | 0 | 0.0 | 0 | 0.0 | |
| 4–6 times a week | 0 | 0.0 | 0 | 0.0 | 0 | 0.0 | 0 | 0.0 | 0 | 0.0 | |
| 2–3 times a week | 0 | 0.0 | 0 | 0.0 | 0 | 0.0 | 0 | 0.0 | 0 | 0.0 | |
| once a week | 0 | 0.0 | 0 | 0.0 | 0 | 0.0 | 0 | 0.0 | 0 | 0.0 | |
| once a two weeks | 0 | 0.0 | 0 | 0.0 | 0 | 0.0 | 0 | 0.0 | 0 | 0.0 | |
| never | 134 | 83.2 | 61 | 85.9 | 32 | 80.0 | 9 | 81.8 | 32 | 82.1 | |
| no data | 27 | 16.8 | 10 | 14.1 | 8 | 20.0 | 2 | 18.2 | 7 | 17.9 | |
| All | Sk1 | Sk2 | Sk3 | Sk4 | |||||||
|---|---|---|---|---|---|---|---|---|---|---|---|
| n | % | n | % | n | % | n | % | n | % | ||
| margarine | |||||||||||
| everyday | 33 | 20.5 | 11 | 15.5 | 10 | 25.0 | 2 | 18.2 | 10 | 25.6 | |
| 4–6 times a week | 5 | 3.1 | 2 | 2.8 | 1 | 2.5 | 0 | 0 | 2 | 5.1 | |
| 2–3 times a week | 5 | 3.1 | 2 | 2.8 | 1 | 2.5 | 0 | 0 | 2 | 5.1 | |
| once a week | 1 | 0.6 | 0 | 0 | 1 | 2.5 | 7 | 63.6 | 0 | 0 | |
| once a two weeks | 1 | 0.6 | 0 | 0 | 0 | 0 | 0 | 0 | 1 | 2.6 | |
| never | 89 | 55.3 | 46 | 64.8 | 19 | 47.5 | 0 | 0 | 17 | 43.6 | |
| no data | 27 | 16.8 | 10 | 14.1 | 8 | 20.0 | 2 | 18.2 | 7 | 17.9 | |
| soft margarine | |||||||||||
| everyday | 7 | 4.3 | 3 | 4.2 | 2 | 5.0 | 0 | 0 | 2 | 5.1 | |
| 4–6 times a week | 1 | 0.6 | 0 | 0 | 1 | 2.5 | 0 | 0 | 0 | 0 | |
| 2–3 times a week | 1 | 0.6 | 1 | 1.4 | 0 | 0 | 0 | 0 | 0 | 0 | |
| once a week | 0 | 0 | 0 | 0 | 0 | 0 | 0 | 0 | 0 | 0 | |
| once a two weeks | 1 | 0.6 | 0 | 0 | 0 | 0 | 0 | 0 | 1 | 2.6 | |
| never | 124 | 77.0 | 57 | 80.3 | 29 | 72.5 | 9 | 81.8 | 29 | 74.4 | |
| no data | 27 | 16.8 | 10 | 14.1 | 8 | 20.0 | 2 | 18.2 | 7 | 17.9 | |
| butter | |||||||||||
| everyday | 59 | 36.6 | 33 | 46.5 | 10 | 25.0 | 7 | 63.6 | 9 | 23.1 | |
| 4–6 times a week | 13 | 8.1 | 6 | 8.5 | 3 | 7.5 | 0 | 0 | 4 | 10.3 | |
| 2–3 times a week | 12 | 7.5 | 7 | 9.9 | 3 | 7.5 | 0 | 0 | 2 | 5.1 | |
| once a week | 1 | 0.6 | 0 | 0 | 1 | 2.5 | 0 | 0 | 0 | 0 | |
| once a two weeks | 3 | 1.9 | 2 | 2.8 | 0 | 0 | 0 | 0 | 1 | 2.6 | |
| never | 47 | 29.2 | 13 | 18.3 | 16 | 40.0 | 2 | 18.2 | 16 | 41.0 | |
| no data | 26 | 16.1 | 10 | 14.1 | 7 | 17.5 | 2 | 18.2 | 7 | 17.9 | |
| butter-margarine mix | |||||||||||
| everyday | 3 | 1.9 | 2 | 2.8 | 0 | 0 | 1 | 9.1 | 0 | 0 | |
| 4–6 times a week | 0 | 0 | 0 | 0 | 0 | 0 | 0 | 0 | 0 | 0 | |
| 2–3 times a week | 2 | 1.2 | 1 | 1.4 | 0 | 0 | 0 | 0 | 1 | 2.6 | |
| once a week | 0 | 0 | 0 | 0 | 0 | 0 | 0 | 0 | 0 | 0 | |
| once a two weeks | 1 | 0.6 | 0 | 0 | 1 | 2.5 | 0 | 0 | 0 | 0 | |
| never | 128 | 79.5 | 58 | 81.7 | 31 | 77.5 | 8 | 72.7 | 31 | 79.5 | |
| no data | 27 | 16.8 | 10 | 14.1 | 8 | 20.0 | 2 | 18.2 | 7 | 17.9 | |
| lard | |||||||||||
| everyday | 0 | 0.0 | 0 | 0 | 0 | 0 | 0 | 0 | 0 | 0 | |
| 4–6 times a week | 0 | 0.0 | 0 | 0 | 0 | 0 | 0 | 0 | 0 | 0 | |
| 2–3 times a week | 3 | 1.9 | 1 | 1.4 | 0 | 0 | 1 | 9.1 | 1 | 2.6 | |
| once a week | 0 | 0.0 | 0 | 0 | 0 | 0 | 0 | 0 | 0 | 0 | |
| once a two weeks | 1 | 0.6 | 0 | 0 | 1 | 2.5 | 0 | 0 | 0 | 0 | |
| never | 130 | 80.7 | 60 | 84.5 | 31 | 77.5 | 8 | 72.7 | 31 | 79.5 | |
| no data | 27 | 16.8 | 10 | 14.1 | 8 | 20.0 | 2 | 18.2 | 7 | 17.9 | |
| mayonnaise | |||||||||||
| everyday | 2 | 1.2 | 2 | 2.8 | 0 | 0 | 0 | 0 | 0 | 0 | |
| 4–6 times a week | 6 | 3.7 | 2 | 2.8 | 2 | 5.0 | 0 | 0 | 2 | 5.1 | |
| 2–3 times a week | 10 | 6.2 | 7 | 9.9 | 3 | 7.5 | 0 | 0 | 0 | 0 | |
| once a week | 14 | 8.7 | 7 | 9.9 | 2 | 5.0 | 1 | 9.1 | 4 | 10.3 | |
| once a two weeks | 34 | 21.1 | 16 | 22.5 | 8 | 20.0 | 0 | 0 | 10 | 25.6 | |
| never | 68 | 42.2 | 27 | 38.0 | 17 | 42.5 | 8 | 72.7 | 16 | 41.0 | |
| no data | 27 | 16.8 | 10 | 14.1 | 8 | 20.0 | 2 | 18.2 | 7 | 17.9 | |
| All | Sk1 | Sk2 | Sk3 | Sk4 | |||||||
|---|---|---|---|---|---|---|---|---|---|---|---|
| n | % | n | % | n | % | n | % | n | % | ||
| salmon | |||||||||||
| everyday | 0 | 0.0 | 0 | 0.0 | 0 | 0.0 | 0 | 0.0 | 0 | 0.0 | |
| 4–6 times a week | 0 | 0.0 | 0 | 0 | 0 | 0.0 | 0 | 0.0 | 0 | 0.0 | |
| 2–3 times a week | 9 | 5.6 | 4 | 5.6 | 1 | 2.5 | 0 | 0.0 | 0 | 0.0 | |
| once a week | 14 | 8.7 | 9 | 12.7 | 4 | 10.0 | 1 | 9.1 | 4 | 10.3 | |
| once a two weeks | 41 | 25.5 | 22 | 31.0 | 12 | 30.0 | 1 | 9.1 | 6 | 15.4 | |
| never | 71 | 44.1 | 26 | 36.6 | 16 | 40.0 | 7 | 63.6 | 22 | 56.4 | |
| no data | 26 | 16.1 | 10 | 14.1 | 7 | 17.5 | 2 | 18.2 | 7 | 17.9 | |
| tuna | |||||||||||
| everyday | 0 | 0.0 | 0 | 0.0 | 0 | 0.0 | 0 | 0.0 | 0 | 0.0 | |
| 4–6 times a week | 0 | 0.0 | 0 | 0.0 | 0 | 0.0 | 0 | 0.0 | 0 | 0.0 | |
| 2–3 times a week | 4 | 2.5 | 2 | 2.8 | 0 | 0.0 | 0 | 0.0 | 1 | 2.6 | |
| once a week | 6 | 3.7 | 3 | 4.2 | 1 | 2.5 | 0 | 0.0 | 3 | 7.7 | |
| once a two weeks | 17 | 10.6 | 8 | 11.3 | 6 | 15.0 | 0 | 0.0 | 3 | 7.7 | |
| never | 108 | 67.1 | 48 | 67.6 | 26 | 65.0 | 9 | 81.8 | 25 | 64.1 | |
| no data | 26 | 16.1 | 10 | 14.1 | 7 | 17.5 | 2 | 18.2 | 7 | 17.9 | |
| mackerel | |||||||||||
| everyday | 0 | 0.0 | 0 | 0.0 | 0 | 0.0 | 0 | 0.0 | 0 | 0.0 | |
| 4–6 times a week | 0 | 0.0 | 0 | 0.0 | 0 | 0.0 | 0 | 0.0 | 0 | 0.0 | |
| 2–3 times a week | 2 | 1.2 | 1 | 1.4 | 0 | 0.0 | 0 | 0.0 | 1 | 2.6 | |
| once a week | 7 | 4.3 | 3 | 4.2 | 0 | 0.0 | 0 | 0.0 | 3 | 7.7 | |
| once a two weeks | 37 | 23.0 | 16 | 22.5 | 13 | 32.5 | 1 | 9.1 | 8 | 20.5 | |
| never | 89 | 55.3 | 41 | 57.7 | 20 | 50.0 | 8 | 72.7 | 20 | 51.3 | |
| no data | 26 | 16.1 | 10 | 14.1 | 7 | 17.5 | 2 | 18.2 | 7 | 17.9 | |
| trout | |||||||||||
| everyday | 0 | 0.0 | 0 | 0.0 | 0 | 0.0 | 0 | 0.0 | 0 | 0.0 | |
| 4–6 times a week | 0 | 0.0 | 0 | 0.0 | 0 | 0.0 | 0 | 0.0 | 0 | 0.0 | |
| 2–3 times a week | 0 | 0.0 | 0 | 0.0 | 0 | 0.0 | 0 | 0.0 | 0 | 0.0 | |
| once a week | 3 | 1.9 | 2 | 2.8 | 0 | 0.0 | 0 | 0.0 | 1 | 2.6 | |
| once a two weeks | 13 | 8.1 | 7 | 9.9 | 3 | 7.5 | 1 | 9.1 | 2 | 5.1 | |
| never | 119 | 73.9 | 52 | 73.2 | 30 | 75.0 | 8 | 72.7 | 29 | 74.4 | |
| no data | 26 | 16.1 | 10 | 14.1 | 7 | 17.5 | 2 | 18.2 | 7 | 17.9 | |
| cod | |||||||||||
| everyday | 0 | 0.0 | 0 | 0.0 | 0 | 0.0 | 0 | 0.0 | 0 | 0.0 | |
| 4–6 times a week | 0 | 0.0 | 0 | 0.0 | 0 | 0.0 | 0 | 0.0 | 0 | 0.0 | |
| 2–3 times a week | 1 | 0.6 | 0 | 0.0 | 1 | 2.5 | 0 | 0.0 | 0 | 0.0 | |
| once a week | 8 | 5.0 | 4 | 5.6 | 1 | 2.5 | 2 | 18.2 | 1 | 2.6 | |
| once a two weeks | 33 | 20.5 | 17 | 23.9 | 7 | 17.5 | 1 | 9.1 | 8 | 20.5 | |
| never | 93 | 57.8 | 40 | 56.3 | 24 | 60.0 | 6 | 54.5 | 23 | 59.0 | |
| no data | 26 | 16.1 | 10 | 14.1 | 7 | 17.5 | 2 | 18.2 | 7 | 17.9 | |
| herring | |||||||||||
| everyday | 0 | 0.0 | 0 | 0.0 | 0 | 0.0 | 0 | 0.0 | 0 | 0.0 | |
| 4–6 times a week | 2 | 1.2 | 0 | 0.0 | 1 | 2.5 | 0 | 0.0 | 1 | 2.6 | |
| 2–3 times a week | 4 | 2.5 | 0 | 0.0 | 2 | 5.0 | 0 | 0.0 | 1 | 2.6 | |
| once a week | 7 | 4.3 | 3 | 4.2 | 1 | 2.5 | 1 | 9.1 | 3 | 7.7 | |
| once a two weeks | 25 | 15.5 | 17 | 23.9 | 3 | 7.5 | 1 | 9.1 | 5 | 12.8 | |
| never | 97 | 60.2 | 41 | 57.7 | 26 | 65.0 | 7 | 63.6 | 23 | 59.0 | |
| no data | 26 | 16.1 | 10 | 14.1 | 7 | 17.5 | 2 | 18.2 | 7 | 17.9 | |
| sardine | |||||||||||
| everyday | 0 | 0 | 0 | 0 | 0 | 0 | 0 | 0 | 0 | 0 | |
| 4–6 times a week | 0 | 0 | 0 | 0 | 0 | 0 | 0 | 0 | 0 | 0 | |
| 2–3 times a week | 0 | 0 | 0 | 0 | 0 | 0 | 0 | 0 | 0 | 0 | |
| once a week | 0 | 0 | 0 | 0 | 0 | 0 | 0 | 0 | 0 | 0 | |
| once a two weeks | 1 | 0.6 | 1 | 1.4 | 0 | 0 | 0 | 0 | 0 | 0 | |
| never | 134 | 83.2 | 60 | 84.5 | 33 | 82.5 | 9 | 81.8 | 32 | 82.1 | |
| no data | 26 | 16.1 | 10 | 14.1 | 7 | 17.5 | 2 | 18.2 | 7 | 17.9 | |
| eel | |||||||||||
| everyday | 0 | 0 | 0 | 0 | 0 | 0 | 0 | 0 | 0 | 0 | |
| 4–6 times a week | 0 | 0 | 0 | 0 | 0 | 0 | 0 | 0 | 0 | 0 | |
| 2–3 times a week | 0 | 0 | 0 | 0 | 0 | 0 | 0 | 0 | 0 | 0 | |
| once a week | 0 | 0 | 0 | 0 | 0 | 0 | 0 | 0 | 0 | 0 | |
| once a two weeks | 0 | 0 | 0 | 0 | 0 | 0 | 0 | 0 | 0 | 0 | |
| never | 135 | 83.9 | 61 | 85.9 | 33 | 82.5 | 9 | 81.8 | 32 | 82.1 | |
| no data | 26 | 16.1 | 10 | 14.1 | 7 | 17.5 | 2 | 18.2 | 7 | 17.9 | |
| halibut | |||||||||||
| everyday | 0 | 0 | 0 | 0 | 0 | 0 | 0 | 0 | 0 | 0 | |
| 4–6 times a week | 0 | 0 | 0 | 0 | 0 | 0 | 0 | 0 | 0 | 0 | |
| 2–3 times a week | 0 | 0 | 0 | 0 | 0 | 0 | 0 | 0 | 0 | 0 | |
| once a week | 0 | 0 | 0 | 0 | 0 | 0 | 0 | 0 | 0 | 0 | |
| once a two weeks | 3 | 1.9 | 1 | 1.4 | 2 | 5.0 | 0 | 0 | 0 | 0 | |
| never | 132 | 82.0 | 60 | 84.5 | 31 | 77.5 | 9 | 81.8 | 32 | 82.1 | |
| no data | 26 | 16.1 | 10 | 14.1 | 7 | 17.5 | 2 | 18.2 | 7 | 17.9 | |
| sprat | |||||||||||
| everyday | 0 | 0 | 0 | 0 | 0 | 0 | 0 | 0 | 0 | 0 | |
| 4–6 times a week | 0 | 0 | 0 | 0 | 0 | 0 | 0 | 0 | 0 | 0 | |
| 2–3 times a week | 0 | 0 | 0 | 0 | 0 | 0 | 0 | 0 | 0 | 0 | |
| once a week | 2 | 1.2 | 1 | 1.4 | 1 | 2.5 | 0 | 0 | 0 | 0 | |
| once a two weeks | 6 | 3.7 | 3 | 4.2 | 1 | 2.5 | 0 | 0 | 2 | 5.1 | |
| never | 127 | 78.9 | 57 | 80.3 | 31 | 77.5 | 9 | 81.8 | 30 | 76.9 | |
| no data | 26 | 16.1 | 10 | 14.1 | 7 | 17.5 | 2 | 18.2 | 7 | 17.9 | |
| pollock | |||||||||||
| everyday | 0 | 0 | 0 | 0 | 0 | 0 | 0 | 0 | 0 | 0 | |
| 4–6 times a week | 0 | 0 | 0 | 0 | 0 | 0 | 0 | 0 | 0 | 0 | |
| 2–3 times a week | 0 | 0 | 0 | 0 | 0 | 0 | 0 | 0 | 0 | 0 | |
| once a week | 1 | 0.6 | 0 | 0 | 0 | 0 | 0 | 0 | 0 | 0 | |
| once a two weeks | 2 | 1.2 | 1 | 1.4 | 1 | 2.5 | 0 | 0 | 1 | 2.6 | |
| never | 132 | 82.0 | 60 | 84.5 | 32 | 80.0 | 9 | 81.8 | 31 | 79.5 | |
| no data | 26 | 16.1 | 10 | 14.1 | 7 | 17.5 | 2 | 18.2 | 7 | 17.9 | |
| All | Sk1 | Sk2 | Sk3 | Sk4 | |||||||
|---|---|---|---|---|---|---|---|---|---|---|---|
| n | % | n | % | n | % | n | % | n | % | ||
| hazelnuts | |||||||||||
| everyday | 2 | 1.2 | 1 | 1.4 | 1 | 2.5 | 0 | 0.0 | 0 | 0.0 | |
| 4–6 times a week | 3 | 1.9 | 1 | 1.4 | 2 | 5.0 | 0 | 0.0 | 0 | 0.0 | |
| 2–3 times a week | 9 | 5.6 | 2 | 2.8 | 3 | 7.5 | 1 | 9.1 | 3 | 7.7 | |
| once a week | 8 | 5.0 | 2 | 2.8 | 3 | 7.5 | 1 | 9.1 | 2 | 5.1 | |
| once a two weeks | 29 | 18.0 | 16 | 22.5 | 7 | 17.5 | 1 | 9.1 | 5 | 12.8 | |
| never | 83 | 51.6 | 39 | 54.9 | 16 | 40.0 | 6 | 54.5 | 22 | 56.4 | |
| no data | 27 | 16.8 | 10 | 14.1 | 8 | 20.0 | 2 | 18.2 | 7 | 17.9 | |
| walnuts | |||||||||||
| everyday | 0 | 0.0 | 0.0 | 0.0 | 4 | 10.0 | 0.0 | 0.0 | 1 | 2.6 | |
| 4–6 times a week | 5 | 3.1 | 0.0 | 0.0 | 0.0 | 0.0 | 0.0 | 0.0 | 0.0 | 0.0 | |
| 2–3 times a week | 9 | 5.6 | 2 | 2.8 | 4 | 10.0 | 1 | 9.1 | 2 | 5.1 | |
| once a week | 10 | 6.2 | 2 | 2.8 | 1 | 2.5 | 2 | 18.2 | 5 | 12.8 | |
| once a two weeks | 33 | 20.5 | 19 | 26.8 | 8 | 20.0 | 1 | 9.1 | 5 | 12.8 | |
| never | 77 | 47.8 | 38 | 53.5 | 15 | 37.5 | 5 | 45.5 | 19 | 48.7 | |
| no data | 27 | 16.8 | 10 | 14.1 | 8 | 20.0 | 2 | 18.2 | 7 | 17.9 | |
| cashews | |||||||||||
| everyday | 0 | 0 | 0 | 0.0 | 0 | 0.0 | 0 | 0.0 | 0 | 0.0 | |
| 4–6 times a week | 0 | 0 | 0 | 0.0 | 0 | 0.0 | 0 | 0.0 | 0 | 0.0 | |
| 2–3 times a week | 7 | 4.3 | 2 | 2.8 | 4 | 10.0 | 0 | 0.0 | 1 | 2.6 | |
| once a week | 3 | 1.9 | 1 | 1.4 | 0 | 0.0 | 1 | 9.1 | 1 | 2.6 | |
| once a two weeks | 15 | 9.3 | 5 | 7.0 | 4 | 10.0 | 1 | 9.1 | 5 | 12.8 | |
| never | 109 | 67.7 | 53 | 74.6 | 24 | 60.0 | 7 | 63.6 | 25 | 64.1 | |
| no data | 27 | 16.8 | 10 | 14.1 | 8 | 20.0 | 2 | 18.2 | 7 | 17.9 | |
| pistachios | |||||||||||
| everyday | 0 | 0 | 0 | 0.0 | 0 | 0.0 | 0 | 0.0 | 0 | 0.0 | |
| 4–6 times a week | 0 | 0 | 0 | 0.0 | 0 | 0.0 | 0 | 0.0 | 0 | 0.0 | |
| 2–3 times a week | 3 | 1.9 | 0 | 0.0 | 2 | 5.0 | 1 | 9.1 | 1 | 2.6 | |
| once a week | 5 | 3.1 | 3 | 4.2 | 0 | 0.0 | 0 | 0.0 | 1 | 2.6 | |
| once a two weeks | 13 | 8.1 | 6 | 8.5 | 3 | 7.5 | 0 | 0.0 | 4 | 10.3 | |
| never | 113 | 70.2 | 52 | 73.2 | 27 | 67.5 | 8 | 72.7 | 26 | 66.7 | |
| no data | 27 | 16.8 | 10 | 14.1 | 8 | 20.0 | 2 | 18.2 | 7 | 17.9 | |
| almonds | |||||||||||
| everyday | 6 | 3.7 | 1 | 1.4 | 4 | 10.0 | 0 | 0.0 | 1 | 2.6 | |
| 4–6 times a week | 3 | 1.9 | 0 | 0.0 | 2 | 5.0 | 1 | 9.1 | 0 | 0.0 | |
| 2–3 times a week | 8 | 5.0 | 2 | 2.8 | 3 | 7.5 | 1 | 9.1 | 2 | 5.1 | |
| once a week | 8 | 5.0 | 4 | 5.6 | 0 | 0.0 | 1 | 9.1 | 3 | 7.7 | |
| once a two weeks | 26 | 16.1 | 15 | 21.1 | 8 | 20.0 | 2 | 18.2 | 1 | 2.6 | |
| never | 83 | 51.6 | 39 | 54.9 | 15 | 37.5 | 4 | 36.4 | 25 | 64.1 | |
| no data | 27 | 16.8 | 10 | 14.1 | 8 | 20.0 | 2 | 18.2 | 7 | 17.9 | |
| peanuts | |||||||||||
| everyday | 1 | 0.6 | 1 | 1.4 | 0 | 0.0 | 0 | 0.0 | 0 | 0.0 | |
| 4–6 times a week | 2 | 1.2 | 0 | 0.0 | 2 | 5.0 | 0 | 0.0 | 0 | 0.0 | |
| 2–3 times a week | 2 | 1.2 | 1 | 1.4 | 0 | 0.0 | 0 | 0.0 | 1 | 2.6 | |
| once a week | 3 | 1.9 | 1 | 1.4 | 0 | 0.0 | 1 | 9.1 | 1 | 2.6 | |
| once a two weeks | 6 | 3.7 | 4 | 5.6 | 2 | 5.0 | 0 | 0.0 | 0 | 0.0 | |
| never | 120 | 74.5 | 54 | 76.1 | 28 | 70.0 | 8 | 72.7 | 30 | 76.9 | |
| no data | 27 | 16.8 | 10 | 14.1 | 8 | 20.0 | 2 | 18.2 | 7 | 17.9 | |
| All | Sk1 | Sk2 | Sk3 | Sk4 | |||||||
|---|---|---|---|---|---|---|---|---|---|---|---|
| n | % | n | % | n | % | n | % | n | % | ||
| eggs | |||||||||||
| everyday | 11 | 6.8 | 5 | 7.0 | 4 | 10.0 | 0 | 0.0 | 2 | 5.1 | |
| 4–6 times a week | 2 | 1.2 | 1 | 1.4 | 1 | 2.5 | 0 | 0.0 | 0 | 0.0 | |
| 2–3 times a week | 47 | 29.2 | 22 | 31.0 | 9 | 22.5 | 3 | 27.3 | 13 | 33.3 | |
| once a week | 55 | 34.2 | 25 | 35.2 | 16 | 40.0 | 5 | 45.5 | 9 | 23.1 | |
| once a two weeks | 14 | 8.7 | 5 | 7.0 | 2 | 5.0 | 0 | 0.0 | 7 | 17.9 | |
| never | 6 | 3.7 | 3 | 4.2 | 1 | 2.5 | 1 | 9.1 | 1 | 2.6 | |
| no data | 26 | 16.1 | 10 | 14.1 | 7 | 17.5 | 2 | 18.2 | 7 | 17.9 | |
| All | Sk1 | Sk2 | Sk3 | Sk4 | |||||||
|---|---|---|---|---|---|---|---|---|---|---|---|
| n | % | n | % | n | % | n | % | n | % | ||
| oatmeal | |||||||||||
| everyday | 7 | 4.3 | 2 | 2.8 | 2 | 5.0 | 1 | 9.1 | 2 | 5.1 | |
| 4–6 times a week | 10 | 6.2 | 6 | 8.5 | 1 | 2.5 | 0 | 0.0 | 3 | 7.7 | |
| 2–3 times a week | 21 | 13.0 | 10 | 14.1 | 4 | 10.0 | 3 | 27.3 | 4 | 10.3 | |
| once a week | 22 | 13.7 | 9 | 12.7 | 7 | 17.5 | 2 | 18.2 | 4 | 10.3 | |
| once a two weeks | 9 | 5.6 | 3 | 4.2 | 3 | 7.5 | 0 | 0.0 | 3 | 7.7 | |
| never | 65 | 40.4 | 31 | 43.7 | 15 | 37.5 | 3 | 27.3 | 16 | 41.0 | |
| no data | 27 | 16.8 | 10 | 14.1 | 8 | 20.0 | 2 | 18.2 | 7 | 17.9 | |
| cornflakes | |||||||||||
| everyday | 9 | 5.6 | 6 | 8.5 | 0 | 0.0 | 2 | 18.2 | 1 | 2.6 | |
| 4–6 times a week | 4 | 2.5 | 3 | 4.2 | 0 | 0.0 | 1 | 9.1 | 0 | 0.0 | |
| 2–3 times a week | 13 | 8.1 | 9 | 12.7 | 1 | 2.5 | 0 | 0.0 | 3 | 7.7 | |
| once a week | 6 | 3.7 | 2 | 2.8 | 0 | 0.0 | 1 | 9.1 | 3 | 7.7 | |
| once a two weeks | 3 | 1.9 | 1 | 1.4 | 1 | 2.5 | 1 | 9.1 | 0 | 0.0 | |
| never | 99 | 61.5 | 40 | 56.3 | 30 | 75.0 | 4 | 36.4 | 25 | 64.1 | |
| no data | 27 | 16.8 | 10 | 14.1 | 8 | 20.0 | 2 | 18.2 | 7 | 17.9 | |
| rice flakes | |||||||||||
| everyday | 0 | 0.0 | 0 | 0.0 | 0 | 0.0 | 0 | 0.0 | 0 | 0.0 | |
| 4–6 times a week | 0 | 0.0 | 0 | 0.0 | 0 | 0.0 | 0 | 0.0 | 0 | 0.0 | |
| 2–3 times a week | 1 | 0.6 | 0 | 0.0 | 1 | 2.5 | 0 | 0.0 | 0 | 0.0 | |
| once a week | 2 | 1.2 | 1 | 1.4 | 0 | 0.0 | 0 | 0.0 | 1 | 2.6 | |
| once a two weeks | 0 | 0 | 0 | 0 | 0 | 0 | 0 | 0 | 0 | 0 | |
| never | 131 | 81.4 | 60 | 84.5 | 31 | 77.5 | 9 | 81.8 | 31 | 79.5 | |
| no data | 27 | 16.8 | 10 | 14.1 | 8 | 20.0 | 2 | 18.2 | 7 | 17.9 | |
| sunflower seeds | |||||||||||
| everyday | 4 | 2.5 | 1 | 1.4 | 3 | 7.5 | 0 | 0.0 | 0 | 0.0 | |
| 4–6 times a week | 3 | 1.9 | 0 | 0.0 | 3 | 7.5 | 0 | 0.0 | 0 | 0.0 | |
| 2–3 times a week | 4 | 2.5 | 2 | 2.8 | 0 | 0.0 | 1 | 9.1 | 1 | 2.6 | |
| once a week | 10 | 6.2 | 5 | 7.0 | 1 | 2.5 | 1 | 9.1 | 3 | 7.7 | |
| once a two weeks | 13 | 8.1 | 6 | 8.5 | 5 | 12.5 | 0 | 0.0 | 2 | 5.1 | |
| never | 100 | 62.1 | 47 | 66.2 | 20 | 50.0 | 7 | 63.6 | 26 | 66.7 | |
| no data | 27 | 16.8 | 10 | 14.1 | 8 | 20.0 | 2 | 18.2 | 7 | 17.9 | |
| pumpkin seeds | |||||||||||
| everyday | 2 | 1.2 | 0 | 0.0 | 2 | 5.0 | 0 | 0.0 | 0 | 0.0 | |
| 4–6 times a week | 2 | 1.2 | 1 | 1.4 | 1 | 2.5 | 0 | 0.0 | 0 | 0.0 | |
| 2–3 times a week | 1 | 0.6 | 1 | 1.4 | 0 | 0.0 | 0 | 0.0 | 0 | 0.0 | |
| once a week | 7 | 4.3 | 3 | 4.2 | 1 | 2.5 | 1 | 9.1 | 2 | 5.1 | |
| once a two weeks | 8 | 5.0 | 3 | 4.2 | 4 | 10.0 | 0 | 0.0 | 1 | 2.6 | |
| never | 114 | 70.8 | 53 | 74.6 | 24 | 60.0 | 8 | 72.7 | 29 | 74.4 | |
| no data | 27 | 16.8 | 10 | 14.1 | 8 | 20.0 | 2 | 18.2 | 7 | 17.9 | |
| wheat bread | |||||||||||
| everyday | 11 | 6.8 | 3 | 4.2 | 1 | 2.5 | 5 | 45.5 | 2 | 5.1 | |
| 4–6 times a week | 2 | 1.2 | 2 | 2.8 | 0 | 0.0 | 0 | 0.0 | 0 | 0.0 | |
| 2–3 times a week | 2 | 1.2 | 1 | 1.4 | 1 | 2.5 | 0 | 0.0 | 0 | 0.0 | |
| once a week | 0 | 0.0 | 0 | 0.0 | 0 | 0.0 | 0 | 0.0 | 0 | 0.0 | |
| once a two weeks | 2 | 1.2 | 1 | 1.4 | 1 | 2.5 | 0 | 0.0 | 0 | 0.0 | |
| never | 116 | 72.0 | 54 | 76.1 | 29 | 72.5 | 4 | 36.4 | 29 | 74.4 | |
| no data | 28 | 17.4 | 10 | 14.1 | 8 | 20.0 | 2 | 18.2 | 8 | 20.5 | |
| rye bread | |||||||||||
| everyday | 39 | 24.2 | 19 | 26.8 | 12 | 30.0 | 1 | 9.1 | 7 | 17.9 | |
| 4–6 times a week | 10 | 6.2 | 4 | 5.6 | 5 | 12.5 | 0 | 0.0 | 1 | 2.6 | |
| 2–3 times a week | 4 | 2.5 | 1 | 1.4 | 2 | 5.0 | 0 | 0.0 | 1 | 2.6 | |
| once a week | 3 | 1.9 | 2 | 2.8 | 0 | 0.0 | 1 | 9.1 | 0 | 0.0 | |
| once a two weeks | 2 | 1.2 | 1 | 1.4 | 1 | 2.5 | 0 | 0.0 | 0 | 0.0 | |
| never | 76 | 47.2 | 34 | 47.9 | 12 | 30.0 | 7 | 63.6 | 23 | 59.0 | |
| no data | 27 | 16.8 | 10 | 14.1 | 8 | 20.0 | 2 | 18.2 | 7 | 17.9 | |
| whole wheat bread | |||||||||||
| everyday | 32 | 19.9 | 15 | 21.1 | 5 | 12.5 | 1 | 9.1 | 11 | 28.2 | |
| 4–6 times a week | 16 | 9.9 | 6 | 8.5 | 5 | 12.5 | 0 | 0.0 | 5 | 12.8 | |
| 2–3 times a week | 9 | 5.6 | 4 | 5.6 | 1 | 2.5 | 0 | 0.0 | 4 | 10.3 | |
| once a week | 8 | 5.0 | 6 | 8.5 | 1 | 2.5 | 0 | 0.0 | 1 | 2.6 | |
| once a two weeks | 4 | 2.5 | 2 | 2.8 | 0 | 0.0 | 0 | 0.0 | 2 | 5.1 | |
| never | 64 | 39.8 | 28 | 39.4 | 20 | 50.0 | 7 | 63.6 | 9 | 23.1 | |
| no data | 28 | 17.4 | 10 | 14.1 | 8 | 20.0 | 3 | 27.3 | 7 | 17.9 | |
| All | Sk1 | Sk2 | Sk3 | Sk4 | |||||||
|---|---|---|---|---|---|---|---|---|---|---|---|
| n | % | n | % | n | % | n | % | n | % | ||
| avocado | |||||||||||
| everyday | 1 | 0.6 | 1 | 1.4 | 0 | 0.0 | 0 | 0.0 | 0 | 0.0 | |
| 4–6 times a week | 0 | 0.0 | 0 | 0.0 | 0 | 0.0 | 0 | 0.0 | 0 | 0.0 | |
| 2–3 times a week | 2 | 1.2 | 1 | 1.4 | 0 | 0.0 | 1 | 9.1 | 0 | 0.0 | |
| once a week | 6 | 3.7 | 3 | 4.2 | 1 | 2.5 | 0 | 0.0 | 2 | 5.1 | |
| once a two weeks | 7 | 4.3 | 3 | 4.2 | 3 | 7.5 | 0 | 0.0 | 1 | 2.6 | |
| never | 118 | 73.3 | 53 | 74.6 | 28 | 70.0 | 8 | 72.7 | 29 | 74.4 | |
| no data | 27 | 16.8 | 10 | 14.1 | 8 | 20.0 | 2 | 18.2 | 7 | 17.9 | |
| lettuce | |||||||||||
| everyday | 15 | 9.3 | 8 | 11.3 | 4 | 10.0 | 0 | 0.0 | 3 | 7.7 | |
| 4–6 times a week | 2 | 1.2 | 0 | 0.0 | 1 | 2.5 | 0 | 0.0 | 1 | 2.6 | |
| 2–3 times a week | 32 | 19.9 | 14 | 19.7 | 6 | 15.0 | 5 | 45.5 | 7 | 17.9 | |
| once a week | 23 | 14.3 | 11 | 15.5 | 6 | 15.0 | 0 | 0.0 | 6 | 15.4 | |
| once a two weeks | 17 | 10.6 | 8 | 11.3 | 5 | 12.5 | 0 | 0.0 | 4 | 10.3 | |
| never | 45 | 28.0 | 20 | 28.2 | 10 | 25.0 | 4 | 36.4 | 11 | 28.2 | |
| no data | 27 | 16.8 | 10 | 14.1 | 8 | 20.0 | 2 | 18.2 | 7 | 17.9 | |
| spinach | |||||||||||
| everyday | 0 | 0.0 | 0 | 0.0 | 0 | 0.0 | 0 | 0.0 | 0 | 0.0 | |
| 4–6 times a week | 1 | 0.6 | 1 | 1.4 | 0 | 0.0 | 0 | 0.0 | 0 | 0.0 | |
| 2–3 times a week | 7 | 4.3 | 6 | 8.5 | 1 | 2.5 | 0 | 0.0 | 0 | 0.0 | |
| once a week | 20 | 12.4 | 7 | 9.9 | 8 | 20.0 | 1 | 9.1 | 4 | 10.3 | |
| once a two weeks | 24 | 14.9 | 12 | 16.9 | 5 | 12.5 | 2 | 18.2 | 5 | 12.8 | |
| never | 82 | 50.9 | 35 | 49.3 | 18 | 45.0 | 6 | 54.5 | 23 | 59.0 | |
| no data | 27 | 16.8 | 10 | 14.1 | 8 | 20.0 | 2 | 18.2 | 7 | 17.9 | |
| tofu | |||||||||||
| everyday | 0 | 0.0 | 0 | 0.0 | 0 | 0.0 | 0 | 0.0 | 0 | 0.0 | |
| 4–6 times a week | 0 | 0.0 | 0 | 0.0 | 0 | 0.0 | 0 | 0.0 | 0 | 0.0 | |
| 2–3 times a week | 1 | 0.6 | 0 | 0.0 | 0 | 0.0 | 0 | 0.0 | 1 | 2.6 | |
| once a week | 0 | 0.0 | 0 | 0.0 | 0 | 0.0 | 0 | 0.0 | 0 | 0.0 | |
| once a two weeks | 1 | 0.6 | 1 | 1.4 | 0 | 0.0 | 0 | 0.0 | 0 | 0.0 | |
| never | 132 | 82.0 | 60 | 84.5 | 32 | 80.0 | 9 | 81.8 | 31 | 79.5 | |
| no data | 27 | 16.8 | 10 | 14.1 | 8 | 20.0 | 2 | 18.2 | 7 | 17.9 | |
| fish oil | |||||||||||
| yes | 5 | 3.1 | 3 | 4.2 | 1 | 2.5 | 0 | 0.0 | 1 | 2.6 | |
| no | 151 | 93.8 | 65 | 91.5 | 39 | 97.5 | 11 | 100.0 | 36 | 92.3 | |
| no data | 5 | 3.1 | 3 | 4.2 | 0 | 0.0 | 0 | 0.0 | 2 | 5.1 | |
| vitamin supplementation | |||||||||||
| yes | 100 | 62.1 | 47 | 66.2 | 24 | 60.0 | 8 | 72.7 | 21 | 53.8 | |
| no | 56 | 34.8 | 21 | 29.6 | 16 | 40.0 | 3 | 27.3 | 16 | 41.0 | |
| no data | 5 | 3.1 | 3 | 4.2 | 0 | 0.0 | 0 | 0.0 | 2 | 5.1 | |
| omega supplements | |||||||||||
| yes | 65 | 40.4 | 28 | 39.4 | 18 | 45.0 | 8 | 72.7 | 11 | 28.2 | |
| no | 90 | 55.9 | 39 | 54.9 | 22 | 55.0 | 3 | 27.3 | 26 | 66.7 | |
| no data | 6 | 3.7 | 4 | 5.6 | 0 | 0.0 | 0 | 0.0 | 2 | 5.1 | |
| potato fries | |||||||||||
| yes | 50 | 31.1 | 28 | 39.4 | 11 | 27.5 | 1 | 9.1 | 10 | 25.6 | |
| no | 93 | 57.8 | 36 | 50.7 | 23 | 57.5 | 8 | 72.7 | 26 | 66.7 | |
| no data | 18 | 11.2 | 7 | 9.9 | 6 | 15.0 | 2 | 18.2 | 3 | 7.7 | |
| chips | |||||||||||
| yes | 30 | 18.6 | 19 | 26.8 | 6 | 15.0 | 1 | 9.1 | 4 | 10.3 | |
| no | 113 | 70.2 | 45 | 63.4 | 28 | 70.0 | 8 | 72.7 | 32 | 82.1 | |
| no data | 18 | 11.2 | 7 | 9.9 | 6 | 15.0 | 2 | 18.2 | 3 | 7.7 | |
| Coefficients of Canonical Variables | |||
| Variable (Discriminatory Power) | DF1 (62.4%) | DF2 (23.1%) | DF3 (14.5%) |
| C20:1 | 1.019033 | 0.153469 | −0.384475 |
| C17:1 | −0.197239 | −0.335925 | 0.670768 |
| c6,c9,c12 C18:3 | 1.226704 | 0.142788 | 0.518516 |
| C18:0 | −0.353679 | −0.164360 | −0.235229 |
| C22:1 | −0.368181 | 0.525440 | −0.195506 |
| c9 C18:1 | −0.115208 | 0.588598 | 0.157178 |
| C23:0 | 0.165942 | −0.555285 | −0.060737 |
| C16:1 | −0.606104 | 0.433519 | −0.186427 |
| c5c8c11c14c17 C20:5 | −0.533300 | −0.198048 | 0.231662 |
| c9,c12,c15 C18:3 | 0.592131 | 0.026560 | −0.305218 |
| C15:0 | 0.162175 | −0.212680 | 0.677425 |
| C20:2 | 0.251177 | −0.482919 | 0.194679 |
| c5,c8,c11,c14 C20:4 | −0.108988 | 0.130942 | −0.510834 |
| c9,c12 C18:2 | −0.496911 | −0.116980 | −0.288841 |
| C22:0 | −0.206239 | 0.064151 | 0.235650 |
| C12:0 | −0.141885 | −0.254590 | −0.070607 |
| C17:0 | −0.193858 | −0.144524 | −0.347023 |
| C24:0 | −0.025364 | −0.031390 | −0.354546 |
| c4,c7,c10,c13,c16,c19 C22:6 | 0.006504 | −0.306643 | 0.109614 |
| C20:0 | 0.185902 | −0.244927 | −0.152906 |
| C14:0 | −0.262623 | 0.241964 | 0.232538 |
| Average Value of Canonical Variables | |||
| Sk1 | −0.245045 | −0.21546 | 1.05831 |
| Sk2 | −0.856846 | −1.48900 | −1.10289 |
| Sk3 | 7.274431 | −0.00424 | −0.47649 |
| Sk4 | −0.726839 | 1.92062 | −0.66112 |
| Coefficients of Canonical Variables | ||
| Variable (Discriminatory Power) | DF1 (49.7%) | DF2 (34.1%) |
| Wheat bread | −0.534250 | 0.172987 |
| Almonds | −0.174052 | 0.299568 |
| Butter | −0.156545 | −0.228098 |
| Whole wheat bread | 0.193427 | 0.022746 |
| Butter-margarine mix | −0.549327 | −0.169966 |
| Omega-3 supplementation | −0.956393 | 0.184221 |
| Cornflakes | −0.076700 | −0.208335 |
| Rye bread | 0.149223 | 0.092971 |
| Grapeseed oil | −0.021209 | −0.681737 |
| Chips | 0.270719 | −0.861812 |
| Salmon | 0.033694 | −0.537936 |
| Lard | 0.148335 | 0.932102 |
| Sunflower oil | 0.172069 | −0.308455 |
| Walnuts | 0.157714 | 0.360171 |
| Vitamin supplementation | 0.071907 | −0.809480 |
| Tofu | 0.770064 | 0.321142 |
| Cod | −0.587247 | −0.130541 |
| Herring | −0.411779 | 0.068285 |
| Halibut | 2.197515 | 0.803059 |
| constant | −0.009766 | 2.099391 |
| Average Value of Canonical Variables | ||
| Sk1 | −0.07187 | −0.791351 |
| Sk2 | 0.38672 | 0.792241 |
| Sk3 | −3.27057 | 0.829717 |
| Sk4 | 0.58161 | 0.474202 |

Appendix B
- (1)
- Name and surname: ............. number of medical history: ............. ID ............
- (2)
- Age: .............
- (3)
- Education/profession: .............
- (4)
- Body mass before pregnancy ............. present body mass: ............. height............... BMI: .............
- (5)
- Number of current pregnancy: .............
- (6)
- previous obstetric interview (number of deliveries: ............., number of miscarriages.............)
- (7)
- chronic diseases before pregnancy (diseases of the kidneys, liver, thyroid, etc.): .............
- (8)
- Does the family (parents, siblings, grandparents) have liver diseases, diabetes, arterial hypertension? ..............................................................................
- (9)
- date of the last menstrual period: ............. date of labour: ...........Diseases in current pregnancy:
- (10)
- hypertension.............
- (11)
- gestational diabetes .............
- (12)
- cholestasis .............
- (13)
- Other diseases complicating pregnancy? .............
- (14)
- How long/from which week of pregnancy? .............
- (15)
- Do you smoke cigarettes when you are pregnant? ............How many/24 h: .............
- (16)
- Do you drink alcohol when you are pregnant? ..............How much? ............How often? .............
| Fish | ||||||||
| Food Product | How Often Consumed in Pregnancy? | Amount per Serving (Grams) | Number of Serving per Week | |||||
| Never | Once a Two Weeks | ONCE A WEEK | 2–3 Times a Week | 4–6 Times a Week | Everyday | |||
| salmon | ||||||||
| tuna | ||||||||
| mackerel | ||||||||
| trout | ||||||||
| cod | ||||||||
| herring | ||||||||
| sardine | ||||||||
| eel | ||||||||
| halibut | ||||||||
| sprat | ||||||||
| other | ||||||||
| Sea food | ||||||||
| Food Product | How Often Consumed in Pregnancy? | Amount per Serving (Grams) | Number of Serving per Week | |||||
| Never | Once a Two Weeks | Once a Week | 2–3 Times a Week | 4–6 Times a Week | Everyday | |||
| clams | ||||||||
| prawns | ||||||||
| oysters | ||||||||
| mixed shells | ||||||||
| squids | ||||||||
| lobsters | ||||||||
| other | ||||||||
| Nuts | ||||||||
| Food Product | How Often Consumed in Pregnancy? | Amount per Serving (Grams) | Number of Serving per Week | |||||
| Never | Once a Two Weeks | Once a Week | 2–3 Times a Week | 4–6 Times a Week | Everyday | |||
| hazelnuts | ||||||||
| walnuts | ||||||||
| cashews | ||||||||
| pistachios | ||||||||
| almonds | ||||||||
| peanuts | ||||||||
| other | ||||||||
| Edible oils, fats | ||||||||
| Food Product | How Often Consumed in Pregnancy? | Amount per Serving (Tablespoons) | Number of Serving per Week | |||||
| Never | Once a Two Weeks | Once a Week | 2–3 Times a Week | 4–6 Times a Week | Everyday | |||
| olive | ||||||||
| sunflower | ||||||||
| rapeseed | ||||||||
| linseed | ||||||||
| corn | ||||||||
| grapeseed | ||||||||
| coconut | ||||||||
| sesame | ||||||||
| soybean | ||||||||
| peanut | ||||||||
| hemp | ||||||||
| pumpkin | ||||||||
| other | ||||||||
| Food Product | How Often Consumed in Pregnancy? | Amount per Serving (Tablespoons) | Number of Serving per Week | |||||
| Never | Once a two Weeks | Once a Week | 2–3 Times a Week | 4–6 Times a Week | Everyday | |||
| margarine | ||||||||
| soft margarine | ||||||||
| butter | ||||||||
| butter-margarine mix | ||||||||
| lard | ||||||||
| mayonnaise | ||||||||
| Eggs | ||||||||
| Food Product | How Often Consumed in Pregnancy? | How Many Pieces per Serving | Number of Serving per Week | |||||
| Never | Once a Two Weeks | Once a Week | 2–3 Times a Week | 4–6 Times a Week | Everyday | |||
| eggs | ||||||||
| Flakes, cereals and seeds, fruits, vegetables | ||||||||
| Food Product | How Often Consumed in Pregnancy? | Amount per Serving (Tablespoons/Slices) | Number of Serving per Week | |||||
| Never | Once a Two Weeks | Once a Week | 2–3 Times a Week | 4–6 Times a Week | Everyday | |||
| oatmeal | ||||||||
| cornflakes | ||||||||
| rice flakes | ||||||||
| sunflower seeds | ||||||||
| pumpkin seeds | ||||||||
| wheat bread | ||||||||
| rye bread | ||||||||
| whole wheat bread | ||||||||
| other | ||||||||
| Food Product | How Often Consumed in Pregnancy? | Amount per Serving (Grams) | Number of Serving per Week | |||||
| Never | Once a Two Weeks | Once a week | 2–3 Times a Week | 4–6 Times a Week | Everyday | |||
| avocado | ||||||||
| lettuce | ||||||||
| spinach | ||||||||
| tofu | ||||||||
| other | ||||||||
- (1)
- Do you drink fish oil? yes noHow many tablespoons per serving and how often? .............................................................................................................................Have you drunk fish oil in the last 7 days?..............................................................................................................................
- (2)
- Do you use vitamin supplementation during pregnancy? Please enter the exact name and dose.........................................................................................................................................................................................................................................................................................................................................................................................
- (3)
- Do you use omega supplementation during pregnancy? Please enter the exact name and dose .............................................................................................................................................................................................................................................................................................................................................................................................................................
- (4)
- Please list the names of all drugs (and in what dose) you were/are taking during pregnancy?.....................................................................................................................................................................................................................................................................................................................................................................................................................................................................................................................................................................................................................................................
- (5)
- Did you eat potato fries during pregnancy? yes no
- (6)
- Did you eat chips during pregnancy? yes no
References
- Białek, A.; Jelińska, M.; Tokarz, A. Influence of maternal diet enrichment with conjugated linoleic acids on lipoxygenase metabolites of polyunsaturated fatty acids in serum of their offspring with 7,12-dimethylbenz[a]anthracene induced mammary tumors. Prostaglandins Other Lipid Mediat. 2015, 116–117, 10–18. [Google Scholar] [CrossRef] [PubMed]
- Fontelles, C.C.; Guido, L.N.; Rosim, M.P.; Andrade, F.D.O.; Jin, L.; Inchauspe, J.; Pires, V.C.; De Castro, I.A.; Hilakivi-clarke, L.; De Assis, S.; et al. Paternal programming of breast cancer risk in daughters in a rat model : Opposing effects of animal-and plant-based high-fat diets. Breast Cancer Res. 2016, 18, 71. [Google Scholar] [CrossRef] [Green Version]
- Danielewicz, H.; Myszczyszyn, G.; Dębińska, A.; Myszkal, A.; Boznański, A.; Hirnle, L. Diet in pregnancy—More than food. Eur. J. Pediatr. 2017, 176, 1573–1579. [Google Scholar] [CrossRef] [PubMed] [Green Version]
- Carvalho, G.Q.; Pereira-Santos, M.; Marcon, L.D.; Louro, I.D.; Peluzio, M.C.G.; Santos, D.B. Maternal polymorphisms in the FADS1 and FADS2 genes modify the association between PUFA ingestion and plasma concentrations of omega-3 polyunsaturated fatty acids. Prostaglandins Leukot. Essent. Fat. Acids 2019, 150, 38–46. [Google Scholar] [CrossRef] [PubMed]
- Duttaroy, A.K.; Basak, S. Maternal dietary fatty acids and their roles in human placental development. Prostaglandins Leukot. Essent. Fat. Acids 2020, 155, 102080. [Google Scholar] [CrossRef]
- Bernard, J.Y.; Tint, M.T.; Aris, I.M.; Chen, L.W.; Quah, P.L.; Tan, K.H.; Yeo, G.S.H.; Fortier, M.V.; Yap, F.; Shek, L.; et al. Maternal plasma phosphatidylcholine polyunsaturated fatty acids during pregnancy and offspring growth and adiposity. Prostaglandins Leukot. Essent. Fat. Acids 2017, 121, 21–29. [Google Scholar] [CrossRef] [Green Version]
- Van Der Beek, E.M.; Oosting, A. Nutritional programming in early life: The role of dietary lipid quality for future health. OCL 2020, 27, 15. [Google Scholar] [CrossRef] [Green Version]
- Australian Government Department of Health and Ageing; National Health and Medical Research Council. Nutrient Reference Values for Australia and New Zealand—Executive Summary; National Health and Medical Research Council: Brisbane City, Australia, 2006; Volume 58, ISBN 1864962550.
- Wąsowska-Królikowska, K.; Naruszewicz, M. Stanowisko ekspertów polskiego towarzystwa pediatrycznego (PTP) i polskiego towarzystwa badań nad miażdżycą (PTBnM) dotyczące przeciwdziałania stanom niedoborowym wielonienasyconych kwasów tłuszczowych Omega-3 w żywieniu kobiet w ciąży, niemowląt i dzieci. Czynniki Ryzyka 2007, 1, 3–4. [Google Scholar]
- Dębski, R.; Karowicz-Bilińska, A.; Oszukowski, P.; Paszkowski, T.; Spaczyński, M. Rekomendacje polskiego towarzystwa ginekologicznego dotyczące stosowania suplementacji kwasem dokozaheksaenowym w profilaktyce porodu przedwczesnego. Ginekol. Pol. 2014, 85, 318–320. [Google Scholar]
- Koletzko, B.; Cetin, I.; Thomas Brenna, J.; Alvino, G.; von Berlepsch, J.; Biesalski, H.K.; Clandinin, T.; Debertin, H.; Decsi, T.; Demmelmair, H.; et al. Dietary fat intakes for pregnant and lactating women. Br. J. Nutr. 2007, 98, 873–877. [Google Scholar] [CrossRef] [Green Version]
- Bondia-Pons, I.; Molto-Puigmarti, C.; Castellote, A.I.; Lopez-Sabater, M.C. Determination of conjugated linoleic acid in human plasma by fast gas chromatography. J. Chromatogr. A 2007, 1157, 422–429. [Google Scholar] [CrossRef]
- Grieger, J.A.; Clifton, V.L. A review of the impact of dietary intakes in human pregnancy on infant birthweight. Nutrients 2015, 7, 153–178. [Google Scholar] [CrossRef] [Green Version]
- Olsen, S.F.; Sørensen, J.D.; Secher, N.J.; Hedegaard, M.; Brink Henriksen, T.; Hansen, H.S.; Grant, A. Randomised controlled trial of effect of fish-oil supplementation on pregnancy duration. Lancet 1992, 339, 1003–1007. [Google Scholar] [CrossRef]
- Helland, I.B.; Smith, L.; Saarem, K.; Saugstad, O.D.; Drevon, C.A. Maternal supplementation with very-long-chain n-3 fatty acids during pregnancy and lactation augments children’s IQ at 4 years of age. Pediatrics 2003, 111, e39–e44. [Google Scholar] [CrossRef] [Green Version]
- Makrides, M.; Gibson, R.A.; McPhee, A.J.; Yell, L.; Quinlivan, J.; Ryan, P. Effect of DHA supplementation during pregnancy on maternal depression and neurodevelopment of young children: A randomized controlled trial. Obstet. Gynecol. Surv. 2011, 66, 79–81. [Google Scholar] [CrossRef]
- Cetin, I.; Alvino, G.; Cardellicchio, M. Long chain fatty acids and dietary fats in fetal nutrition. J. Physiol. 2009, 587, 3441–3451. [Google Scholar] [CrossRef] [PubMed]
- Aparicio, E.; Martín-Grau, C.; Bedmar, C.; Orus, N.S.; Basora, J.; Arija, V. Maternal factors associated with levels of fatty acids, specifically n-3 pufa during pregnancy: Eclipses study. Nutrients 2021, 13, 317. [Google Scholar] [CrossRef] [PubMed]
- Bialek, A.; Bialek, M.; Jelinska, M.; Tokarz, A. Fatty acid composition and oxidative characteristics of novel edible oils in Poland. CyTA—J. Food 2017, 15, 1–8. [Google Scholar] [CrossRef] [Green Version]
- Białek, A.; Stawarska, A.; Tokarz, A.; Czuba, K.; Konarska, A.; Mazurkiewicz, M.; Stanimirova-Daszykowska, I. Enrichment of maternal diet with conjugated linoleic acids influences desaturases activity and fatty acids profile in livers and hepatic microsomes of the offspring with 7,12-dimethylbenz[A]anthracene-induced mammary tumors. Acta Pol. Pharm.-Drug Res. 2014, 71, 747–761. [Google Scholar]
- Białek, M.; Białek, A.; Czauderna, M. Maternal and early postnatal diet supplemented with conjugated linoleic acid isomers affect lipid profile in hearts of offspring rats with mammary tumors. Animals 2020, 10, 464. [Google Scholar] [CrossRef] [Green Version]
- Matsumoto, A.; Kawabata, T.; Kagawa, Y.; Shoji, K.; Kimura, F.; Miyazawa, T.; Tatsuta, N.; Arima, T.; Yaegashi, N.; Nakai, K. Associations of umbilical cord fatty acid profiles and desaturase enzyme indices with birth weight for gestational age in Japanese infants. Prostaglandins Leukot. Essent. Fat. Acids 2021, 165, 102233. [Google Scholar] [CrossRef]
- Min, Y.; Djahanbakhch, O.; Hutchinson, J.; Eram, S.; Bhullar, A.S.; Namugere, I.; Ghebremeskel, K. Efficacy of docosahexaenoic acid-enriched formula to enhance maternal and fetal blood docosahexaenoic acid levels: Randomized double-blinded placebo-controlled trial of pregnant women with gestational diabetes mellitus. Clin. Nutr. 2016, 35, 608–614. [Google Scholar] [CrossRef] [PubMed] [Green Version]
- Oaks, B.M.; Young, R.R.; Adu-Afarwuah, S.; Ashorn, U.; Jackson, K.H.; Lartey, A.; Maleta, K.; Okronipa, H.; Sadalaki, J.; Baldiviez, L.M.; et al. Effects of a lipid-based nutrient supplement during pregnancy and lactation on maternal plasma fatty acid status and lipid profile: Results of two randomized controlled trials. Prostaglandins Leukot. Essent. Fat. Acids 2017, 117, 28–35. [Google Scholar] [CrossRef] [PubMed] [Green Version]
- Kochan, Z.; Karbowska, J.; Babicz-Zielińska, E.; Zakład Biochemii, K.; Uniwersytet Medyczny, G. Trans-kwasy tłuszczowe w diecie-rola w rozwoju zespołu metabolicznego dietary trans-fatty acids and metabolic syndrome. Postep. Hig Med Dosw 2010, 64, 650–658. [Google Scholar]
- Broś-Konopielko, M.; Białek, A.; Oleszczuk-Modzelewska, L.; Zaleśkiewicz, B.; Różańska-Walędziak, A.; Teliga-Czajkowska, J.; Tokarz, A.; Czajkowski, K. Consumption of fish and seafood by pregnant polish women and the supply of docosahexaenoic acid and eicosapentaenoic acid from these products. Fam. Med. Prim. Care Rev. 2017, 19, 191–195. [Google Scholar] [CrossRef]
- FDA and EPA Issue Final Fish Consumption Advice. Available online: https://www.fda.gov/news-events/press-announcements/fda-and-epa-issue-final-fish-consumption-advice (accessed on 1 May 2021).
- Sygnowska, E.; Waśkiewicz, A.; Głuszek, J.; Kwaśniewska, M.; Biela, U.; Kozakiewicz, K.; Zdrojewski, T.; Rywik, S. Spożycie produktów spożywczych przez dorosłą populację Polski. Wyniki programu WOBASZ. Kardiol. Pol. 2005, 63, 1–7. [Google Scholar]
- Groth, E. Scientific foundations of fish-consumption advice for pregnant women: Epidemiological evidence, benefit-risk modeling, and an integrated approach. Environ. Res. 2017, 152, 386–406. [Google Scholar] [CrossRef]
- Hibbeln, C.J.R.; Spiller, P.; Brenna, J.T.; Golding, J.; Holub, B.J.; Harris, W.S.; Kris-Etherton, P.; Lands, B.; Connor, S.L.; Myers, G.; et al. Relationships between seafood consumption during pregnancy and childhood and neurocognitive development: Two systematic reviews. Prostaglandins Leukot. Essent. Fat. Acids 2019, 151, 14–36. [Google Scholar] [CrossRef] [PubMed] [Green Version]
- Carlson, S.E. Docosahexaenoic acid supplementation in pregnancy and lactation 1–4. Am. J. Clin. Nutr. 2009, 89, 678–684. [Google Scholar] [CrossRef] [PubMed] [Green Version]
- Jackson, K.H.; Polreis, J.M.; Tintle, N.L.; Kris-Etherton, P.M.; Harris, W.S. Association of reported fish intake and supplementation status with the omega-3 index. Prostaglandins Leukot. Essent. Fat. Acids 2019, 142, 4–10. [Google Scholar] [CrossRef] [Green Version]
- Kouba, J.M.; Burns, T.A.; Webel, S.K. Effect of dietary supplementation with long-chain n-3 fatty acids during late gestation and early lactation on mare and foal plasma fatty acid composition, milk fatty acid composition, and mare reproductive variables. Anim. Reprod. Sci. 2019, 203, 33–44. [Google Scholar] [CrossRef]
- Forbes, L.E.; Graham, J.E.; Berglund, C.; Bell, R.C. Dietary change during pregnancy and women’s reasons for change. Nutrients 2018, 10, 1032. [Google Scholar] [CrossRef] [PubMed] [Green Version]
- Godhamgaonkar, A.A.; Wadhwani, N.S.; Joshi, S.R. Exploring the role of LC-PUFA metabolism in pregnancy complications. Prostaglandins Leukot. Essent. Fat. Acids 2020, 163, 102203. [Google Scholar] [CrossRef] [PubMed]
- Rogers, L.K.; Valentine, C.J.; Keim, S.A. DHA supplementation: Current implications in pregnancy and childhood. Pharmacol. Res. 2013, 70, 13–19. [Google Scholar] [CrossRef] [PubMed] [Green Version]
- Schaeffer, L.; Gohlke, H.; Müller, M.; Heid, I.M.; Palmer, L.J.; Kompauer, I.; Demmelmair, H.; Illig, T.; Koletzko, B.; Heinrich, J. Common genetic variants of the FADS1 FADS2 gene cluster and their reconstructed haplotypes are associated with the fatty acid composition in phospholipids. Hum. Mol. Genet. 2006, 15, 1745–1756. [Google Scholar] [CrossRef]
- Baroni, N.F.; Baldoni, N.R.; Alves, G.C.S.; Crivellenti, L.C.; Braga, G.C.; Sartorelli, D.S. Do lifestyle interventions in pregnant women with overweight or obesity have an effect on neonatal adiposity? A systematic review with meta-analysis. Nutrients 2021, 13, 1903. [Google Scholar] [CrossRef]
- Lagiou, P.; Tamimi, R.M.; Mucci, L.A.; Adami, H.O.; Hsieh, C.C.; Trichopoulos, D. Diet during pregnancy in relation to maternal weight gain and birth size. Eur. J. Clin. Nutr. 2004, 58, 231–237. [Google Scholar] [CrossRef] [PubMed] [Green Version]
- Sampaio, S.L.; Barreira, J.C.M.; Fernandes, Â.; Petropoulos, S.A.; Alexopoulos, A.; Santos-Buelga, C.; Ferreira, I.C.F.R.; Barros, L. Potato biodiversity: A linear discriminant analysis on the nutritional and physicochemical composition of fifty genotypes. Food Chem. 2021, 345, 128853. [Google Scholar] [CrossRef]
- Walejko, J.M.; Kim, S.; Goel, R.; Handberg, E.M.; Richards, E.M.; Pepine, C.J.; Raizada, M.K. Gut microbiota and serum metabolite differences in African Americans and White Americans with high blood pressure. Int. J. Cardiol. 2018, 271, 336–339. [Google Scholar] [CrossRef]
- Murtaza, N.; Burke, L.M.; Vlahovich, N.; Charlesson, B.; O’neill, H.M.; Ross, M.L.; Campbell, K.L.; Krause, L.; Morrison, M. Analysis of the effects of dietary pattern on the oral microbiome of elite endurance athletes. Nutrients 2019, 11, 614. [Google Scholar] [CrossRef] [Green Version]
- Martínez Marín, A.L.; Peña Blanco, F.; Avilés Ramírez, C.; Pérez Alba, L.M.; Polvillo Polo, O. Selecting the best set of gas chromatography-derived fatty acids to discriminate between two finishing diets using linear discriminant analysis. Meat Sci. 2013, 95, 173–176. [Google Scholar] [CrossRef] [PubMed]
- Nezu, T.; Hosomi, N.; Yoshimura, K.; Kuzume, D.; Naito, H. Predictors of stroke outcome extracted from multivariate linear discriminant analysis or neural network analysis. J. Atheroscler. Thromb. 2020, 59642. [Google Scholar] [CrossRef]
- Wu, M.C.; Zhang, L.; Wang, Z.; Christiani, D.C.; Lin, X. Sparse linear discriminant analysis for simultaneous testing for the significance of a gene set/pathway and gene selection. Bioinformatics 2009, 25, 1145–1151. [Google Scholar] [CrossRef] [PubMed] [Green Version]
- Aydin, K.E.; Ozturk, S. Assessment of the diets and weights of primiparous and multiparous pregnant women in the last trimester. Int. J. Caring Sci. 2016, 9, 1033. [Google Scholar]
- Bastian, L.A.; Pathiraja, V.C.; Krause, K.; Brouwer, J.N.; Swamy, G.K.; Lovelady, C.A. Multiparity is associated with high motivation to change diet among overweight and obese postpartum women. Woman Health Issues 2011, 20, 133–138. [Google Scholar] [CrossRef] [Green Version]


| Sk1 | Sk2 | Sk3 | Sk4 | p Value | ||
|---|---|---|---|---|---|---|
| Cluster | Fatty Acid [%] | n = 71 | n = 40 | n = 11 | n = 39 | |
| Cl 1 | ||||||
| c9,c12 C18:2 | 18.0 ± 2.4 a | 21.4 ± 2.3 a,b,c | 17.3 ± 3.8 b | 18.6 ± 2.0 c | <0.0001 | |
| C20:2 | 0.16 ± 0.03 a | 0.19 ± 0.04 a,b | 0.17 ± 0.03 | 0.14 ± 0.06 b | <0.0001 * | |
| Cl 2 | ||||||
| C18:0 | 4.16 ± 0.48 a,b | 4.49 ± 0.36 a,c,d | 3.94 ± 0.8 c | 3.84 ± 0.49 b,d | <0.0001 | |
| c6,c9,c12 C18:3 | 0.18 ± 0.06 a,b | 0.15 ± 0.05 a,c | 0.42 ± 0.20 b,c,d | 0.15 ± 0.04 d | <0.0001 * | |
| c5,c8,c11,c14 C20:4 | 3.75 ± 0.66 a | 4.33 ± 0.87 a,b | 4.14 ± 1.04 | 3.81 ± 0.71 b | 0.0010 | |
| C22:0 | 0.10 ± 0.05 a | 0.09 ± 0.02 b,c | 0.09 ± 0.09 a,b | 0.08 ± 0.02 c | 0.0001 * | |
| C23:0 | 0.06 ± 0.02 a,b | 0.08 ± 0.05 a,c | 0.10 ± 0.10 d | 0.04 ± 0.02 b,c,d | <0.0001 * | |
| C24:0 | 0.12 ± 0.03 | 0.13 ± 0.06 | 0.13 ± 0.08 | 0.12 ± 0.04 | 0.5865 | |
| Cl 3 | ||||||
| C12:0 | 0.10 ± 0.05 a | 0.10 ± 0.04 | 0.07 ± 0.03 | 0.08 ± 0.02 a | 0.0245 * | |
| C14:0 | 1.10 ± 0.30 a,b | 0.83 ± 0.22 a | 0.88 ± 0.26 | 0.84 ± 0.22 b | <0.0001 | |
| C14:1 | 0.05 ± 0.01 a,b,c | 0.03 ± 0.01 a | 0.03 ± 0.01 b | 0.04 ± 0.02 c | <0.0001 * | |
| C16:0 | 23.7 ± 1.9 a | 21.9 ± 1.3 a,b | 21.8 ± 1.5 | 23.2 ± 2.3 b | <0.0001 | |
| C16:1 | 2.49 ± 0.78 a | 1.66 ± 0.39 a,b | 2.11 ± 0.89 | 2.20 ± 0.58 b | <0.0001 * | |
| C17:1 | 0.18 ± 0.05 a,b | 0.14 ± 0.03 a | 0.16 ± 0.03 | 0.15 ± 0.03 b | <0.0001 | |
| t9,t12 C18:2 | 0.08 ± 0.03 a,b | 0.07 ± 0.02 a | 0.07 ± 0.02 | 0.06 ± 0.02 b | <0.0001 | |
| Cl 4 | ||||||
| c9 C18:1 | 20.2 ± 2.6 a | 19.1 ± 2.0 b,c | 21.7 ± 2.8 b | 21.9 ± 2.0 a,c | <0.0001 | |
| c9,c12,c15 C18:3 | 0.59 ± 0.17 a | 0.57 ± 0.19 b | 0.92 ± 0.26 a,b,c | 0.56 ± 0.13 c | 0.0002 * | |
| C20:0 | 0.03 ± 0.03 a | 0.02 ± 0.01 b | 0.12 ± 0.11 a,b,c | 0.04 ± 0.05 c | <0.0001 * | |
| C20:1 | 0.02 ± 0.01 a,b | 0.02 ± 0.01 c | 0.06 ± 0.02 a,c,d | 0.02 ± 0.01 b,d | <0.0001 * | |
| C22:1 | 0.02 ± 0.01 a | 0.02 ± 0.01 b | 0.02 ± 0.00 | 0.03 ± 0.03 a,b | 0.0055 * | |
| Cl 5 | ||||||
| C15:0 | 0.24 ± 0.05 a,b | 0.21 ± 0.06 a | 0.21 ± 0.06 | 0.18 ± 0.04 b | <0.0001 | |
| C17:0 | 0.21 ± 0.04 a | 0.21 ± 0.04 b | 0.21 ± 0.04 c | 0.18 ± 0.03 a,b,c | 0.0002 | |
| C20:5 | 0.30 ± 0.16 a | 0.43 ± 0.46 b | 0.24 ± 0.10 | 0.21 ± 0.08 a,b | 0.0011 * | |
| C22:6 | 1.77 ± 0.35 a | 1.86 ± 0.54 b | 1.80 ± 0.41 | 1.48 ± 0.25 a,b | 0.0002 * | |
| SFA | 29.8 ± 2.2 a | 28.1 ± 1.6 a | 27.5 ± 2.2 | 28.6 ± 2.5 | 0.0001 | |
| MUFA | 23.0 ± 2.6 a | 20.9 ± 1.9 a,b,c | 24.0 ± 2.7 b | 24.4 ± 2.3 b | <0.0001 | |
| PUFA | 24.8 ± 2.6 a | 28.8 ± 1.9 a,b,c | 25.1 ± 3.4 b | 25.0 ± 1.0 c | <0.0001 * | |
| n3 PUFA | 0.89 ± 0.25 | 1.00 ± 0.51 | 1.16 ± 0.32 a | 0.77 ± 0.15 a | 0.0015 * | |
| n6 PUFA | 22.1 ± 2.5 a | 26.0 ± 2.0 a,b,c | 22.1 ± 3.2 b | 22.7 ± 1.9 c | <0.0001 | |
| n3 PUFA/n6 PUFA | 0.04 ± 0.01 a | 0.04 ± 0.02 b | 0.05 ± 0.01 b,c | 0.03 ± 0.01 a,c | 0.0001 * |
| Actual Group | Correct Classification (%) | Predicted Group Membership | |||
|---|---|---|---|---|---|
| Sk1 | Sk2 | Sk3 | Sk4 | ||
| Sk1 | 87.3 | 62 | 6 | 0 | 3 |
| Sk2 | 92.5 | 3 | 37 | 0 | 0 |
| Sk3 | 100 | 0 | 0 | 11 | 0 |
| Sk4 | 84.6 | 5 | 1 | 0 | 33 |
| Actual Group | Correct Classification (%) | Predicted Group Membership | |||
|---|---|---|---|---|---|
| Sk1 | Sk2 | Sk3 | Sk4 | ||
| Sk1 | 80.0 | 48 | 5 | 2 | 5 |
| Sk2 | 59.4 | 10 | 19 | 1 | 2 |
| Sk3 | 87.5 | 0 | 0 | 7 | 1 |
| Sk4 | 64.5 | 6 | 3 | 2 | 20 |
| Sk1 | Sk2 | Sk3 | Sk4 | ||||||
|---|---|---|---|---|---|---|---|---|---|
| n | % | n | % | n | % | n | % | ||
| diseases before pregnancy | no | 57 | 80.3 | 29 | 72.5 | 9 | 81.8 | 29 | 74.4 |
| yes | 14 | 19.7 | 11 | 27.5 | 2 | 18.2 | 10 | 25.6 | |
| no data | 0 | 0.0 | 0 | 0.0 | 0 | 0.0 | 0 | 0.0 | |
| diseases in pregnancy | |||||||||
| no | 52 | 73.2 | 26 | 65.0 | 4 | 36.4 | 21 | 53.8 | |
| yes | 19 | 26.8 | 14 | 35.0 | 7 | 63.6 | 18 | 46.2 | |
| no data | 0 | 0.0 | 0 | 0.0 | 0 | 0.0 | 0 | 0.0 | |
| education | |||||||||
| higher | 58 | 81.7 | 35 | 87.5 | 9 | 81.8 | 20 | 51.3 | |
| secondary | 8 | 11.3 | 3 | 7.5 | 2 | 18.2 | 14 | 35.9 | |
| elementary | 2 | 2.8 | 0 | 0.0 | 0 | 0.0 | 0 | 0.0 | |
| vocational | 0 | 0.0 | 2 | 5.0 | 0 | 0.0 | 3 | 7.7 | |
| no data | 3 | 4.2 | 0 | 0.0 | 0 | 0.0 | 2 | 5.1 | |
| BMI before pregnancy classification | |||||||||
| starvation | 0 | 0.0 | 0 | 0.0 | 0 | 0.0 | 0 | 0.0 | |
| emaciation | 3 | 4.2 | 1 | 2.5 | 0 | 0.0 | 1 | 2.6 | |
| underweight | 2 | 2.8 | 2 | 5.0 | 1 | 9.1 | 2 | 5.1 | |
| healthy range | 48 | 67.6 | 28 | 70.0 | 6 | 54.5 | 21 | 53.8 | |
| overweight | 13 | 18.3 | 6 | 15.0 | 3 | 27.3 | 9 | 23.1 | |
| 1st degree obesity | 2 | 2.8 | 3 | 7.5 | 1 | 9.1 | 4 | 10.3 | |
| 2nd degree obesity | 0 | 0.0 | 0 | 0.0 | 0 | 0.0 | 0 | 0.0 | |
| 3rd degree obesity | 0 | 0.0 | 0 | 0.0 | 0 | 0.0 | 0 | 0.0 | |
| no data | 3 | 4.2 | 0 | 0.0 | 0 | 0.0 | 2 | 5.1 | |
| sequence number of pregnancy | |||||||||
| 1st | 34 | 47.9 | 11 | 27.5 | 3 | 27.3 | 13 | 33.3 | |
| 2nd | 18 | 25.4 | 15 | 37.5 | 6 | 54.5 | 12 | 30.8 | |
| 3rd | 12 | 16.9 | 9 | 22.5 | 2 | 18.2 | 9 | 23.1 | |
| 4th | 5 | 7.0 | 5 | 12.5 | 0 | 0.0 | 4 | 10.3 | |
| 5th | 1 | 1.4 | 0 | 0.0 | 0 | 0.0 | 1 | 2.6 | |
| 6th | 1 | 1.4 | 0 | 0.0 | 0 | 0.0 | 0 | 0.0 | |
| no data | 0 | 0.0 | 0 | 0.0 | 0 | 0.0 | 0 | 0.0 | |
| number of previous deliveries | |||||||||
| 0 | 36 | 50.7 | 14 | 35.0 | 4 | 36.4 | 15 | 38.5 | |
| 1 | 24 | 33.8 | 20 | 50.0 | 5 | 45.5 | 12 | 30.8 | |
| 2 | 10 | 14.1 | 3 | 7.5 | 2 | 18.2 | 9 | 23.1 | |
| 3 | 1 | 1.4 | 3 | 7.5 | 0 | 0.0 | 2 | 5.1 | |
| 4 | 0 | 0.0 | 0 | 0.0 | 0 | 0.0 | 1 | 2.6 | |
| 5 | 0 | 0.0 | 0 | 0.0 | 0 | 0.0 | 0 | 0.0 | |
| no data | 0 | 0.0 | 0 | 0.0 | 0 | 0.0 | 0 | 0.0 | |
| number of miscarriages | |||||||||
| 0 | 57 | 80.3 | 29 | 72.5 | 10 | 90.9 | 33 | 84.6 | |
| 1 | 10 | 14.1 | 9 | 22.5 | 1 | 9.1 | 5 | 12.8 | |
| 2 | 3 | 4.2 | 1 | 2.5 | 0 | 0.0 | 1 | 2.6 | |
| 3 | 1 | 1.4 | 1 | 2.5 | 0 | 0.0 | 0 | 0.0 | |
| no data | 0 | 0.0 | 0 | 0.0 | 0 | 0.0 | 0 | 0.0 | |
| tobacco smoking during pregnancy | |||||||||
| no | 68 | 95.8 | 40 | 100.0 | 11 | 100.0 | 37 | 94.9 | |
| yes | 1 | 1.4 | 0 | 0.0 | 0 | 0.0 | 0 | 0.0 | |
| no data | 2 | 2.8 | 0 | 0.0 | 0 | 0.0 | 2 | 5.1 | |
| alcohol drinking during pregnancy | |||||||||
| no | 68 | 95.8 | 40 | 0.0 | 11 | 100.0 | 37 | 94.9 | |
| yes | 0 | 0.0 | 0 | 0.0 | 0 | 0.0 | 0 | 0.0 | |
| no data | 3 | 4.2 | 0 | 0.0 | 0 | 0.0 | 2 | 5.1 | |
| delivery | |||||||||
| <37th week | 1 | 1.4 | 1 | 2.5 | 0 | 0.0 | 3 | 7.7 | |
| ≥37th week | 70 | 98.6 | 39 | 97.5 | 11 | 100.0 | 36 | 92.3 | |
| no data | 0 | 0.0 | 0 | 0.0 | 0 | 0.0 | 0 | 0.0 | |
| mode of delivery | |||||||||
| cesarean section | 17 | 23.9 | 5 | 12.5 | 6 | 54.5 | 17 | 43.6 | |
| spontaneous vaginal delivery | 54 | 76.1 | 34 | 85.0 | 4 | 36.4 | 22 | 56.4 | |
| vacuum-assisted vaginal delivery | 0 | 0.0 | 1 | 2.5 | 1 | 9.1 | 0 | 0.0 | |
| no data | 0 | 0.0 | 0 | 0.0 | 0 | 0.0 | 0 | 0.0 | |
| gender of child | |||||||||
| female | 46 | 64.8 | 20 | 50.0 | 5 | 45.5 | 16 | 41.0 | |
| male | 25 | 35.2 | 20 | 50.0 | 6 | 54.5 | 23 | 59.0 | |
| no data | 0 | 0.0 | 0 | 0.0 | 0 | 0.0 | 0 | 0.0 | |
| Apgar scoring | |||||||||
| good (8–10) | 71 | 100.0 | 40 | 100.0 | 11 | 100.0 | 39 | 100.0 | |
| average (4–7) | 0 | 0.0 | 0 | 0.0 | 0 | 0.0 | 0 | 0.0 | |
| severe (0–3) | 0 | 0.0 | 0 | 0.0 | 0 | 0.0 | 0 | 0.0 | |
| Occurrence of developmental disorders | |||||||||
| no | 60 | 84.5 | 33 | 82.5 | 5 | 45.5 | 32 | 82.1 | |
| yes | 11 | 15.5 | 7 | 17.5 | 6 | 54.5 | 7 | 17.9 | |
| no data | 0 | 0.0 | 0 | 0.0 | 0 | 0.0 | 0 | 0.0 | |
Publisher’s Note: MDPI stays neutral with regard to jurisdictional claims in published maps and institutional affiliations. |
© 2021 by the authors. Licensee MDPI, Basel, Switzerland. This article is an open access article distributed under the terms and conditions of the Creative Commons Attribution (CC BY) license (https://creativecommons.org/licenses/by/4.0/).
Share and Cite
Broś-Konopielko, M.; Białek, A.; Oleszczuk-Modzelewska, L.; Zaleśkiewicz, B.; Różańska-Walędziak, A.; Czajkowski, K. Nutritional, Anthropometric and Sociodemographic Factors Affecting Fatty Acids Profile of Pregnant Women’s Serum at Labour—Chemometric Studies. Nutrients 2021, 13, 2948. https://0-doi-org.brum.beds.ac.uk/10.3390/nu13092948
Broś-Konopielko M, Białek A, Oleszczuk-Modzelewska L, Zaleśkiewicz B, Różańska-Walędziak A, Czajkowski K. Nutritional, Anthropometric and Sociodemographic Factors Affecting Fatty Acids Profile of Pregnant Women’s Serum at Labour—Chemometric Studies. Nutrients. 2021; 13(9):2948. https://0-doi-org.brum.beds.ac.uk/10.3390/nu13092948
Chicago/Turabian StyleBroś-Konopielko, Magdalena, Agnieszka Białek, Luiza Oleszczuk-Modzelewska, Barbara Zaleśkiewicz, Anna Różańska-Walędziak, and Krzysztof Czajkowski. 2021. "Nutritional, Anthropometric and Sociodemographic Factors Affecting Fatty Acids Profile of Pregnant Women’s Serum at Labour—Chemometric Studies" Nutrients 13, no. 9: 2948. https://0-doi-org.brum.beds.ac.uk/10.3390/nu13092948