
Nutritional Intake and Training Load of Professional Female Football Players during a Mid-Season Microcycle

 ,
,  ,
,  and
and 
Abstract
:1. Introduction
2. Material and Methods
2.1. Subjects
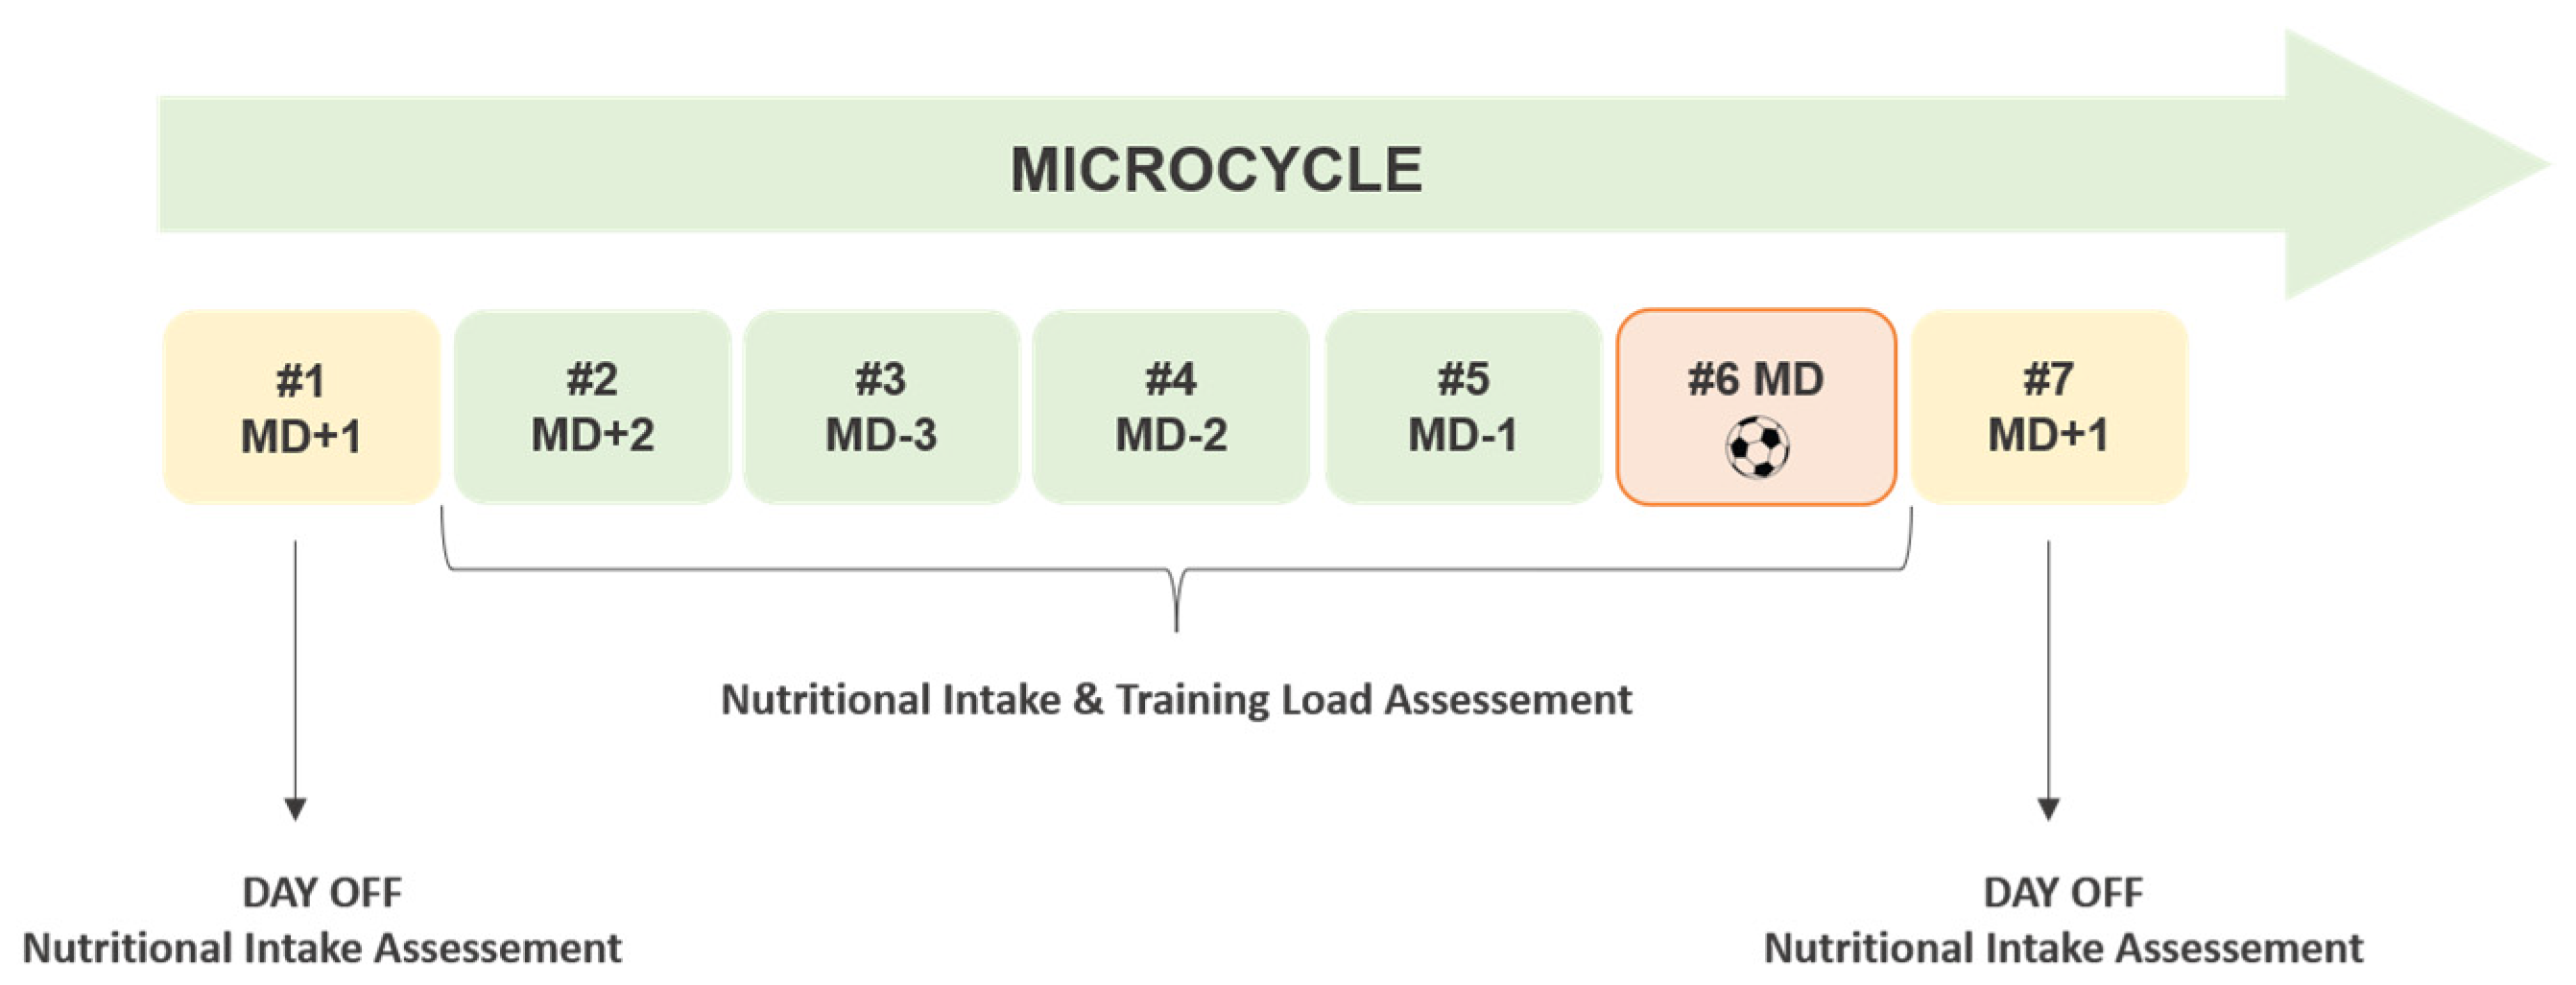
2.2. Study Design
2.3. Microcycle Contextualization
2.4. Anthropometric Measures
2.5. Nutritional Intake
2.6. Training and Match Load
2.7. Internal Training and Match Load
2.8. Statistical Analysis
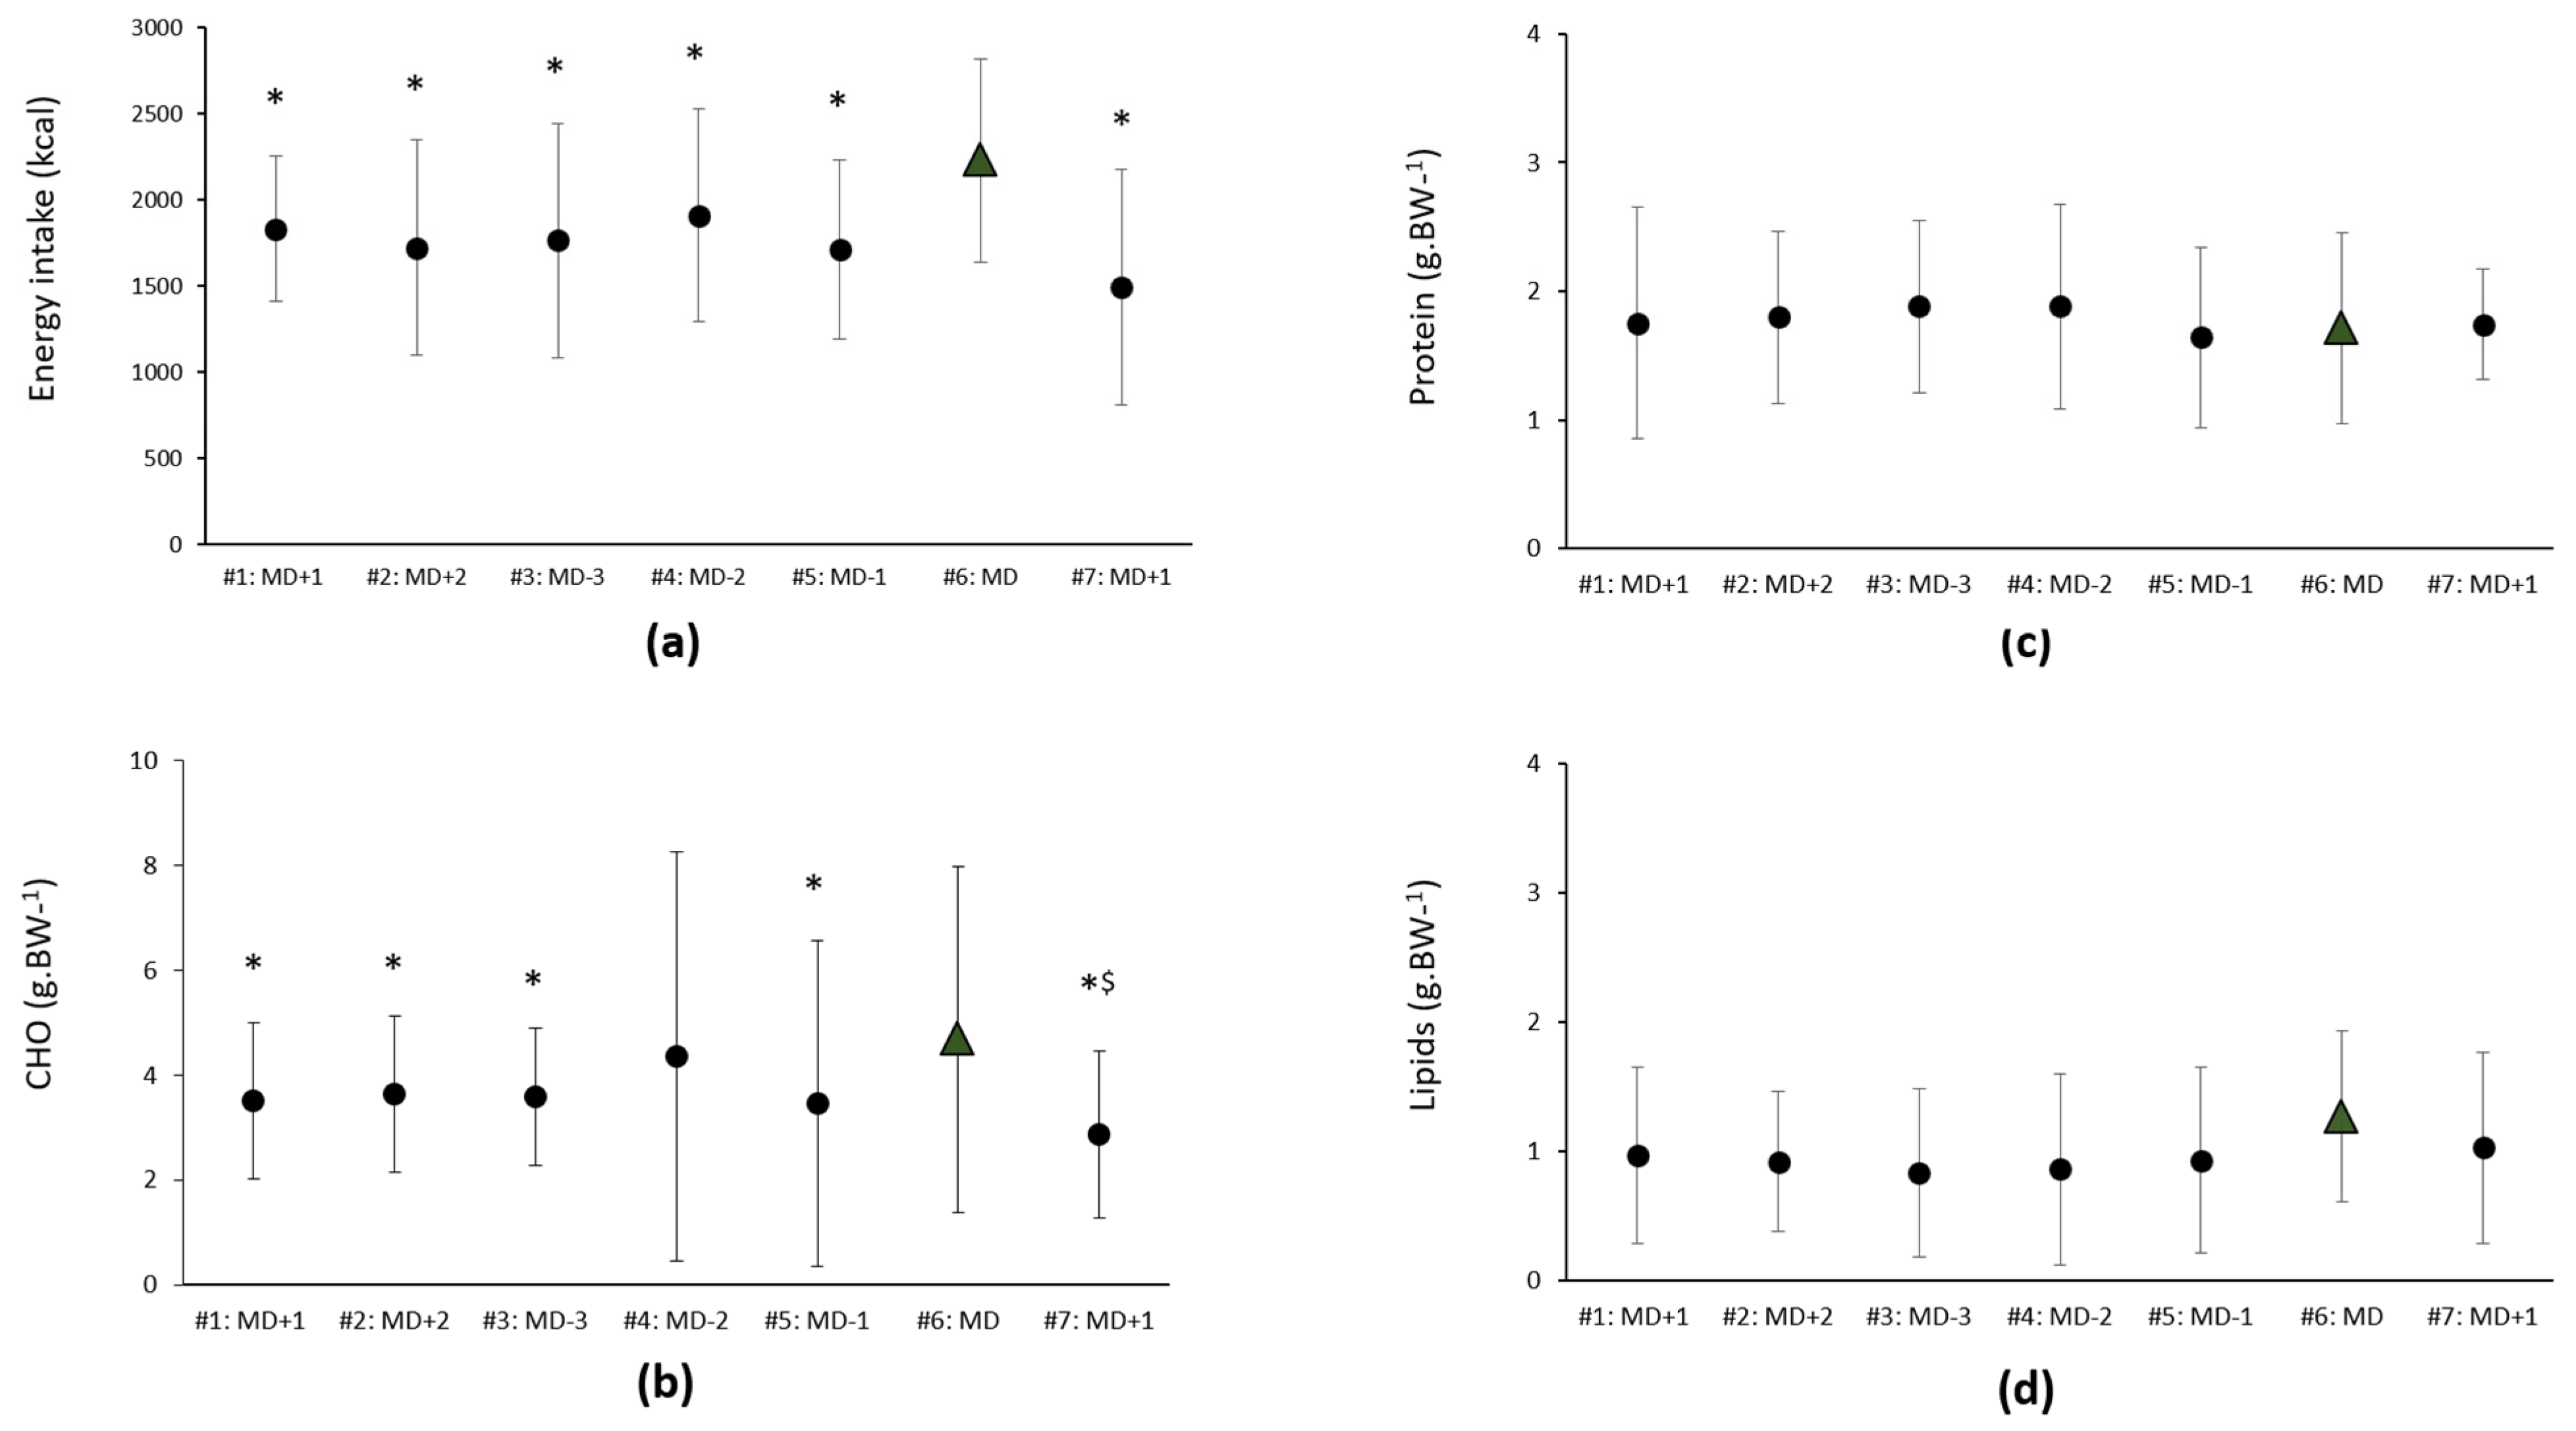
3. Results
4. Discussion
5. Conclusions
Author Contributions
Funding
Institutional Review Board Statement
Informed Consent Statement
Data Availability Statement
Conflicts of Interest
References
- Milanović, Z.; Sporiš, G.; James, N.; Trajković, N.; Ignjatović, A.; Sarmento, H.; Trecroci, A.; Mendes, B.M.B. Physiological Demands, Morphological Characteristics, Physical Abilities and Injuries of Female Soccer Players. J. Hum. Kinet. 2017, 60, 77–83. [Google Scholar] [CrossRef] [PubMed] [Green Version]
- Guitart, M.; Casals, M.; Casamichana, D.; Cortés, J.; Valle, F.X.; McCall, A.; Cos, F.; Rodas, G. Use of GPS to measure external load and estimate the incidence of muscle injuries in men’s football: A novel descriptive study. PLoS ONE 2022, 17, e0263494. [Google Scholar] [CrossRef]
- Ravé, G.; Granacher, U.; Boullosa, D.; Hackney, A.C.; Zouhal, H. How to Use Global Positioning Systems (GPS) Data to Monitor Training Load in the “Real World” of Elite Soccer. Front. Physiol. 2020, 11, 944. [Google Scholar] [CrossRef]
- Martín-García, A.; Gómez Díaz, A.; Bradley, P.S.; Morera, F.; Casamichana, D. Quantification of a Professional Football Team’s External Load Using a Microcycle Structure. J. Strength Cond. Res. 2018, 32, 3511–3518. [Google Scholar] [CrossRef] [PubMed] [Green Version]
- Oliva-Lozano, J.M.; Fortes, V.; Krustrup, P.; Muyor, J.M. Acceleration and sprint profiles of professional male football players in relation to playing position. PLoS ONE 2020, 15, e0236959. [Google Scholar] [CrossRef] [PubMed]
- Del Coso, J.; Brito de Souza, D.; Moreno-Perez, V.; Buldú, J.M.; Nevado, F.; Resta, R.; López-Del Campo, R. Influence of Players’ Maximum Running Speed on the Team’s Ranking Position at the End of the Spanish LaLiga. Int. J. Environ. Res. Public Health 2020, 17, 8815. [Google Scholar] [CrossRef] [PubMed]
- Rocha-Rodrigues, S.; Sousa, M.; Lourenço Reis, P.; Leão, C.; Cardoso-Marinho, B.; Massada, M.; Afonso, J. Bidirectional Interactions between the Menstrual Cycle, Exercise Training, and Macronutrient Intake in Women: A Review. Nutrients 2021, 13, 438. [Google Scholar] [CrossRef]
- Holtzman, B.; Ackerman, K.E. Recommendations and Nutritional Considerations for Female Athletes: Health and Performance. Sports Med. 2021, 51, 43–57. [Google Scholar] [CrossRef]
- Krustrup, P.; Mohr, M.; Ellingsgaard, H.; Bangsbo, J. Physical demands during an elite female soccer game: Importance of training status. Med. Sci. Sports Exerc. 2005, 37, 1242–1248. [Google Scholar] [CrossRef]
- Andersson, H.A.; Randers, M.B.; Heiner-Møller, A.; Krustrup, P.; Mohr, M. Elite female soccer players perform more high-intensity running when playing in international games compared with domestic league games. J. Strength Cond. Res. 2010, 24, 912–919. [Google Scholar] [CrossRef]
- Mohr, M.; Krustrup, P.; Andersson, H.; Kirkendal, D.; Bangsbo, J. Match activities of elite women soccer players at different performance levels. J. Strength Cond. Res. 2008, 22, 341–349. [Google Scholar] [CrossRef] [PubMed]
- Routledge, H.E.; Graham, S.; Di Michele, R.; Burgess, D.; Erskine, R.M.; Close, G.L.; Morton, J.P. Training Load and Carbohydrate Periodization Practices of Elite Male Australian Football Players: Evidence of Fueling for the Work Required. Int. J. Sport Nutr. Exerc. Metab. 2020, 30, 280–286. [Google Scholar] [CrossRef] [PubMed]
- Mullinix, M.C.; Jonnalagadda, S.S.; Rosenbloom, C.A.; Thompson, W.R.; Kicklighter, J.R. Dietary intake of female U.S. soccer players. Nutr. Res. 2003, 23, 585–593. [Google Scholar] [CrossRef]
- Steffl, M.; Kinkorova, I.; Kokstejn, J.; Petr, M. Macronutrient Intake in Soccer Players-A Meta-Analysis. Nutrients 2019, 11, 1305. [Google Scholar] [CrossRef] [Green Version]
- Thomas, D.T.; Erdman, K.A.; Burke, L.M. American College of Sports Medicine Joint Position Statement. Nutrition and Athletic Performance. Med. Sci. Sports Exerc. 2016, 48, 543–568. [Google Scholar] [CrossRef]
- Field, A.; Naughton, R.J.; Haines, M.; Lui, S.; Corr, L.D.; Russell, M.; Page, R.M.; Harper, L.D. The demands of the extra-time period of soccer: A systematic review. J. Sport Health Sci. 2020, 25, 1040–1045. [Google Scholar] [CrossRef]
- Devlin, B.L.; Leveritt, M.D.; Kingsley, M.; Belski, R. Dietary Intake, Body Composition, and Nutrition Knowledge of Australian Football and Soccer Players: Implications for Sports Nutrition Professionals in Practice. Int. J. Sport Nutr. Exerc. Metab. 2017, 27, 130–138. [Google Scholar] [CrossRef]
- Williams, C.; Rollo, I. Carbohydrate Nutrition and Team Sport Performance. Sports Med. 2015, 45 (Suppl. S1), S13–S22. [Google Scholar] [CrossRef] [Green Version]
- Hulton, A.T.; Gregson, W.; Maclaren, D.; Doran, D.A. Effects of GI meals on intermittent exercise. Int. J. Sports Med. 2012, 33, 756–762. [Google Scholar] [CrossRef]
- Dobrowolski, H.; Włodarek, D. Dietary Intake of Polish Female Soccer Players. Int. J. Environ. Res. Public Health 2019, 16, 1134. [Google Scholar] [CrossRef] [Green Version]
- Dobrowolski, H.; Karczemna, A.; Włodarek, D. Nutrition for Female Soccer Players-Recommendations. Medicina 2020, 56, 28. [Google Scholar] [CrossRef] [PubMed] [Green Version]
- Renard, M.; Kelly, D.T.; Chéilleachair, N.N.; Catháin, C. How Does the Dietary Intake of Female Field-Based Team Sport Athletes Compare to Dietary Recommendations for Health and Performance? A Systematic Literature Review. Nutrients 2021, 13, 1235. [Google Scholar] [CrossRef] [PubMed]
- Oliveira, R.; Brito, J.P.; Martins, A.; Mendes, B.; Marinho, D.A.; Ferraz, R.; Marques, M.C. In-season internal and external training load quantification of an elite European soccer team. PLoS ONE 2019, 14, e0209393. [Google Scholar] [CrossRef] [PubMed] [Green Version]
- Winter, E.M.; Maughan, R.J. Requirements for ethics approvals. J. Sports Sci. 2009, 27, 985. [Google Scholar] [CrossRef] [PubMed]
- Lee, R.C.; Wang, Z.; Heo, M.; Ross, R.; Janssen, I.; Heymsfield, S.B. Total-body skeletal muscle mass: Development and cross-validation of anthropometric prediction models. Am. J. Clin. Nutr. 2000, 72, 796–803. [Google Scholar] [CrossRef] [PubMed]
- Evans, E.M.; Rowe, D.A.; Misic, M.M.; Prior, B.M.; Arngrímsson, S.A. Skinfold prediction equation for athletes developed using a four-component model. Med. Sci. Sports Exerc. 2005, 37, 2006–2011. [Google Scholar] [CrossRef] [PubMed]
- Magkos, F.; Yannakoulia, M. Methodology of dietary assessment in athletes: Concepts and pitfalls. Curr. Opin. Clin. Nutr. Metab. Care 2003, 6, 539–549. [Google Scholar] [CrossRef]
- Cade, J.E. Measuring diet in the 21st century: Use of new technologies. Proc. Nutr. Soc. 2017, 76, 276–282. [Google Scholar] [CrossRef]
- Høidrup, S.; Andreasen, A.H.; Osler, M.; Pedersen, A.N.; Jørgensen, L.M.; Jørgensen, T.; Schroll, M.; Heitmann, B.L. Assessment of habitual energy and macronutrient intake in adults: Comparison of a seven day food record with a dietary history interview. Eur. J. Clin. Nutr. 2002, 56, 105–113. [Google Scholar] [CrossRef] [Green Version]
- Buchheit, M.; Al Haddad, H.; Simpson, B.M.; Palazzi, D.; Bourdon, P.C.; Di Salvo, V.; Mendez-Villanueva, A. Monitoring accelerations with GPS in football: Time to slow down? Int. J. Sports Physiol. Perform. 2014, 9, 442–445. [Google Scholar] [CrossRef]
- Bradley, P.S.; Vescovi, J.D. Velocity thresholds for women’s soccer matches: Sex specificity dictates high-speed running and sprinting thresholds—Female Athletes in Motion (FAiM). Int. J. Sports Physiol. Perform. 2015, 10, 112–116. [Google Scholar] [CrossRef] [PubMed]
- Taberner, M.; van Dyk, N.; Allen, T.; Jain, N.; Richter, C.; Drust, B.; Betancur, E.; Cohen, D.D. Physical preparation and return to performance of an elite female football player following ACL reconstruction: A journey to the FIFA Women’s World Cup. BMJ Open Sport Exerc. Med. 2020, 6, e000843. [Google Scholar] [CrossRef] [PubMed]
- Foster, C.; Florhaug, J.A.; Franklin, J.; Gottschall, L.; Hrovatin, L.A.; Parker, S.; Doleshal, P.; Dodge, C. A new approach to monitoring exercise training. J. Strength Cond. Res. 2001, 15, 109–115. [Google Scholar] [PubMed]
- Alexiou, H.; Coutts, A.J. A comparison of methods used for quantifying internal training load in women soccer players. Int. J. Sports Physiol. Perform. 2008, 3, 320–330. [Google Scholar] [CrossRef] [Green Version]
- Askow, A.T.; Lobato, A.L.; Arndts, D.J.; Jennings, W.; Kreutzer, A.; Erickson, J.L.; Esposito, P.E.; Oliver, J.M.; Foster, C.; Jagim, A.R. Session Rating of Perceived Exertion (sRPE) Load and Training Impulse Are Strongly Correlated to GPS-Derived Measures of External Load in NCAA Division I Women’s Soccer Athletes. J. Funct. Morphol. Kinesiol. 2021, 6, 90. [Google Scholar] [CrossRef] [PubMed]
- Kraft, J.A.; Green, J.M.; Thompson, K.R. Session ratings of perceived exertion responses during resistance training bouts equated for total work but differing in work rate. J. Strength Cond. Res. 2014, 28, 540–545. [Google Scholar] [CrossRef]
- Batterham, A.M.; Hopkins, W.G. Making meaningful inferences about magnitudes. Int. J. Sports Physiol. Perform. 2006, 1, 50–57. [Google Scholar] [CrossRef] [PubMed]
- Schober, P.; Boer, C.; Schwarte, L.A. Correlation Coefficients: Appropriate Use and Interpretation. Anesth. Analg. 2018, 126, 1763–1768. [Google Scholar] [CrossRef] [PubMed]
- Randell, R.K.; Clifford, T.; Drust, B.; Moss, S.L.; Unnithan, V.B.; De Ste Croix, M.B.A.; Datson, N.; Martin, D.; Mayho, H.; Carter, J.M.; et al. Physiological Characteristics of Female Soccer Players and Health and Performance Considerations: A Narrative Review. Sports Med. 2021, 51, 1377–1399. [Google Scholar] [CrossRef]
- Martin, L.; Lambeth, A.; Scott, D. Nutritional practices of national female soccer players: Analysis and recommendations. J. Sports Sci. Med. 2006, 5, 130–137. [Google Scholar]
- Wardenaar, F.; Brinkmans, N.; Ceelen, I.; Van Rooij, B.; Mensink, M.; Witkamp, R.; De Vries, J. Micronutrient Intakes in 553 Dutch Elite and Sub-Elite Athletes: Prevalence of Low and High Intakes in Users and Non-Users of Nutritional Supplements. Nutrients 2017, 9, 142. [Google Scholar] [CrossRef] [PubMed] [Green Version]
- Moss, S.L.; Randell, R.K.; Burgess, D.; Ridley, S.; ÓCairealláin, C.; Allison, R.; Rollo, I. Assessment of energy availability and associated risk factors in professional female soccer players. Eur. J. Sport Sci. 2021, 21, 861–870. [Google Scholar] [CrossRef] [PubMed]
- Reed, J.L.; De Souza, M.J.; Kindler, J.M.; Williams, N.I. Nutritional practices associated with low energy availability in Division I female soccer players. J. Sports Sci. 2014, 32, 1499–1509. [Google Scholar] [CrossRef] [PubMed]
- Kojima, C.; Kasai, N.; Ishibashi, A.; Murakami, Y.; Ebi, K.; Goto, K. Appetite Regulations after Sprint Exercise under Hypoxic Condition in Female Athletes. J. Strength Cond. Res. 2019, 33, 1773–1780. [Google Scholar] [CrossRef]
- Martins, C.; Kulseng, B.; King, N.A.; Holst, J.J.; Blundell, J.E. The effects of exercise-induced weight loss on appetite-related peptides and motivation to eat. J. Clin. Endocrinol. Metab. 2010, 95, 1609–1616. [Google Scholar] [CrossRef] [Green Version]
- Martins, C.; Morgan, L.M.; Bloom, S.R.; Robertson, M.D. Effects of exercise on gut peptides, energy intake and appetite. J. Endocrinol. 2007, 193, 251–258. [Google Scholar] [CrossRef]
- Hidalgo y Teran Elizondo, R.; Martín Bermudo, F.M.; Peñaloza Mendez, R.; Berná Amorós, G.; Lara Padilla, E.; Berral de la Rosa, F.J. Nutritional Intake and Nutritional Status in Elite Mexican Teenagers Soccer Players of Different Ages. Nutr. Hosp. 2015, 32, 1735–1743. [Google Scholar] [CrossRef]
- Gravina, L.; Ruiz, F.; Diaz, E.; Lekue, J.A.; Badiola, A.; Irazusta, J.; Gil, S.M. Influence of nutrient intake on antioxidant capacity, muscle damage and white blood cell count in female soccer players. J. Int. Soc. Sports Nutr. 2012, 9, 32. [Google Scholar] [CrossRef] [Green Version]
- Meksawan, K.; Venkatraman, J.T.; Awad, A.B.; Pendergast, D.R. Effect of dietary fat intake and exercise on inflammatory mediators of the immune system in sedentary men and women. J. Am. Coll. Nutr. 2004, 23, 331–340. [Google Scholar] [CrossRef]
- Alves, J.; Toro, V.; Barrientos, G.; Bartolomé, I.; Muñoz, D.; Maynar, M. Hormonal Changes in High-Level Aerobic Male Athletes during a Sports Season. Int. J. Environ. Res. Public Health 2020, 17, 5833. [Google Scholar] [CrossRef]
- Melin, A.K.; Heikura, I.A.; Tenforde, A.; Mountjoy, M. Energy Availability in Athletics: Health, Performance, and Physique. Int. J. Sport Nutr. Exerc. Metab. 2019, 29, 152–164. [Google Scholar] [CrossRef] [PubMed]
- Osgnach, C.; Poser, S.; Bernardini, R.; Rinaldo, R.; di Prampero, P.E. Energy cost and metabolic power in elite soccer: A new match analysis approach. Med. Sci. Sports Exerc. 2010, 42, 170–178. [Google Scholar] [CrossRef] [PubMed]
- Tierney, P.J.; Young, A.; Clarke, N.D.; Duncan, M.J. Match play demands of 11 versus 11 professional football using Global Positioning System tracking: Variations across common playing formations. Hum. Mov. Sci. 2016, 49, 1–8. [Google Scholar] [CrossRef] [PubMed]
- Diaz-Seradilla, E.; Rodríguez-Fernández, A.; Rodríguez-Marroyo, J.A.; Castillo, D.; Raya-González, J.; Villa Vicente, J.G. Inter- and intra-microcycle external load analysis in female professional soccer players: A playing position approach. PLoS ONE 2022, 17, e0264908. [Google Scholar] [CrossRef] [PubMed]
- Bingham, S.A.; Bingham, S.A.; Bingham, A.M.; Bingham, A.M. The Dietary Assessment of Individual: Methods, Accuracy, New Techniques and Recommendations. Nutr. Abstr. Rev. 1987, 57, 705–742. [Google Scholar]


Publisher’s Note: MDPI stays neutral with regard to jurisdictional claims in published maps and institutional affiliations. |
© 2022 by the authors. Licensee MDPI, Basel, Switzerland. This article is an open access article distributed under the terms and conditions of the Creative Commons Attribution (CC BY) license (https://creativecommons.org/licenses/by/4.0/).
Share and Cite
Leão, C.; Mendes, A.P.; Custódio, C.; Ng, M.; Ribeiro, N.; Loureiro, N.; Araújo, J.P.; Afonso, J.; Rocha-Rodrigues, S.; Tavares, F. Nutritional Intake and Training Load of Professional Female Football Players during a Mid-Season Microcycle. Nutrients 2022, 14, 2149. https://0-doi-org.brum.beds.ac.uk/10.3390/nu14102149
Leão C, Mendes AP, Custódio C, Ng M, Ribeiro N, Loureiro N, Araújo JP, Afonso J, Rocha-Rodrigues S, Tavares F. Nutritional Intake and Training Load of Professional Female Football Players during a Mid-Season Microcycle. Nutrients. 2022; 14(10):2149. https://0-doi-org.brum.beds.ac.uk/10.3390/nu14102149
Chicago/Turabian StyleLeão, César, António Pedro Mendes, Catarina Custódio, Mafalda Ng, Nuno Ribeiro, Nuno Loureiro, João Pedro Araújo, José Afonso, Sílvia Rocha-Rodrigues, and Francisco Tavares. 2022. "Nutritional Intake and Training Load of Professional Female Football Players during a Mid-Season Microcycle" Nutrients 14, no. 10: 2149. https://0-doi-org.brum.beds.ac.uk/10.3390/nu14102149