
Vitamin Supplementation Protects against Nanomaterial-Induced Oxidative Stress and Inflammation Damages: A Meta-Analysis of In Vitro and In Vivo Studies

Abstract
:1. Introduction
2. Materials and Methods
2.1. Search Strategy
2.2. Inclusion and Exclusion Criteria
2.3. Data Extraction
2.4. Quality Assessment
2.5. Statistical Analysis
3. Results
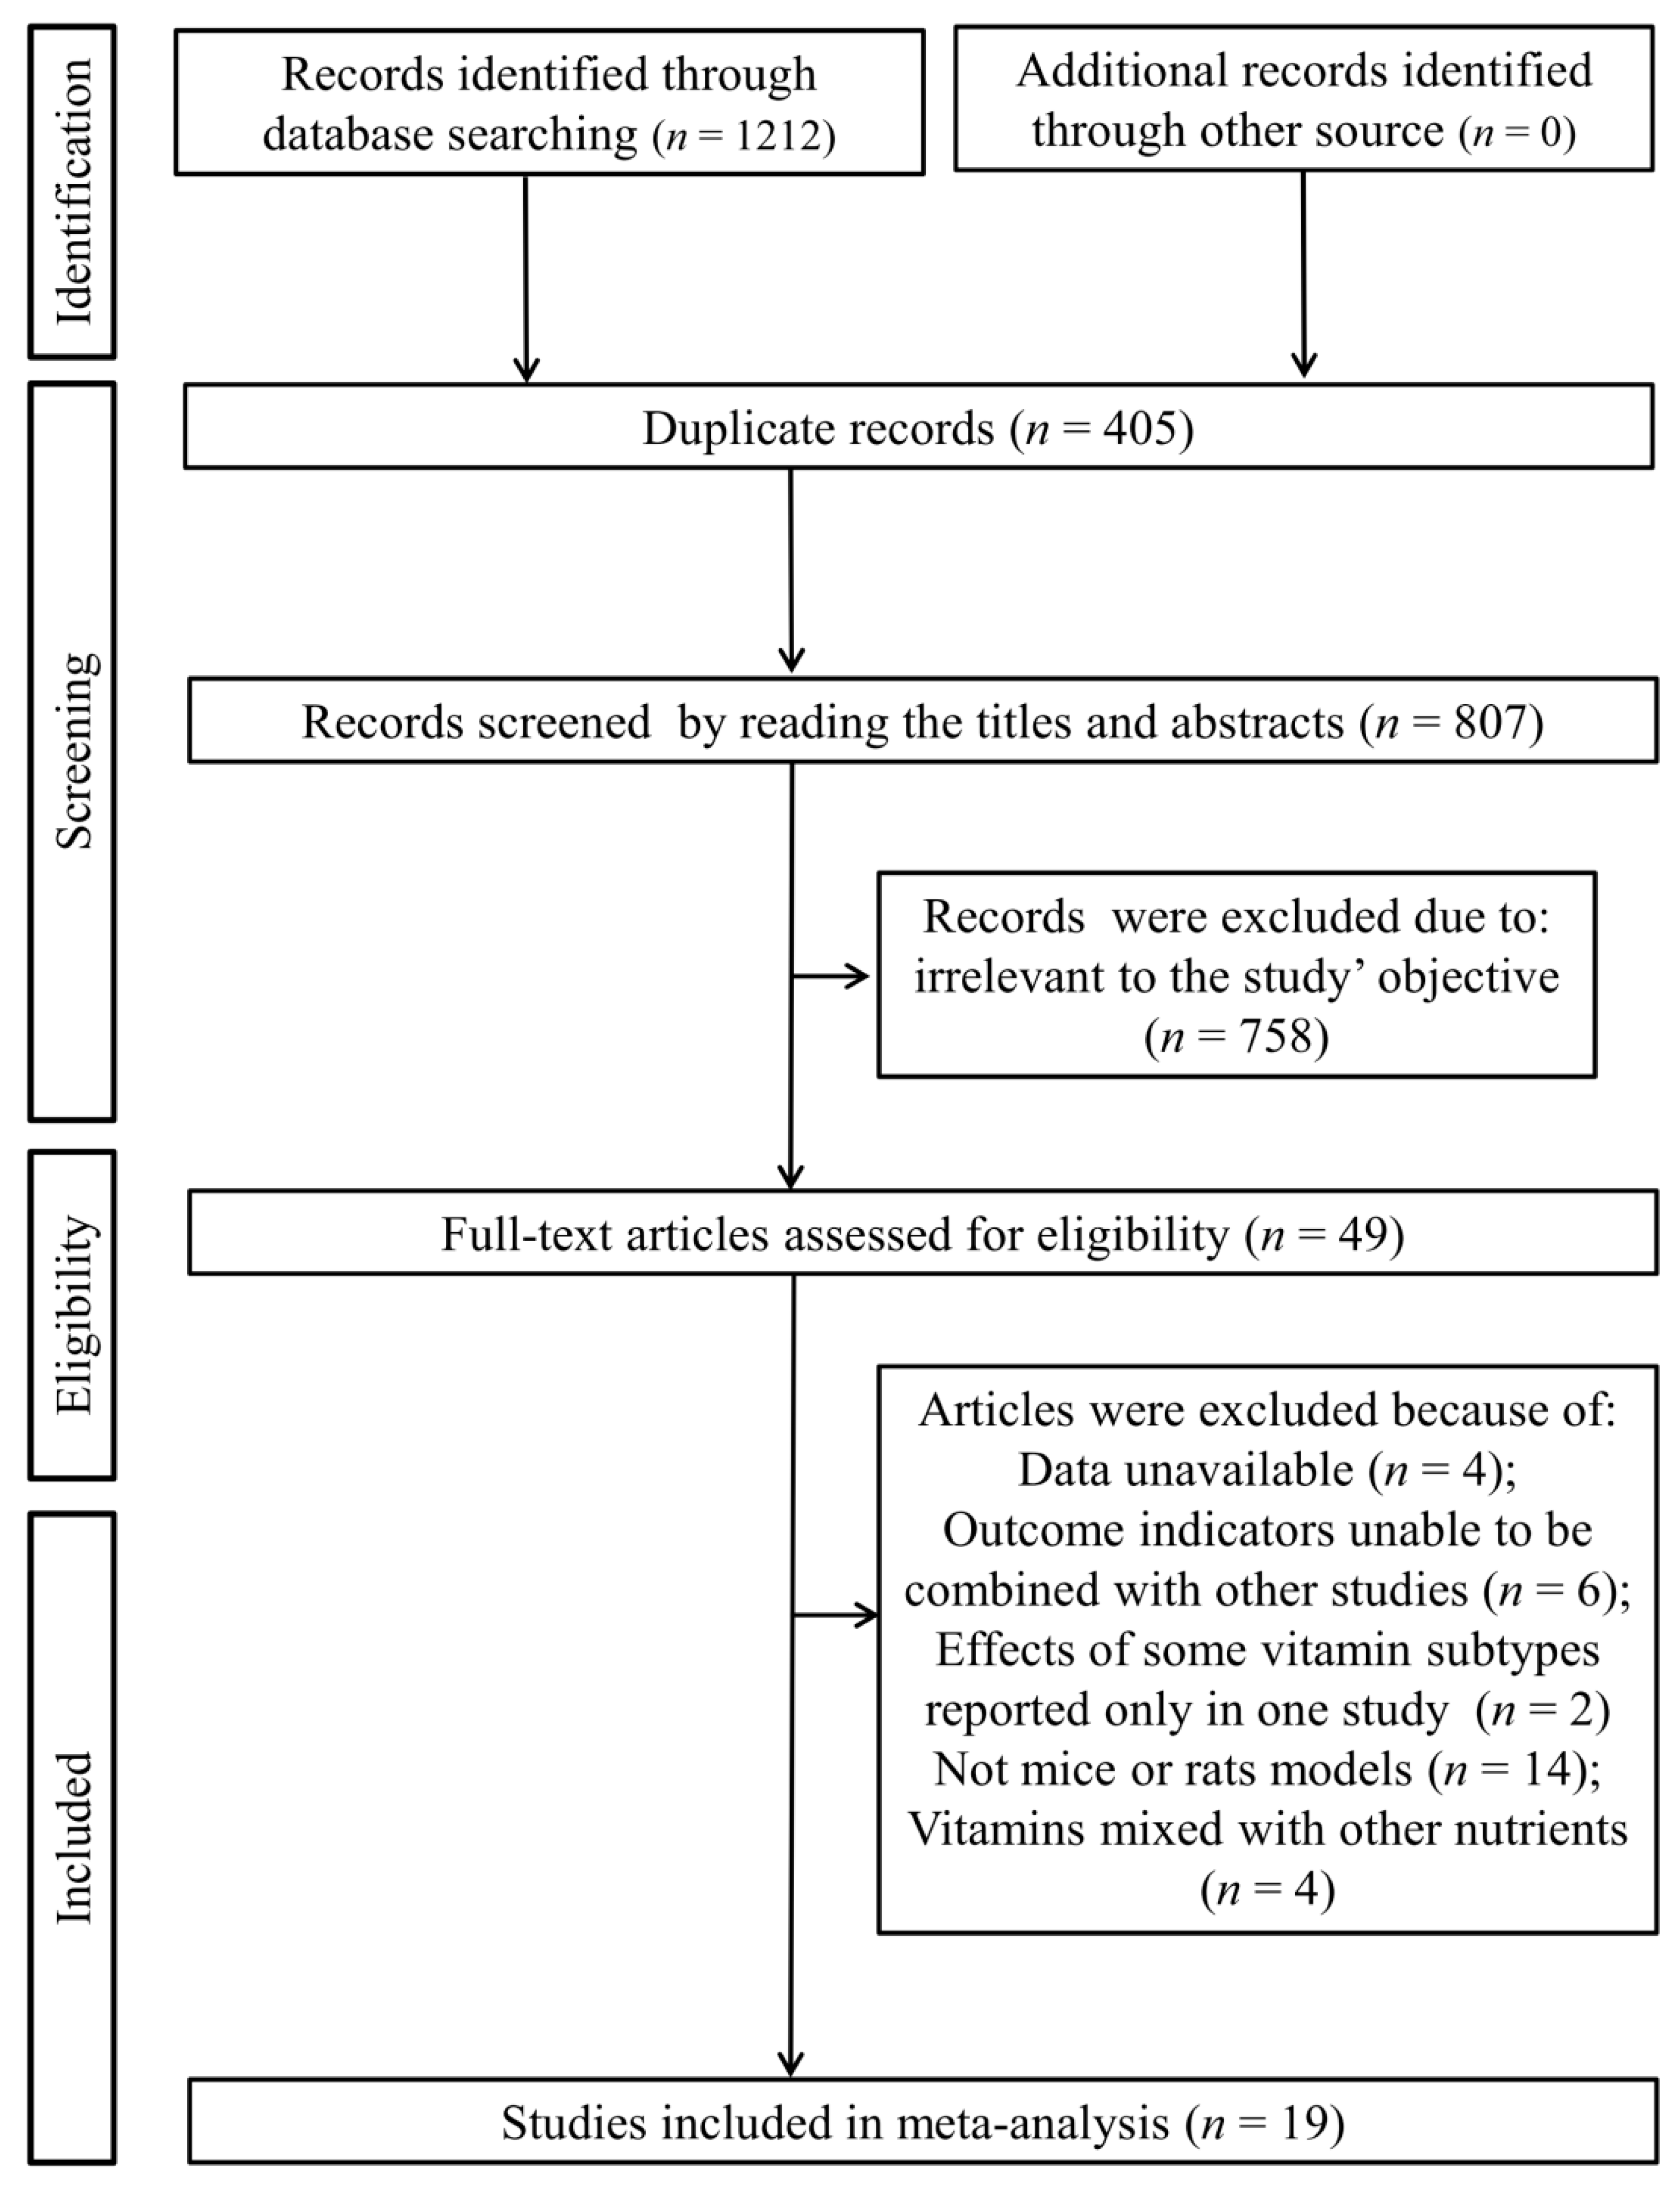
3.1. Study Selection
3.2. Study Characteristics
3.3. Quality Assessment
3.4. Meta-Analysis for In Vitro Studies
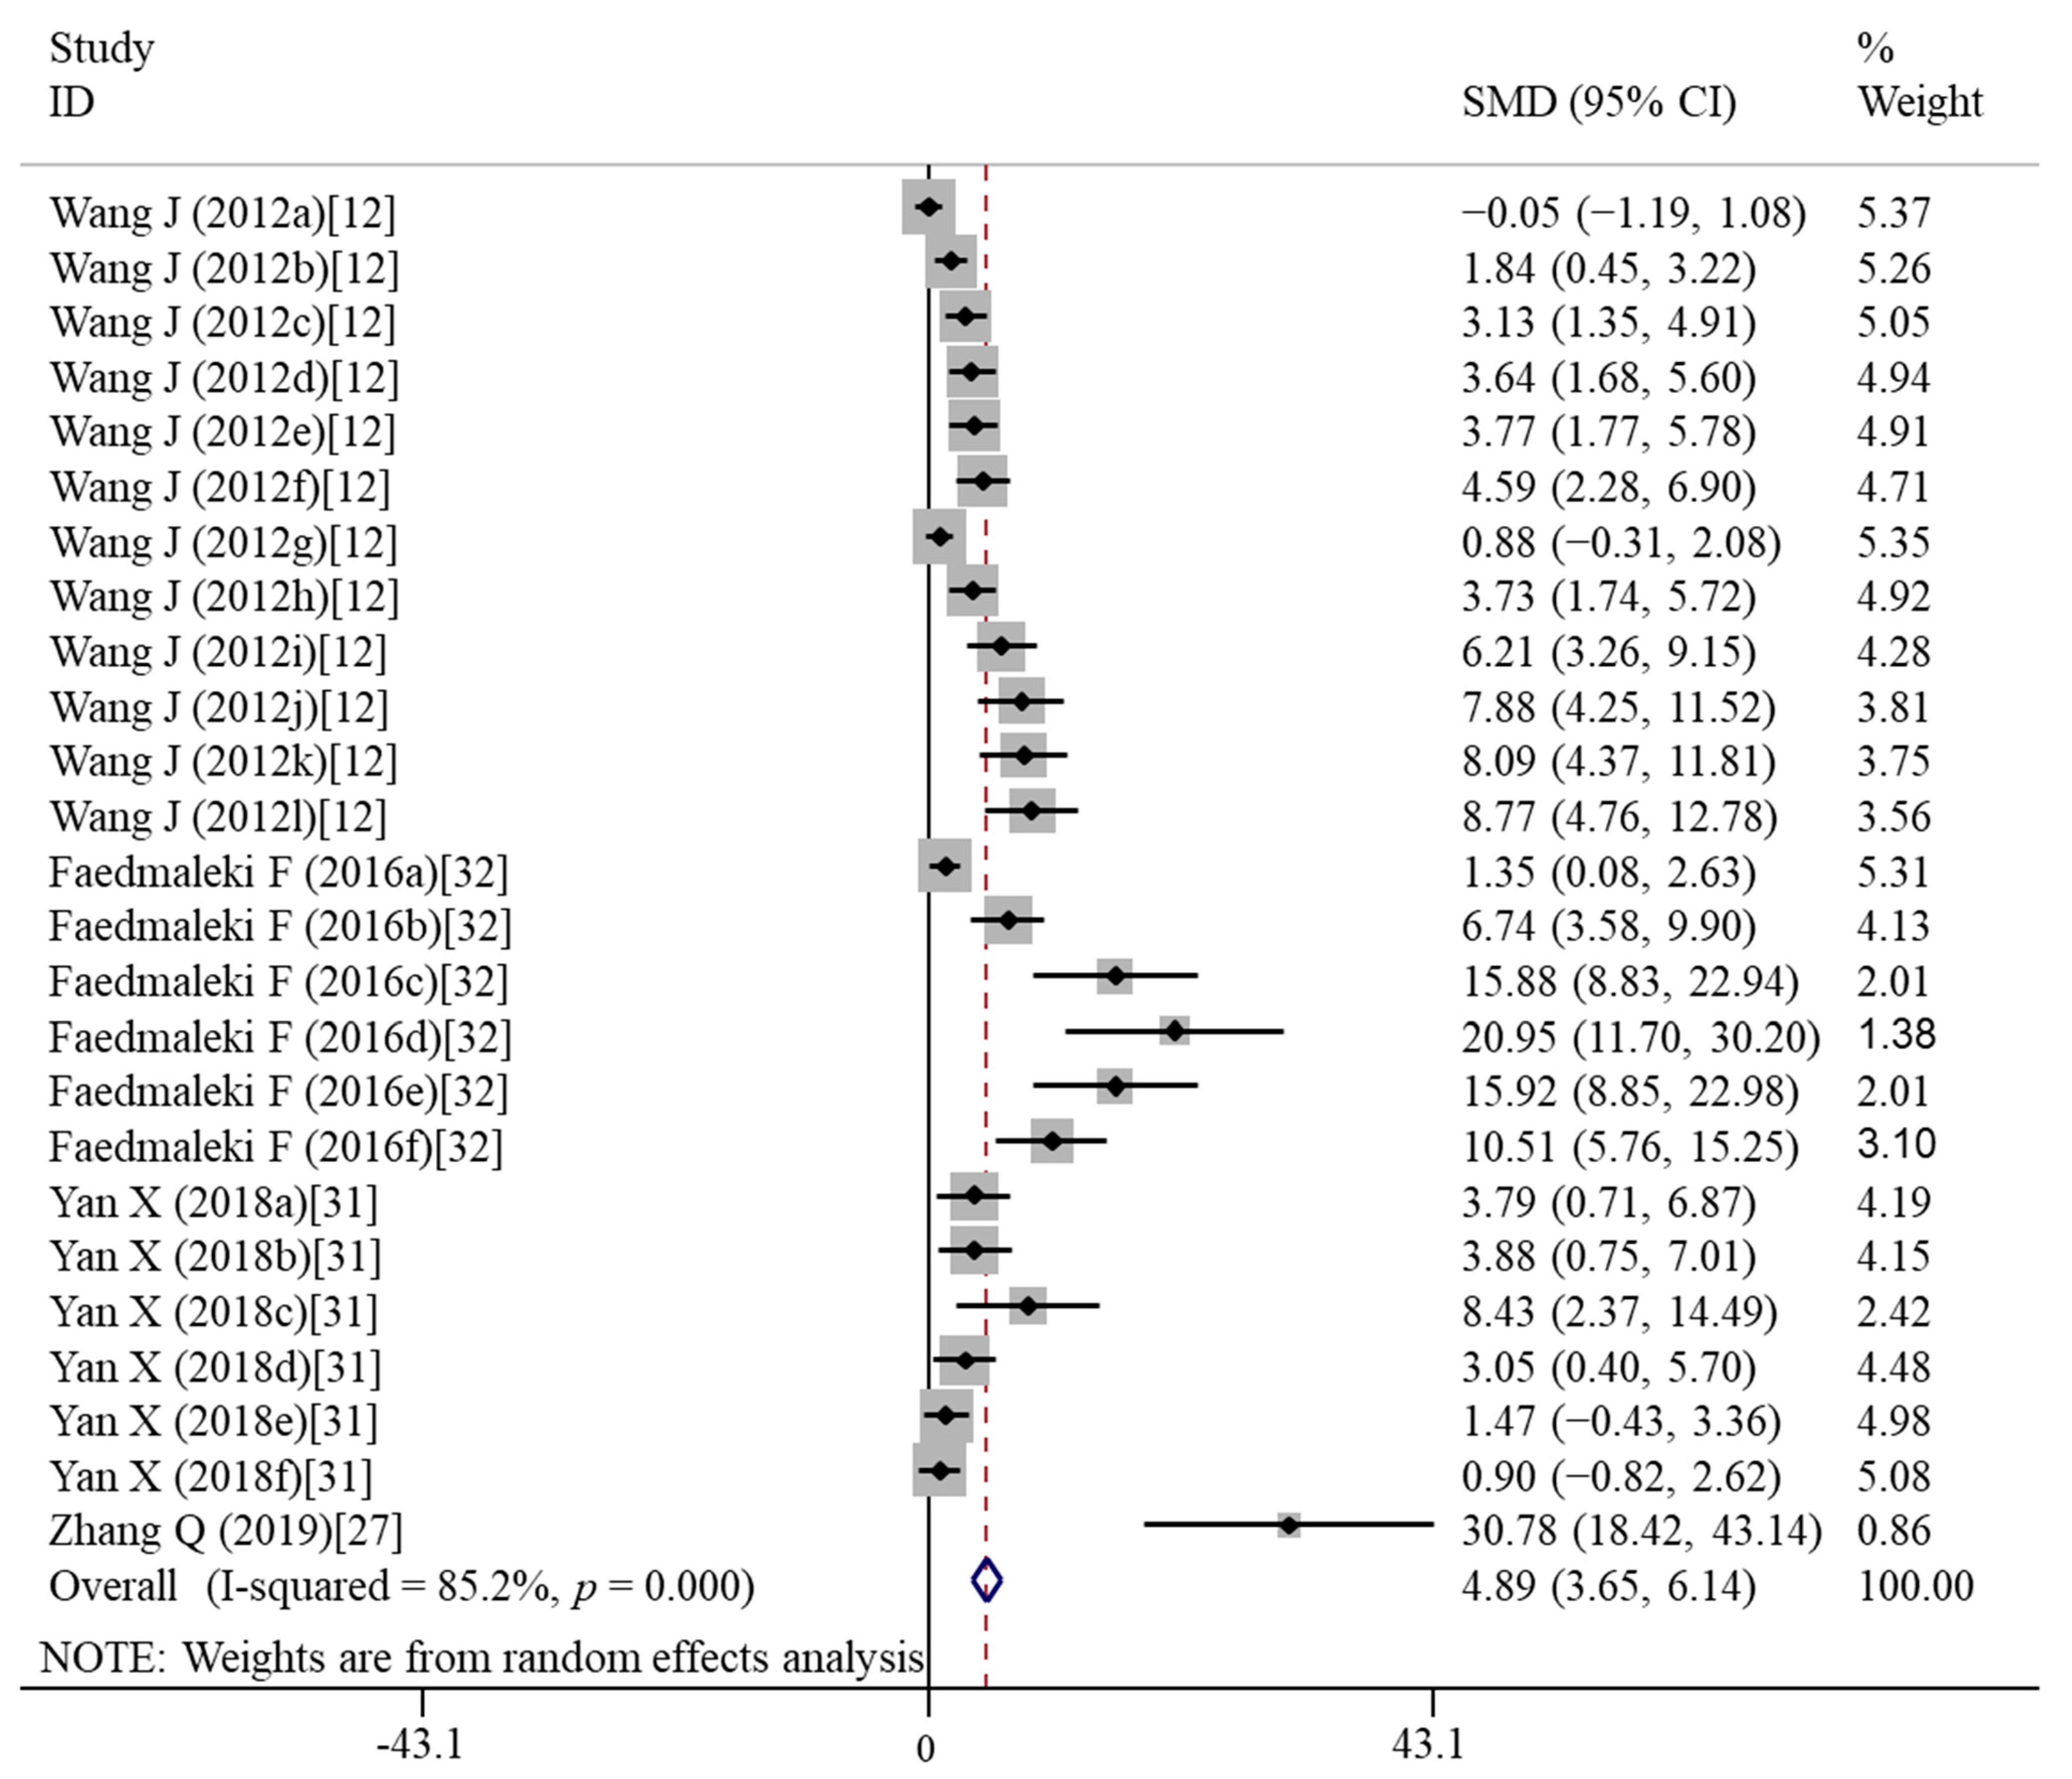
3.4.1. Effects of Vitamin E Treatment on Cell Viability
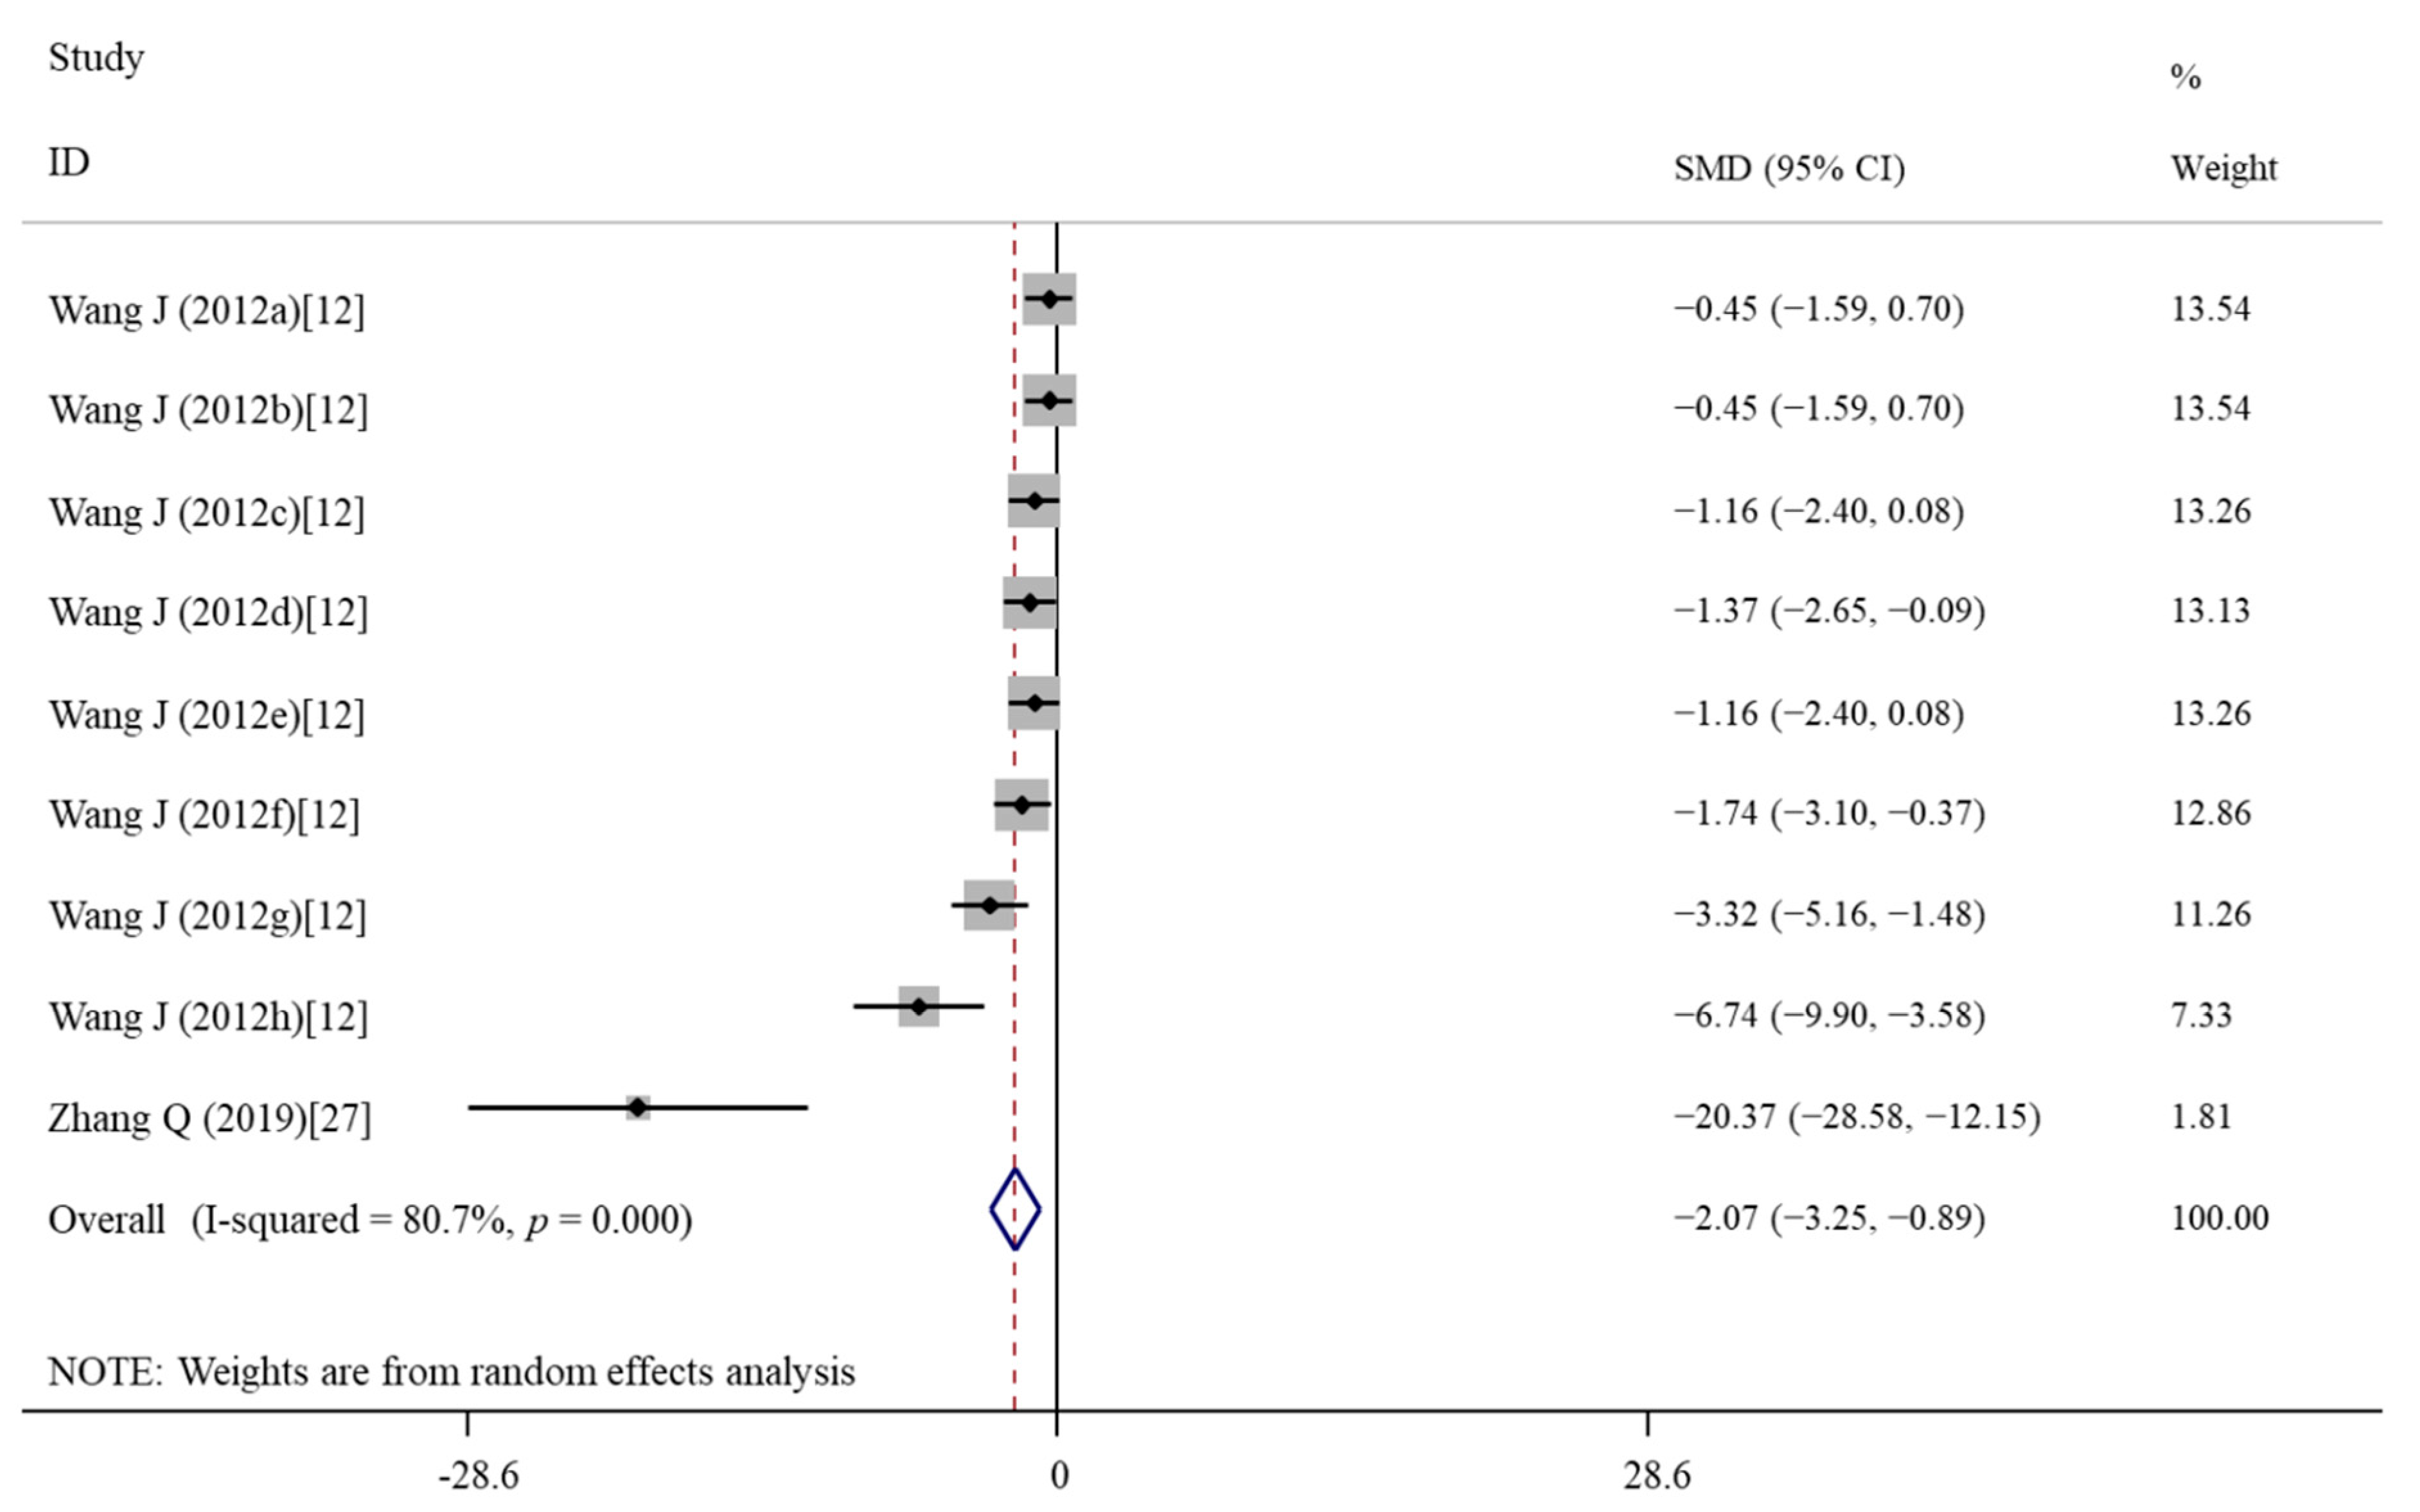
3.4.2. Effects of Vitamin E Treatment on Cell Apoptosis
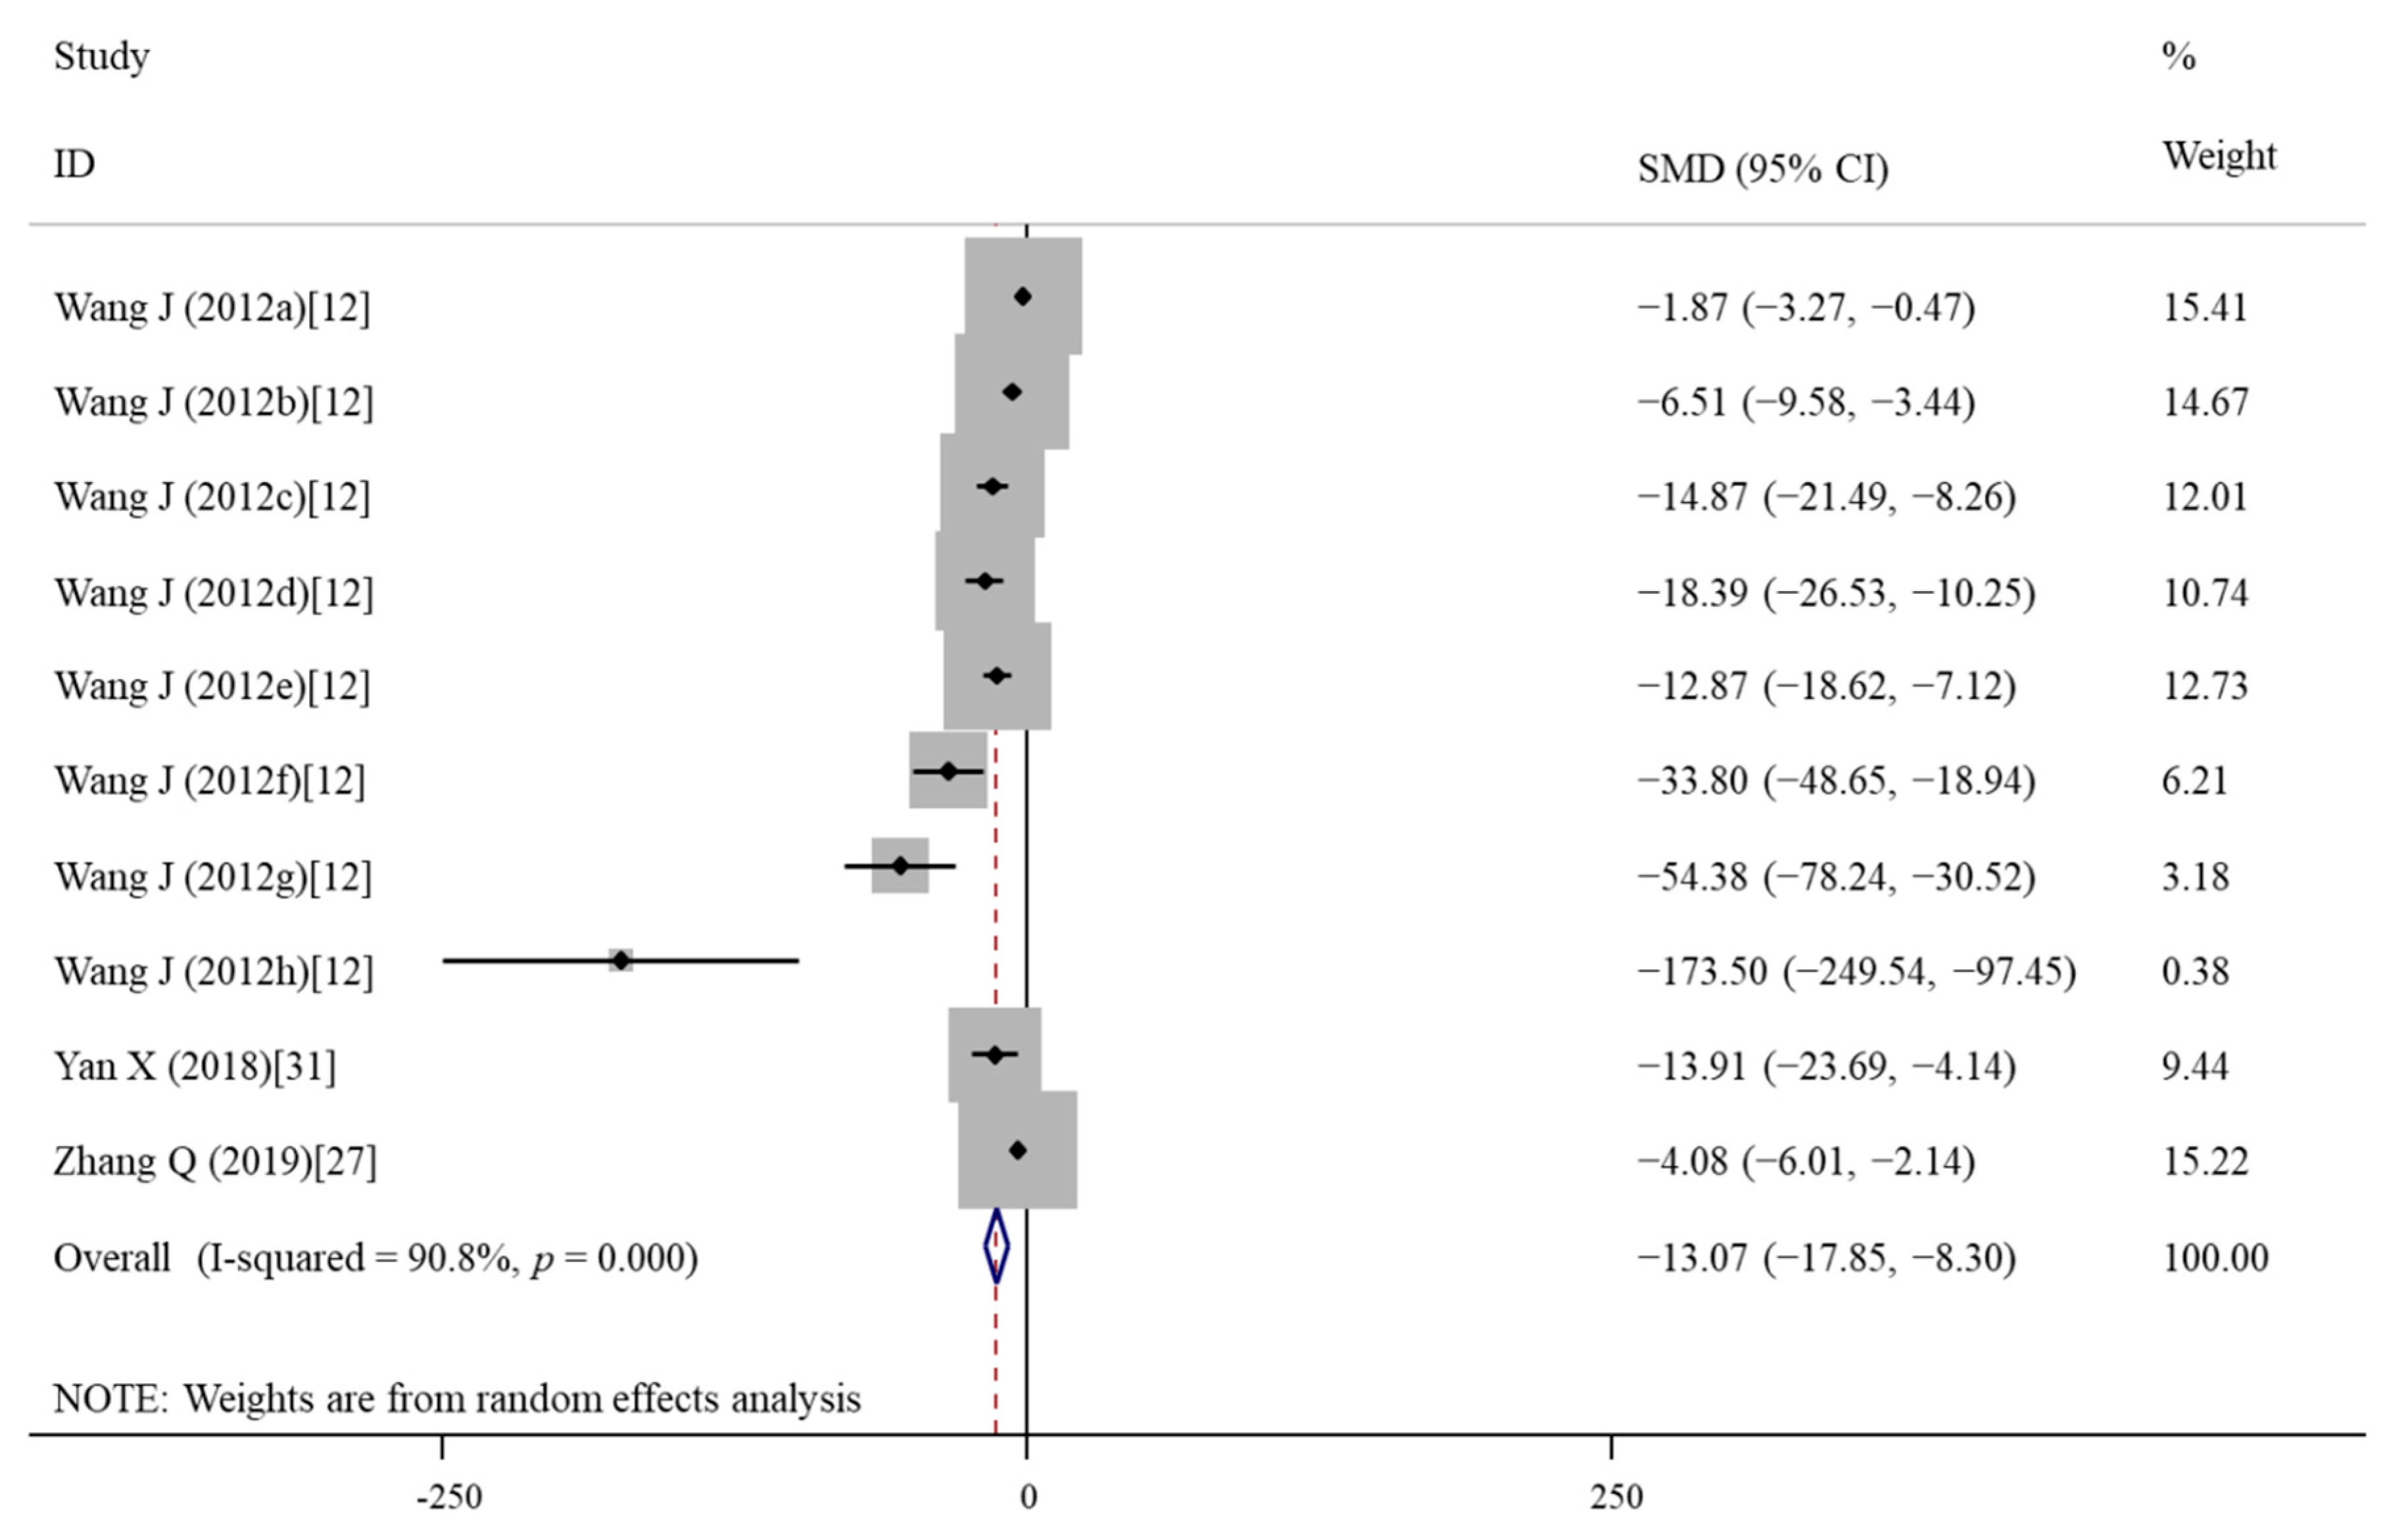
3.4.3. Effects of Vitamin E Treatment on Oxidative Stress
3.4.4. Effects of Vitamin C Treatment on Cell Viability
3.4.5. Effects of Vitamin C Treatment on Oxidative Stress
3.5. Meta-Analysis for In Vivo studies
3.5.1. Effects of Vitamin E Treatment on Body Weight
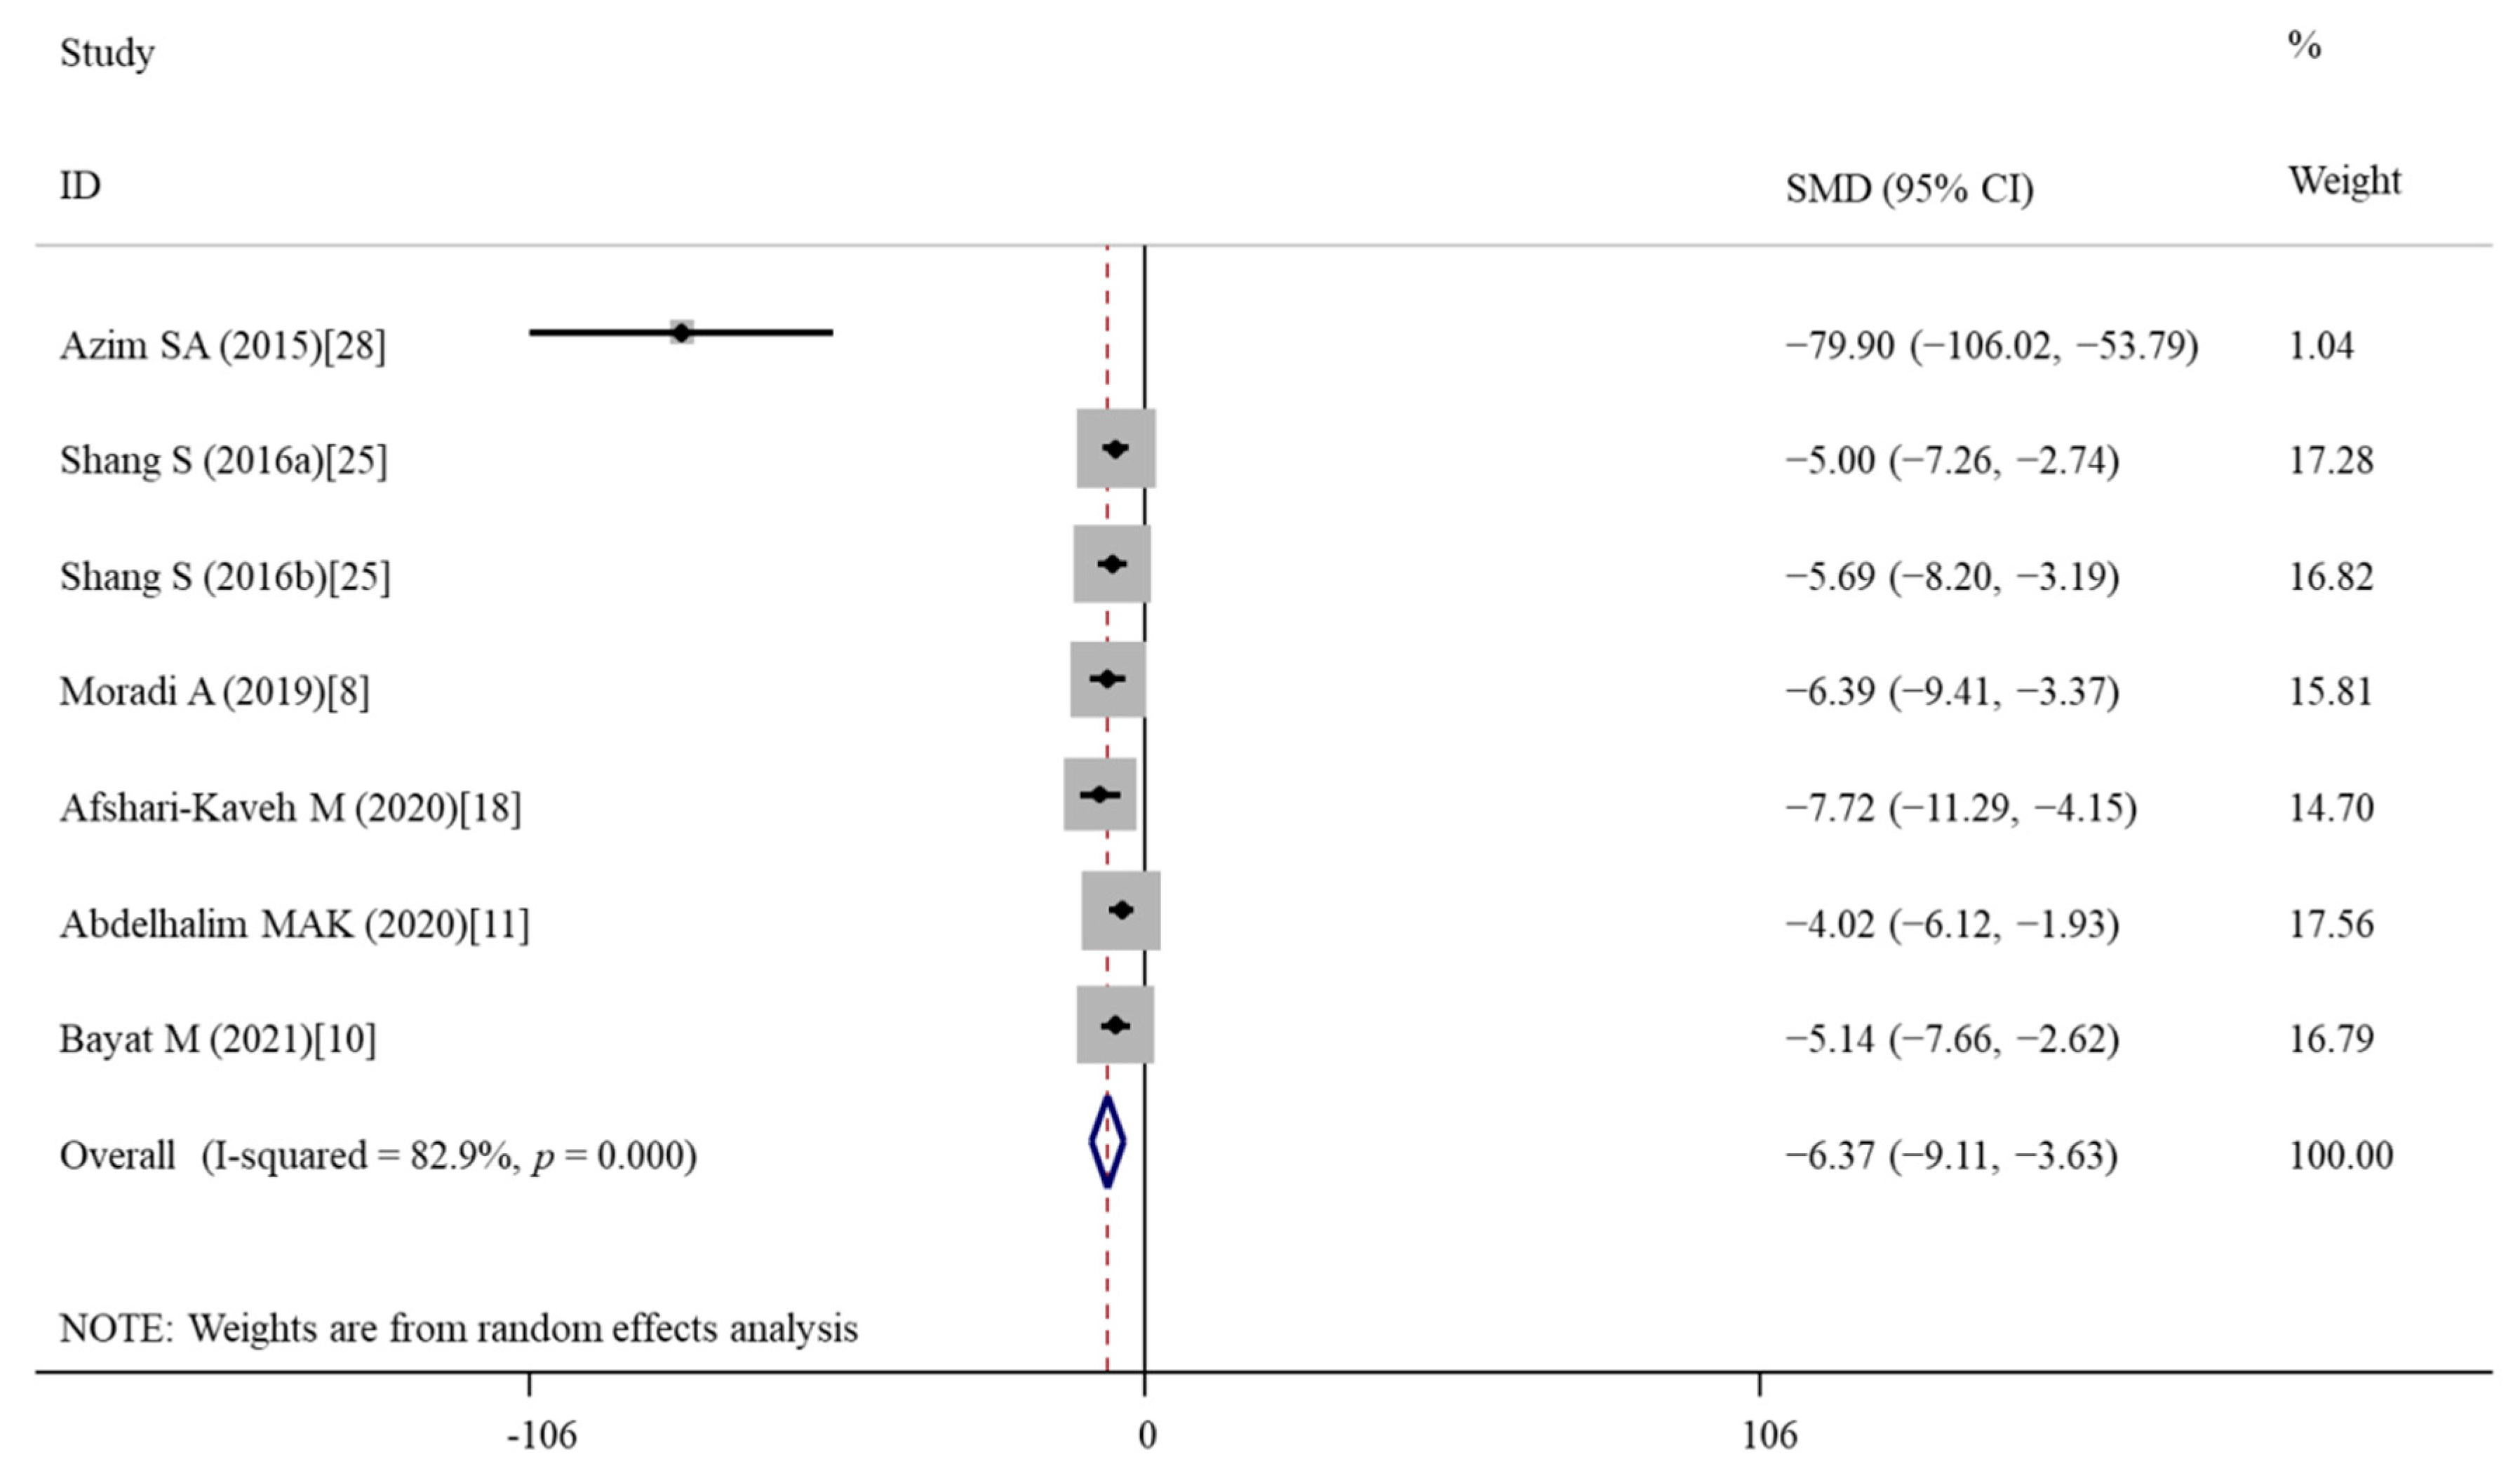
3.5.2. Effects of Vitamin E Treatment on Oxidative Stress
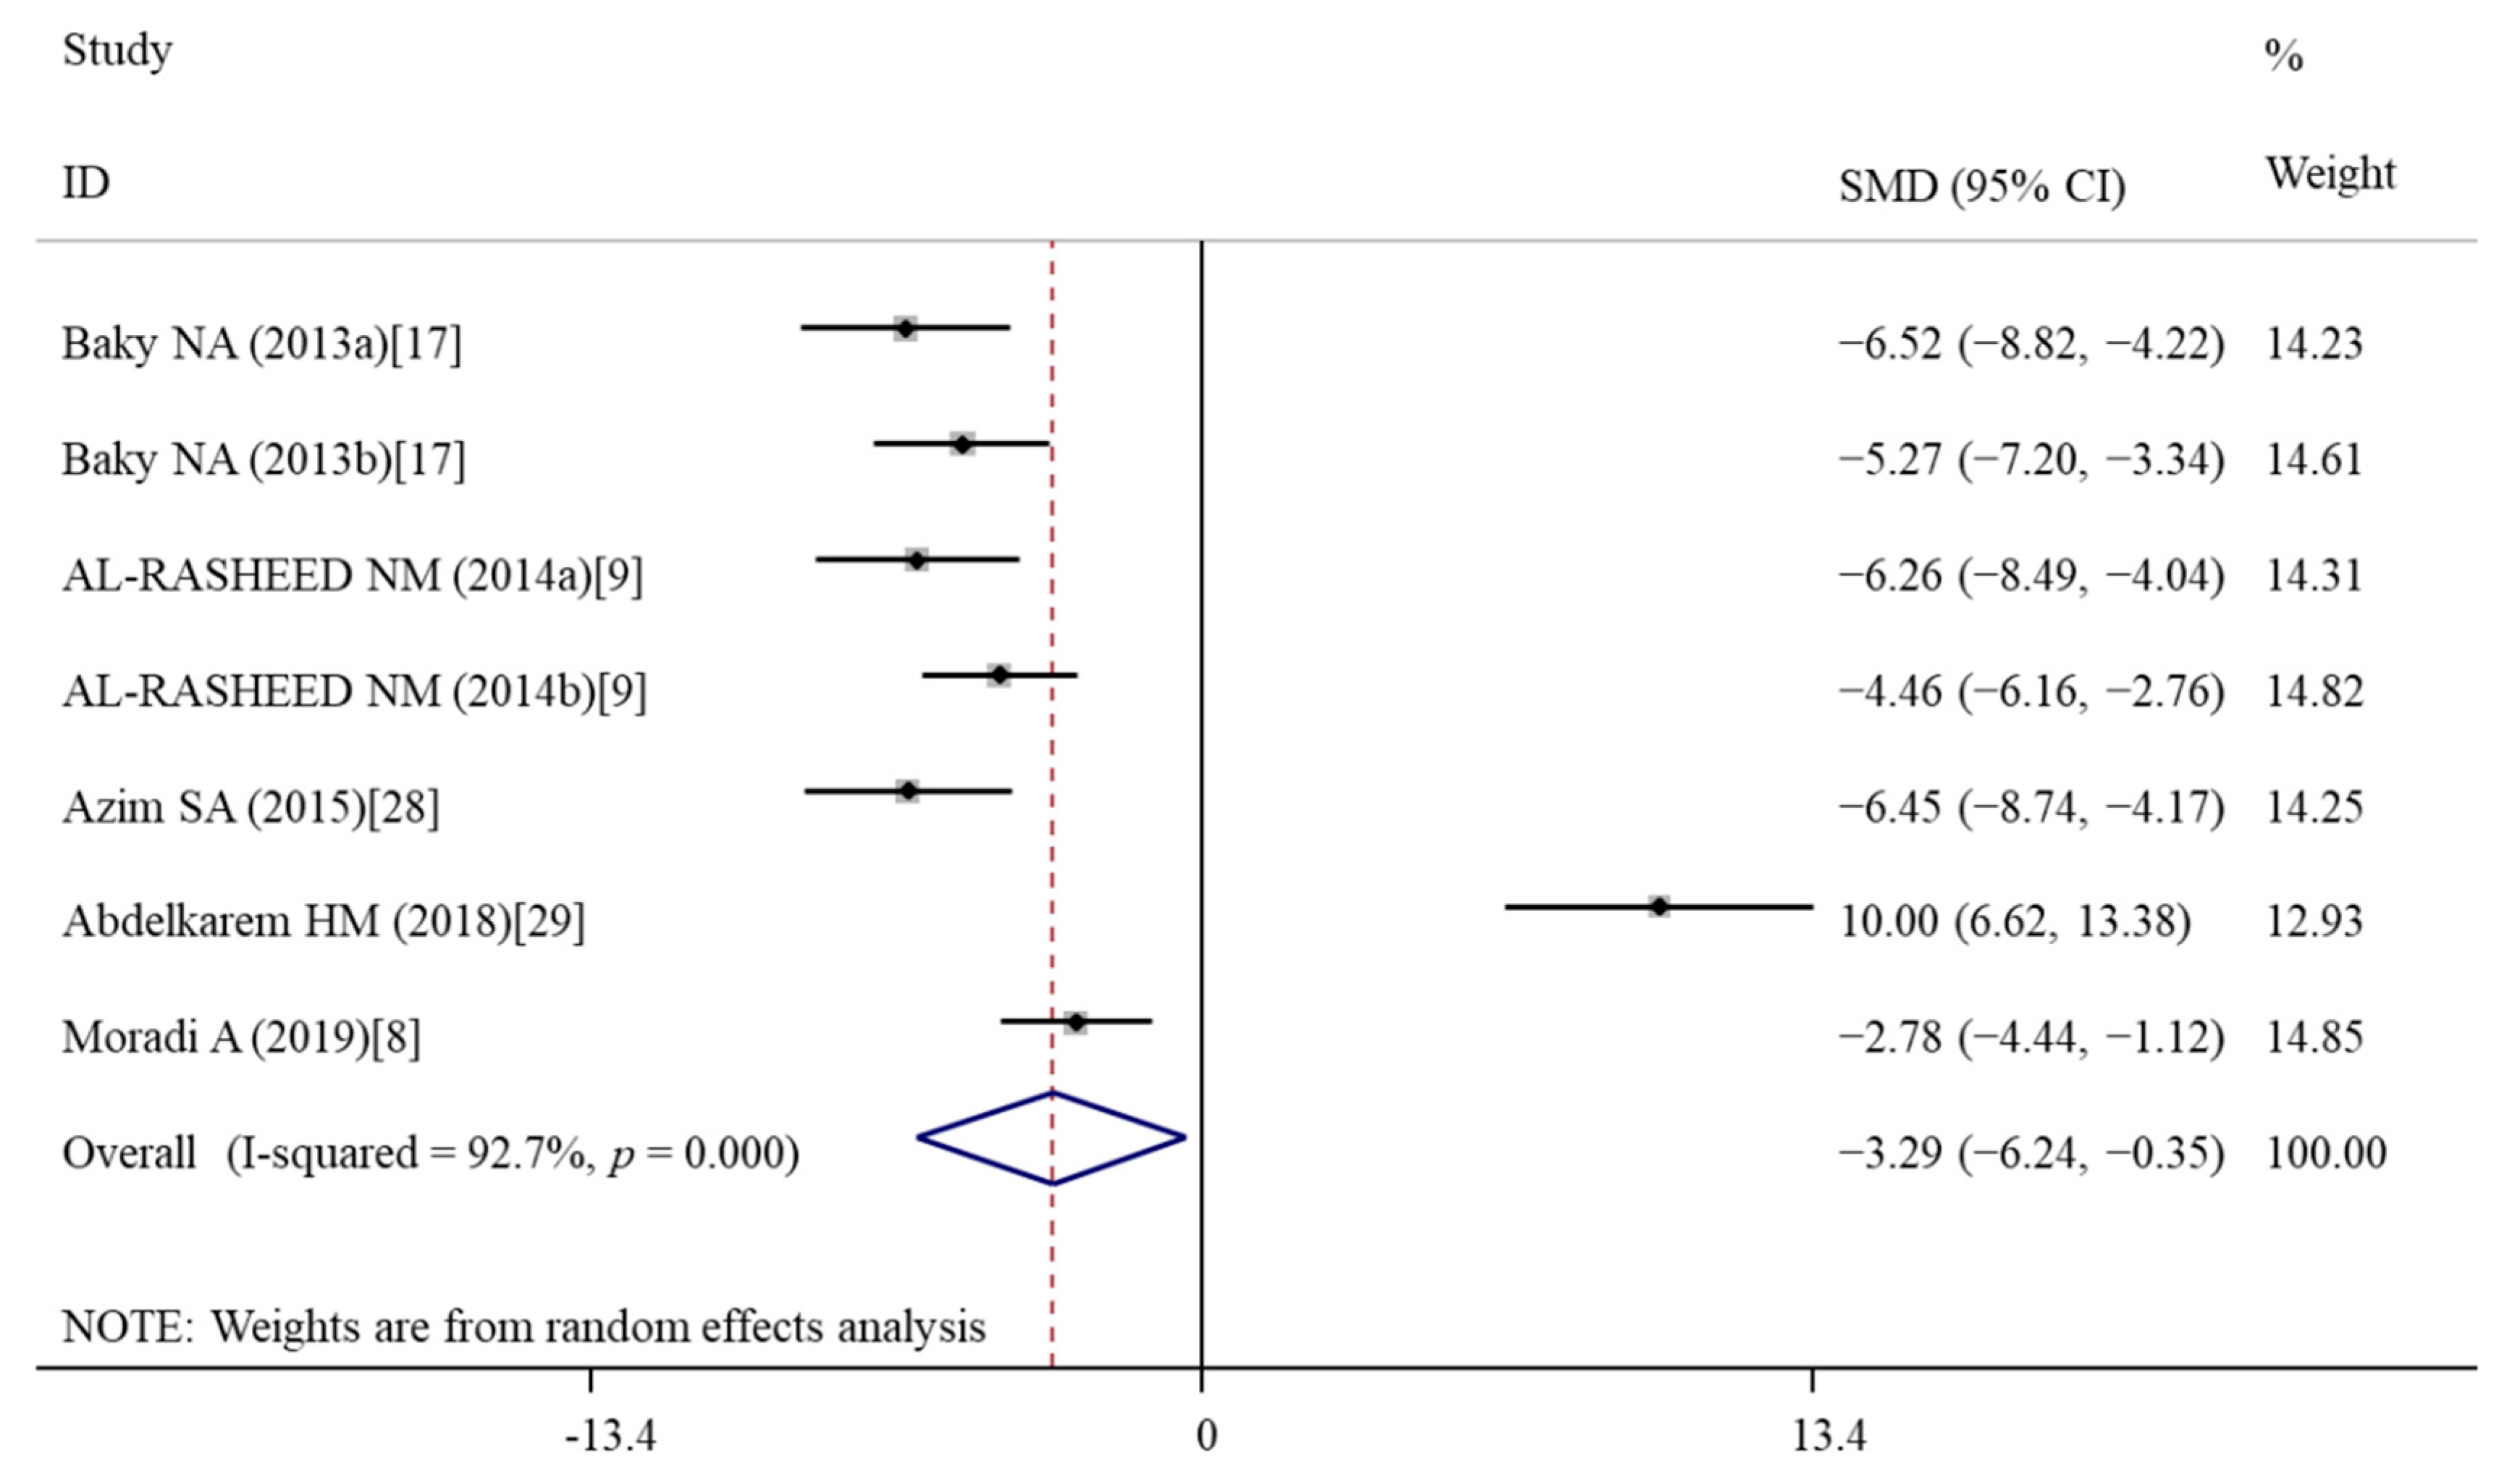
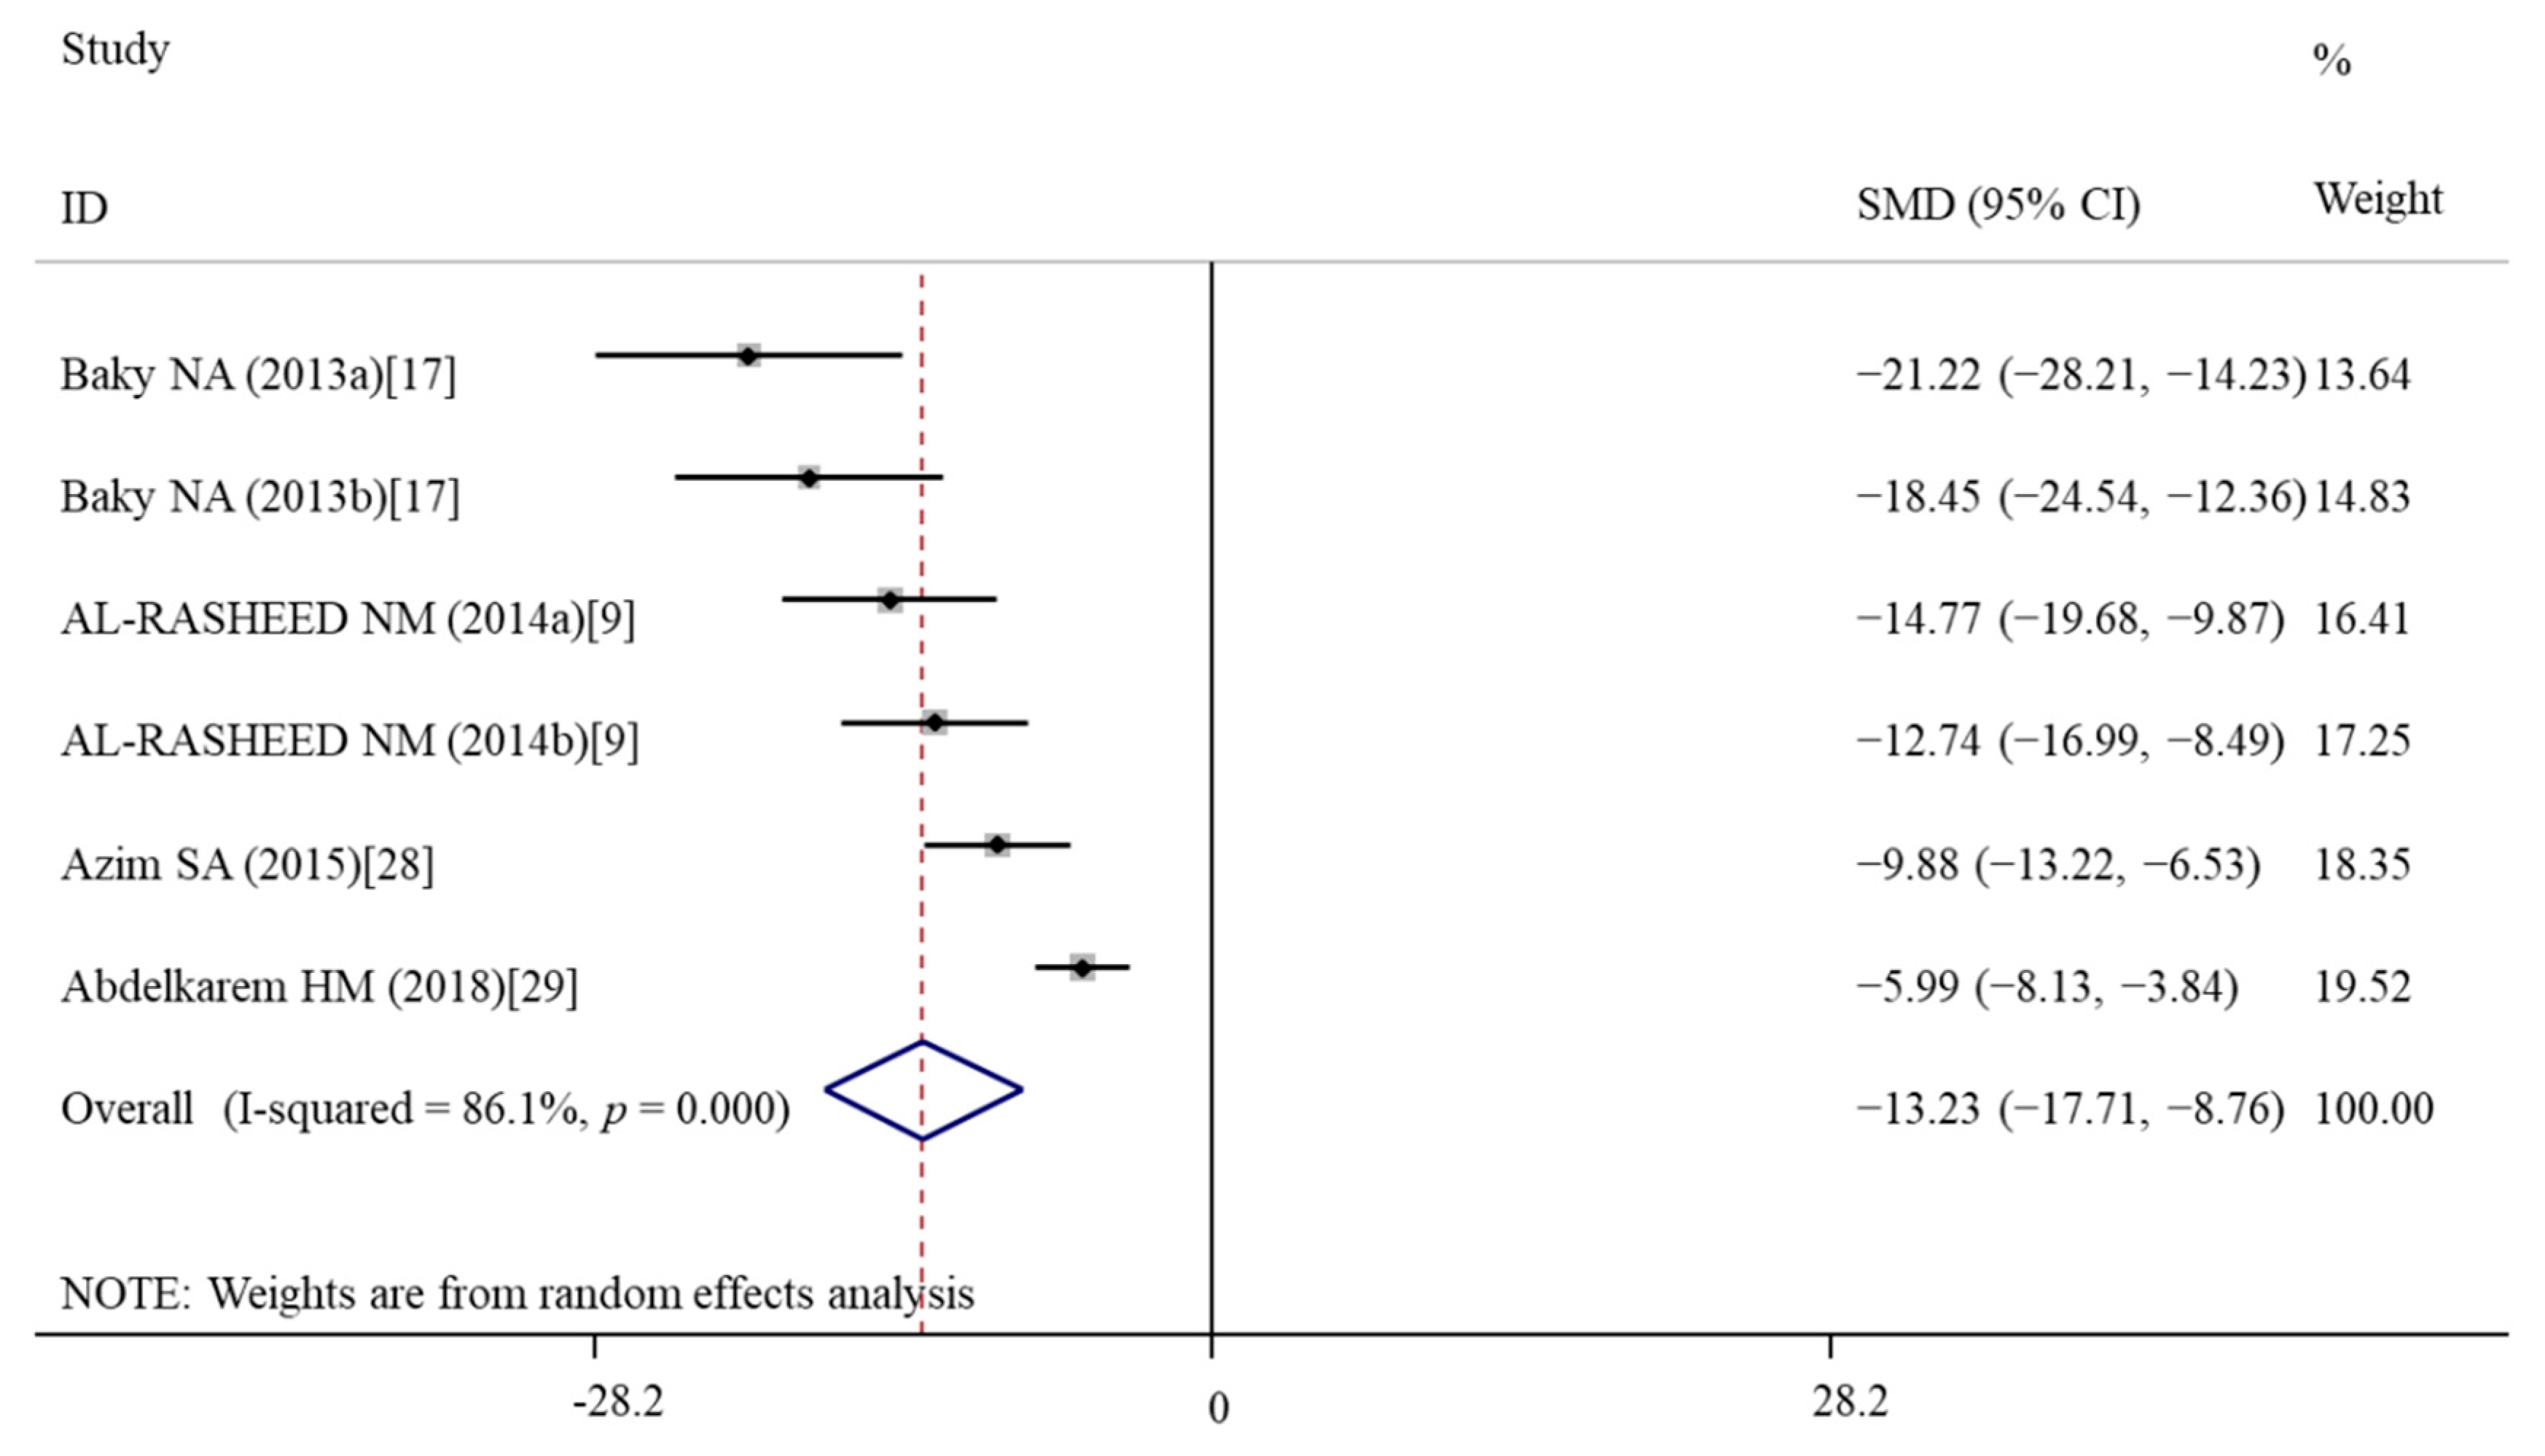
3.5.3. Effects of Vitamin E Treatment on Inflammation
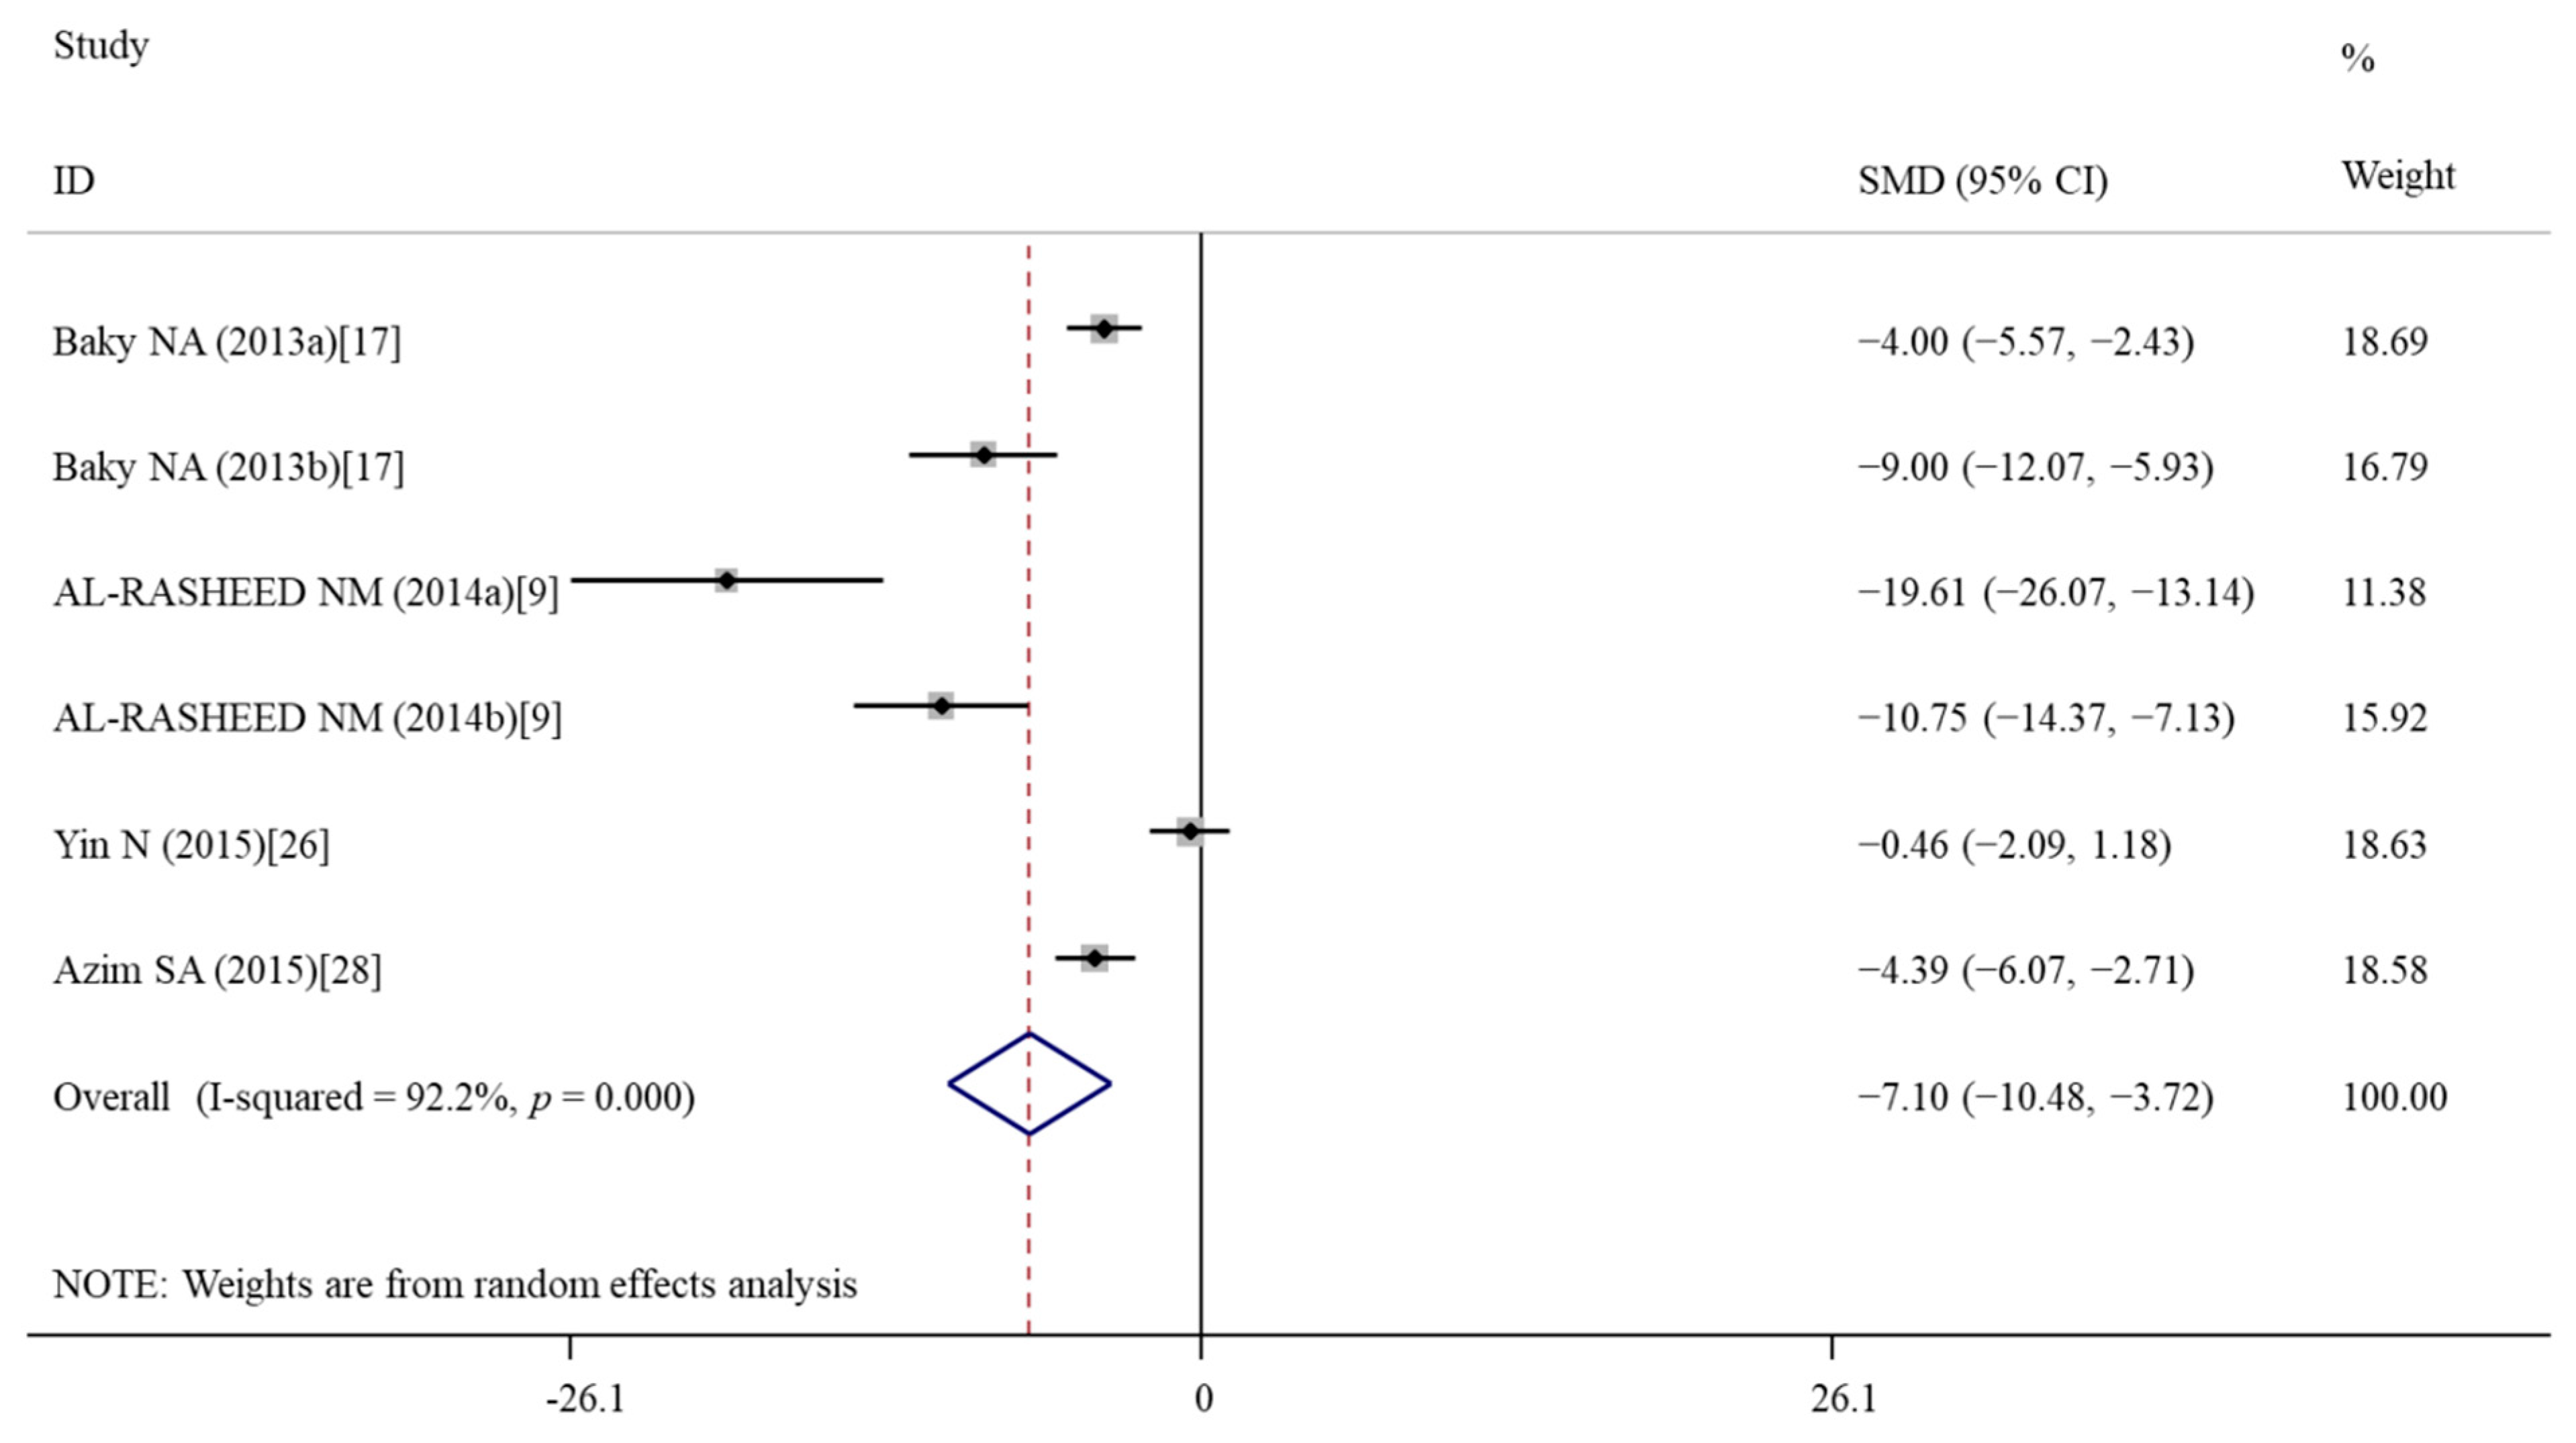
3.5.4. Effects of Vitamin E Treatment on Apoptosis
3.5.5. Effects of Vitamin E Treatment on DNA Damage
3.5.6. Effects of Vitamin E Treatment on Liver Function
3.5.7. Effects of Vitamin C Treatment on Oxidative Stress
3.5.8. Effects of Vitamin A Treatment on Body Weight
3.5.9. Effects of Vitamin A Treatment on Oxidative Stress
3.5.10. Effects of Vitamin A + E Treatment on Oxidative Stress
3.6. Publication Bias and Sensitivity Analysis
4. Discussion
5. Conclusions
Author Contributions
Funding
Institutional Review Board Statement
Informed Consent Statement
Data Availability Statement
Conflicts of Interest
References
- Mabrouk, M.; Das, D.B.; Salem, Z.A.; Beherei, H.H. Nanomaterials for biomedical applications: Production, characterisations, recent trends and difficulties. Molecules 2021, 26, 1077. [Google Scholar] [CrossRef] [PubMed]
- Ranjha, M.; Shafique, B.; Rehman, A.; Mehmood, A.; Ali, A.; Zahra, S.M.; Roobab, U.; Singh, A.; Ibrahim, S.A.; Siddiqui, S.A. Biocompatible nanomaterials in food science, technology, and nutrient drug delivery: Recent developments and applications. Front. Nutr. 2021, 8, 778155. [Google Scholar] [CrossRef] [PubMed]
- Fytianos, G.; Rahdar, A. Nanomaterials in cosmetics: Recent updates. Nanomaterials 2020, 10, 979. [Google Scholar] [CrossRef] [PubMed]
- De Matteis, V. Exposure to inorganic nanoparticles: Routes of entry, immune response, biodistribution and In Vitro/In Vivo toxicity evaluation. Toxics 2017, 5, 29. [Google Scholar] [CrossRef] [Green Version]
- Labouta, H.I.; Asgarian, N.; Rinker, K.; Cramb, D.T. Meta-analysis of nanoparticle cytotoxicity via data-mining the literature. ACS Nano 2019, 13, 1583–1594. [Google Scholar] [CrossRef]
- An, H.; Ling, C.; Xu, M.; Hu, M.; Wang, H.; Liu, J.; Song, G. Oxidative damage induced by nano-titanium dioxide in rats and mice: A systematic review and meta-analysis. Biol. Trace Elem. Res. 2020, 194, 184–202. [Google Scholar] [CrossRef]
- Vilas-Boas, V.; Vinken, M. Hepatotoxicity induced by nanomaterials: Mechanisms and In Vitro models. Arch. Toxicol. 2021, 95, 27–52. [Google Scholar] [CrossRef]
- Moradi, A.; Ziamajidi, N.; Ghafourikhosroshahi, A.; Abbasalipourkabir, R. Effects of vitamin A and vitamin E on attenuation of titanium dioxide nanoparticles-induced toxicity in the liver of male Wistar rats. Mol. Biol. Rep. 2019, 46, 2919–2932. [Google Scholar] [CrossRef]
- Al-Rasheed, N.M.; Baky, N.A.; Faddah, L.M.; Fatani, A.J.; Hasan, I.H.; Mohamad, R.A. Prophylactic role of α-lipoic acid and vitamin E against zinc oxide nanoparticles induced metabolic and immune disorders in rat’s liver. Eur. Rev. Med. Pharmacol. Sci. 2014, 18, 1813–1828. [Google Scholar]
- Bayat, M.; Daei, S.; Ziamajidi, N.; Abbasalipourkabir, R.; Nourian, A. The protective effects of vitamins A, C, and E on zinc oxide nanoparticles (ZnO NPs)-induced liver oxidative stress in male Wistar rats, drug and chemical toxicology. Drug Chem. Toxicol. 2021, 1–10. [Google Scholar] [CrossRef]
- Abdelhalim, M.A.K.; Qaid, H.A.; Al-Mohy, Y.H.; Ghannam, M.M. The protective roles of vitamin E and α-lipoic acid against nephrotoxicity, lipid peroxidation, and inflammatory damage induced by gold nanoparticles. Int. J. Nanomed. 2020, 15, 729–734. [Google Scholar] [CrossRef] [PubMed] [Green Version]
- Wang, J.; Sun, P.; Bao, Y.; Dou, B.; Song, D.; Li, Y. Vitamin E renders protection to PC12 cells against oxidative damage and apoptosis induced by single-walled carbon nanotubes. Toxicol. Vitr. 2012, 26, 32–41. [Google Scholar] [CrossRef] [PubMed]
- Sharma, C.S.; Sarkar, S.; Periyakaruppan, A.; Barr, J.; Wise, K.; Thomas, R.; Wilson, B.L.; Ramesh, G.T. Single-walled carbon nanotubes induces oxidative stress in rat lung epithelial cells. J. Nanosci. Nanotechnol. 2007, 7, 2466–2472. [Google Scholar] [CrossRef] [PubMed] [Green Version]
- Ahamed, M.; Ali, D.; Alhadlaq, H.A.; Akhtar, M.J. Nickel oxide nanoparticles exert cytotoxicity via oxidative stress and induce apoptotic response in human liver cells (HepG2). Chemosphere 2013, 93, 2514–2522. [Google Scholar] [CrossRef] [PubMed]
- Nguyen, Y.; Sigaux, J.; Letarouilly, J.G. Efficacy of oral vitamin supplementation in inflammatory rheumatic disorders: A systematic review and meta-analysis of randomized controlled trials. Nutrients 2020, 13, 107. [Google Scholar] [CrossRef]
- Mansournia, M.A.; Ostadmohammadi, V.; Doosti-Irani, A.; Ghayour-Mobarhan, M.; Ferns, G.; Akbari, H.; Ghaderi, A.; Talari, H.R.; Asemi, Z. The effects of vitamin D supplementation on biomarkers of inflammation and oxidative stress in diabetic patients: A systematic review and meta-analysis of randomized controlled trials. Horm. Metab. Res. 2018, 50, 429–440. [Google Scholar] [CrossRef] [Green Version]
- Baky, N.A.; Faddah, L.M.; Al-Rasheed, N.M.; Al-Rasheed, N.M.; Fatani, A.J. Induction of inflammation, DNA damage and apoptosis in rat heart after oral exposure to zinc oxide nanoparticles and the cardioprotective role of α-lipoic acid and vitamin E. Drug Res. 2013, 63, 228–236. [Google Scholar] [CrossRef]
- Afshari-Kaveh, M.; Abbasalipourkabir, R.; Nourian, A.; Ziamajidi, N. The protective effects of vitamins A and E on titanium dioxide nanoparticles (nTiO2)-induced oxidative stress in the spleen tissues of male wistar rats. Biol. Trace Elem. Res. 2021, 199, 3677–3687. [Google Scholar] [CrossRef]
- Kong, L.; Hu, W.; Lu, C.; Cheng, K.; Tang, M. Mechanisms underlying nickel nanoparticle induced reproductive toxicity and chemo-protective effects of vitamin C in male rats. Chemosphere 2019, 218, 259–265. [Google Scholar] [CrossRef]
- Schneider, K.; Schwarz, M.; Burkholder, I.; Kopp-Schneider, A.; Edler, L.; Kinsner-Ovaskainen, A.; Hartung, T.; Hoffmann, S. “ToxRTool”, a new tool to assess the reliability of toxicological data. Toxicol. Lett. 2009, 189, 138–144. [Google Scholar] [CrossRef]
- Sanches, P.L.; Geaquinto, L.R.O.; Cruz, R.; Schuck, D.C.; Lorencini, M.; Granjeiro, J.M.; Ribeiro, A.R.L. Toxicity evaluation of TiO(2) nanoparticles on the 3D skin model: A systematic review. Front. Bioeng. Biotechnol. 2020, 8, 575. [Google Scholar] [CrossRef] [PubMed]
- Hooijmans, C.R.; Rovers, M.M.; de Vries, R.B.; Leenaars, M.; Ritskes-Hoitinga, M.; Langendam, M.W. SYRCLE’s risk of bias tool for animal studies. BMC Med. Res. Methodol. 2014, 14, 43. [Google Scholar] [CrossRef] [PubMed] [Green Version]
- Hafez, A.A.; Naserzadeh, P.; Ashtari, K.; Mortazavian, A.M.; Salimi, A. Protection of manganese oxide nanoparticles-induced liver and kidney damage by vitamin D. Regul. Toxicol. Pharmacol. 2018, 98, 240–244. [Google Scholar] [CrossRef]
- Naskhi, A.; Jabbari, S.; Othman, G.Q.; Aziz, F.M.; Salihi, A. Vitamin K1 as a potential molecule for reducing single-walled carbon nanotubes-stimulated α-synuclein structural changes and cytotoxicity. Int. J. Nanomed. 2019, 14, 8433–8444. [Google Scholar] [CrossRef] [PubMed] [Green Version]
- Shang, S.; Li, J.; Zhao, Y.; Xi, Z.; Lu, Z.; Li, B.; Yang, X.; Li, R. Oxidized graphene-aggravated allergic asthma is antagonized by antioxidant vitamin E in Balb/c mice. Environ. Sci. Pollut. Res. Int. 2017, 24, 1784–1793. [Google Scholar] [CrossRef]
- Yin, N.; Yao, X.; Zhou, Q.; Faiola, F.; Jiang, G. Vitamin E attenuates silver nanoparticle-induced effects on body weight and neurotoxicity in rats. Biochem. Biophys. Res. Commun. 2015, 458, 405–410. [Google Scholar] [CrossRef] [Green Version]
- Zhang, Q.; Liu, Z.; Du, J.; Qin, W.; Lu, M.; Cui, H.; Li, X.; Ding, S.; Li, R.; Yuan, J. Dermal exposure to nano-TiO2 induced cardiovascular toxicity through oxidative stress, inflammation and apoptosis. J. Toxicol. Sci. 2019, 44, 35–45. [Google Scholar] [CrossRef]
- Azim, S.A.; Darwish, H.A.; Rizk, M.Z.; Ali, S.A.; Kadry, M.O. Amelioration of titanium dioxide nanoparticles-induced liver injury in mice: Possible role of some antioxidants. Exp. Toxicol. Pathol. 2015, 67, 305–314. [Google Scholar] [CrossRef]
- Abdelkarem, H.M.; Fadda, L.H.; El-Sayed, E.M.; Radwan, O.K. Potential role of l-arginine and vitamin E against bone loss induced by nano-zinc oxide in rats. J. Diet. Suppl. 2018, 15, 300–310. [Google Scholar] [CrossRef]
- Fukui, H.; Iwahashi, H.; Nishio, K.; Hagihara, Y.; Yoshida, Y.; Horie, M. Ascorbic acid prevents zinc oxide nanoparticle-induced intracellular oxidative stress and inflammatory responses. Toxicol. Ind. Health 2017, 33, 687–695. [Google Scholar] [CrossRef]
- Yan, X.; Liu, Y.; Xie, T.; Liu, F. α-Tocopherol protected against cobalt nanoparticles and cocl2 induced cytotoxicity and inflammation in Balb/3T3 cells. Immunopharmacol. Immunotoxicol. 2018, 40, 179–185. [Google Scholar] [CrossRef] [PubMed]
- Faedmaleki, F.; Shirazi, F.H.; Ejtemaeimehr, S.; Anjarani, S.; Salarian, A.A.; Ashtiani, H.A.; Rastegar, H. Study of silymarin and vitamin E protective effects on silver nanoparticle toxicity on mice liver primary cell culture. Acta Med. Iran. 2016, 54, 85–95. [Google Scholar] [PubMed]
- Liu, Y.; Hong, H.; Lu, X.; Wang, W.; Liu, F.; Yang, H. L-ascorbic acid protected against extrinsic and intrinsic apoptosis induced by cobalt nanoparticles through ROS attenuation. Biol. Trace Elem. Res. 2017, 175, 428–439. [Google Scholar] [CrossRef]
- Violi, F.; Nocella, C.; Loffredo, L.; Carnevale, R.; Pignatelli, P. Interventional study with vitamin E in cardiovascular disease and meta-analysis. Free Radic. Biol. Med. 2022, 178, 26–41. [Google Scholar] [CrossRef]
- Rai, S.N.; Singh, P.; Steinbusch, H.W.M. The role of vitamins in neurodegenerative disease: An update. Biomedicines 2021, 9, 1284. [Google Scholar] [CrossRef] [PubMed]
- Quinn, P.J. Molecular associations of vitamin E. Vitam. Horm. 2007, 76, 67–98. [Google Scholar]
- Ziglari, T.; Anderson, D.S. Determination of the relative contribution of the non-dissolved fraction of ZnO NP on membrane permeability and cytotoxicity. Inhal. Toxicol. 2020, 32, 86–95. [Google Scholar] [CrossRef] [PubMed]
- Hussain, S. Measurement of nanoparticle-induced mitochondrial membrane potential alterations. Methods Mol. Biol. 2019, 1894, 123–131. [Google Scholar]
- Traber, M.G.; Stevens, J.F. Vitamins C and E: Beneficial effects from a mechanistic perspective. Free Radic. Biol. Med. 2011, 51, 1000–1013. [Google Scholar] [CrossRef] [Green Version]
- Liu, Z.; Yao, X.; Jiang, W.; Li, W.; Zhu, S.; Liao, C.; Zou, L.; Ding, R.; Chen, J. Advanced oxidation protein products induce microglia-mediated neuroinflammation via MAPKs-NF-κB signaling pathway and pyroptosis after secondary spinal cord injury. J. Neuroinflamm. 2020, 17, 90. [Google Scholar] [CrossRef]
- Wu, L.; Pan, Y. Reactive oxygen species mediate TNF-α-induced inflammatory response in bone marrow mesenchymal cells. Iran. J. Basic Med. Sci. 2019, 22, 1296–1301. [Google Scholar] [PubMed]
- Salinthone, S.; Kerns, A.R.; Tsang, V.; Carr, D.W. α-Tocopherol (vitamin E) stimulates cyclic AMP production in human peripheral mononuclear cells and alters immune function. Mol. Immunol. 2013, 53, 173–178. [Google Scholar] [CrossRef] [PubMed]
- Qi, Y.C.; Duan, G.Z.; Mao, W.; Liu, Q.; Zhang, Y.L.; Li, P.F. Taurochenodeoxycholic acid mediates cAMP-PKA-CREB signaling pathway. Chin. J. Nat. Med. 2020, 18, 898–906. [Google Scholar] [CrossRef]
- Chen, M.; Chen, Z.; Huang, D.; Sun, C.; Xie, J.; Chen, T.; Zhao, X.; Huang, Y.; Li, D.; Wu, B.; et al. Myricetin inhibits TNF-α-induced inflammation in A549 cells via the SIRT1/NF-κB pathway. Pulm. Pharmacol. Ther. 2020, 65, 102000. [Google Scholar] [CrossRef] [PubMed]
- Srivastava, R.A.K.; Cornicelli, J.A.; Markham, B.; Bisgaier, C.L. Gemcabene, a first-in-class lipid-lowering agent in late-stage development, down-regulates acute-phase C-reactive protein via C/EBP-δ-mediated transcriptional mechanism. Mol. Cell Biochem. 2018, 449, 167–183. [Google Scholar] [CrossRef] [Green Version]
- Scheid, C.; Young, R.; McDermott, R.; Fitzsimmons, L.; Scarffe, J.H.; Stern, P.L. Immune function of patients receiving recombinant human interleukin-6 (IL-6) in a phase I clinical study: Induction of C-reactive protein and IgE and inhibition of natural killer and lymphokine-activated killer cell activity. Cancer Immunol. Immunother. 1994, 38, 119–126. [Google Scholar]


| Author | Year | Country | Nanomaterial Type | Nanomaterial Dose | Vitamin Type | Cell (Animal) Type | Vitamin Dose | Vitamin Treatment Duration | No. | Outcomes | |
|---|---|---|---|---|---|---|---|---|---|---|---|
| In vitro | Zhang Q [27] | 2019 | China | TiO2NPs | 56.25 μg/mL | VE | HUVECs | 27 μM | 24 h | 14 | Cell viability, caspase 3, ROS |
| Yan X [31] | 2018 | China | CoNPs | 100 μM | VE | Balb/3T3 cells | 2, 5, 10, 25, 50, 100 μM | 24 h | 6 | Cell viability, ROS | |
| Faedmaleki F [32] | 2016 | Iran | AgNPs | 121.7 μg/mL | VE | Mice liver primary cells | 50, 250, 500, 1000, 2500, 5000 μM | 24 h | 12 | Cell viability | |
| Liu Y [33] | 2016 | China | CoNPs | 50 μM | VC | Balb/3T3 cells | 50 μM | 24 h | 6 | Cell viability, ROS | |
| Fukui H [30] | 2016 | Japan | ZnONPs | 0.1 mg/mL | VC | A549 cells | 5000 μM | 6 h | 6 | ROS | |
| Ahamed M [14] | 2013 | Saudi Arabia | NiONPs | 25 μg/mL | VC | HepG2 cells | 1500 μM | 24 h | 6 | Cell viability, ROS | |
| Wang J [12] | 2012 | China | SWCNTs | 50 μg/mL | VE | PC12 cells | 10, 50, 200, 500, 1000, 2000 μM | 24, 48 h | 12 | Cell viability, caspase 3, ROS | |
| Sharma CS [13] | 2007 | USA | SWCNTs | 10 μg/mL | VC | Rat lung epithelial cells | 1000 μM | 6 h | 16 | ROS | |
| In vivo | Bayat M [10] | 2021 | Iran | ZnONPs | 200 mg/kg | VE | Rats | 100 IU/kg | 3 weeks | 12 | Body weight, MDA, TOS, TAC, OSI, SOD, GPx, CAT |
| Bayat M [10] | 2021 | Iran | ZnONPs | 200 mg/kg | VC | Rats | 100 IU/kg | 3 weeks | 12 | MDA, SOD, CAT | |
| Bayat M [10] | 2021 | Iran | ZnONPs | 200 mg/kg | VA | Rats | 100 IU/kg | 3 weeks | 12 | Body weight, MDA, TOS, TAC, OSI, SOD, GPx, CAT | |
| Afshari-Kaveh M [18] | 2020 | Iran | TiO2NPs | 300 mg/kg | VE | Rats | 100 IU/kg | 3 weeks | 12 | Body weight, MDA, TOS, TAC, OSI, SOD, GPx, Nrf2 | |
| Afshari-Kaveh M [18] | 2020 | Iran | TiO2NPs | 300 mg/kg | VA | Rats | 100 IU/kg | 3 weeks | 12 | Body weight, MDA, TOS, TAC, OSI, SOD, GPx, | |
| Afshari-Kaveh M [18] | 2020 | Iran | TiO2NPs | 300 mg/kg | VA + VE | Rats | 100 IU/kg | 3 weeks | 12 | MDA, TOS, TAC, SOD, GPx | |
| Abdelhalim MAK [11] | 2020 | Saudi Arabia | GNPs | 50 µL | VE | Rats | 200 mg/kg | 1 week | 12 | MDA, GSH | |
| Moradi A [8] | 2019 | Iran | TiO2NPs | 300 mg/kg | VE | Rats | 100 IU/kg | 2 weeks | 12 | MDA, TOS, TAC, SOD, GPx, CAT, NF-κB, TNF-α, ALT, AST | |
| Moradi A [8] | 2019 | Iran | TiO2NPs | 300 mg/kg | VA | Rats | 100 IU/kg | 2 weeks | 12 | MDA, TOS, TAC, SOD, GPx, CAT | |
| Moradi A [8] | 2019 | Iran | TiO2NPs | 300 mg/kg | VA + VE | Rats | 100 IU/kg | 2 weeks | 12 | MDA, TOS, TAC, SOD, GPx | |
| Zhang Q [27] | 2019 | China | TiO2NPs | 500 mg/kg | VE | Mice | 100 mg/kg | 6 weeks | 14 | IgE | |
| Kong L [19] | 2019 | China | NiNPs | 45 mg/kg | VC | Rats | 1 g/L | 2 weeks | 20 | MDA, SOD, CAT | |
| Abdelkarem HM [29] | 2018 | Egypt | ZnONPs | 600 mg/kg | VE | Rats | 200 mg/kg | 3 weeks | 20 | Body weight, TNF-α, IL-6 | |
| Shang S [25] | 2016 | China | GO | 0.4, 4 mg/kg | VE | Mice | 100 mg/kg | 4.6 weeks | 14 | MDA, GSH, ROS, IgE | |
| Yin N [26] | 2015 | China | AgNPs | 2 mg/kg | VE | Rats | 100 mg/kg | 4.6 weeks | 6 | Body weight, caspase-3 | |
| Azim SA [28] | 2015 | Egypt | TiO2NPs | 150 mg/kg | VE | Mice | 100 mg/kg | 2 weeks | 20 | MDA, GSH, NF-κB, Nrf2, caspase-3, tail length, DNA%,TNF-α, IL-6, ALT, AST | |
| AL-RASHEED NM [9] | 2014 | Saudi Arabia | ZnONPs | 600,1000 mg/kg | VE | Rats | 100 mg/kg | 3 weeks | 20 | GSH, caspase-3, tail length, DNA%,TNF-α, IL-6, CRP, ALT | |
| Baky NA [17] | 2013 | Egypt | ZnONPs | 600, 1000 mg/kg | VE | Rats | 100 mg/kg | 3 weeks | 20 | Body weight, caspase-3, tail length, DNA%, TNF-α, IL-6, CRP |
| Toxrtool Checklist of Study Quality | ||||||||||||||||||||
|---|---|---|---|---|---|---|---|---|---|---|---|---|---|---|---|---|---|---|---|---|
| Reference (In Vitro) | (1) | (2) | (3) | (4) | (5) | (6) | (7) | (8) | (9) | (10) | (11) | (12) | (13) | (14) | (15) | (16) | (17) | (18) | Total | Reliability of Evidence |
| Zhang Q [27] | 1 | 0 | 1 | 0 | 1 | 1 | 1 | 1 | 1 | 1 | 1 | 1 | 1 | 1 | 1 | 1 | 1 | 1 | 16 | Reliable without restrictions |
| Yan X [31] | 1 | 0 | 1 | 0 | 1 | 1 | 1 | 1 | 1 | 1 | 1 | 1 | 1 | 1 | 1 | 1 | 1 | 1 | 16 | Reliable without restrictions |
| Faedmaleki F [32] | 1 | 0 | 1 | 0 | 1 | 1 | 1 | 1 | 1 | 1 | 1 | 1 | 1 | 1 | 1 | 1 | 1 | 1 | 16 | Reliable without restrictions |
| Liu Y [33] | 1 | 0 | 1 | 0 | 1 | 1 | 1 | 1 | 1 | 1 | 1 | 1 | 1 | 1 | 1 | 1 | 1 | 1 | 16 | Reliable without restrictions |
| Fukui H [30] | 1 | 0 | 1 | 0 | 1 | 1 | 1 | 1 | 1 | 1 | 1 | 1 | 1 | 1 | 1 | 1 | 1 | 1 | 16 | Reliable without restrictions |
| Ahamed M [14] | 1 | 0 | 1 | 0 | 1 | 1 | 1 | 1 | 1 | 1 | 1 | 1 | 1 | 1 | 1 | 1 | 1 | 1 | 16 | Reliable without restrictions |
| Wang J [12] | 1 | 0 | 1 | 0 | 1 | 1 | 1 | 1 | 1 | 1 | 1 | 1 | 1 | 1 | 1 | 1 | 1 | 1 | 16 | Reliable without restrictions |
| Sharma CS [13] | 1 | 0 | 1 | 0 | 1 | 1 | 1 | 1 | 1 | 1 | 1 | 1 | 1 | 1 | 1 | 1 | 1 | 1 | 16 | Reliable without restrictions |
| SYRCLE Checklist of Study Quality | ||||||||||||||||||||
| Reference (In Vivo) | Selection Bias | Performance Bias | Detection Bias | Attrition Bias | Reporting Bias | Other | ||||||||||||||
| SG | BC | AC | RH | BI | ROA | BOA | IOD | SOR | ||||||||||||
| Bayat M [10] | Unclear | Low | Unclear | Low | Unclear | Unclear | Unclear | Low | Low | Low | ||||||||||
| Afshari-Kaveh M [18] | Unclear | Low | Unclear | Low | Unclear | Low | Unclear | Low | Low | Low | ||||||||||
| Abdelhalim MAK [11] | Unclear | Unclear | Unclear | Low | Unclear | Unclear | Unclear | Low | Low | Low | ||||||||||
| Moradi A [8] | Unclear | Unclear | Unclear | Low | Unclear | Unclear | Unclear | Low | Low | Low | ||||||||||
| Zhang Q [27] | Unclear | Unclear | Unclear | Low | Unclear | Unclear | Unclear | Low | Low | Low | ||||||||||
| Kong L [19] | Unclear | Unclear | Unclear | Low | Unclear | Low | Unclear | Low | Low | Low | ||||||||||
| Abdelkarem HM [29] | Unclear | Low | Unclear | Low | Unclear | Unclear | Unclear | Low | Low | Low | ||||||||||
| Shang S [25] | Unclear | Unclear | Unclear | Low | Unclear | Unclear | Unclear | Low | Low | Low | ||||||||||
| Yin N [26] | Unclear | Unclear | Unclear | Unclear | Unclear | Unclear | Unclear | Low | Low | Low | ||||||||||
| Azim SA [28] | Unclear | Unclear | Unclear | Low | Unclear | Unclear | Unclear | Low | Low | Low | ||||||||||
| Al-Rasheed NM [9] | Unclear | Unclear | Unclear | Low | Unclear | Unclear | Unclear | Low | Low | Low | ||||||||||
| Baky NA [17] | Unclear | Low | Unclear | Low | Unclear | Unclear | Unclear | Low | Low | Low | ||||||||||
| Studies | No. | SMD | 95%CI | pE-Value | I2 | pH-Value | Model | Egger |
|---|---|---|---|---|---|---|---|---|
| VE (in vitro) | ||||||||
| Cell viability | 25 | 4.89 | 3.65, 6.14 | <0.001 | 85.2 | <0.001 | R | <0.001 |
| Caspase-3 | 9 | −2.07 | −3.25, −0.89 | 0.001 | 80.7 | <0.001 | R | <0.001 |
| ROS | 10 | −13.07 | −17.85, −8.30 | <0.001 | 90.8 | <0.001 | R | <0.001 |
| VC (in vitro) | ||||||||
| Cell viability | 4 | 4.19 | 2.37, 6.01 | <0.001 | 45.3 | 0.140 | F | <0.001 |
| ROS | 6 | −6.77 | −12.18, −1.36 | 0.014 | 85.4 | <0.001 | R | 0.002 |
| VE (in vivo) | ||||||||
| Body weight | 6 | 0.52 | −0.52, 1.56 | 0.328 | 78.8 | <0.001 | R | 0.081 |
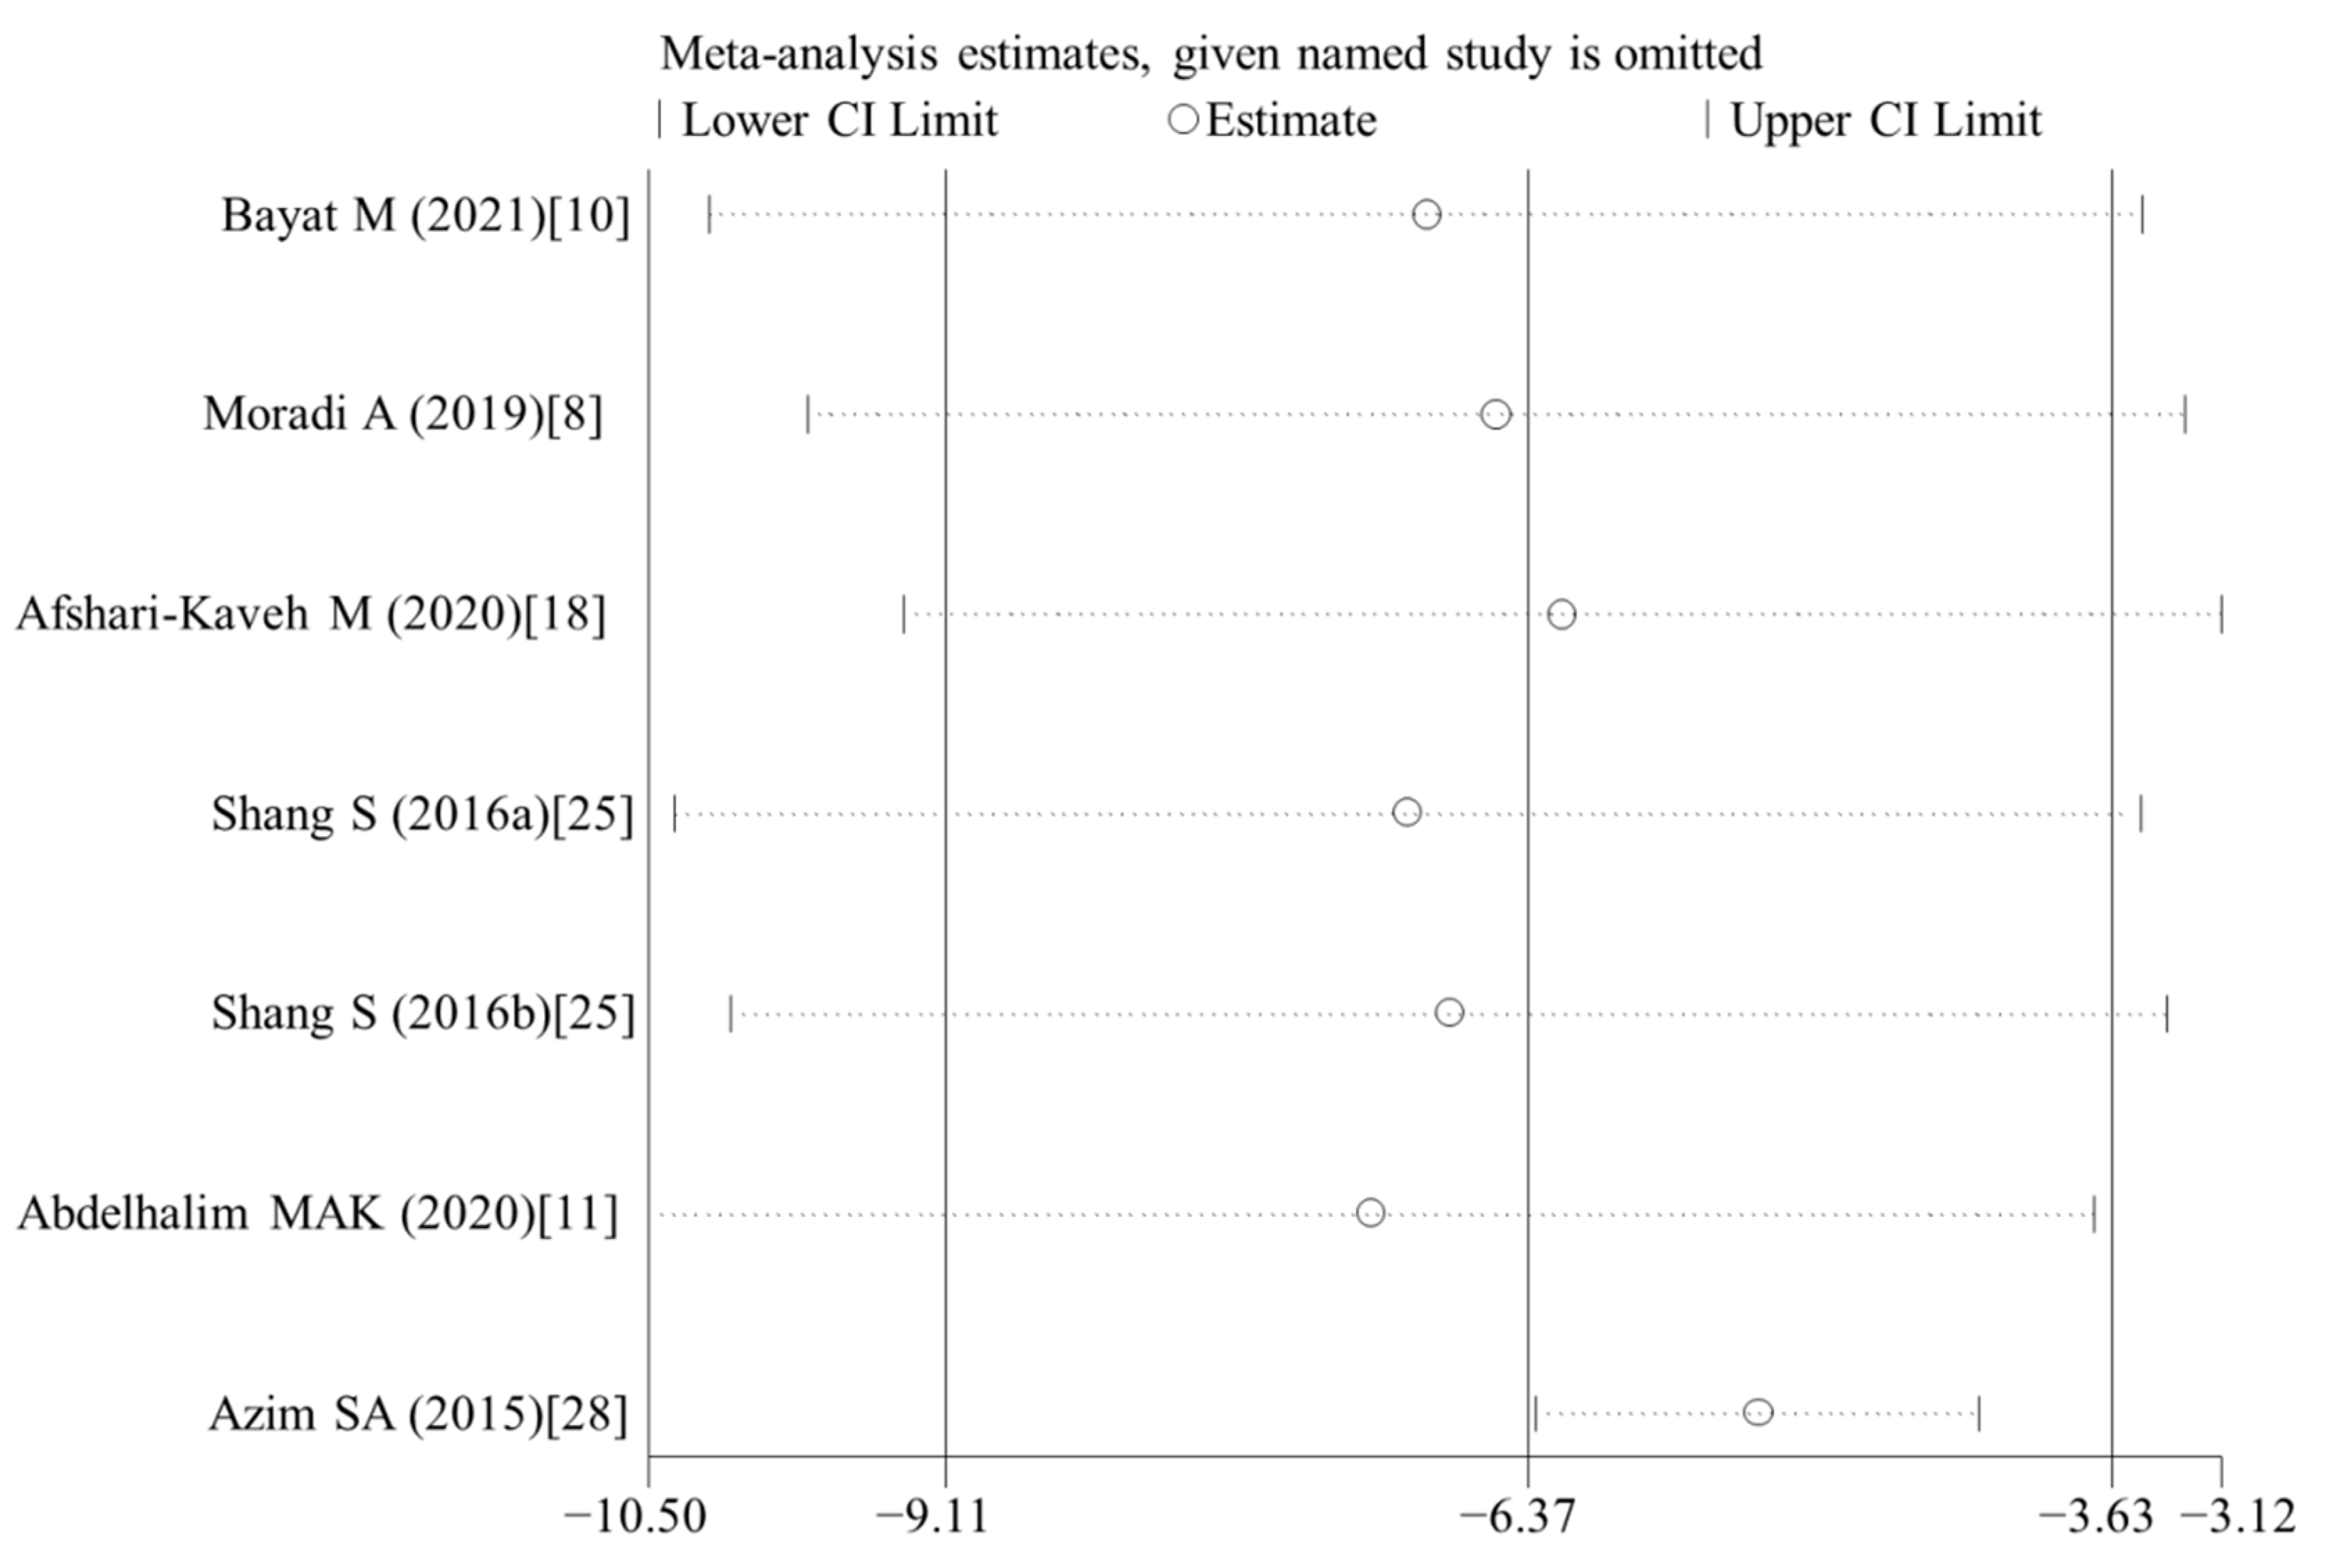
| MDA | 7 | −6.37 | −9.11, −3.63 | <0.001 | 82.9 | <0.001 | R | <0.001 |
| TOS | 3 | −5.89 | −9.94, −1.84 | 0.004 | 84.1 | 0.002 | R | 0.006 |
| TAC | 3 | 2.48 | 1.55, 3.41 | <0.001 | 34.5 | 0.217 | F | 0.035 |
| OSI | 2 | −4.19 | −5.73, −2.64 | <0.001 | 9.2 | 0.294 | F | - |
| SOD activity | 3 | 4.19 | 0.70, 7.66 | 0.019 | 86.0 | 0.001 | R | 0.016 |
| GPx activity | 3 | 3.99 | 2.04, 5.93 | <0.001 | 58.8 | 0.088 | R | 0.023 |
| CAT activity | 2 | 17.33 | −9.19, 43.85 | 0.200 | 92.9 | <0.001 | R | - |
| GSH | 6 | 5.26 | 1.73, 8.80 | 0.004 | 93.3 | 0.000 | R | 0.004 |
| SOD mRNA | 2 | 7.52 | −2.96, 18.00 | 0.159 | 91.5 | 0.001 | R | - |
| GPx mRNA | 2 | 13.17 | 1.21, 25.12 | 0.031 | 84.3 | 0.012 | R | - |
| Nrf2 mRNA | 2 | −27.48 | −88.49, 33.54 | 0.377 | 97.4 | <0.001 | R | - |
| TNF-α | 7 | −3.29 | −6.24, −0.35 | 0.028 | 92.7 | <0.001 | R | 0.251 |
| IL-6 | 6 | −13.23 | −17.71, −8.76 | <0.001 | 86.1 | <0.001 | R | <0.001 |
| CRP | 4 | −5.60 | −6.63, −4.57 | <0.001 | 30.7 | 0.228 | F | <0.001 |
| IgE | 3 | −4.08 | −5.20, −2.95 | <0.001 | 0.0 | 0.631 | F | 0.009 |
| NF-κB mRNA | 2 | −26.00 | −57.03, 5.02 | 0.100 | 94.4 | <0.001 | R | - |
| Caspase-3 | 6 | −7.10 | −10.49, −3.72 | <0.001 | 92.2 | <0.001 | R | 0.019 |
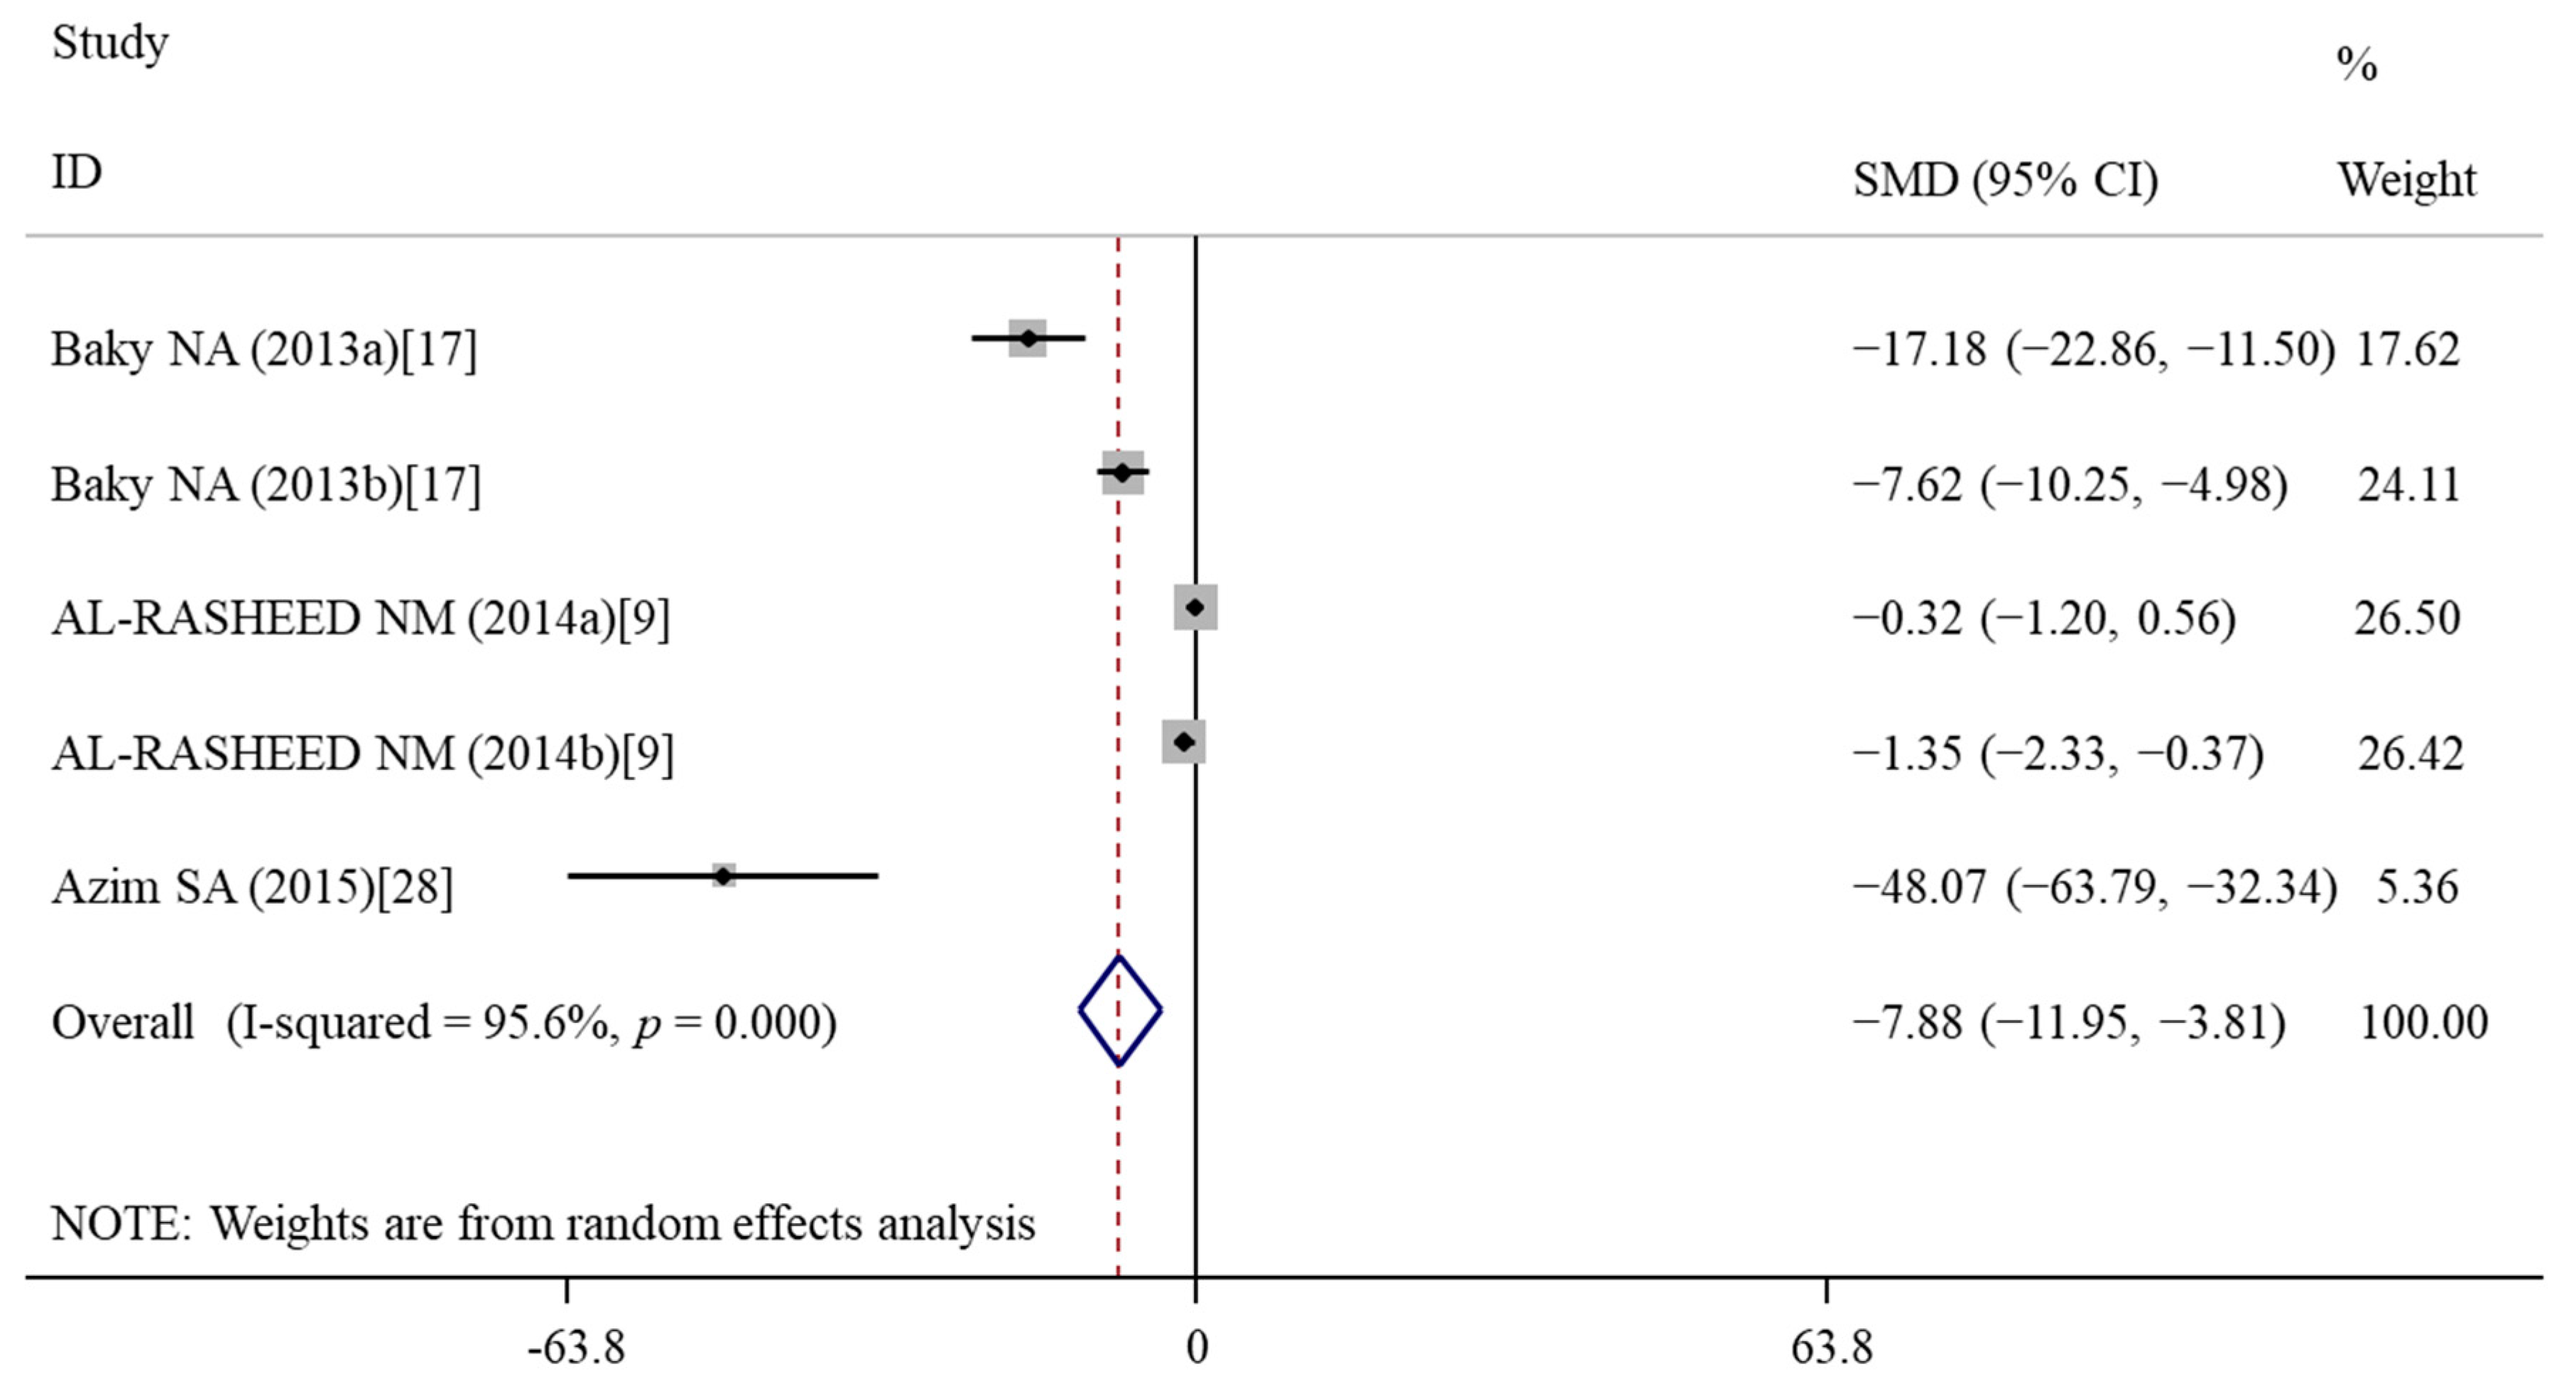
| Tail length | 5 | −7.88 | −11.95, −3.81 | <0.001 | 95.6 | <0.001 | R | 0.001 |
| Tail DNA % | 5 | −0.94 | −2.66, 0.78 | 0.283 | 90.5 | <0.001 | R | 0.006 |
| ALT | 4 | −7.35 | −11.41, −3.29 | <0.001 | 90.7 | <0.001 | R | 0.021 |
| AST | 2 | −14.61 | −35.90, 6.69 | 0.179 | 95.8 | <0.001 | R | - |
| VC (in vivo) | ||||||||
| MDA | 2 | −1.49 | −4.13, 1.15 | 0.268 | 86.7 | 0.006 | R | - |
| SOD | 2 | 2.70 | −4.04, 9.43 | 0.433 | 94.7 | <0.001 | R | - |
| CAT | 2 | 10.17 | −10.17, 30.50 | 0.327 | 94.7 | <0.001 | R | - |
| VA (in vivo) | ||||||||
| Body weight | 2 | 2.10 | 0.06, 4.14 | 0.043 | 71.1 | 0.063 | R | - |
| MDA | 3 | −3.17 | −5.50, −0.84 | 0.008 | 78.6 | 0.009 | R | 0.050 |
| TOS | 3 | −1.34 | −2.09, −0.59 | <0.001 | 16.6 | 0.302 | F | <0.001 |
| TAC | 3 | 1.75 | −0.25, 3.75 | 0.086 | 81.8 | 0.004 | R | 0.038 |
| SOD | 3 | 1.84 | 1.01, 2.67 | <0.001 | 42.2 | 0.177 | F | <0.001 |
| GPx | 3 | 2.73 | 1.77, 3.70 | <0.001 | 0.0 | 0.441 | F | 0.008 |
| OSI | 2 | −3.41 | −8.63, 1.80 | 0.200 | 90.6 | 0.001 | R | - |
| CAT | 2 | 3.22 | 1.04, 5.40 | 0.004 | 61.6 | 0.107 | R | - |
| SOD mRNA | 2 | 9.75 | −4.80, 24.31 | 0.189 | 92.4 | <0.001 | R | - |
| GPx mRNA | 2 | 13.32 | −4.24, 30.87 | 0.137 | 91.2 | 0.001 | R | - |
| VA + VE (in vivo) | ||||||||
| MDA | 2 | −8.42 | −11.17, −5.67 | 0.013 | 0.0 | 0.461 | F | - |
| TOS | 2 | −3.90 | −10.54, 2.75 | 0.250 | 92.4 | <0.001 | R | - |
| TAC | 2 | 2.00 | −0.01, 4.01 | 0.051 | 71.4 | 0.062 | R | - |
| SOD | 2 | 2.45 | −0.29, 5.20 | 0.080 | 80.6 | 0.023 | R | - |
| GPx | 2 | 3.67 | −0.79, 8.12 | 0.107 | 87.2 | 0.005 | R | - |
| Studies | No. | SMD | 95%CI | pE-Value | I2 | pH-Value | Model | |
|---|---|---|---|---|---|---|---|---|
| VE (in vitro) | ||||||||
| Cell viability | ||||||||
| Nanomaterials type | TiO2NPs | 1 | 30.78 | 18.42, 43.14 | <0.001 | - | - | R |
| SWCNTs | 12 | 3.89 | 2.48, 5.30 | <0.001 | 83.8 | <0.001 | R | |
| AgNPs | 6 | 11.03 | 5.23, 16.83 | <0.001 | 91.8 | <0.001 | R | |
| CoNPs | 6 | 2.64 | 1.15, 4.12 | <0.001 | 46.6 | 0.096 | R | |
| Duration | 24 h | 19 | 4.68 | 3.24, 6.13 | <0.001 | 85.1 | <0.001 | R |
| 48 h | 6 | 5.63 | 2.73, 8.52 | <0.001 | 87.2 | <0.001 | R | |
| Dosage | ≤1000 μM | 21 | 4.15 | 2.92, 5.38 | <0.001 | 83.8 | <0.001 | R |
| >1000 μM | 4 | 9.18 | 4.82, 13.53 | <0.001 | 77.2 | 0.004 | R | |
| Caspase-3 | ||||||||
| Nanomaterials type | TiO2NPs | 1 | −20.37 | −28.58, −12.15 | <0.001 | - | - | R |
| SWCNTs | 8 | −1.58 | −2.43, −0.72 | <0.001 | 66.2 | 0.004 | R | |
| Duration | 24 h | 5 | −1.51 | −3.12, 0.10 | 0.066 | 82.9 | <0.001 | R |
| 48 h | 4 | −2.78 | −4.53, −1.03 | 0.002 | 75.9 | 0.006 | R | |
| Dosage | ≤1000 μM | 7 | −1.73 | −2.97, −0.46 | 0.008 | 79.9 | <0.001 | R |
| >1000 μM | 2 | −3.85 | −9.10, 1.39 | 0.150 | 89.5 | 0.002 | R | |
| ROS | ||||||||
| Nanomaterials type | TiO2NPs | 1 | −4.08 | −6.02, −2.14 | <0.001 | - | - | R |
| SWCNTs | 8 | −17.07 | −24.40, −9.75 | <0.001 | 92.6 | <0.001 | R | |
| CoNPs | 1 | −13.91 | −17.85, −8.30 | 0.005 | - | - | R | |
| Duration | 24 h | 6 | −8.02 | −11.75, −4.30 | <0.001 | 86.7 | <0.001 | R |
| 48 h | 4 | −46.94 | −76.37, −17.51 | 0.002 | 90.7 | <0.001 | R | |
| Dosage | ≤1000 μM | 8 | −10.95 | −15.34, −6.55 | <0.001 | 89.6 | <0.001 | R |
| >1000 μM | 2 | −91.15 | −242.86, 60.57 | 0.239 | 93.7 | <0.001 | R | |
| VE (in vivo) | ||||||||
| Body weight | ||||||||
| Nanomaterials type | ZnONPs | 4 | 0.07 | −1.08, 1.23 | 0.901 | 80.7 | 0.001 | R |
| TiO2NPs | 1 | 1.04 | −0.18, 2.26 | 0.095 | - | - | R | |
| AgNPs | 1 | 3.04 | 0.40, 5.69 | 0.024 | - | - | R | |
| Dosage | ≤100 mg/kg | 5 | 0.81 | −0.48, 2.11 | 0.220 | 81.0 | <0.001 | R |
| >100 mg/kg | 1 | 0.52 | −0.51, −1.40 | 0.267 | - | - | R | |
| MDA | ||||||||
| Nanomaterials type | ZnONPs | 1 | −5.14 | −7.66, −2.62 | <0.001 | - | - | R |
| TiO2NPs | 3 | −17.00 | −28.58, −5.42 | 0.004 | 93.3 | <0.001 | R | |
| GNPs | 1 | −4.03 | −6.12, −1.93 | <0.001 | - | - | R | |
| GO | 2 | −5.31 | −6.99, −3.63 | <0.001 | 0.0 | 0.688 | F | |
| Dosage | ≤100 mg/kg | 6 | −7.11 | −10.50, −3.71 | <0.001 | 84.8 | <0.001 | R |
| >100 mg/kg | 1 | −4.03 | −6.12, −1.93 | <0.001 | - | - | R | |
| Duration | ≤2 weeks | 2 | −41.95 | −113.95, −30.05 | 0.253 | 96.7 | <0.001 | R |
| >2 weeks | 5 | −5.15 | −6.26, −4.05 | <0.001 | 0.0 | 0.509 | F | |
| Sample source | Liver | 3 | −14.14 | −24.25, −4.03 | 0.006 | 93.6 | <0.001 | R |
| Spleen | 1 | −7.72 | −11.29, −4.16 | <0.001 | - | - | R | |
| Lung | 2 | −5.31 | −6.99, −3.63 | <0.001 | 0.0 | 0.688 | F | |
| Kidney | 1 | −4.03 | −6.12, −1.93 | <0.001 | - | - | R | |
| Animal model | Mice | 3 | −12.17 | −20.98, −3.37 | 0.007 | 93.6 | <0.001 | R |
| Rats | 4 | −5.39 | −6.88, −3.90 | <0.001 | 19.1 | 0.295 | F | |
| GSH | ||||||||
| Nanomaterials type | ZnONPs | 2 | 8.54 | 3.04, 14.04 | 0.002 | 83.9 | 0.013 | R |
| TiO2NPs | 1 | 6.96 | 4.52, 9.39 | <0.001 | - | - | R | |
| GNPs | 1 | 3075.00 | 1727.35, 4422.65 | <0.001 | - | - | R | |
| GO | 2 | 1.46 | −0.23, 3.16 | 0.090 | 72.3 | 0.057 | R | |
| Dosage | ≤100 mg/kg | 5 | 5.16 | 2.10, 8.22 | 0.001 | 92.7 | <0.001 | R |
| >100 mg/kg | 1 | 3075.00 | 1727.35, 4422.65 | <0.001 | - | - | R | |
| Duration | ≤2 weeks | 2 | 1463.89 | −1.5 × 10³, 4465.95 | 0.339 | 95.0 | <0.001 | R |
| >2 weeks | 4 | 4.69 | 1.38, 8.01 | 0.005 | 92.9 | <0.001 | R | |
| Sample source | Liver | 3 | 7.74 | 4.97, 10.52 | <0.001 | 67.9 | 0.044 | R |
| Lung | 2 | 1.46 | −0.23, 3.16 | 0.090 | 72.3 | 0.057 | R | |
| Kidney | 1 | 3075.00 | 1727.35, 4422.65 | <0.001 | - | - | R | |
| Animal model | Mice | 3 | 3.14 | 0.18, 6.10 | 0.037 | 90.9 | <0.001 | R |
| Rats | 3 | 5.26 | 8.93, −2.18 | 0.115 | 92.3 | <0.001 | R | |
| TNF-α | ||||||||
| Nanomaterials type | ZnONPs | 5 | −2.68 | −6.96, 1.60 | 0.219 | 94.7 | <0.001 | R |
| TiO2NPs | 2 | −4.53 | −8.13, −0.93 | 0.014 | 84.6 | 0.011 | R | |
| Dosage | ≤100 mg/kg | 6 | −5.14 | −6.39, −3.90 | <0.001 | 57.5 | 0.038 | R |
| >100 mg/kg | 1 | 10.00 | 6.62, 13.38 | <0.001 | - | - | R | |
| Duration | ≤2 weeks | 2 | −4.53 | −8.13, −0.93 | 0.014 | 84.6 | 0.011 | R |
| >2 weeks | 5 | −2.68 | −6.96, 1.60 | 0.219 | 94.7 | <0.001 | R | |
| Sample source | Liver | 2 | −4.53 | −8.13, −0.93 | 0.014 | 84.6 | 0.011 | R |
| Serum | 5 | −2.68 | −6.96, 1.60 | 0.219 | 94.7 | <0.001 | R | |
| Animal model | Mice | 1 | −6.45 | −8.74, −4.17 | <0.001 | - | - | R |
| Rats | 6 | −2.75 | −6.10, 0.60 | 0.108 | 93.6 | <0.001 | R | |
| IL-6 | ||||||||
| Nanomaterials type | ZnONPs | 5 | −13.23 | −14.18, −20.08 | <0.001 | 88.9 | <0.001 | R |
| TiO2NPs | 1 | −9.88 | −13.22, −6.53 | <0.001 | - | - | R | |
| Dosage | ≤100 mg/kg | 5 | −14.71 | −18.50, −10.91 | <0.001 | 67.0 | 0.017 | R |
| >100 mg/kg | 1 | −5.99 | −8.13, −3.85 | <0.001 | - | - | R | |
| Duration | ≤2 weeks | 1 | −9.88 | −13.22, −6.53 | <0.001 | - | - | R |
| >2 weeks | 5 | −13.23 | −14.18, −20.08 | <0.001 | 88.9 | <0.001 | R | |
| Sample source | Liver | 5 | −13.23 | −14.18, −20.08 | <0.001 | 88.9 | <0.001 | R |
| Serum | 1 | −9.88 | −13.22, −6.53 | <0.001 | - | - | R | |
| Animal model | Mice | 1 | −9.88 | −13.22, −6.53 | <0.001 | - | - | R |
| Rats | 5 | −13.23 | −14.18, −20.08 | <0.001 | 88.9 | <0.001 | R | |
| Caspase-3 | ||||||||
| Nanomaterials type | ZnONPs | 4 | −10.17 | −10.45, −4.90 | <0.001 | 91.0 | <0.001 | |
| TiO2NPs | 1 | −4.39 | −6.07, −2.71 | <0.001 | - | - | ||
| AgNPs | 1 | −0.46 | −2.09, 1.18 | 0.584 | - | - | ||
| Duration | ≤2 weeks | 1 | −4.39 | −6.07, −2.71 | <0.001 | - | - | |
| >2 weeks | 5 | −8.01 | −12.55, −3.47 | 0.001 | 93.8 | <0.001 | ||
| Sample source | Liver | 3 | −11.01 | −18.55, −3.48 | 0.004 | 92.6 | <0.001 | |
| Brain | 1 | −0.46 | −2.09, 1.18 | 0.584 | - | - | ||
| Heart | 2 | −6.32 | −11.21, −1.43 | 0.011 | 87.6 | 0.004 | ||
| Animal model | Mice | 1 | −4.39 | −6.07, −2.71 | <0.001 | - | - | |
| Rats | 5 | −8.01 | −12.55, −3.47 | 0.001 | 93.8 | <0.001 | ||
| Tail length | ||||||||
| Nanomaterials type | ZnONPs | 4 | −5.21 | −8.60, −1.82 | 0.003 | 94.7 | <0.001 | R |
| TiO2NPs | 1 | −48.07 | −63.79, −32.34 | <0.001 | - | - | R | |
| Sample source | Liver | 3 | −3.35 | −7.19, 0.50 | 0.088 | 94.6 | <0.001 | R |
| Heart | 2 | −12.05 | −21.40, −2.70 | 0.012 | 88.8 | 0.003 | R | |
| Animal model | Mice | 1 | −48.07 | −63.79, −32.34 | <0.001 | - | - | R |
| Rats | 4 | −5.21 | −8.60, −1.82 | 0.003 | 94.7 | <0.001 | R | |
| Tail DNA % | ||||||||
| Nanomaterials type | ZnONPs | 4 | −0.73 | −1.42, −0.05 | 0.035 | 53.4 | <0.092 | R |
| TiO2NPs | 1 | −166.00 | −220.23, −111.77 | <0.001 | - | - | R | |
| Sample source | Liver | 3 | −1.11 | −4.79, 2.58 | 0.557 | 94.4 | <0.001 | R |
| Heart | 2 | −1.19 | −2.57, 0.18 | 0.089 | 74.1 | 0.050 | R | |
| Animal model | Mice | 1 | −166.00 | −220.23, −111.77 | <0.001 | - | - | R |
| Rats | 4 | −0.73 | −1.42, −0.05 | 0.035 | 53.4 | <0.092 | R |
Publisher’s Note: MDPI stays neutral with regard to jurisdictional claims in published maps and institutional affiliations. |
© 2022 by the authors. Licensee MDPI, Basel, Switzerland. This article is an open access article distributed under the terms and conditions of the Creative Commons Attribution (CC BY) license (https://creativecommons.org/licenses/by/4.0/).
Share and Cite
Xie, D.; Hu, J.; Yang, Z.; Wu, T.; Xu, W.; Meng, Q.; Cao, K.; Luo, X. Vitamin Supplementation Protects against Nanomaterial-Induced Oxidative Stress and Inflammation Damages: A Meta-Analysis of In Vitro and In Vivo Studies. Nutrients 2022, 14, 2214. https://0-doi-org.brum.beds.ac.uk/10.3390/nu14112214
Xie D, Hu J, Yang Z, Wu T, Xu W, Meng Q, Cao K, Luo X. Vitamin Supplementation Protects against Nanomaterial-Induced Oxidative Stress and Inflammation Damages: A Meta-Analysis of In Vitro and In Vivo Studies. Nutrients. 2022; 14(11):2214. https://0-doi-org.brum.beds.ac.uk/10.3390/nu14112214
Chicago/Turabian StyleXie, Dongli, Jianchen Hu, Zhenhua Yang, Tong Wu, Wei Xu, Qingyang Meng, Kangli Cao, and Xiaogang Luo. 2022. "Vitamin Supplementation Protects against Nanomaterial-Induced Oxidative Stress and Inflammation Damages: A Meta-Analysis of In Vitro and In Vivo Studies" Nutrients 14, no. 11: 2214. https://0-doi-org.brum.beds.ac.uk/10.3390/nu14112214