
Effect of Dietary and Lifestyle Interventions on the Amelioration of NAFLD in Patients with Metabolic Syndrome: The FLIPAN Study

 , ,
, ,  , , ,
, , ,
Abstract
:1. Introduction
2. Methods
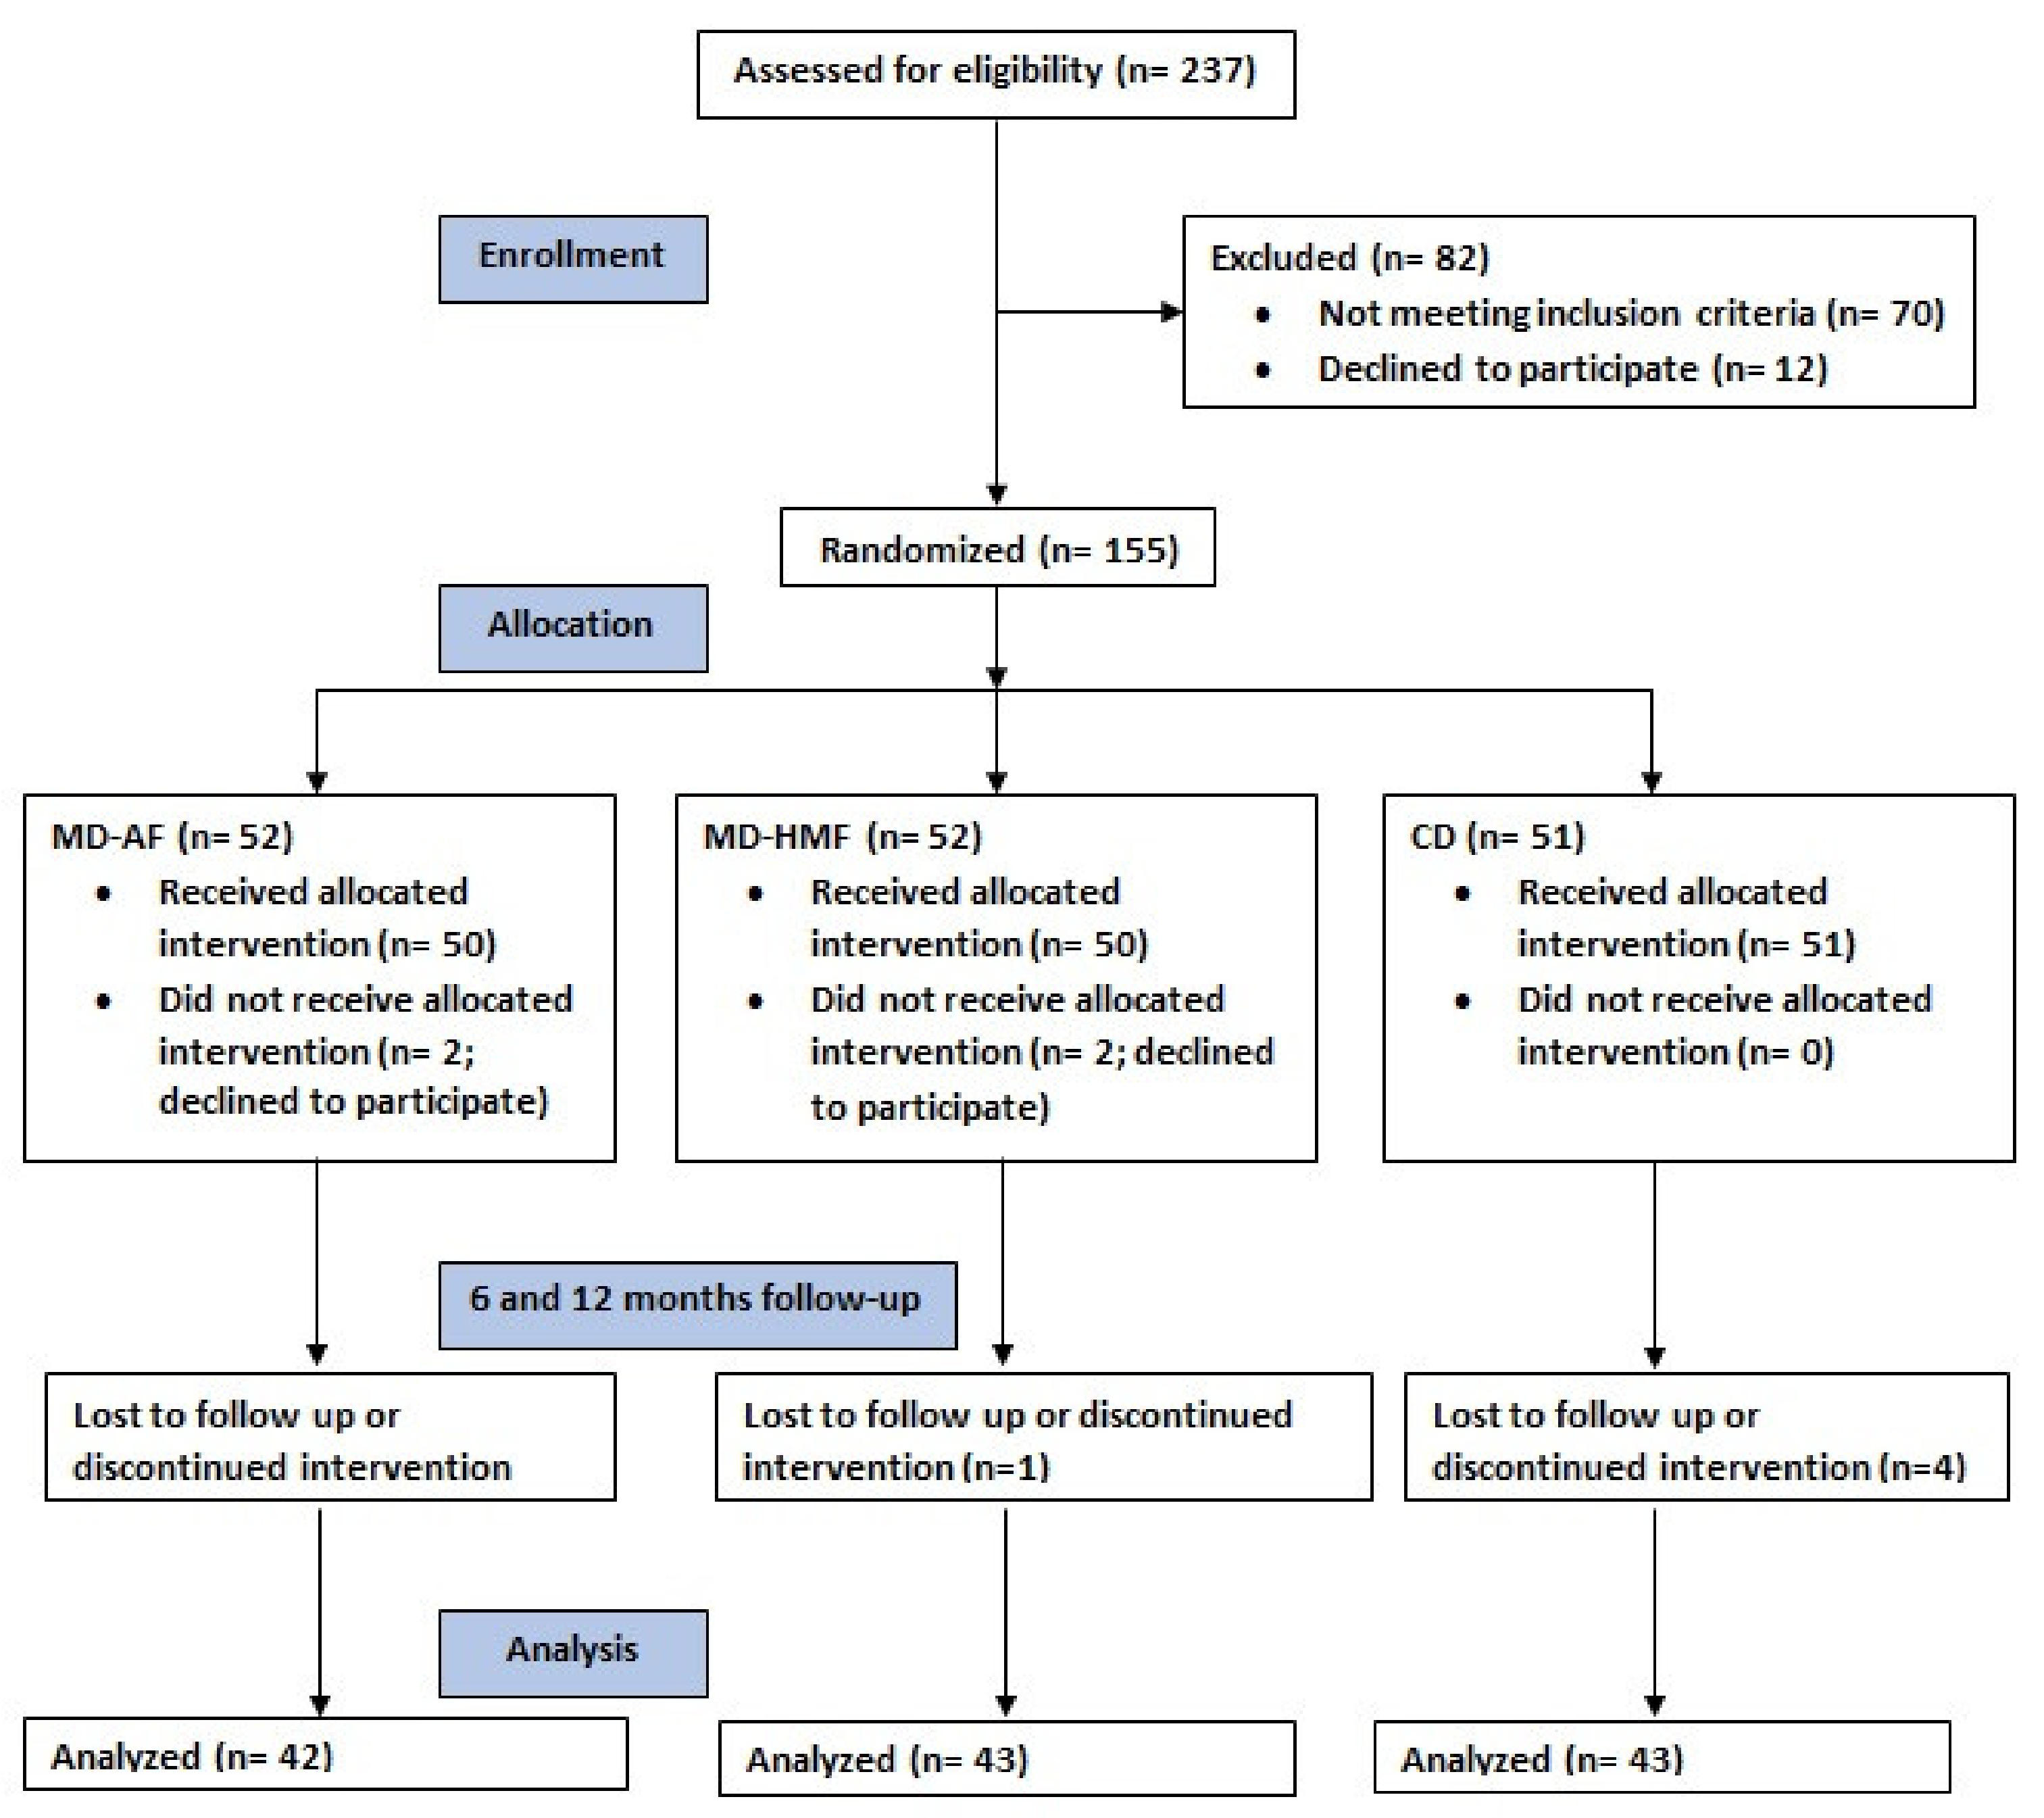
2.1. Design
2.2. Ethics
2.3. Subjects
2.4. Dietary Intake Assessment
2.5. Anthropometrics
2.6. Blood Collection and Biochemical Analysis
2.7. Diagnosis of NAFLD
2.8. Statistics
3. Results
4. Discussion
5. Strengths and Limitations
6. Conclusions
Author Contributions
Funding
Institutional Review Board Statement
Informed Consent Statement
Data Availability Statement
Acknowledgments
Conflicts of Interest
References
- Wong, R.J.; Aguilar, M.; Cheung, R.; Perumpail, R.B.; Harrison, S.A.; Younossi, Z.M. Non-alcoholic steatohepatitis is the second leading etiology of liver disease among adults awaiting liver transplantation in the United States. Gastroenterology 2015, 148, 547–555. [Google Scholar] [CrossRef] [PubMed]
- Younossi, Z.M.; Marchesini, G.; Pinto-Cortez, H.; Petta, S. Epidemiology of non-alcoholic fatty liver disease and non-alcoholic steatohepatitis: Implications for liver transplantation. Transplantation 2019, 103, 22–27. [Google Scholar] [CrossRef] [PubMed]
- Buzzetti, E.; Pinzani, M.; Tsochatzis, E.A. The multiple-hit pathogenesis of non-alcoholic fatty liver disease (NAFLD). Metabolism 2016, 65, 1038–1048. [Google Scholar] [CrossRef] [PubMed]
- Gadiparthi, C.; Spatz, M.; Greenberg, S.; Iqbal, U.; Kanna, S.; Satapathy, S.K.; Broder, A.; Ahmed, A. NAFLD epidemiology, emerging pharmacotherapy, liver transplantation implications and the trends in the United States. J. Clin. Trans. Hepatol. 2020, 8, 215–221. [Google Scholar] [CrossRef]
- European Association for the Study of the Liver (EASL); European Association for the Study of Diabetes (EASD); European Association for the Study of Obesity (EASO). EASL-EASD-EASO clinical practice guidelines for the management of non-alcoholic fatty liver disease. J. Hepatol. 2016, 64, 1388–1402. [Google Scholar] [CrossRef]
- Sotos-Prieto, M.; Ortolá, R.; Ruiz-Canela, M.; Garcia-Esquinas, E.; Martínez-Gómez, D.; Lopez-Garcia, E.; Martínez-González, M.A.; Rodriguez-Artalejo, F. Association between the Mediterranean lifestyle, metabolic syndrome and mortality: A whole-country cohort in Spain. Cardiovasc. Diabetol. 2021, 20, 5. [Google Scholar] [CrossRef]
- Anania, C.; Perla, F.M.; Olivero, F.; Pacifico, L.; Chiesa, C. Mediterranean diet and nonalcoholic fatty liver disease. World J. Gastroenterol. 2018, 24, 2083–2094. [Google Scholar] [CrossRef]
- Kontogianni, M.D.; Tileli, N.; Margariti, A.; Georgoulis, M.; Deutsch, M.; Tiniakos, D.; Fragopoulou, E.; Zafiropoulou, R.; Manios, Y.; Papatheodoridis, G. Adherence to the Mediterranean diet is associated with the severity of non-alcoholic fatty liver disease. Clin. Nutr. 2014, 33, 678–683. [Google Scholar] [CrossRef]
- International Diabetic Federation (IDF). Consensus Statement—The IDF Consensus Worldwide Definition of the Metabolic Syndrome. 2006. 24p. Available online: https://www.idf.org/e-library/consensus-statements/60-idfconsensus-worldwidedefinitionof-the-metabolic-syndrome.html (accessed on 8 January 2022).
- Chalasani, N.; Younossi, Z.; Lavine, J.E.; Diehl, A.M.; Brunt, E.M.; Cusi, K.; Charlton, M.; Sanyal, A.J. The diagnosis and management of non-alcoholic fatty liver disease: Practice guideline by the American Association for the Study of Liver Diseases, American College of Gastroenterology, and the American Gastroenterological Association. Am. J. Gastroenterol. 2012, 107, 811–826. [Google Scholar] [CrossRef]
- Houttu, V.; Csader, S.; Nieuwdorp, M.; Holleboom, A.G.; Schwab, U. Dietary Interventions in Patients with Non-alcoholic Fatty Liver Disease: A Systematic Review and Meta-Analysis. Front. Nutr. 2021, 8, 716783. [Google Scholar] [CrossRef]
- Chalasani, N.; Younossi, Z.; Lavine, J.E.; Diehl, A.M.; Brunt, E.M.; Charlton, M.; Cusi, K.; Rinella, M.; Sanyal, J.A. The diagnosis and management of non-alcoholic fatty liver disease: Practice guidance from the American Association for the Study of Liver Diseases. Hepatology 2018, 67, 328–357. [Google Scholar] [CrossRef] [PubMed]
- U.S. Department of Health and Human Services; U.S. Department of Agriculture. 2015–2020 Dietary Guidelines for Americans. 2015. Available online: http://health.gov/dietaryguidelines/2015/guidelines/ (accessed on 3 January 2022).
- World Health Organization (WHO). Global recommendations on physical activity for health. Geneva World Heal Organ. 2010. 60p. Available online: https://www.who.int/publications/i/item/9789241599979 (accessed on 3 January 2022).
- De La Iglesia, R.; Lopez-Legarrea, P.; Abete, I.; Bondia-Pons, I.; Navas-Carretero, S.; Forga, L.; Martinez, J.A.; Zulet, M.A. A new dietary strategy for long-term treatment of the metabolic syndrome is compared with the American heart association (AHA) guidelines: The MEtabolic Syndrome REduction in NAvarra (RESMENA) project. Br. J. Nutr. 2014, 111, 643–652. [Google Scholar] [CrossRef] [PubMed] [Green Version]
- Zulet, A.; Bondia-Pons, I.; Abete, I.; de la Iglesia, R.; López-Legarrea, P.; Forga, L.; Navas-Carretero, S. The reduction of the metabolyc syndrome in Navarra-Spain (RESMENA-S) study; A multidisciplinary strategy based on chrononutrition and nutritional education, together with dietetic and psychological control. Nutr. Hosp. 2011, 26, 16–26. [Google Scholar] [PubMed]
- Estruch, R.; Ros, E.; Salas-Salvadó, J.; Covas, M.I.; Corella, D.; Arós, F.; Gómez-Gracia, E.; Ruiz-Gutiérrez, V.; Fiol, M.; Lapetra, J.; et al. Primary prevention of cardiovascular disease with a Mediterranean diet. N. Engl. J. Med. 2013, 368, 1279–1290. [Google Scholar] [CrossRef] [Green Version]
- Mascaró, C.M.; Bouzas, C.; Tur, J.A. Association between Non-Alcoholic Fatty Liver Disease and Mediterranean Lifestyle: A Systematic Review. Nutrients 2021, 14, 49. [Google Scholar] [CrossRef]
- Sargeant, J.A.; Bawden, S.; Aithal, G.P.; Simpson, E.J.; Macdonald, I.A.; Turner, M.C.; Cegielski, J.; Smith, K.; Dorling, J.; Gowland, P.A.; et al. Effects of sprint interval training on ectopic lipids and tissue-specific insulin sensitivity in men with non-alcoholic fatty liver disease. Eur. J. Appl. Physiol. 2018, 118, 817–828. [Google Scholar] [CrossRef]
- Fernández-Ballart, J.D.; Piñol, J.L.; Zazpe, I.; Corella, D.; Carrasco, P.; Toledo, E.; Perez-Bauer, M.; Martínez-González, M.Á.; Salas-Salvadó, J.; Martín-Moreno, J.M. Relative validity of a semi-quantitative food-frequency questionnaire in an elderly Mediterranean population of Spain. Br. J. Nutr. 2010, 103, 1808–1816. [Google Scholar] [CrossRef] [Green Version]
- Moreiras, O.; Carbajal, A.; Cabrera, L.; Cuadrado, C. Food Composition Tables (Spanish), 19th ed.; Pirámide: Madrid, Spain, 2018. [Google Scholar]
- Schröder, H.; Fitó, M.; Estruch, R.; Martínez-González, M.A.; Corella, D.; Salas-Salvadó, J.; Lamuela-Raventós, R.; Ros, E.; Salaverría, I.; Fiol, M.; et al. A Short screener is valid for assessing Mediterranean diet adherence among older Spanish men and women. J. Nutr. 2011, 141, 1140–1145. [Google Scholar] [CrossRef] [Green Version]
- Elosua, R.; Garcia, M.; Aguilar, A.; Molina, L.; Covas, M.I.; Marrugat, J. Validation of the Minnesota leisure time physical activity questionnaire in Spanish women. Med. Sci. Sports Exerc. 2000, 32, 1431–1437. [Google Scholar] [CrossRef]
- Elosua, R.; Marrugat, J.; Molina, L.; Pons, S.; Pujol, E. Validation of the Minnesota leisure time physical activity questionnaire in Spanish men. Am. J. Epidemiol. 1994, 139, 1197–1209. [Google Scholar] [CrossRef]
- Friedewald, W.T.; Levy, R.I.; Fredrickson, D.S. Estimation of the concentration of low-density lipoprotein cholesterol in plasma, without use of the preparative ultracentrifuge. Clin. Chem. 1972, 18, 499–502. [Google Scholar] [CrossRef] [PubMed]
- Tang, A.; Tan, J.; Sun, M.; Hamilton, G.; Bydder, M.; Wolfson, T.; Gamst, A.C.; Middleton, M.; Brunt, E.M.; Loomba, R.; et al. Non-alcoholic fatty liver disease: MR imaging of liver proton density fat fraction to assess hepatic steatosis. Radiology 2013, 267, 422–431. [Google Scholar] [CrossRef] [PubMed] [Green Version]
- Singh, D.; Das, C.D.; Baruah, M.P. Imaging of non-alcoholic fatty liver disease: A road less travelled. Indian J. Endocrinol. Metab. 2013, 17, 990–995. [Google Scholar] [PubMed]
- Gargallo Fernández, M.; Basulto Marset, J.; Breton Lesmes, I.; Quiles Izquierdo, J.; Formiguera Sala, X.; Salas-Salvadó, J. Recomendaciones nutricionales basadas en la evidencia para la prevención y el tratamiento del sobrepeso y la obesidad en adultos (consenso FESNAD-SEEDO). metodología y resumen ejecutivo (I/III). Nutr. Hosp. 2012, 27, 789–799. [Google Scholar]
- Pani, A.; Giossi, R.; Menichelli, D.; Fittipaldo, V.A.; Agnelli, F.; Inglese, E.; Romandini, A.; Roncato, R.; Pintaudi, B.; Del Sole, F.; et al. Inositol and Non-Alcoholic Fatty Liver Disease: A Systematic Review on Deficiencies and Supplementation. Nutrients 2020, 12, 3379. [Google Scholar] [CrossRef]
- Yki-Järvinen, H. Nutritional modulation of non-alcoholic fatty liver disease and insulin resistance. Nutrients 2015, 7, 9127–9138. [Google Scholar] [CrossRef] [Green Version]
- Hannah, W.N.; Harrison, S.A. Effect of Weight Loss, Diet, Exercise, and Bariatric Surgery on Nonalcoholic Fatty Liver Disease. Clin. Liver Dis. 2016, 20, 339–350. [Google Scholar] [CrossRef]
- Solah, V.; Kerr, D.A.; Hunt, W.; Johnson, S.; Boushey, C.J.; Delp, E.J.; Meng, X.; Gahler, J.R.; James, A.P.; Mukhtar, A.S.; et al. Effect of fibre supplementation on body weight and composition, frequency of eating and dietary choice in overweight individuals. Nutrients 2017, 9, 149. [Google Scholar] [CrossRef]
- Parnell, J.A.; Reimer, R.A. Weight loss during oligofructose supplementation is associated with decreased ghrelin and increased peptide YY in overweight and obese adults. Am. J. Clin. Nutr. 2009, 89, 1751–1759. [Google Scholar] [CrossRef] [Green Version]
- Aller, R.; de Luis, D.A.; Izaola, O.; de la Fuente, B.; Bachiller, R. Effect of a high monounsaturated vs high polyunsaturated fat hypocaloric diets in nonalcoholic fatty liver disease. Eur. Rev. Med. Pharmacol. Sci. 2014, 18, 1041–1047. [Google Scholar]
- De Luis, D.A.; Aller, R.; Izaola, O.; Gonzalez Sagrado, M.; Conde, R. Effect of two different hypocaloric diets in transaminases and insulin resistance in nonalcoholic fatty liver disease and obese patients. Nutr. Hosp. 2010, 25, 730–735. [Google Scholar] [PubMed]
- Mouzaki, M.; Allard, J.P. The role of nutrients in the development, progression, and treatment of non-alcoholic fatty liver disease. J. Clin. Gastroenterol. 2012, 46, 457–467. [Google Scholar] [CrossRef] [PubMed]
- Parker, H.M.; Johnson, N.A.; Burdon, C.A.; Cohn, J.S.; O’Connor, H.T.; George, J. Omega-3 supplementation, and non-alcoholic fatty liver disease: A systematic review and meta-analysis. J. Hepatol. 2012, 56, 944–951. [Google Scholar] [CrossRef] [PubMed] [Green Version]
- Kalafati, I.P.; Dimitriou, M.; Borsa, D.; Vlachogiannakos, J.; Revenas, K.; Kokkinos, A.; Ladas, S.D.; Dedoussis, G.V. Fish intake interacts with TM6SF2 gene variant to affect NAFLD risk: Results of a case-control study. Eur. J. Nutr. 2019, 58, 1463–1473. [Google Scholar] [CrossRef]
- St-Jules, D.E.; Watters, C.A.; Brunt, E.M.; Wilkens, L.R.; Novotny, R.; Belt, P.; Lavine, J.E. Estimation of fish and ω-3 fatty acid intake in pediatric nonalcoholic fatty liver disease. J. Pediatr. Gastroenterol. Nutr. 2013, 57, 627–633. [Google Scholar] [CrossRef] [PubMed] [Green Version]
- Mager, D.R.; Patterson, C.; So, S.; Rogenstein, C.D.; Wykes, L.J.; A Roberts, E. Dietary and physical activity patterns in children with fatty liver. Eur. J. Clin. Nutr. 2010, 64, 628–635. [Google Scholar] [CrossRef] [PubMed]
- Bahrami, A.; Teymoori, F.; Eslamparast, T.; Sohrab, G.; Hejazi, E.; Poustchi, H.; Hekmatdoost, A. Legume intake and risk of nonalcoholic fatty liver disease. Indian J. Gastroenterol. 2019, 38, 55–60. [Google Scholar] [CrossRef] [PubMed]
- Papanikolaou, Y.; Fulgoni, V.L., 3rd. Bean consumption is associated with greater nutrient intake, reduced systolic blood pressure, lower body weight, and a smaller waist circumference in adults: Results from the National Health and Nutrition Examination Survey 1999–2002. J. Am. Coll. Nutr. 2008, 27, 569–576. [Google Scholar] [CrossRef]
- Zhang, Z.; Lanza, E.; Kris-Etherton, P.M.; Colburn, N.H.; Bagshaw, D.; Rovine, M.J.; Ulbrecht, J.S.; Bobe, G.; Chapkin, R.S.; Hartman, T.J. A high legume low glycemic index diet improves serum lipid profiles in men. Lipids 2010, 45, 765–775. [Google Scholar] [CrossRef] [Green Version]
- Birketvedt, G.S.; Travis, A.; Langbakk, B.; Florholmen, J.R. Dietary supplementation with bean extract improves lipid profile in overweight and obese subjects. Nutrition 2002, 18, 729–733. [Google Scholar] [CrossRef]
- Macarulla, M.T.; Medina, C.; De Diego, M.A.; Chávarri, M.; Zulet, M.; Martínez, J.A.; Nöel-Suberville, C.; Higueret, P.; Portillo, M.P. Effects of the whole seed and a protein isolate of faba bean (Vicia faba) on the cholesterol metabolism of hypercholesterolaemic rats. Br. J. Nutr. 2001, 85, 607–614. [Google Scholar] [CrossRef] [PubMed] [Green Version]
- Finley, J.W.; Burrell, J.B.; Reeves, P.G. Pinto bean consumption changes SCFA profiles in fecal fermentations, bacterial populations of the lower bowel, and lipid profiles in blood of humans. J. Nutr. 2007, 137, 2391–2398. [Google Scholar] [CrossRef] [PubMed]
- Ghaemi, A.; Hosseini, N.; Osati, S.; NaghiZadeh, M.M.; Dehghan, A.; Ehrampoush, E.; Honarvar, B.; Homayounfar, R. Waist circumference is a mediator of dietary pattern in Non-alcoholic fatty liver disease. Sci. Rep. 2018, 8, 4788. [Google Scholar] [CrossRef] [PubMed] [Green Version]
- Pang, Q.; Zhang, J.Y.; Song, S.D.; Qu, K.; Xu, X.S.; Liu, S.S.; Liu, C. Central obesity and nonalcoholic fatty liver disease risk after adjusting for body mass index. World J. Gastroenterol. 2015, 21, 1650–1662. [Google Scholar] [CrossRef]
- Paoli, A.; Tinsley, G.; Bianco, A.; Moro, T. The influence of meal frequency and timing on health in humans: The role of fasting. Nutrients 2019, 11, 719. [Google Scholar] [CrossRef] [Green Version]
- Mekary, R.A.; Giovannucci, E.; Cahill, L.; Willett, W.C.; van Dam, R.M.; Hu, F.B. Eating patterns and type 2 diabetes risk in older women: Breakfast consumption and eating frequency. Am. J. Clin. Nutr. 2013, 98, 436–443. [Google Scholar] [CrossRef]
- Schwingshackl, L.; Hoffmann, G.; Kalle-Uhlmann, T.; Arregui, M.; Buijsse, B.; Boeing, H. Fruit and vegetable consumption and changes in anthropometric variables in adult populations: A systematic review and meta-analysis of prospective cohort studies. PLoS ONE 2015, 10, e0140846. [Google Scholar] [CrossRef]
- Lv, S.; Jiang, S.; Liu, S.; Dong, Q.; Xin, Y.; Xuan, S. Noninvasive quantitative detection methods of liver fat content in non-alcoholic fatty liver disease. J. Clin. Transl. Hepatol. 2018, 6, 217–221. [Google Scholar] [CrossRef] [Green Version]


| CD (n = 43) | MD–HMF (n = 43) | MD–PA (n = 42) | p * | |
|---|---|---|---|---|
| Females (n; %) | 16 (37.2) | 14 (32.6) | 17 (40.5) | 0.875 |
| Females at menopause (n; %) | 10 (23.3) | 6 (14.0) | 7 (16.7) | 0.672 |
| Age (years) (mean ± SD) | 54.1 ± 8.9 | 52.3 ± 7.1 | 52.2 ± 5.8 | 0.648 |
| Currently smoking (n; %) | 5 (11.6) | 7 (16.3) | 4 (9.5) | 0.361 |
| Hypertension (n; %) | 14 (32.6) | 14 (32.6) | 8 (19.0) | 0.120 |
| T2DM (n; %) | 8 (18.6) | 10 (23.3) | 13 (31.0) | 0.268 |
| Hyperlipidemia (n; %) | 17 (39.5) | 18 (41.9) | 13 (31.0) | 0.683 |
| No physical activity (n; %) | 20 (46.5) | 20 (46.5) | 17 (40.5) | 0.988 |
| CD (n = 43) | MD–HMF (n = 43) | MD–PA (n = 42) | p‡ | ||
|---|---|---|---|---|---|
| BMI (kg/m2) | Basal | 33.6 ± 3.7 | 33.9 ± 3.9 | 33.4 ± 3.1 | 0.145 |
| 6 months | 31.4 ± 3.9 | 31.4 ± 3.8 | 31.8 ± 3.4 | ||
| Δ | −2.1 ± 1.9 * | −2.5 ± 2.2 * | −1.6 ± 1.7 * | ||
| Body weight (kg) | Basal | 92.8 ± 14.4 | 96.2 ± 13.8 | 96.8 ± 12.3 | 0.128 |
| 6 months | 86.7 ± 13.6 | 89.1 ± 13.5 | 92.2 ± 13.1 | ||
| Δ | −6.0 ± 5.4 * | −7.1 ± 6.3 * | −4.6 ± 4.9 * | ||
| Body fat (%) | Basal | 35.7 ± 6.3 | 35.3 ± 7.2 | 35.4 ± 7.3 | 0.308 |
| 6 months | 34.4 ± 9.1 | 34.9 ± 15.9 | 33.6 ± 8.0 | ||
| Δ | −1.3 ± 7.0 | −0.4 ± 14.8 | −1.8 ± 2.8 * | ||
| Mass muscle (kg) | Basal | 56.7 ± 12.2 | 58.4 ± 8.4 | 59.7 ± 10.2 | 0.136 |
| 6 months | 54.8 ± 11.4 | 56.0 ± 8.5 | 58.3 ± 10.1 | ||
| Δ | −1.8 ± 2.4 * | −2.4 ± 2.3 * | −1.4 ± 2.1 * | ||
| Waist circumference (cm) | Basal | 110.7 ± 9.4 | 112.1 ± 9.1 | 112.7 ± 8.5 | 0.046 |
| 6 months | 106.7 ± 18.3 | 104.8 ± 10.7 | 108.6 ± 10.0 | ||
| Δ | −4.0 ± 16.3 | −7.3 ± 5.8 *b | −4.0 ± 6.3 *b | ||
| Physical activity (MET) | Basal | 2866.8 ± 2292.1 | 3483.0 ± 2741.1 | 3529.2 ± 4108.6 | 0.616 |
| 6 months | 3647.6 ± 2577.6 | 3646.6 ± 2348.8 | 3833.5 ± 3675.1 | ||
| Δ | 780.8 ± 2626.6 | 163.6 ± 3082.7 | 304.3 ± 2767.6 | ||
| Glucose (mg/dL) | Basal | 109.1 ± 22.6 | 134.5 ± 14.2 | 121.6 ± 59.7 | 0.793 |
| 6 months | 104.6 ± 34.7 | 129.0 ± 13.4 | 109.4 ± 44.4 | ||
| Δ | −4.4 ± 23.6 | −5.5 ± 13.8 * | −12.2 ± 44.8 | ||
| Hb1Ac (%) | Basal | 6.1 ± 1.0 | 5.9 ± 1.0 | 6.2 ± 1.6 | 0.820 |
| 6 months | 5.9 ± 0.7 | 5.7 ± 0.8 | 5.8 ± 1.2 | ||
| Δ | −0.2 ± 0.7 * | −0.2 ± 0.5 * | −0.4 ± 1.2 * | ||
| HR (beats/min) | Basal | 71.7 ± 10.1 | 69.4 ± 12.2 | 73.5 ± 12.5 | 0.786 |
| 6 months | 66.3 ± 11.2 | 66.4 ± 8.9 | 67.9 ± 10.6 | ||
| Δ | −5.4 ± 9.5 * | −3.0 ± 9.3 | −5.6 ± 9.5 * | ||
| SBP (mmHg) | Basal | 138.6 ± 15.8 | 134.5 ± 14.2 | 134.4 ± 16.1 | 0.880 |
| 6 months | 131.2 ± 17.6 | 129.0 ± 13.4 | 131.1 ± 15.8 | ||
| Δ | −7.4 ± 15.3 * | −5.5 ± 13.8 * | −3.3 ± 17.0 | ||
| DBP (mmHg) | Basal | 85.5 ± 10.4 | 85.7 ± 8.0 | 85.3 ± 9.0 | 0.980 |
| 6 months | 81.3 ± 9.1 | 81.7 ± 7.5 | 81.8 ± 9.8 | ||
| Δ | −4.1 ± 8.6 * | −4.0 ± 8.9 * | −3.5 ± 8.9 * | ||
| Triglycerides (mg/dL) | Basal | 188.2 ± 96.6 | 201.4 ± 313.1 | 200.2 ± 122.6 | 0.096 |
| 6 months | 159.2 ± 110.7 | 128.2 ± 72.1 | 165.2 ± 108.0 | ||
| Δ | −29.1 ± 103.3 | −73.2 ± 290.0 | −35.0 ± 128.0 | ||
| Total-cholesterol (mg/dL) | Basal | 203.0 ± 43.2 | 199.6 ± 56.0 | 191.8 ± 39.2 | 0.661 |
| 6 months | 193.8 ± 45.8 | 184.4 ± 38.8 | 191.7 ± 42.7 | ||
| Δ | −9.2 ± 28.9 * | −15.1 ± 52.7 | −0.1 ± 44.6 | ||
| HDL-chol (mg/dL) | Basal | 45.5 ± 14.5 | 45.6 ± 9.2 | 41.8 ± 9.1 | 0.664 |
| 6 months | 47.8 ± 14.6 | 48.9 ± 10.8 | 43.8 ± 9.5 | ||
| Δ | 2.3 ± 6.3 * | 3.3 ± 8.4 * | 2.0 ± 5.0 * | ||
| Intrahepatic fat contents (%) | Basal | 16.2 ± 9.3 | 16.9 ± 13.4 | 16.5 ± 11.4 | 0.100 |
| 6 months | 10.4 ± 7.5 | 8.3 ± 8.0 | 10.7 ± 6.4 | ||
| Δ | −5.8 ± 7.8 * | −8.7 ± 12.4 * | −5.9 ± 10.6 * | ||
| Liver stiffness K-pa | Basal | 8.4 ± 1.8 | 8.6 ± 1.7 | 8.2 ± 2.6 | 0.589 |
| 6 months | 4.8 ± 2.0 | 5.2 ± 1.9 | 5.8 ± 1.8 | ||
| Δ | −3.6 ± 2.5 * | −3.4 ± 1.8 * | −2.4 ± 3.1 * | ||
| AST (mg/dL) | Basal | 27.4 ±10.1 | 26.4 ± 16.6 | 23.3 ± 10.0 | 0.609 |
| 6 months | 22.9 ± 6.8 | 23.2 ± 6.7 | 23.0 ± 15.3 | ||
| Δ | −4.6 ± 8.6 * | −3.2 ± 15.3 | −0.3 ± 8.1 | ||
| ALT (mg/dL) | Basal | 37.5 ± 20.3 | 38.2 ± 38.7 | 33.6 ± 27.1 | 0.464 |
| 6 months | 26.5 ± 10.4 | 25.7 ± 12.8 | 26.9 ± 24.6 | ||
| Δ | −11.0 ± 16.3 * | −12.5 ± 32.8 * | −6.7 ± 17.3 * | ||
| GGT (mg/dL) | Basal | 47.4 ± 30.3 | 58.3 ± 81.0 | 37.3 ± 17.4 | 0.591 |
| 6 months | 33.7 ± 22.9 | 47.7 ± 77.8 | 31.7 ± 19.6 | ||
| Δ | −13.7 ± 22.1 * | −10.6 ± 67.2 | −5.6 ± 11.3 * |
| CD (n = 43) | MD–HMF (n = 43) | MD–PA (n = 42) | p‡ | ||
|---|---|---|---|---|---|
| Adherence to MedDiet | Basal | 7.3 ± 2.6 | 6.9 ± 2.7 | 7.7 ± 2.3 | 0.002 |
| 6 months | 10.9 ± 2.8 | 13.1 ± 2.7 | 11.8 ± 2.8 | ||
| Δ | 3.6 ± 3.0 *a | 6.2 ± 3.5 *a | 4.1 ± 3.0 * | ||
| Energy (kcal/d) | Basal | 2481.2 ± 633.0 | 2311.7 ± 980.1 | 2437.0 ± 697.2 | 0.529 |
| 6 months | 2166.3 ± 676.9 | 1964.8 ± 519.2 | 2126.1 ± 626.6 | ||
| Δ | −314.9 ± 762.8 * | −346.9 ± 947.2 * | −310.9 ± 747.8 * | ||
| Vegetables (g/d) per 1000 kcal | Basal | 144.2 ± 111.5 | 138.4 ± 74.5 | 131.2 ± 82.7 | 0.229 |
| 6 months | 164.1 ± 72.9 | 184.8 ± 88.6 | 184.2 ± 85.7 | ||
| Δ | 19.9 ± 123.4 | 46.5 ± 88.6 * | 53.0 ± 66.5 * | ||
| Fruits (g/d) per 1000 kcal | Basal | 137.7 ± 75.7 | 110.2 ± 80.9 | 131.7 ± 96.8 | 0.049 |
| 6 months | 158.3 ± 93.6 | 206.0 ± 121.7 | 173.2 ± 109.5 | ||
| Δ | 20.6 ± 93.8 a | 95.8 ± 116.2 *a | 41.5 ± 95.7 * | ||
| Legumes (g/d) per 1000 kcal | Basal | 9.5 ± 5.7 | 10.2 ± 6.5 | 9.1 ± 5.2 | 0.113 |
| 6 months | 13.2 ± 9.2 | 21.1 ± 16.2 | 15.9 ± 10.4 | ||
| Δ | 3.7 ± 9.5 * | 10.9 ± 16.1 * | 6.8 ± 10.0 * | ||
| Cereal (g/d) per 1000 kcal | Basal | 64.1 ± 27.7 | 62.0 ± 33.7 | 57.7 ± 31.6 | 0.070 |
| 6 months | 66.5 ± 31.8 | 53.9 ± 53.9 | 62.4 ± 24.0 | ||
| Δ | 2.4 ± 39.9 | −8.1 ± 43.1 | 4.7 ± 37.8 | ||
| Meats and meat products (g/d) per 1000 kcal | Basal | 81.3 ± 37.6 | 79.2 ± 29.0 | 78.3 ± 34.3 | 0.256 |
| 6 months | 67.0 ± 24.3 | 70.1 ± 32.9 | 69.2 ± 29.7 | ||
| Δ | −14.3 ± 41.8 * | −9.1 ± 28.4 * | −9.1 ± 29.9 | ||
| Olive oil (g/d) per 1000 kcal | Basal | 12.9 ± 6.2 | 14.7 ± 9.5 | 12.9 ± 6.2 | 0.406 |
| 6 months | 15.9 ± 8.7 | 13.8 ± 7.9 | 14.1 ± 8.4 | ||
| Δ | 3.0 ± 8.5 * | −0.9 ± 10.4 | 1.3 ± 9.2 | ||
| Fish (g/d) per 1000 kcal | Basal | 41.1 ± 26.4 | 36.6 ± 24.0 | 48.5 ± 29.3 | 0.011 |
| 6 months | 56.7 ± 42.5 | 56.5 ± 27.2 | 70.6 ± 38.3 | ||
| Δ | 15.6 ± 41.1 * | 19.9 ± 32.4 * | 22.1 ± 32.9 * | ||
| Nuts (g/d) per 1000 kcal | Basal | 5.3 ± 6.3 | 4.6 ± 5.5 | 6.1 ± 7.4 | 0.452 |
| 6 months | 7.8 ± 9.9 | 13.7 ± 13.9 | 12.5 ± 10.2 | ||
| Δ | 2.6 ± 9.9 | 9.1 ± 14.0 * | 6.4 ± 10.3 * | ||
| Sweets and pastries (g/d) per 1000 kcal | Basal | 10.1 ± 11.2 | 10.9 ± 15.4 | 13.7 ± 14.9 | 0.684 |
| 6 months | 8.1 ± 11.6 | 5.3 ± 7.9 | 5.8 ± 8.9 | ||
| Δ | −2.0 ± 12.2 | −5.6 ± 18.0 * | −8.0 ± 15.5 * | ||
| Soft Drinks (mL/d) per 1000 kcal | Basal | 14.6 ± 33.5 | 10.7 ± 23.2 | 10.3 ± 36.6 | 0.007 |
| 6 months | 5.6 ± 13.1 | 1.3 ± 2.8 | 0.5 ± 1.8 | ||
| Δ | −9.0 ± 85.1 a,c | −9.4 ± 23.3 *a | −9.8 ± 36.5 c | ||
| Dairy (mL/d) per 1000 kcal | Basal | 156.7 ± 103.1 | 126.8 ± 63.8 | 136.2 ± 88.1 | 0.286 |
| 6 months | 181.4 ± 115.2 | 203.2 ±128.5 | 176.0 ± 112.2 | ||
| Δ | 24.7 ± 92.0 | 76.4 ± 122.9 * | 39.8 ± 107.0 * | ||
| CD (n = 43) | MD–HMF (n = 43) | MD–PA (n = 42) | p‡ | ||
|---|---|---|---|---|---|
| BMI (kg/m2) | Basal | 33.6 ± 3.7 | 34.3 ± 4.0 | 33.4 ± 3.1 | 0.006 |
| 12 months | 31.9 ± 4.1 | 31.7 ± 4.3 | 31.8 ± 3.5 | ||
| Δ | −1.7 ± 1.8 *a | −2.6 ± 2.2 *a.b | −1.6 ± 1.8 *b | ||
| Body weight (kg) | Basal | 92.7 ± 14.4 | 96.3 ± 13.8 | 95.3 ± 12.3 | 0.031 |
| 12 months | 88.4 ± 14.4 | 89.5 ± 14.4 | 91.6 ± 13.0 | ||
| Δ | −4.3 ± 5.5 * | −6.8 ± 6.4 *b | −3.7 ± 5.0 *b | ||
| Body fat (%) | Basal | 35.2 ± 6.3 | 35.4 ± 7.2 | 35.7 ± 7.3 | 0.737 |
| 12 months | 33.3 ± 6.1 | 34.2 ± 9.8 | 34.9 ± 8.2 | ||
| Δ | −1.9 ± 2.6 * | −1.2 ± 8.4 | −1.2 ± 7.2 | ||
| Mass muscle (kg) | Basal | 57.6 ± 12.2 | 59.5 ± 8.4 | 58.7 ± 10.2 | 0.099 |
| 12 months | 56.1 ± 11.1 | 56.1 ± 10.4 | 57.6 ± 11.0 | ||
| Δ | −1.6 ± 2.5 * | −3.3 ± 6.6 * | −1.1 ± 2.0 * | ||
| Waist circumference (cm) | Basal | 110.7 ± 9.4 | 112.1 ± 9.1 | 112.7 ± 8.5 | 0.044 |
| 12 months | 105.0 ± 10.25 | 104.8 ± 12.0 | 107.3 ± 9.9 | ||
| Δ | −5.2 ± 6.3 * | −7.3 ± 6.2 * | −4.1 ± 6.0 * | ||
| Physical activity (MET) | Basal | 2750.2 ± 2327.7 | 3772.4 ± 3275.0 | 3615.0 ± 4171.1 | 0.063 |
| 12 months | 4357.8 ± 4305.6 | 3440.4 ± 3101.9 | 4333.1 ± 3849.8 | ||
| Δ | 1607.6 ± 3819.3 * | −331.9 ± 3278.9 | 718.1 ± 4189.2 | ||
| Glucose (mg/dL) | Basal | 114.3 ± 36.0 | 108.7 ± 26.4 | 118.2 ± 51.9 | 0.546 |
| 12 months | 108.2 ± 29.8 | 100.7 ± 23.1 | 105.1 ± 18.2 | ||
| Δ | −6.0 ± 16.3 * | −8.0 ± 20.2 * | −13.1 ± 46.0 | ||
| Hb1Ac (%) | Basal | 6.1 ± 1.0 | 5.9 ± 1.0 | 6.1 ± 1.5 | 0.276 |
| 12 months | 6.0 ± 1.0 | 5.7 ± 0.7 | 5.7 ± 0.6 | ||
| Δ | −0.1 ± 0.4 | −0.2 ± 0.6 | −0.4 ± 1.3 | ||
| HR (beats/min) | Basal | 69.4 ± 11.4 | 67.0 ± 11.4 | 67.3 ± 8.9 | 0.541 |
| 12 months | 63.8 ± 11.1 | 60.6 ± 11.1 | 63.7 ± 11.0 | ||
| Δ | −5.6 ± 7.8 * | −6.4 ± 7.4 * | −3.6 ± 8.3 | ||
| SBP (mmHg) | Basal | 136.3 ± 12.7 | 133.3 ± 14.2 | 131.9 ± 13.6 | 0.472 |
| 12 months | 127.0 ± 15.0 | 129.1 ± 20.6 | 125.5 ± 16.6 | ||
| Δ | −9.3 ± 12.9 * | −4.2 ± 15.3 | −6.4 ± 14.0 | ||
| DBP (mmHg) | Basal | 87.7 ± 10.4 | 88.1 ± 6.7 | 87.9 ± 6.6 | 0.875 |
| 12 months | 80.5 ± 9.1 | 82.2 ± 8.4 | 80.9 ± 8.2 | ||
| Δ | −7.2 ± 7.5 * | −5.9 ± 10.3 * | −7.0 ± 8.5 * | ||
| Triglycerides (mg/dL) | Basal | 186.5 ± 97.8 | 207.6 ± 330.1 | 184.4 ± 115.2 | 0.478 |
| 12 months | 161.7 ± 108.7 | 132.0 ± 64.7 | 148.1 ± 76.5 | ||
| Δ | −24.8 ± 85.5 | −75.6 ± 317.0 | −36.3 ± 119.2 | ||
| Total- cholesterol (mg/dL) | Basal | 202.7 ± 43.2 | 202.7 ± 57.1 | 196.0 ± 40.6 | 0.305 |
| 12 months | 195.0 ± 46.8 | 183.1 ± 39.6 | 191.6 ± 40.7 | ||
| Δ | −7.7 ± 33.8 | −19.6 ± 63.6 * | −4.4 ± 36.8 | ||
| HDL-chol (mg/dL) | Basal | 45.5 ± 14.6 | 46.1 ± 9.0 | 43.0 ± 9.3 | 0.560 |
| 12 months | 47.3 ± 14.2 | 49.5 ± 11.4 | 45.4 ± 11.9 | ||
| Δ | 1.8 ± 7.1 | 3.3 ± 7.4 * | 2.4 ± 6.2 * | ||
| Intraliver fat contents (%) | Basal | 14.5 ± 10.1 | 12.0 ± 12.1 | 13.5 ± 11.8 | 0.372 |
| 12 months | 12.6 ± 9.1 | 7.1 ± 5.8 | 10.6 ± 7.7 | ||
| Δ | −1.8 ± 7.6 | −4.9 ± 10.6 * | −2.9 ± 11.3 | ||
| Liver stiffness K-pa | Basal | 5.3 ± 1.7 | 5.3 ± 1.9 | 5.3 ± 2.2 | 0.300 |
| 12 months | 5.0 ± 1.7 | 4.8 ± 1.5 | 5.7 ± 2.4 | ||
| Δ | −0.3 ± 2.1 | −0.4 ± 2.2 | −0.4 ± 2.8 | ||
| AST (mg/dL) | Basal | 28.4 ± 10.1 | 27.7 ± 17.5 | 23.9 ± 9.0 | 0.041 |
| 12 months | 27.4 ± 17.1 | 20.9 ± 5.6 | 22.8 ± 8.8 | ||
| Δ | −1.0 ± 16.0 c | −6.8 ± 16.2 | −1.1 ± 7.2 *c | ||
| ALT (mg/dL) | Basal | 37.5 ± 20.4 | 39.4 ± 40.6 | 33.6 ± 23.1 | 0.240 |
| 12 months | 33.4 ± 25.7 | 25.0 ± 13.0 | 25.7 ± 16.3 | ||
| Δ | −4.2 ± 28.3 | −14.4 ± 36.4 * | −8.0 ± 15.1 * | ||
| GGT (mg/dL) | Basal | 47.1 ± 30.3 | 51.7 ± 71.2 | 37.5 ± 18.0 | 0.348 |
| 12 months | 43.8 ± 44.3 | 36.3 ± 37.5 | 31.2 ± 16.4 | ||
| Δ | −3.3 ± 36.3 | −15.4 ± 56.4 | −6.3 ± 13.0 * |
| CD (n = 43) | MD–HMF (n = 43) | MD–PA (n = 42) | p‡ | ||
|---|---|---|---|---|---|
| Adherence to MedDiet | Basal | 7.2 ± 2.6 | 7.0 ± 2.7 | 7.9 ± 2.3 | 0.001 |
| 12 months | 10.8 ± 2.6 | 12.7 ± 2.6 | 11.5 ± 2.3 | ||
| Δ | 3.6 ± 2.9 *c | 5.7 ± 3.3 * | 3.5 ± 2.6 *c | ||
| Energy (kcal/day) | Basal | 2500.9 ± 643.9 | 2372.4 ± 992.7 | 2364.8 ± 695.9 | 0.845 |
| 12 months | 2035.9 ± 628.1 | 1971.4 ± 893.7 | 2036.1 ± 514.8 | ||
| Δ | −464.9 ± 723.0 * | −401.0 ± 1305.4 * | −328.7 ± 617.6 * | ||
| Vegetables (g/day) per 1000 kcal | Basal | 139.5 ± 110.7 | 133.0 ± 65.5 | 143.0 ± 87.7 | 0.695 |
| 12 months | 178.8 ± 120.1 | 189.3 ± 81.7 | 192.7 ± 112.6 | ||
| Δ | 39.3 ± 100.2 * | 56.3 ± 68.9 * | 49.8 ± 101.7 * | ||
| Fruits (g/day) per 1000 kcal | Basal | 131.2 ± 77.1 | 114.1 ± 82.3 | 138.8 ± 97.2 | 0.047 |
| 12 months | 165.5 ± 121.9 | 181.3 ± 117.0 | 167.4 ± 106.7 | ||
| Δ | 34.4 ± 121.3 | 67.2 ± 133.1 * | 28.6 ± 86.5 | ||
| Legumes (g/day) per 1000 kcal | Basal | 9.2 ± 5.6 | 10.0 ± 6.4 | 9.7 ± 5.6 | 0.604 |
| 12 months | 12.9 ± 9.4 | 15.6 ± 10.9 | 13.7 ± 8.5 | ||
| Δ | 3.7 ± 8.7 * | 5.6 ± 9.6 * | 4.0 ± 9.5 * | ||
| Cereal (g/day) per 1000 kcal | Basal | 65.4 ± 29.9 | 66.1 ± 33.6 | 54.5 ± 28.5 | 0.031 |
| 12 months | 74.1 ± 39.1 | 50.6 ± 29.7 | 53.8 ± 22.5 | ||
| Δ | 8.7 ± 46.5 c | −15.4 ± 44.1 * | −0.7 ± 25.2 c | ||
| Meats and meat products (g/day) per 1000 kcal | Basal | 198.7 ± 90.4 | 173.9 ± 63.5 | 174.0 ± 73.4 | 0.063 |
| 12 months | 65.4 ± 39.9 | 77.8 ± 50.5 | 83.4 ± 35.5 | ||
| Δ | −133.3 ± 102.0 * | −96.1 ± 77.7 * | −90.7 ± 64.2 * | ||
| Olive oil (g/d) per 1000 kcal | Basal | 13.5 ± 7.0 | 14.9 ± 9.4 | 13.1 ± 5.8 | 0.149 |
| 12 months | 15.1 ± 8.5 | 12.9 ± 7.5 | 15.0 ± 6.9 | ||
| Δ | 1.6 ± 10.0 | −2.0 ± 10.2 | 1.9 ± 8.2 | ||
| Fish (g/day) per 1000 kcal | Basal | 40.5 ± 26.0 | 34.9 ± 21.5 | 51.9 ± 31.3 | 0.006 |
| 12 months | 49.5 ± 31.6 | 67.3 ± 38.7 | 63.9 ± 30.8 | ||
| Δ | 9.0 ± 30.9 c | 32.4 ± 39.8 * | 12.0 ± 31.1 *c | ||
| Nuts (g/day) per 1000 kcal | Basal | 5.1 ± 6.3 | 4.3 ± 5.5 | 6.3 ± 7.7 | 0.001 |
| 12 months | 7.3 ± 7.6 | 13.4 ± 11.5 | 9.0 ± 8.1 | ||
| Δ | 2.1 ± 6.4 *c | 9.0 ± 12.0 * | 2.7 ± 6.7 *c | ||
| Sweets and pastries (g/day) per 1000 kcal | Basal | 12.8 ± 16.5 | 11.5 ± 15.0 | 12.2 ± 15.2 | 0.666 |
| 12 months | 8.4 ± 14.3 | 8.1 ± 18.8 | 5.2 ± 7.0 | ||
| Δ | −4.3 ± 15.3 | −3.4 ± 18.9 | −7.0 ± 14.9 * | ||
| Soft Drinks (mL/day) per 1000 kcal | Basal | 15.9 ± 34.1 | 12.2 ± 24.6 | 11.0 ± 41.0 | 0.071 |
| 12 months | 4.7 ± 12.6 | 1.1 ± 2.5 | 13.6 ± 53.8 | ||
| Δ | −11.1 ± 30.9 * | −11.1 ± 24.8 * | 2.5 ± 60.2 | ||
| Dairy (mL/day) per 1000 kcal | Basal | 361.3 ± 190.0 | 312.2 ± 164.1 | 297.3 ± 241.7 | 0.163 |
| 12 months | 180.0 ± 175.1 | 214.9 ± 118.5 | 146.5 ± 98.6 | ||
| Δ | −181.3 ± 229.9 * | −97.3 ± 140.1 * | −150.8 ± 225.5 * | ||
Publisher’s Note: MDPI stays neutral with regard to jurisdictional claims in published maps and institutional affiliations. |
© 2022 by the authors. Licensee MDPI, Basel, Switzerland. This article is an open access article distributed under the terms and conditions of the Creative Commons Attribution (CC BY) license (https://creativecommons.org/licenses/by/4.0/).
Share and Cite
Montemayor, S.; Bouzas, C.; Mascaró, C.M.; Casares, M.; Llompart, I.; Abete, I.; Angullo-Martinez, E.; Zulet, M.Á.; Martínez, J.A.; Tur, J.A. Effect of Dietary and Lifestyle Interventions on the Amelioration of NAFLD in Patients with Metabolic Syndrome: The FLIPAN Study. Nutrients 2022, 14, 2223. https://0-doi-org.brum.beds.ac.uk/10.3390/nu14112223
Montemayor S, Bouzas C, Mascaró CM, Casares M, Llompart I, Abete I, Angullo-Martinez E, Zulet MÁ, Martínez JA, Tur JA. Effect of Dietary and Lifestyle Interventions on the Amelioration of NAFLD in Patients with Metabolic Syndrome: The FLIPAN Study. Nutrients. 2022; 14(11):2223. https://0-doi-org.brum.beds.ac.uk/10.3390/nu14112223
Chicago/Turabian StyleMontemayor, Sofía, Cristina Bouzas, Catalina M. Mascaró, Miguel Casares, Isabel Llompart, Itziar Abete, Escarlata Angullo-Martinez, María Ángeles Zulet, J. Alfredo Martínez, and Josep A. Tur. 2022. "Effect of Dietary and Lifestyle Interventions on the Amelioration of NAFLD in Patients with Metabolic Syndrome: The FLIPAN Study" Nutrients 14, no. 11: 2223. https://0-doi-org.brum.beds.ac.uk/10.3390/nu14112223