
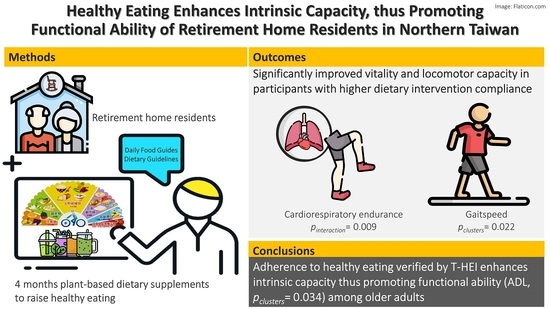
Healthy Eating Enhances Intrinsic Capacity, Thus Promoting Functional Ability of Retirement Home Residents in Northern Taiwan

 , ,
, ,
Abstract
:
1. Introduction
2. Materials and Methods
2.1. Data Acquisition
2.2. Sampling and Study Design
2.3. Dietary Intervention and Compliance
2.4. Intrinsic Capacity Assessment
2.5. Dietary Assessment and Dietary Quality Appraisal
2.6. Outcome Assessment
2.7. Statistical Analysis
3. Results
4. Discussion
5. Conclusions
Author Contributions
Funding
Institutional Review Board Statement
Informed Consent Statement
Data Availability Statement
Acknowledgments
Conflicts of Interest
Appendix A

| PDS | Ingredients | Calories (kcal) | Protein (g) | Lipid (g) | CHO (g) | Dietary Fiber (g) | >15% DV b | >10% DV b |
|---|---|---|---|---|---|---|---|---|
| 1 | Komatsuna/Chinese mustard, Cucumber Apple Pineapple Cashew/walnut | 145 | 4.0 | 6.86 | 21.1 | 2.7 | Vitamin C Magnesium | Vitamin A Vitamin B1 Iron |
| 2 | Beetroot Purple cabbage Purple grapes Pear Cashew/walnut | 169 | 4.6 | 7.0 | 24.9 | 4.3 | Vitamin C Iron Magnesium | Vitamin B1 Zinc |
| 3 | Carrot Pineapple Banana Cashew/walnut | 187 | 4.5 | 6.9 | 31.7 | 4.7 | Vitamin A Vitamin C Magnesium | Vitamin B1 Iron |
| 4 | Chinese kale Cucumber Apple Pineapple Cashew/walnut | 148 | 4.4 | 6.9 | 21.5 | 2.9 | Vitamin A Iron Magnesium | Vitamin B1 Vitamin C Calcium Zinc |
Appendix B
| Cluster 1 (n = 13) | Cluster 2 (n = 30) | Cluster 3 (n = 16) | ||||
|---|---|---|---|---|---|---|
| Calorie (kcal) | 2102.8 | (2033.3–2102.8) | 2097.6 | (2010.1–2102.8) | 2010.1 | (1562.3–2010.1) |
| Total grains | 5.6 | (4.1–5.7) | 4.9 | (3.2–5.7) | 5.8 | (4.1–5.8) |
| Whole grains | 4.2 | (2.6–5.7) | 0.9 | (0.9–2.6) | 1.0 | (0.5–1) |
| Total vegetables | 2.1 | (1.9–2.6) | 2.1 | (2–2.3) | 1.9 | (1.9–2.1) |
| Dark-colored vegetables | 0.7 | (0.6–0.9) | 0.7 | (0.6–0.8) | 0.6 | (0.6–0.9) |
| Fruits | 0.6 | (0.4–0.6) | 0.5 | (0.4–0.6) | 0.0 | (0–0.3) |
| Dairy | 0.0 | (0–0) | 0.0 | (0–0) | 0.0 | (0–0.1) |
| Total protein | 3.4 | (1.7–3.5) | 3.4 | (2.3–3.4) | 3.5 | (2.3–3.5) |
| Plant protein & seafoods | 1.9 | (1–2) | 1.9 | (1–1.9) | 2.0 | (1–2) |
| Oil, nuts & seeds | 0.6 | (0.2–0.6) | 0.6 | (0.4–0.6) | 0.0 | (0–0.5) |
| Nuts & seeds | 0.7 | (0.3–0.7) | 0.7 | (0.4–0.7) | 0.0 | (0–0.5) |
| Cluster 1 (n = 13) | Cluster 2 (n = 30) | Cluster 3 (n = 16) | ||||
|---|---|---|---|---|---|---|
| Calorie (kcal) | 2151.0 | (2148.8–2166.5) | 2129.7 | (2076.4–2166.5) | 2073.8 | (1900.1–2073.8) |
| Total grains | 7.1 | (5–7.1) | 5.3 | (3.9–7.1) | 7.4 | (4.6–7.4) |
| Whole grains | 5.2 | (3–7.1) | 0.8 | (0.7–3) | 0.8 | (0.8–0.9) |
| Total vegetables | 4.0 | (4–5) | 4.0 | (3.7–4) | 3.9 | (2.9–3.9) |
| Dark-colored vegetables | 1.2 | (1.2–1.5) | 1.2 | (1.1–1.3) | 1.1 | (1.1–1.2) |
| Fruits | 0.6 | (0.6–0.6) | 0.5 | (0.3–0.6) | 0.0 | (0–0.3) |
| Dairy | 0.1 | (0.1–0.1) | 0.1 | (0.1–0.1) | 0.1 | (0–0.1) |
| Total protein | 3.2 | (1.6–3.3) | 3.3 | (3.2–3.4) | 3.4 | (3.3–3.4) |
| Plant protein & seafoods | 1.0 | (0.5–1) | 1.0 | (1–1) | 1.0 | (1–1) |
| Oil, nuts & seeds | 0.6 | (0.5–0.6) | 0.6 | (0.3–0.6) | 0.0 | (0–0.5) |
| Nuts & seeds | 0.9 | (0.9–1) | 0.9 | (0.7–1) | 0.3 | (0.3–0.8) |
| Cluster 1 (n = 13) | Cluster 2 (n = 30) | Cluster 3 (n = 16) | ||||
|---|---|---|---|---|---|---|
| Calorie (kcal) | 2187.4 | (2177.3–2192.8) | 2161.5 | (2100.1–2192.8) | 2100.1 | (2064.7–2100.1) |
| Total grains | 7.3 | (5.2–7.3) | 7.3 | (4.2–7.4) | 7.6 | (6.9–7.6) |
| Whole grains | 5.4 | (3.1–7.3) | 0.8 | (0.8–3) | 0.8 | (0.8–0.8) |
| Total vegetables | 2.7 | (2.7–3.4) | 2.7 | (2.6–2.8) | 2.6 | (2.3–2.6) |
| Dark-colored vegetables | 1.7 | (1.7–2.1) | 1.6 | (1.6–1.7) | 1.6 | (1.5–1.6) |
| Fruits | 0.7 | (0.6–0.7) | 0.5 | (0.3–0.7) | 0.0 | (0–0.1) |
| Dairy | 0.1 | (0.1–0.1) | 0.1 | (0.1–0.1) | 0.1 | (0–0.1) |
| Total protein | 3.7 | (1.9–3.7) | 3.7 | (3.7–3.8) | 3.8 | (3.8–3.8) |
| Plant protein & seafoods | 1.8 | (0.9–1.8) | 1.8 | (1.8–1.8) | 1.9 | (1.8–1.9) |
| Oil, nuts & seeds | 0.7 | (0.6–0.7) | 0.6 | (0.4–0.7) | 0.0 | (0–0.2) |
| Nuts & seeds | 1.3 | (1.2–1.3) | 1.0 | (0.9–1.3) | 0.5 | (0.5–0.7) |
| Cluster 1 (n = 13) | Cluster 2 (n = 30) | Cluster 3 (n = 16) | ||||
|---|---|---|---|---|---|---|
| Calorie (kcal) | 2456.6 | (2390.5–2456.6) | 2213.8 | (2062.9–2440) | 1988.8 | (1988.8–1991.6) |
| Total grains | 6.1 | (4.7–6.6) | 6.6 | (4.2–7.3) | 8.0 | (6.6–8) |
| Whole grains | 4.8 | (2.7–6.6) | 0.7 | (0.6–2.8) | 0.7 | (0.3–0.7) |
| Total vegetables | 3.2 | (3–3.9) | 3.1 | (2.6–3.4) | 2.6 | (2.6–2.6) |
| Dark-colored vegetables | 2.1 | (2–2.5) | 2.0 | (1.6–2.1) | 1.6 | (1.6–1.6) |
| Fruits | 1.4 | (1.2–1.4) | 1.2 | (0.4–1.3) | 0.0 | (0–0) |
| Dairy | 0.1 | (0.1–0.1) | 0.1 | (0.1–0.2) | 0.2 | (0.1–0.2) |
| Total protein | 2.9 | (1.6–2.9) | 3.2 | (2.9–3.6) | 3.6 | (3.6–3.6) |
| Plant protein & seafoods | 1.4 | (0.8–1.4) | 1.4 | (1–1.6) | 1.7 | (1.1–1.7) |
| Oil, nuts & seeds | 3.6 | (3–3.6) | 3.5 | (1.7–3.8) | 0.0 | (0–0) |
| Nuts & seeds | 4.0 | (3.4–4) | 3.9 | (2–4.1) | 0.2 | (0.2–0.2) |
References
- World Health Organization. The Global Health Observatory. 2022. Available online: https://www.who.int/data/gho (accessed on 29 April 2022).
- National Development Council. Population projections for the R.O.C. (Taiwan): 2020~2070. In National Development Council; National Development Council: Taipei City, Taiwan, 2020. [Google Scholar]
- National Development Council. Population Projections. 2020. Available online: https://www.ndc.gov.tw/Content_List.aspx?n=81ECE65E0F82773F (accessed on 7 April 2022).
- World Health Organization. Good Health Adds Life to Years–Global Brief for World Health Day 2012; World Health Organization: Geneva, Switzerland, 2012. [Google Scholar]
- Huber, M.; Knottnerus, J.A.; Green, L.; Horst, H.V.D.; Jadad, A.R.; Kromhout, D.; Leonard, B.; Lorig, K.; Loureiro, M.I.; van der Meer, J.W.M.; et al. How should we define health? BMJ 2011, 343, d4163. [Google Scholar] [CrossRef] [PubMed] [Green Version]
- World Health Organization. World Report on Ageing and Health; World Health Organization: Luxembourg, 2015. [Google Scholar]
- Cesari, M.; Araujo De Carvalho, I.; Amuthavalli Thiyagarajan, J.; Cooper, C.; Martin, F.C.; Reginster, J.-Y.; Vellas, B.; Beard, J.R. Evidence for the Domains Supporting the Construct of Intrinsic Capacity. J. Gerontol. Ser. A 2018, 73, 1653–1660. [Google Scholar] [CrossRef] [PubMed] [Green Version]
- Beard, J.R.; Jotheeswaran, A.T.; Cesari, M.; Araujo De Carvalho, I. The structure and predictive value of intrinsic capacity in a longitudinal study of ageing. BMJ Open 2019, 9, e026119. [Google Scholar] [CrossRef] [Green Version]
- World Health Organization. Decade of Healthy Ageing: Baseline Report; World Health Organization: Geneva, Switzerland, 2020. [Google Scholar]
- Charles, A.; Buckinx, F.; Locquet, M.; Reginster, J.-Y.; Petermans, J.; Gruslin, B.; Bruyère, O. Prediction of Adverse Outcomes in Nursing Home Residents According to Intrinsic Capacity Proposed by the World Health Organization. J. Gerontol. Ser. A 2020, 75, 1594–1599. [Google Scholar] [CrossRef] [PubMed]
- Gonzalez-Bautista, E.; Barreto, P.D.; Andrieu, S.; Rolland, Y.; Vellas, B.; Grp, M.D. Screening for intrinsic capacity impairments as markers of increased risk of frailty and disability in the context of integrated care for older people: Secondary analysis of MAPT. Maturitas 2021, 150, 1–6. [Google Scholar] [CrossRef] [PubMed]
- Beard, J.R.; Si, Y.F.; Liu, Z.X.; Chenoweth, L.; Hanewald, K. Intrinsic Capacity: Validation of a New WHO Concept for Healthy Aging in a Longitudinal Chinese Study. J. Gerontol. Ser. A-Biol. Sci. Med. Sci. 2022, 77, 94–100. [Google Scholar] [CrossRef]
- Stolz, E.; Mayerl, H.; Freidl, W.; Roller-Wirnsberger, R.; Gill, T.M. Intrinsic Capacity Predicts Negative Health Outcomes in Older Adults. J. Gerontol. Ser. A 2022, 77, 101–105. [Google Scholar] [CrossRef]
- Westbury, L.D.; Fuggle, N.R.; Syddall, H.E.; Duggal, N.A.; Shaw, S.C.; Maslin, K.; Dennison, E.M.; Lord, J.M.; Cooper, C. Relationships Between Markers of Inflammation and Muscle Mass, Strength and Function: Findings from the Hertfordshire Cohort Study. Calcif. Tissue Int. 2018, 102, 287–295. [Google Scholar] [CrossRef] [Green Version]
- Liu, C.K.; Lyass, A.; Larson, M.G.; Massaro, J.M.; Wang, N.; D’Agostino, R.B.; Benjamin, E.J.; Murabito, J.M. Biomarkers of oxidative stress are associated with frailty: The Framingham Offspring Study. Age 2016, 38, 1. [Google Scholar] [CrossRef] [Green Version]
- Shlisky, J.; Bloom, D.E.; Beaudreault, A.R.; Tucker, K.L.; Keller, H.H.; Freund-Levi, Y.; Fielding, R.A.; Cheng, F.W.; Jensen, G.L.; Wu, D.; et al. Nutritional Considerations for Healthy Aging and Reduction in Age-Related Chronic Disease. Adv. Nutr. 2017, 8, 17–26. [Google Scholar] [CrossRef] [Green Version]
- Smee, D.; Pumpa, K.; Falchi, M.; Lithander, F.E. The Relationship between Diet Quality and Falls Risk, Physical Function and Body Composition in Older Adults. J. Nutr. Health Aging 2015, 19, 1037–1042. [Google Scholar] [CrossRef] [PubMed]
- Honório, S.; Batista, M.; Paulo, R.; Mendes, P.; Serrano, J.; Petrica, J.; Faustino, A.; Santos, J.; Martins, J. Functional fitness and nutritional status of institutionalized elderly. Med. Sport 2017, 70, 200–211. [Google Scholar] [CrossRef]
- Berendsen, A.A.M.; Kang, J.H.; van de Rest, O.; Feskens, E.J.M.; de Groot, L.; Grodstein, F. The Dietary Approaches to Stop Hypertension Diet, Cognitive Function, and Cognitive Decline in American Older Women. J. Am. Med. Dir. Assoc. 2017, 18, 427–432. [Google Scholar] [CrossRef] [PubMed]
- Lassale, C.; Batty, G.D.; Baghdadli, A.; Jacka, F.; Sánchez-Villegas, A.; Kivimäki, M.; Akbaraly, T. Healthy dietary indices and risk of depressive outcomes: A systematic review and meta-analysis of observational studies. Mol. Psychiatry 2019, 24, 965–986. [Google Scholar] [CrossRef] [Green Version]
- Coelho-Júnior, H.J.; Trichopoulou, A.; Panza, F. Cross-sectional and longitudinal associations between adherence to Mediterranean diet with physical performance and cognitive function in older adults: A systematic review and meta-analysis. Ageing Res. Rev. 2021, 70, 101395. [Google Scholar] [CrossRef]
- The IDDSI Board. The International Dysphagia Diet Standardisation Initiative 2019. Licensed under the Creative Commons Attribution Sharealike 4.0 License. 2019. Available online: https://iddsi.org/framework/ (accessed on 1 January 2018).
- Zhang, J.-Y.; Lo, H.-C.; Yang, F.L.; Liu, Y.-F.; Wu, W.-M.; Chou, C.-C. Plant-Based, Antioxidant-Rich Snacks Elevate Plasma Antioxidant Ability and Alter Gut Bacterial Composition in Older Adults. Nutrients 2021, 13, 3872. [Google Scholar] [CrossRef]
- Vellas, B.; Guigoz, Y.; Garry, P.J.; Nourhashemi, F.; Bennahum, D.; Lauque, S.; Albarede, J.L. The Mini Nutritional Assessment (MNA) and its use in grading the nutritional state of elderly patients. Nutrition 1999, 15, 116–122. [Google Scholar] [CrossRef]
- Sport Administration. The Regulations of the National Physical Fitness Assessment. In Ministry of Education; 1070017352B; Sport Administration: Taipei, Taiwan, 2018. [Google Scholar]
- Sheikh, J.I.; Yesavage, J.A. Geriatric Depression Scale (GDS): Recent evidence and development of a shorter version. Clin. Gerontol. J. Aging Ment. Health 1986, 5, 165–173. [Google Scholar]
- Folstein, M.F.; Folstein, S.E.; McHugh, P.R. “Mini-mental state”. A practical method for grading the cognitive state of patients for the clinician. J. Psychiatr. Res. 1975, 12, 189–198. [Google Scholar] [CrossRef]
- Lim, K.-Y.; Chen, I.C.; Chan, Y.-C.; Cheong, I.-F.; Wang, Y.-Y.; Jian, Z.-R.; Lee, S.-D.; Chou, C.-C.; Yang, F.L. Novel Healthy Eating Index to Examine Daily Food Guides Adherence and Frailty in Older Taiwanese. Nutrients 2021, 13, 4210. [Google Scholar] [CrossRef]
- Mahoney, F.I.; Barthel, D.W. Functional Evaluation: The Barthel Index. Md. State Med. J. 1965, 14, 61–65. [Google Scholar] [PubMed]
- Lawton, M.P.; Brody, E.M. Assessment of older people: Self-maintaining and instrumental activities of daily living. Gerontologist 1969, 9, 179–186. [Google Scholar] [CrossRef] [PubMed]
- Locquet, M.; Sanchez-Rodriguez, D.; Bruyère, O.; Geerinck, A.; Lengelé, L.; Reginster, J.Y.; Beaudart, C. Intrinsic Capacity Defined Using Four Domains and Mortality Risk: A 5-Year Follow-Up of the SarcoPhAge Cohort. J. Nutr. Health Aging 2022, 26, 23–29. [Google Scholar] [CrossRef] [PubMed]
- Granic, A.; Mendonça, N.; Hill, T.R.; Jagger, C.; Stevenson, E.J.; Mathers, J.C.; Sayer, A.A. Nutrition in the Very Old. Nutrients 2018, 10, 269. [Google Scholar] [CrossRef] [PubMed] [Green Version]
- Harman, D. Free radical theory of aging: An update: Increasing the functional life span. Ann. N. Y. Acad. Sci. 2006, 1067, 10–21. [Google Scholar] [CrossRef] [PubMed]
- Soysal, P.; Isik, A.T.; Carvalho, A.F.; Fernandes, B.S.; Solmi, M.; Schofield, P.; Veronese, N.; Stubbs, B. Oxidative stress and frailty: A systematic review and synthesis of the best evidence. Maturitas 2017, 99, 66–72. [Google Scholar] [CrossRef] [Green Version]
- Brown, J.E. Nutrition through the Life Cycle, 7th ed.; Cengage Learning: Boston, MA, USA, 2019. [Google Scholar]
- Ekstrand, B.; Scheers, N.; Rasmussen, M.K.; Young, J.F.; Ross, A.B.; Landberg, R. Brain foods—The role of diet in brain performance and health. Nutr Rev. 2021, 79, 693–708. [Google Scholar] [CrossRef]
- Byrd-Bredbenner, C.; Beshgetoor, D.; Moe, G.; Berning, J. Wardlaw’s Perspective in Nutrition, Eighth Edition; McGraw-Hill: New York, NY, USA, 2007. [Google Scholar]
- Zempleni, J.; Rucker, R.B.; McCormick, D.B.; Suttie, J.W. Handbook of Vitamins, 4th ed.; CRC Press: Boca Raton, FL, USA, 2007. [Google Scholar]
- Riediger, N.D.; Othman, R.A.; Suh, M.; Moghadasian, M.H. A systemic review of the roles of n-3 fatty acids in health and disease. J. Am. Diet. Assoc. 2009, 109, 668–679. [Google Scholar] [CrossRef]
- Weaver, C.M. Bioactive Foods and Ingredients for Health. Adv. Nutr. 2014, 5, 306S–311S. [Google Scholar] [CrossRef] [Green Version]
- Yeung, S.S.Y.; Chan, R.S.M.; Lee, J.S.W.; Woo, J. Certain dietary patterns are associated with GLIM criteria among Chinese community-dwelling older adults: A cross-sectional analysis. J. Nutr. Sci. 2021, 10, e69. [Google Scholar] [CrossRef]
- Leon-Munoz, L.M.; Guallar-Castillon, P.; Lopez-Garcia, E.; Rodriguez-Artalejo, F. Mediterranean diet and risk of frailty in community-dwelling older adults. J. Am. Med. Dir. Assoc. 2014, 15, 899–903. [Google Scholar] [CrossRef] [PubMed]
- Belloni, G.; Cesari, M. Frailty and Intrinsic Capacity: Two Distinct but Related Constructs. Front. Med. 2019, 6, 5. [Google Scholar] [CrossRef] [PubMed]
- Struijk, E.A.; Hagan, K.A.; Fung, T.T.; Hu, F.B.; Rodríguez-Artalejo, F.; Lopez-Garcia, E. Diet quality and risk of frailty among older women in the Nurses’ Health Study. Am. J. Clin. Nutr. 2020, 111, 877–883. [Google Scholar] [CrossRef] [PubMed]
- Ward, R.E.; Orkaby, A.R.; Chen, J.; Hshieh, T.T.; Driver, J.A.; Gaziano, J.M.; Djousse, L. Association between Diet Quality and Frailty Prevalence in the Physicians’ Health Study. J. Am. Geriatr. Soc. 2020, 68, 770–776. [Google Scholar] [CrossRef]
- Tsai, H.-J. Dietary patterns and depressive symptoms in a Taiwanese population aged 53 years and over: Results from the Taiwan Longitudinal Study of Aging. Geriatr. Gerontol. Int. 2016, 16, 1289–1295. [Google Scholar] [CrossRef]
- Chuang, S.Y.; Lo, Y.L.; Wu, S.Y.; Wang, P.N.; Pan, W.H. Dietary Patterns and Foods Associated with Cognitive Function in Taiwanese Older Adults: The Cross-sectional and Longitudinal Studies. J. Am. Med. Dir. Assoc. 2019, 20, 544–550.e4. [Google Scholar] [CrossRef]
- Kobayashi, S.; Suga, H.; Sasaki, S. Diet with a combination of high protein and high total antioxidant capacity is strongly associated with low prevalence of frailty among old Japanese women: A multicenter cross-sectional study. Nutr. J. 2017, 16, 29. [Google Scholar] [CrossRef] [Green Version]
- Shivappa, N.; Stubbs, B.; Hébert, J.R.; Cesari, M.; Schofield, P.; Soysal, P.; Maggi, S.; Veronese, N. The Relationship between the Dietary Inflammatory Index and Incident Frailty: A Longitudinal Cohort Study. J. Am. Med. Dir. Assoc. 2018, 19, 77–82. [Google Scholar] [CrossRef]
- Yang, J.-H. The Effect of Supplementation with Antioxidant-Rich Diet on the Immune Function and Iron Metabolism of Institutionalized Elderly in Taiwan. Master’s Thesis, Fu Jen Catholic University, New Taipei City, Taiwan, 2019. [Google Scholar]
- Health Promotion Administration. 2013–2016 Nutrition and Health Survey in Taiwan; Health Promotion Administration, Ministry of Health and Welfare: Taipei, Taiwan, 2019.
- Minister of Health and Welfare. 2015–2016 Oral Health Survey of Adults and Older Adults in Taiwan; Ministry of Health and Welfare: Taipei, Taiwan, 2016.
- Maitre, I.; Lourtioux, F.; Picouet, P.; Braud, A. Oral health–related food selectivity among French independently living elders. J. Oral Rehabil. 2020, 47, 511–522. [Google Scholar] [CrossRef]
- Lee, J.S.; Weyant, R.J.; Corby, P.; Kritchevsky, S.B.; Harris, T.B.; Rooks, R.; Rubin, S.M.; Newman, A.B. Edentulism and nutritional status in a biracial sample of well-functioning, community-dwelling elderly: The Health, Aging, and Body Composition Study. Am. J. Clin. Nutr. 2004, 79, 295–302. [Google Scholar] [CrossRef] [Green Version]
- Michikawa, T.; Nishiwaki, Y.; Takebayashi, T.; Toyama, Y. One-leg standing test for elderly populations. J. Orthop. Sci. 2009, 14, 675–685. [Google Scholar] [CrossRef] [PubMed]
- Jones, C.J.; Rikli, R.E. Measuring functional fitness of older adults. J. Act. Aging 2002, 25–30. [Google Scholar]
- Chan, R.; Yau, F.; Yu, B.; Woo, J. The Role of Dietary Patterns in the Contribution of Cardiorespiratory Fitness in Community-Dwelling Older Chinese Adults in Hong Kong. J. Am. Med. Dir. Assoc. 2019, 20, 558–563. [Google Scholar] [CrossRef] [PubMed]
- Hsieh, T.-J.; Su, S.-C.; Chen, C.-W.; Kang, Y.-W.; Hu, M.-H.; Hsu, L.-L.; Wu, S.-Y.; Chen, L.; Chang, H.-Y.; Chuang, S.-Y.; et al. Individualized home-based exercise and nutrition interventions improve frailty in older adults: A randomized controlled trial. Int. J. Behav. Nutr. Phys. Act. 2019, 16, 119. [Google Scholar] [CrossRef] [Green Version]
- Kwon, J.; Yoshida, Y.; Yoshida, H.; Kim, H.; Suzuki, T.; Lee, Y. Effects of a combined physical training and nutrition intervention on physical performance and health-related quality of life in prefrail older women living in the community: A randomized controlled trial. J. Am. Med. Dir. Assoc. 2015, 16, 263.e1–263.e8. [Google Scholar] [CrossRef]
- Albouaini, K.; Egred, M.; Alahmar, A.; Wright, D.J. Cardiopulmonary exercise testing and its application. Postgrad. Med. J. 2007, 83, 675–682. [Google Scholar] [CrossRef]
- Lin, M.Y.; Gutierrez, P.R.; Stone, K.L.; Yaffe, K.; Ensrud, K.E.; Fink, H.A.; Sarkisian, C.A.; Coleman, A.L.; Mangione, C.M. Vision impairment and combined vision and hearing impairment predict cognitive and functional decline in older women. J. Am. Med. Dir. Assoc. 2004, 52, 1996–2002. [Google Scholar] [CrossRef] [Green Version]
- Crews, J.E.; Campbell, V.A. Vision Impairment and Hearing Loss among Community-Dwelling Older Americans: Implications for Health and Functioning. Am. J. Public Health 2004, 94, 823–829. [Google Scholar] [CrossRef]


| All | Cluster 1 (n = 13) | Cluster 2 (n = 30) | Cluster 3 (n = 16) | p-Value 2 | ||
|---|---|---|---|---|---|---|
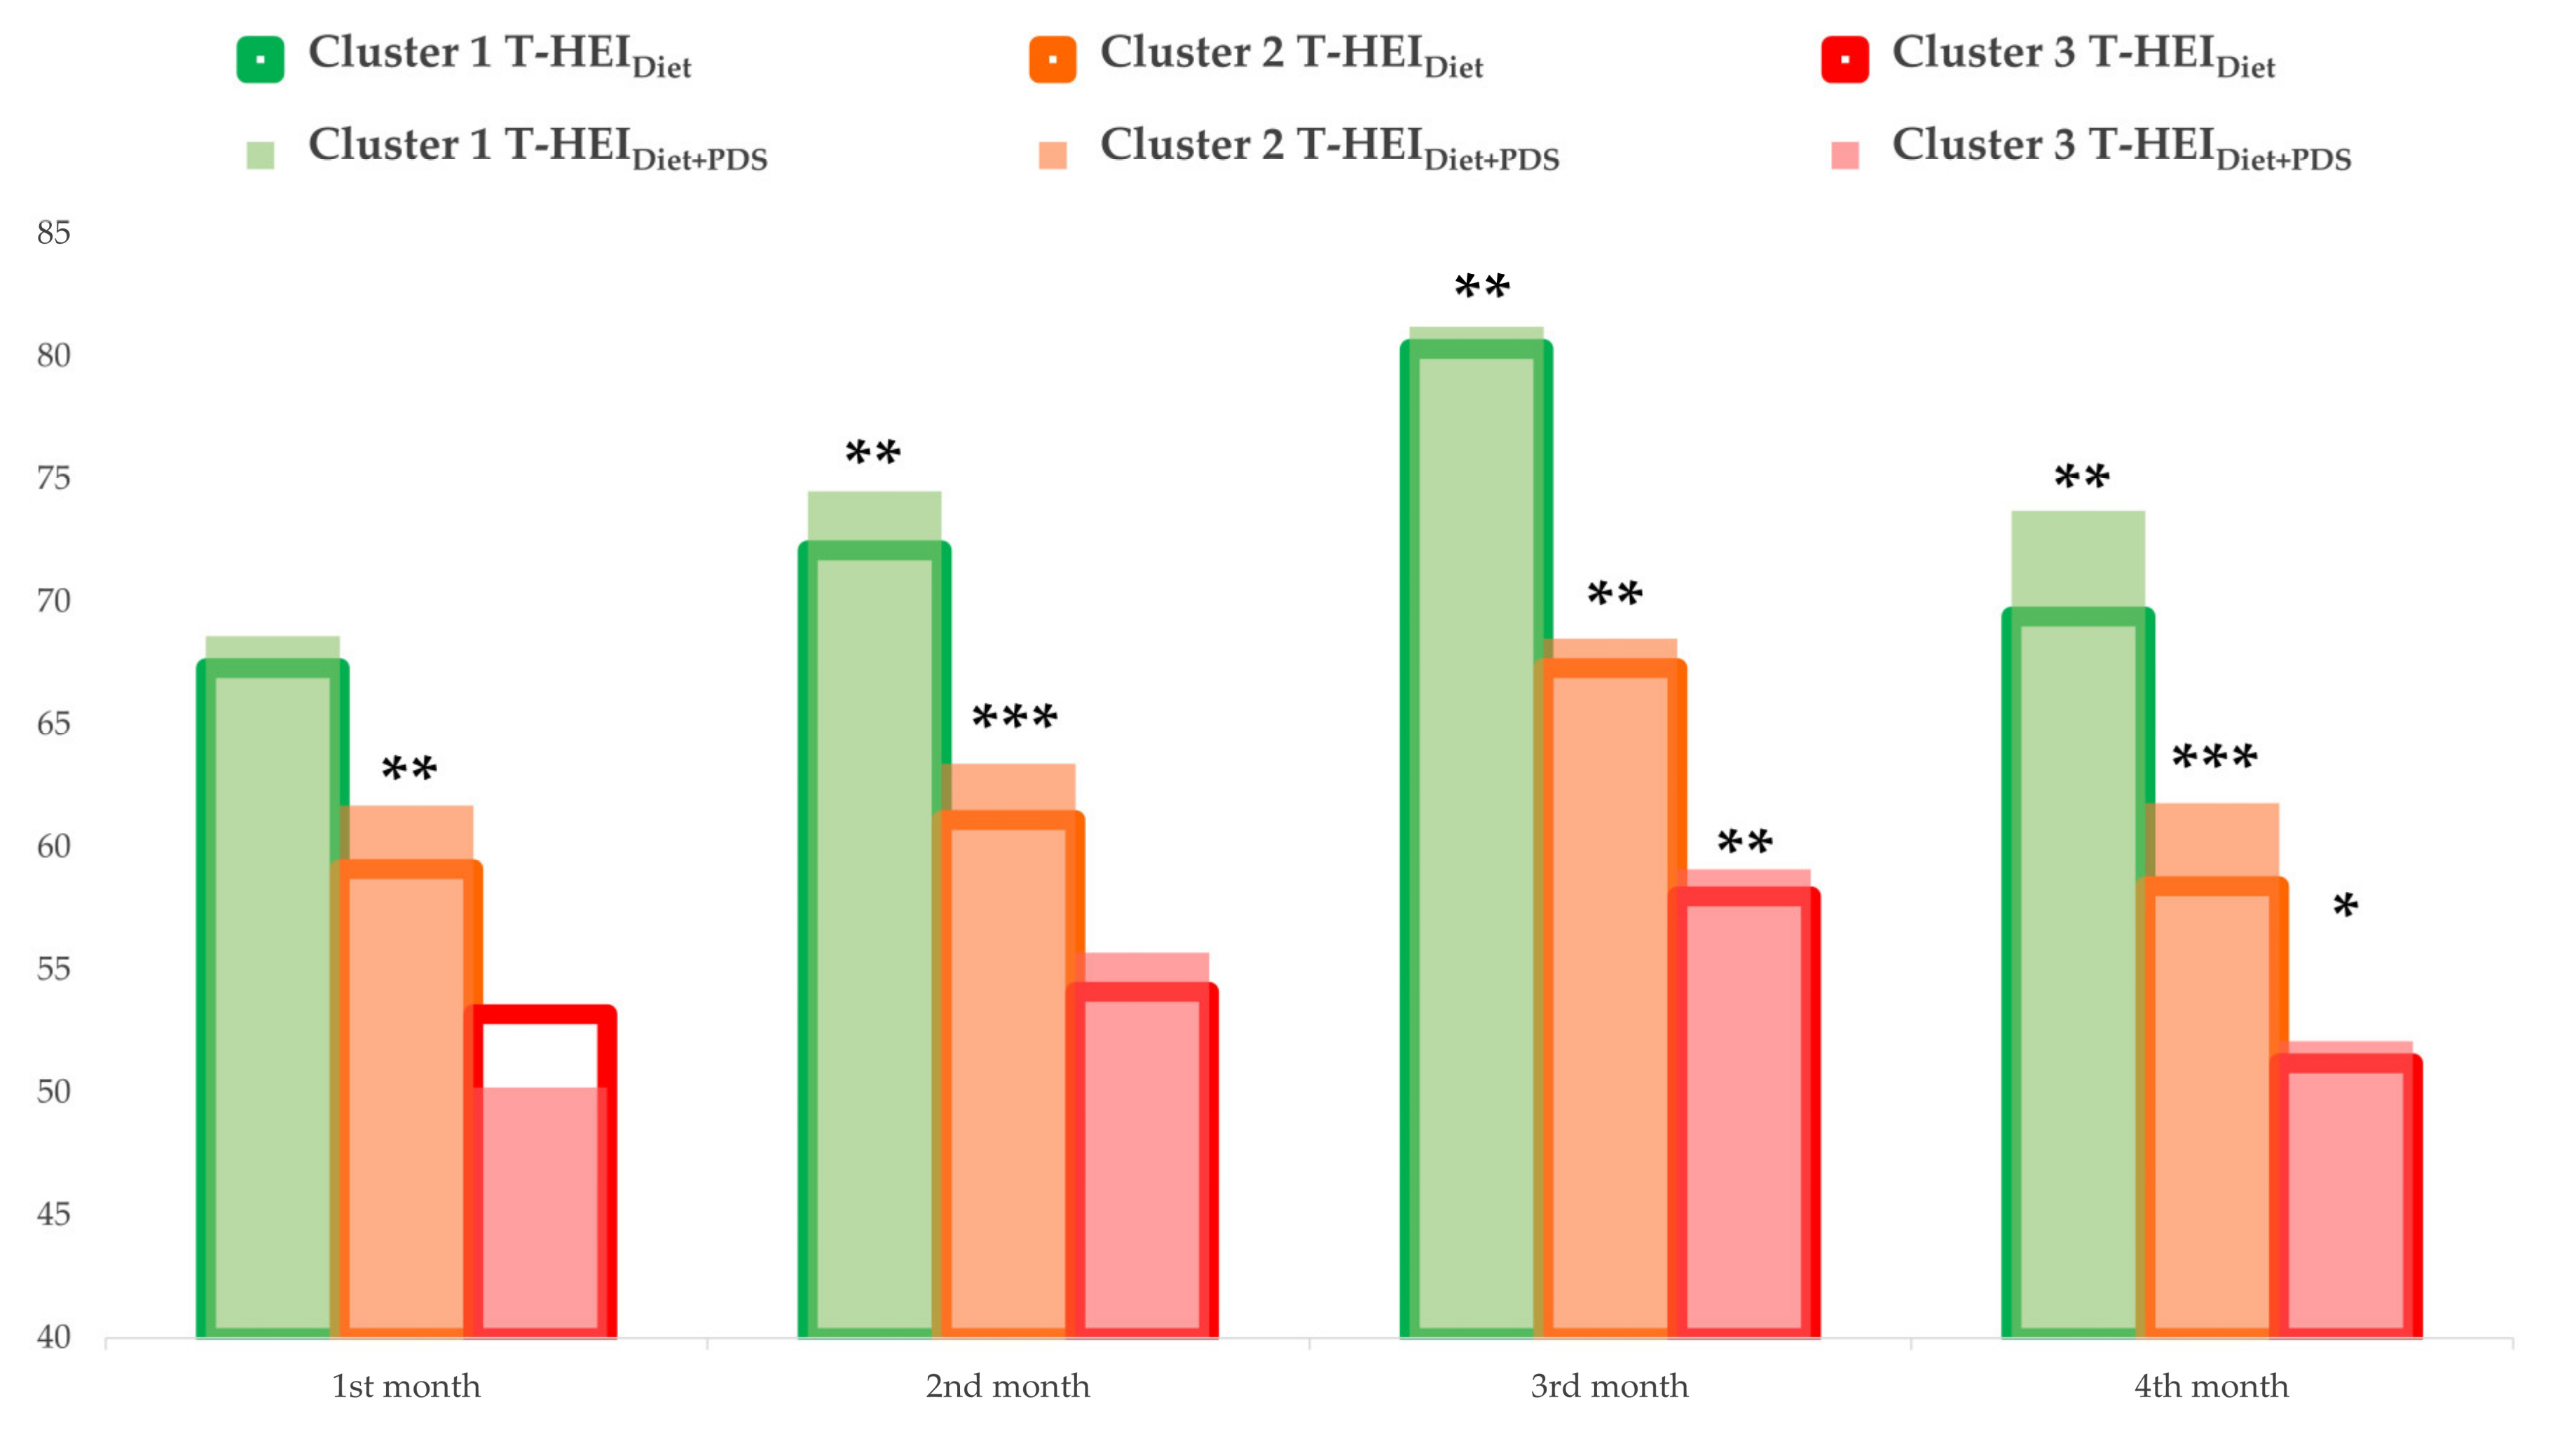
| 1st month | Diet | 59.3 ± 0.9 | 67.3 ± 0.8 a | 59.1 ± 0.9 b | 53.2 ± 0.9 c | <0.001 |
| Diet + PDS | 60.1 ± 1.1 | 68.6 ± 1.2 a | 61.7 ± 1.0 b,** | 50.2 ± 1.4 c | <0.001 | |
| 2nd month | Diet | 61.6 ± 1.0 | 72.1 ± 1.0 a | 61.1 ± 0.9 b | 54.1 ± 0.8 c | <0.001 |
| Diet + PDS | 63.8 ± 1.0 *** | 74.5 ± 0.9 a,** | 63.4 ± 0.7 b,*** | 55.7 ± 0.9 c | <0.001 | |
| 3rd month | Diet | 67.6 ± 1.2 | 80.3 ± 0.3 a | 67.3 ± 1.1 b | 58 ± 1.5 c | <0.001 |
| Diet + PDS | 68.8 ± 1.2 *** | 81.2 ± 0.3 a,** | 68.5 ± 1.0 b,** | 59.1 ± 1.2 c,** | <0.001 | |
| 4th month | Diet | 58.9 ± 1.0 | 69.4 ± 0.4 a | 58.4 ± 0.9 b | 51.2 ± 0.5 c | <0.001 |
| Diet + PDS | 61.8 ± 1.1 *** | 73.7 ± 0.5 a,** | 61.8 ± 0.9 b,*** | 52.1 ± 0.5 c,* | <0.001 |
| ALL (n = 59) | Cluster 1 (n = 13) | Cluster 2 (n = 30) | Cluster 3 (n = 16) | p-Value 2 | ||
|---|---|---|---|---|---|---|
| Age | 80.7 ± 1.1 | 76.2 ± 2.6 a | 80.3 ± 1.3 a,b | 85.1 ± 2.2 b | 0.015 | |
| BMI | 24.7 ± 0.5 | 25.4 ± 1.5 | 24.1 ± 0.6 | 25.2 ± 0.8 | 0.481 | |
| T-HEIDiet (0–100) | 59.3 ± 0.9 | 67.3 ± 0.8 a | 59.1 ± 0.9 b | 53.2 ± 0.9 c | <0.001 | |
| ADL (0–100) | 95.2 ± 1.1 | 91.5 ± 3.9 | 97.2 ± 1.1 | 94.4 ± 1.8 | 0.216 | |
| IADL (0–24) | 18.2 ± 0.7 | 19.5 ± 1.4 | 18.9 ± 1.0 | 15.9 ± 1.5 | 0.079 | |
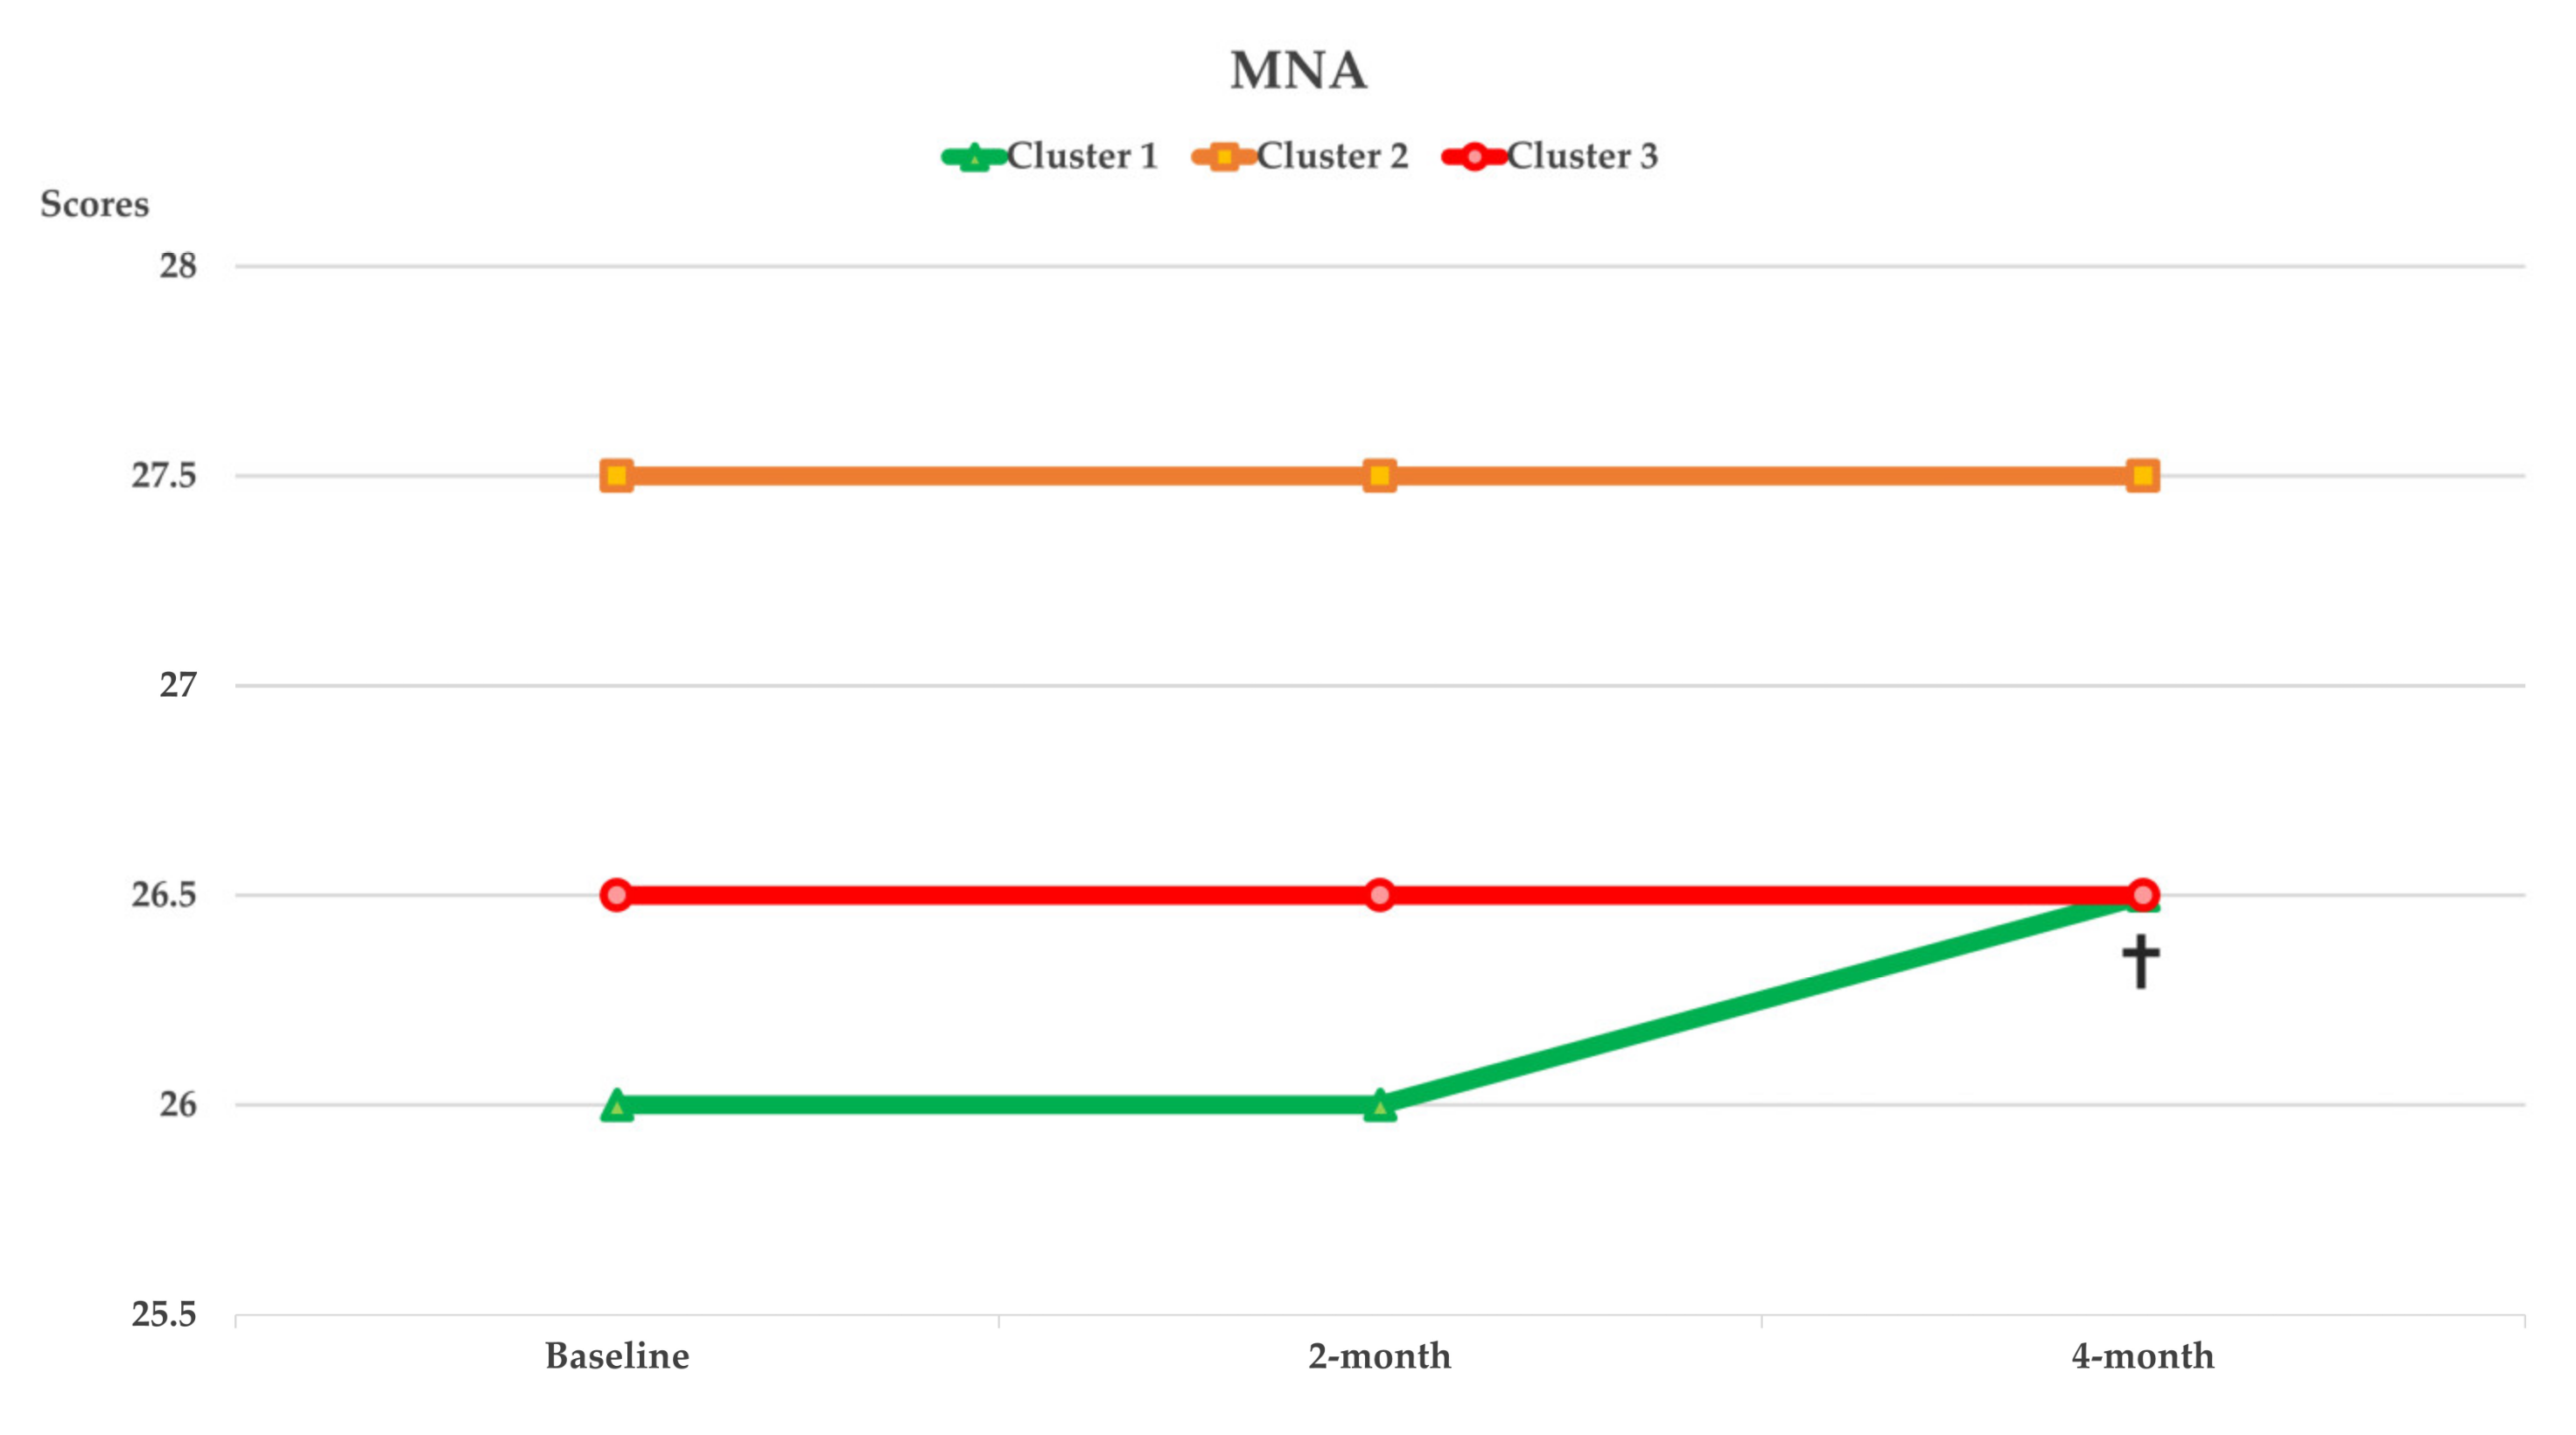
| Vitality | MNA (0–30) | 26.5 ± 0.3 | 25.5 ± 0.6 | 26.9 ± 0.4 | 26.4 ± 0.5 | 0.080 |
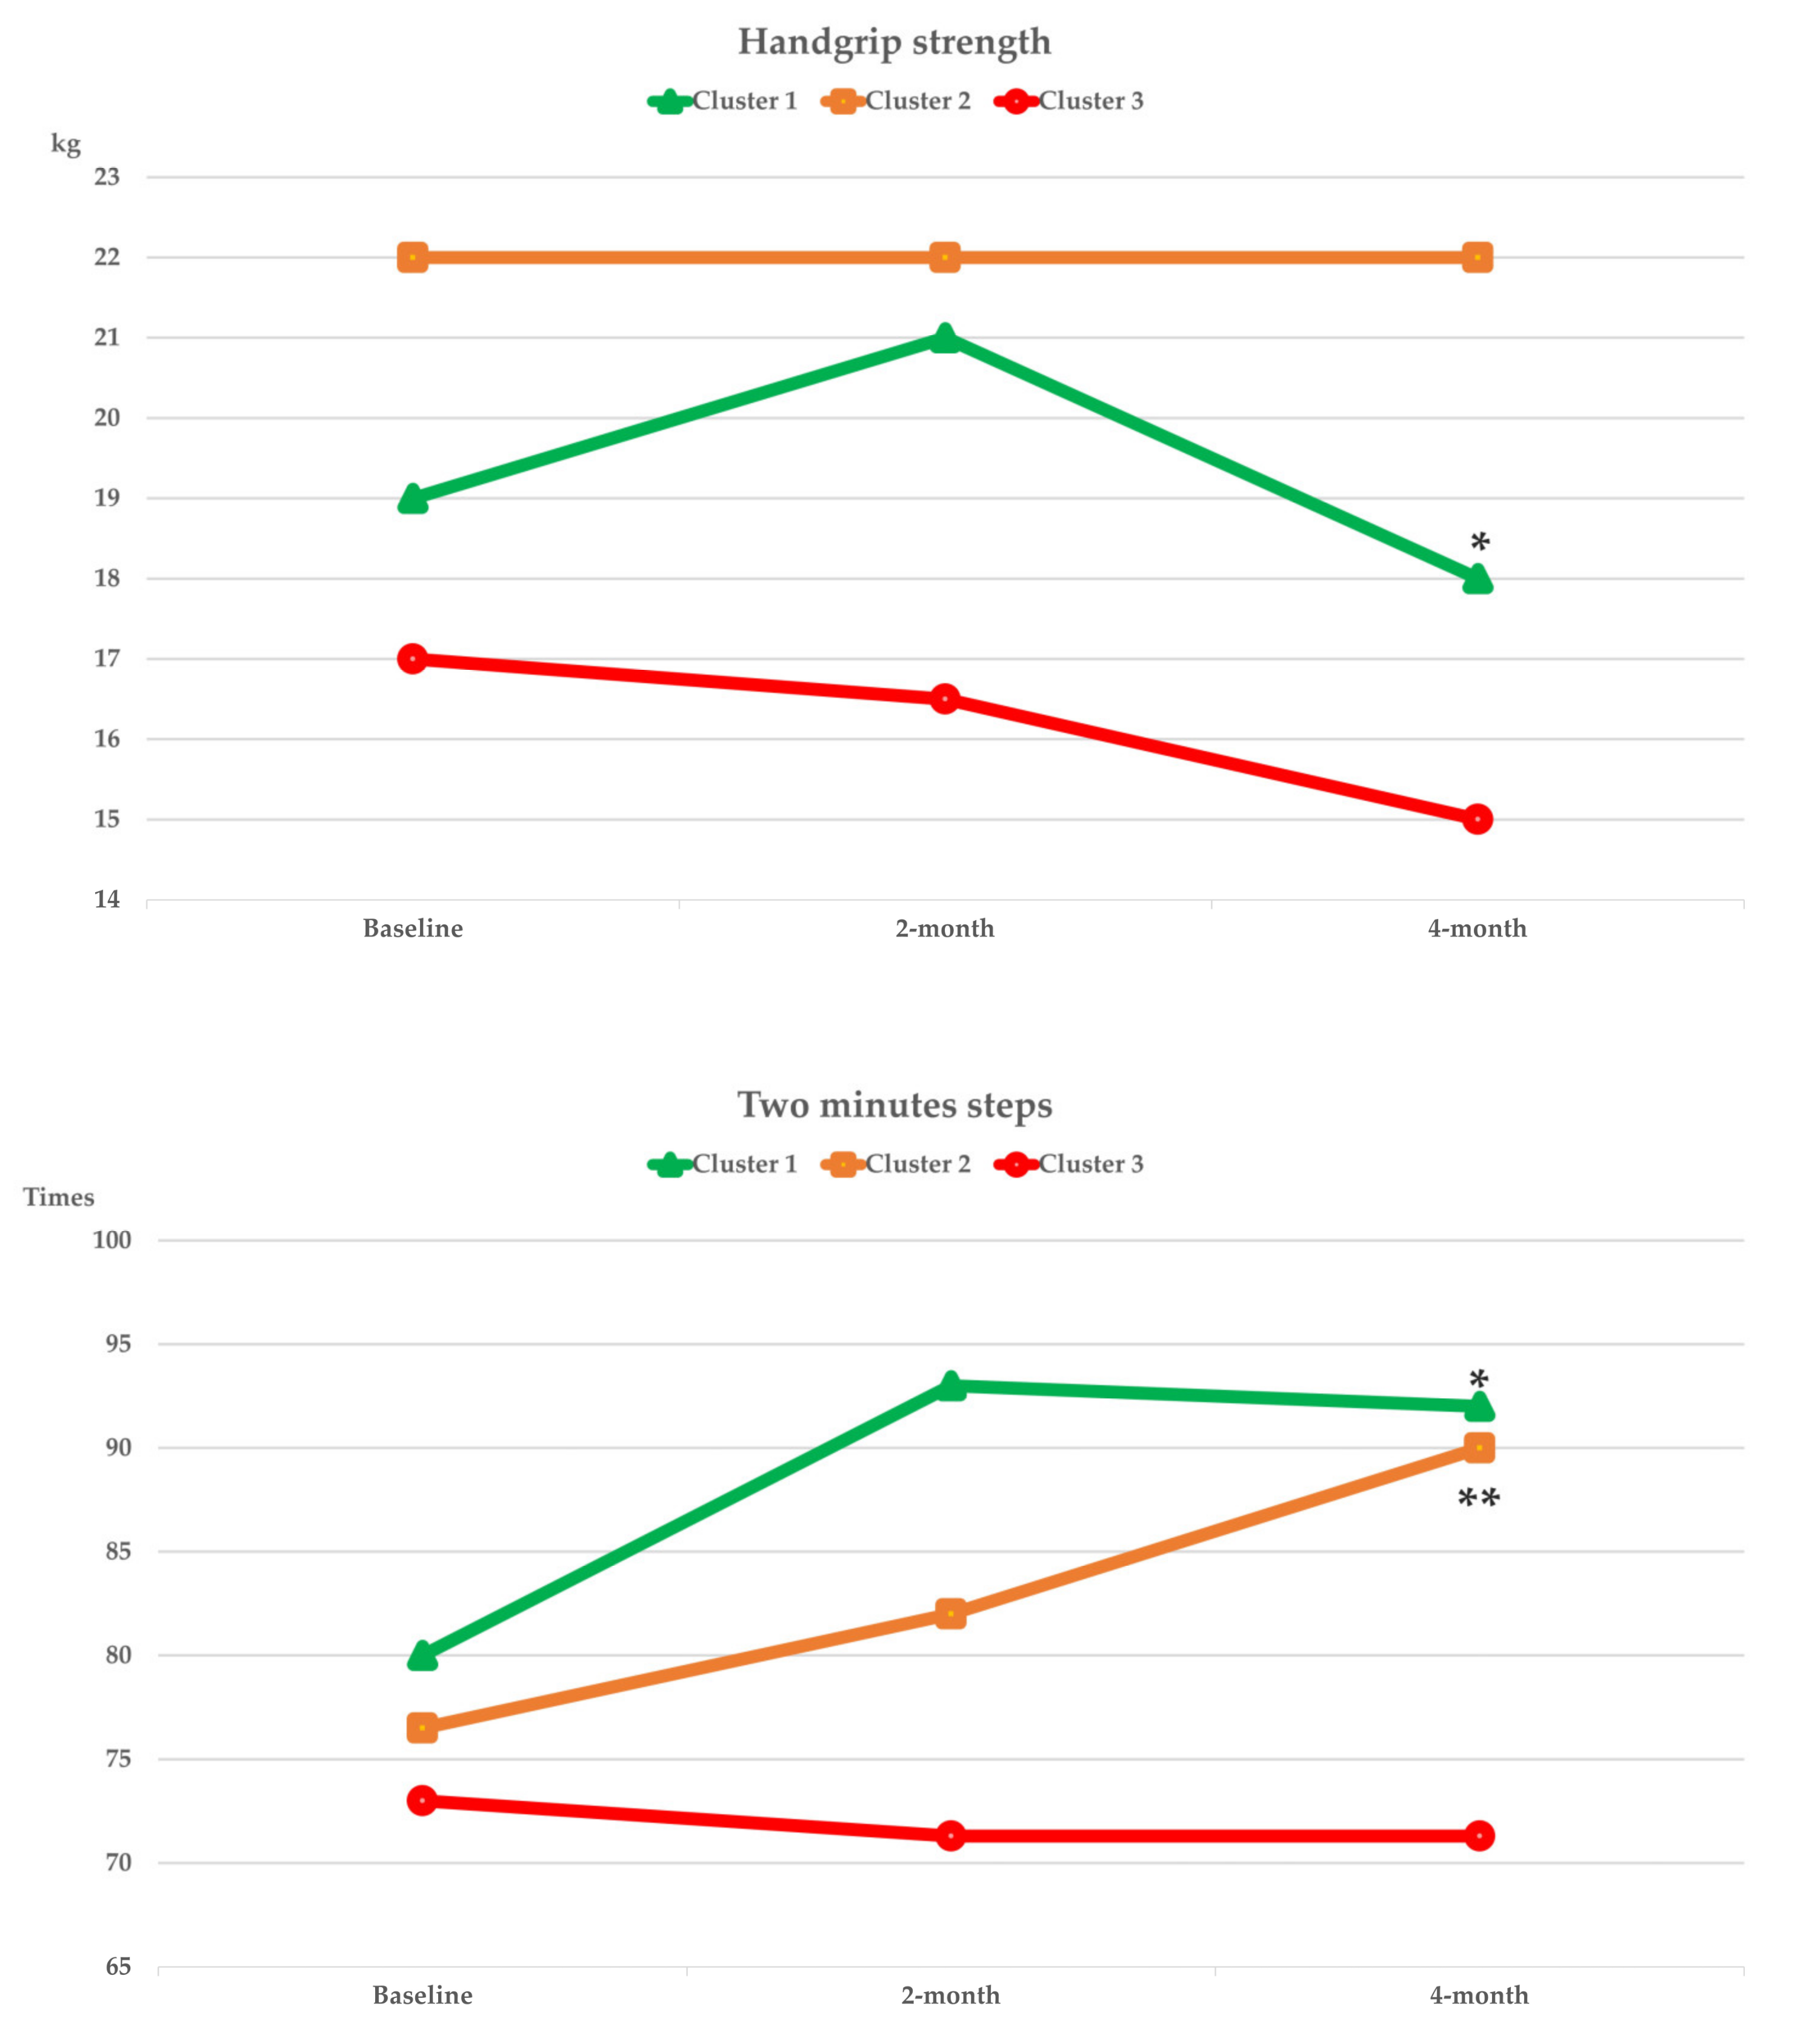
| HGS (kg) | 20.9 ± 0.9 | 20.8 ± 1.6 a b | 22.7 ± 1.2 a | 17.7 ± 1.8 b | 0.035 | |
| TMS (times) | 73.5 ± 3.9 | 75.5 ± 11.9 | 76.3 ± 5.0 | 66.8 ± 5.8 | 0.582 | |
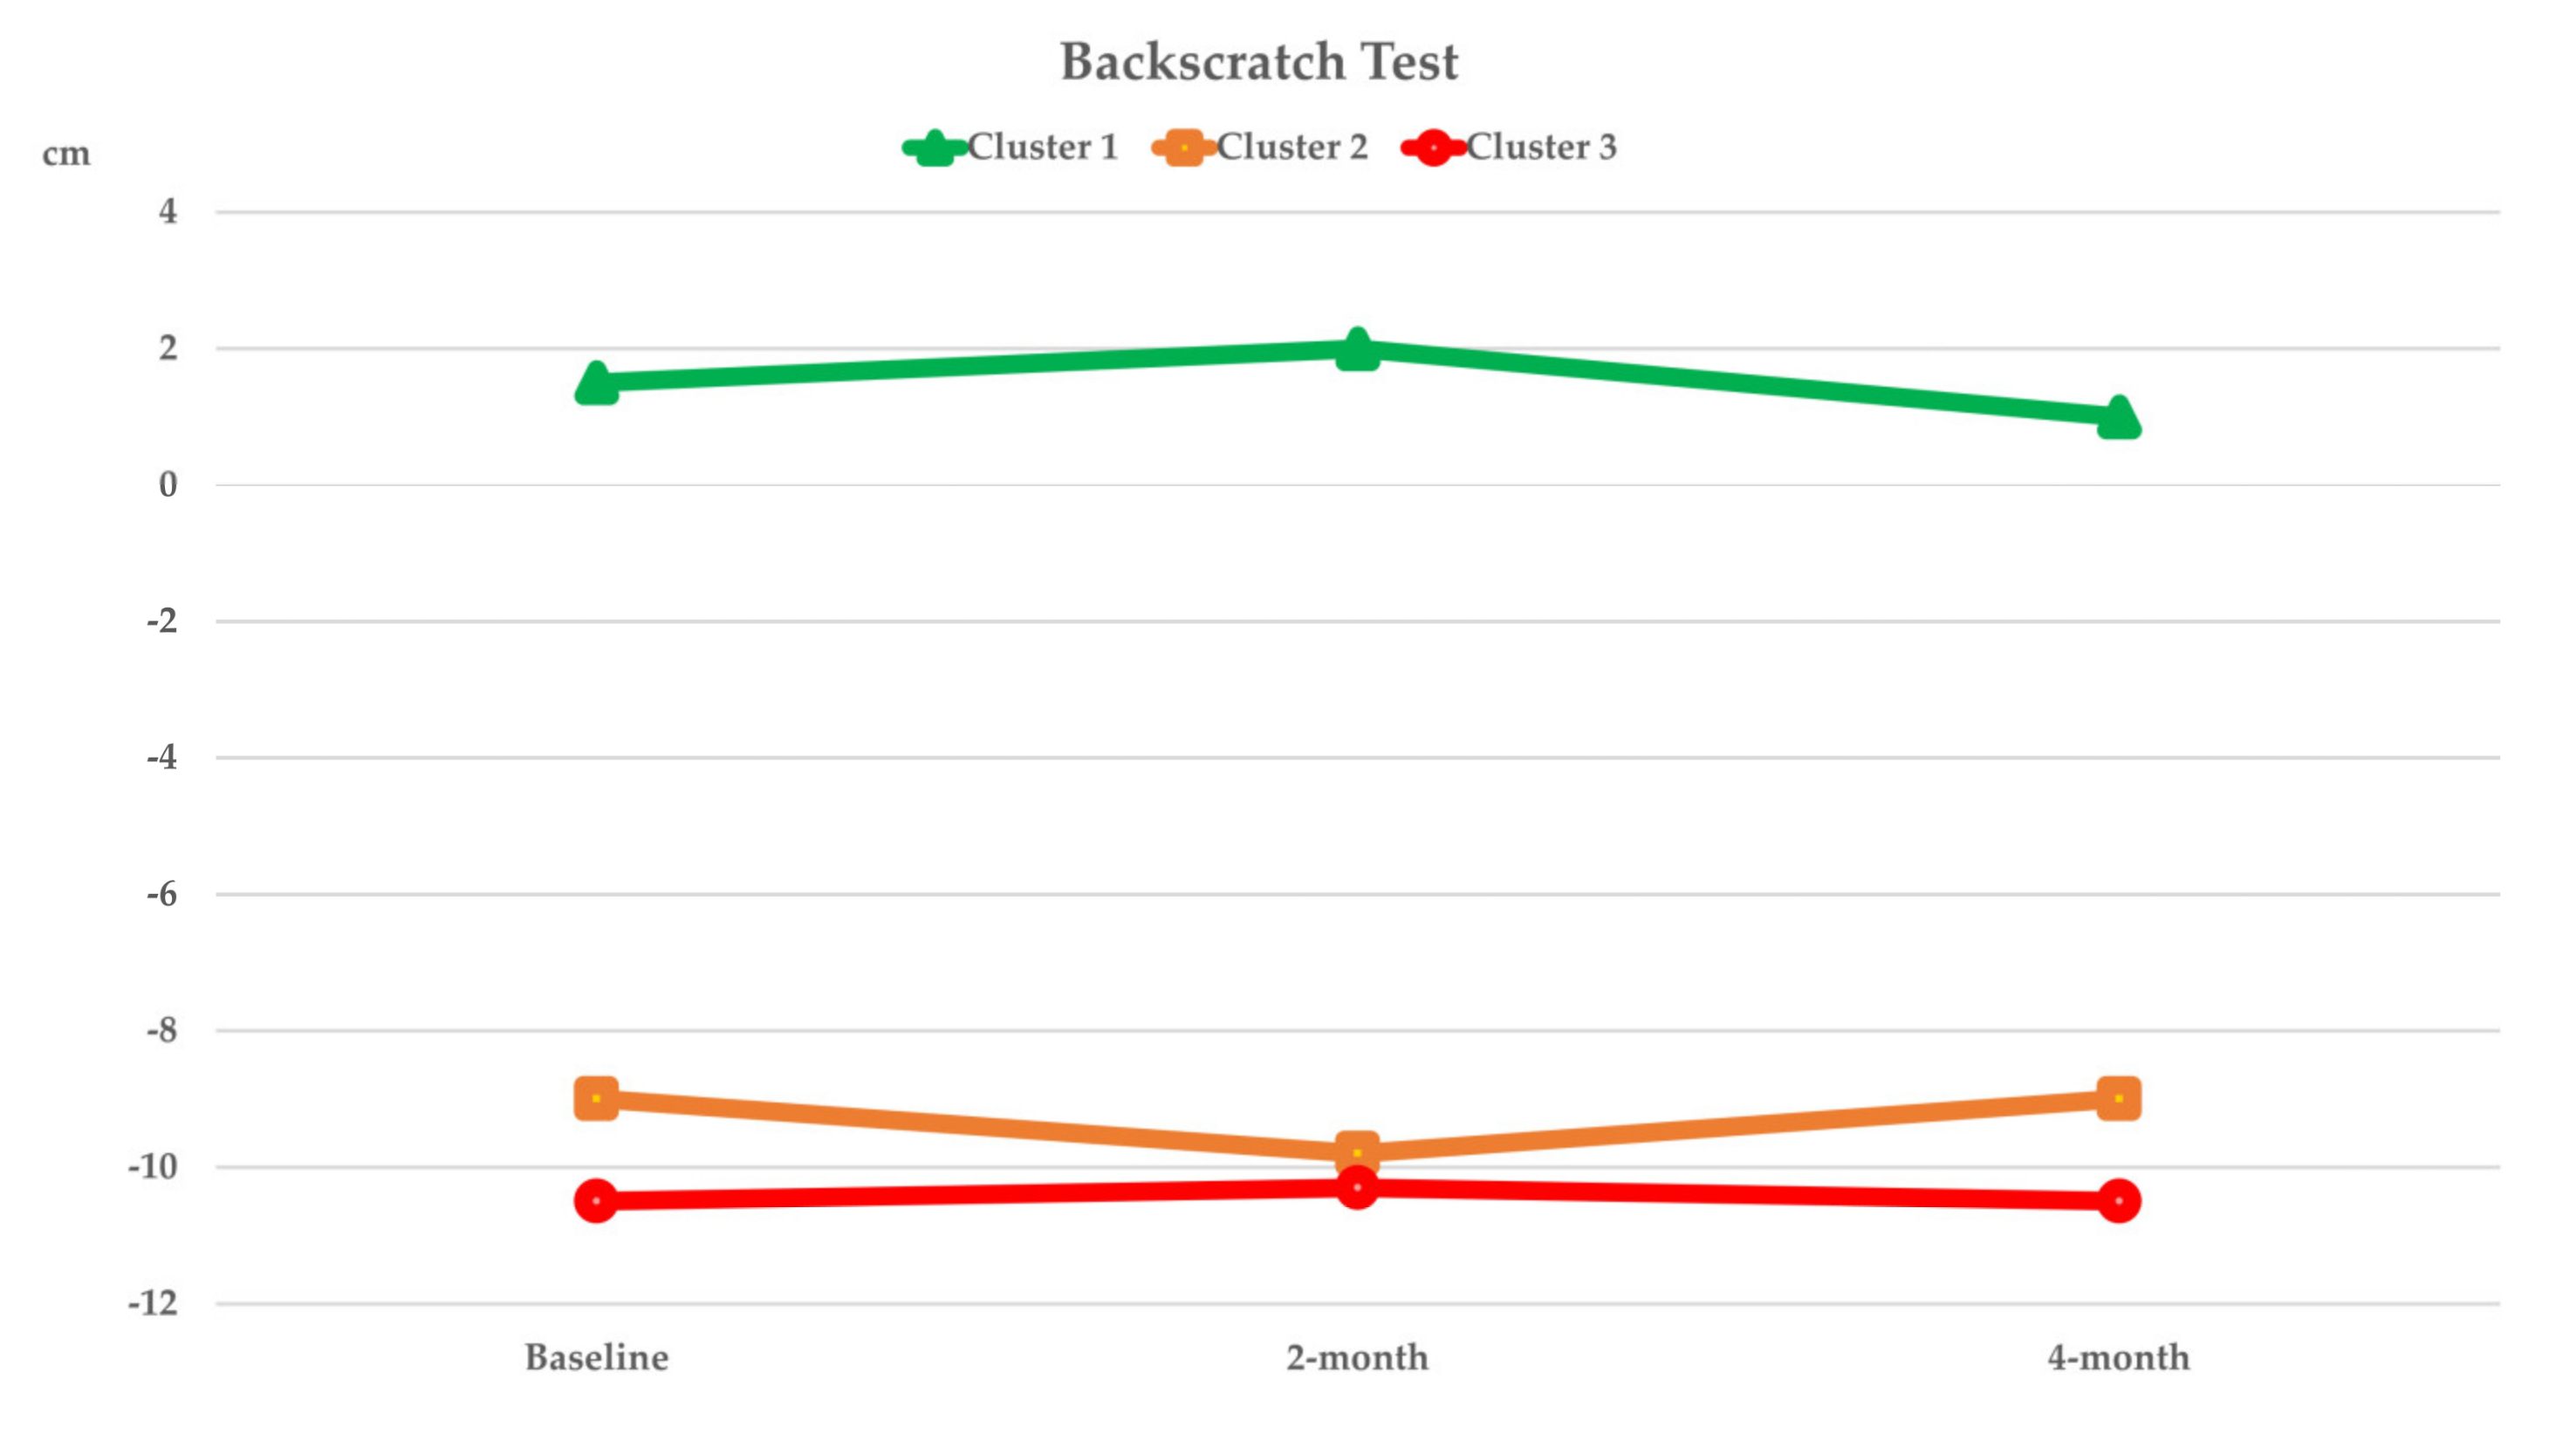
| Locomotion | BST (cm) | −9.6 ± 2 | −4.0 ± 3.1 | −12.6 ± 3.2 | −8.4 ± 3.4 | 0.356 |
| CSR (cm) | −4.2 ± 1.6 | −1.6 ± 3.3 | −3.1 ± 2.2 | −8.2 ± 2.9 | 0.192 | |
| CST (times) | 13.3 ± 0.8 | 14.3 ± 1.7 a | 14.2 ± 1.2 a,b | 10.6 ± 0.9 b | 0.044 | |
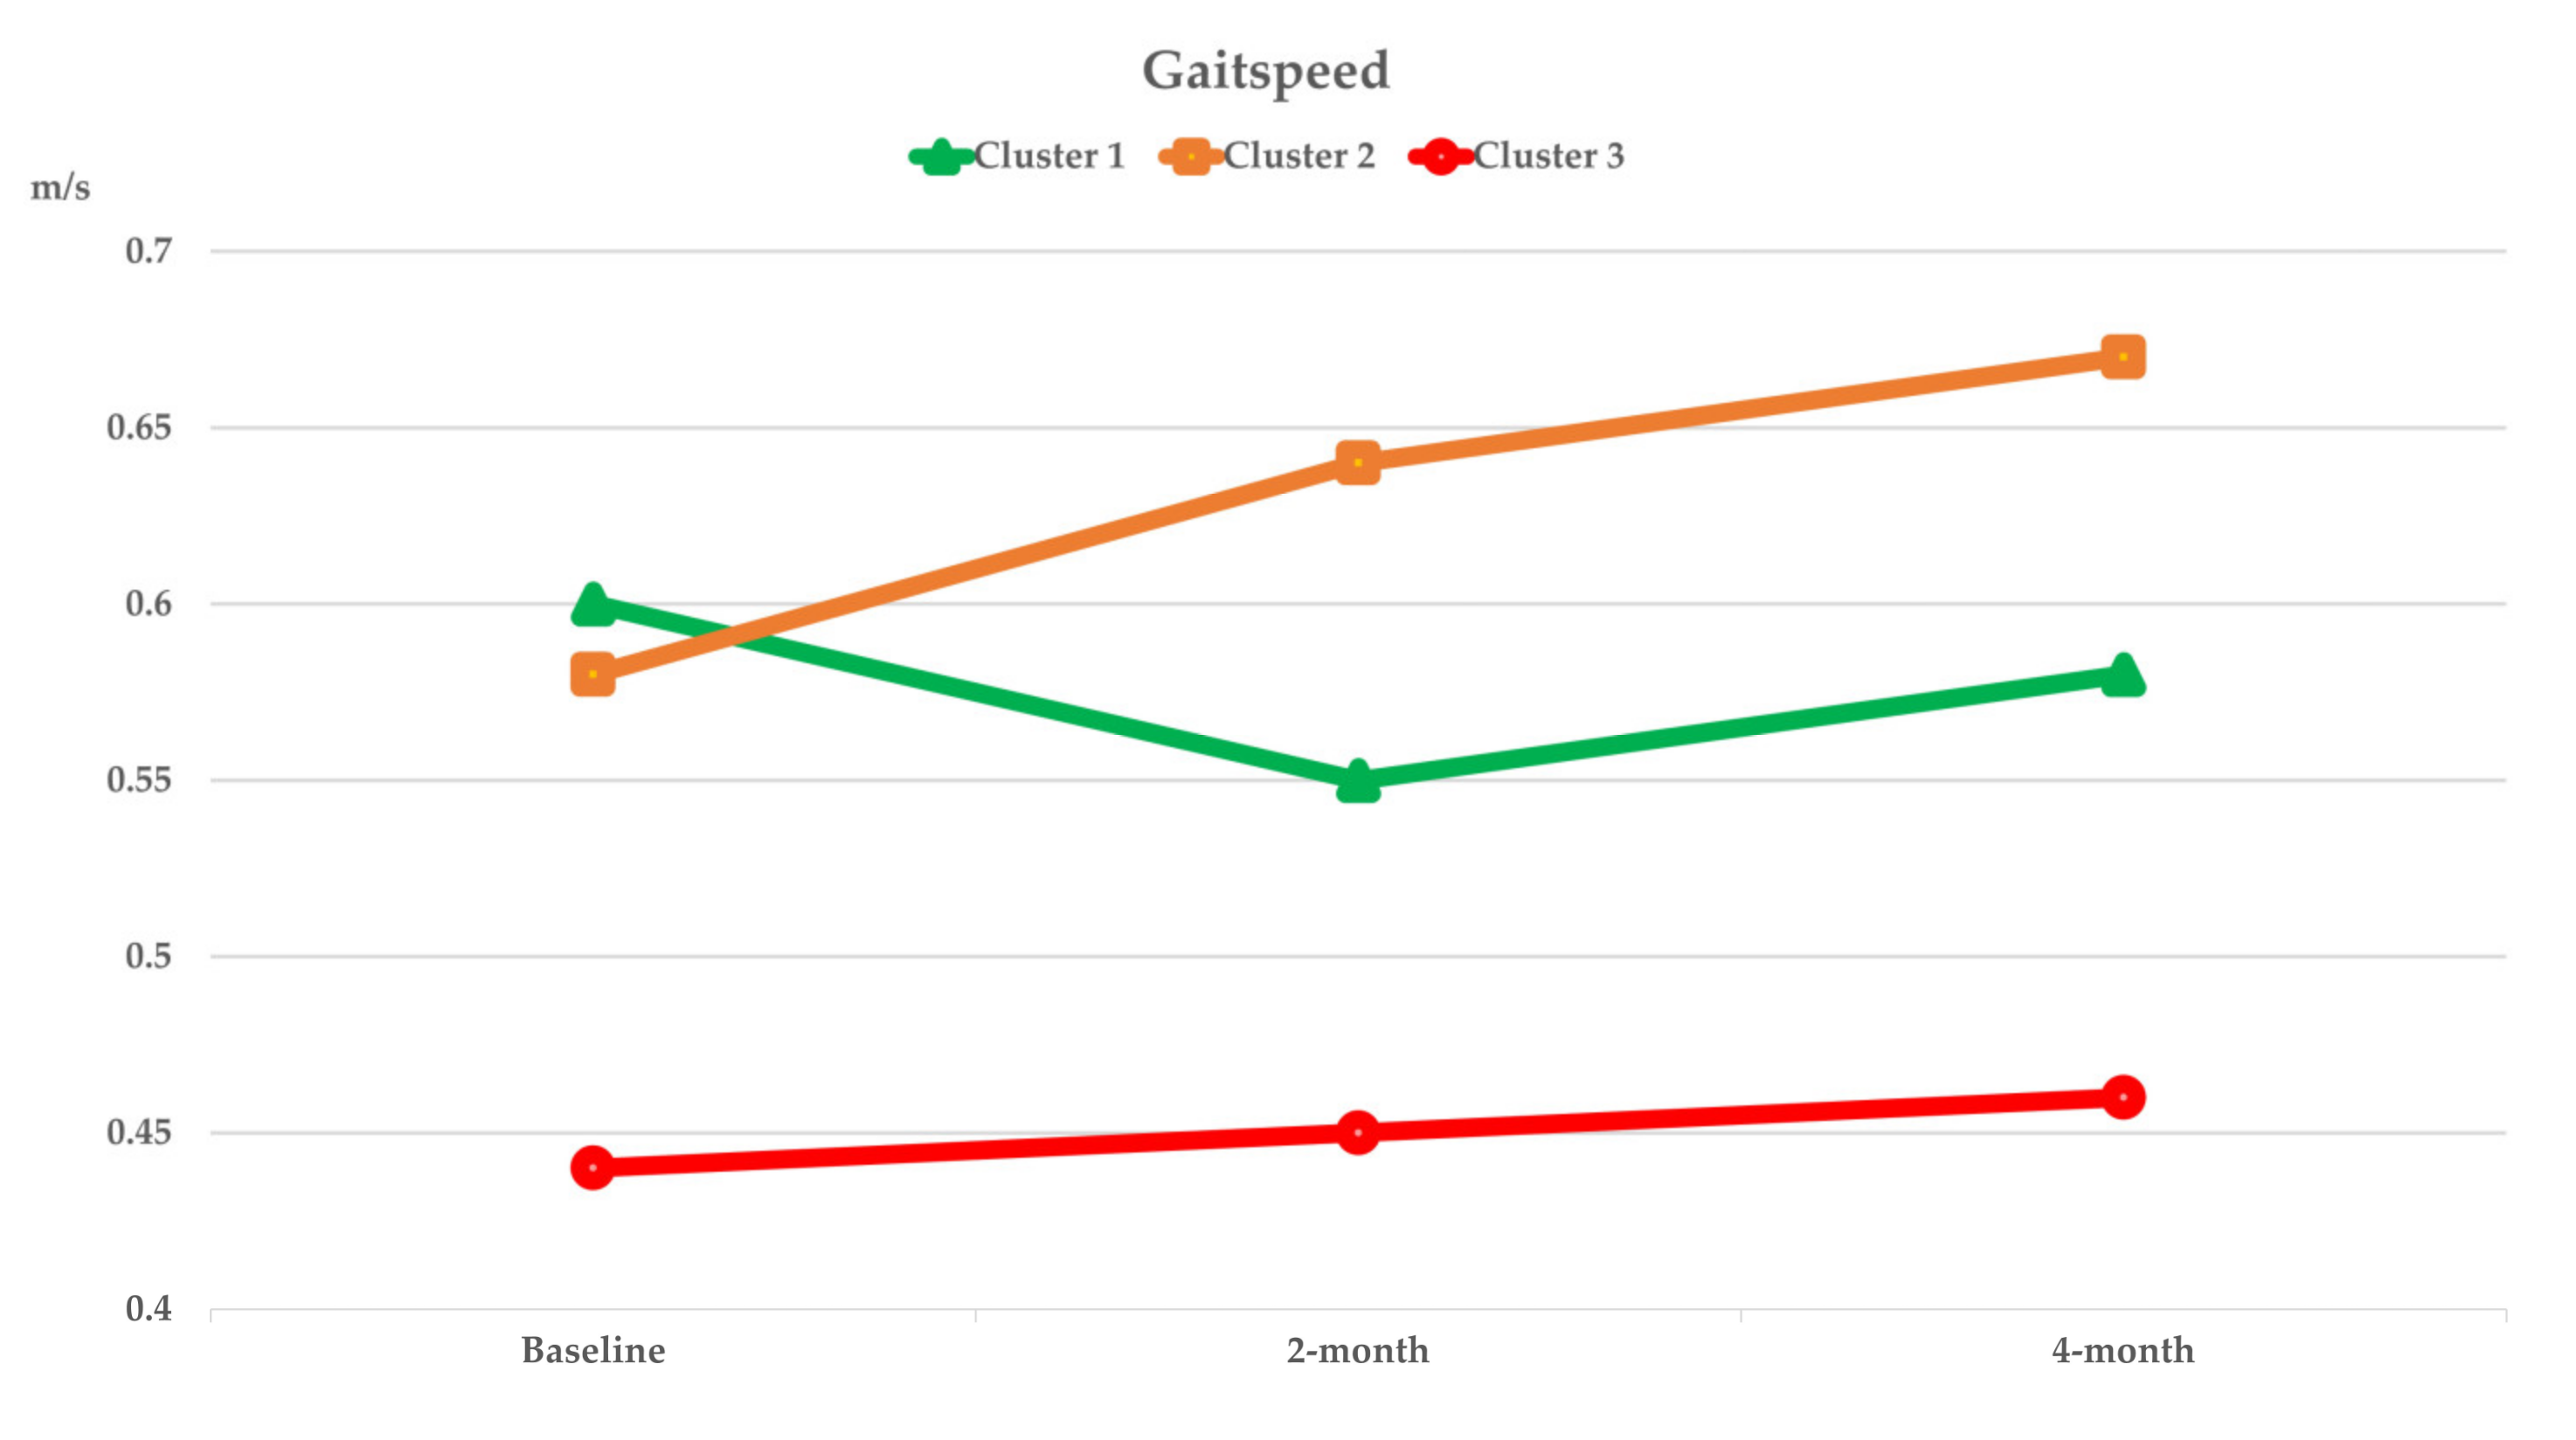
| GS (m/s) | 0.6 ± 0 | 0.7 ± 0.1 a | 0.6 ± 0 a | 0.5 ± 0.1 b | 0.021 | |
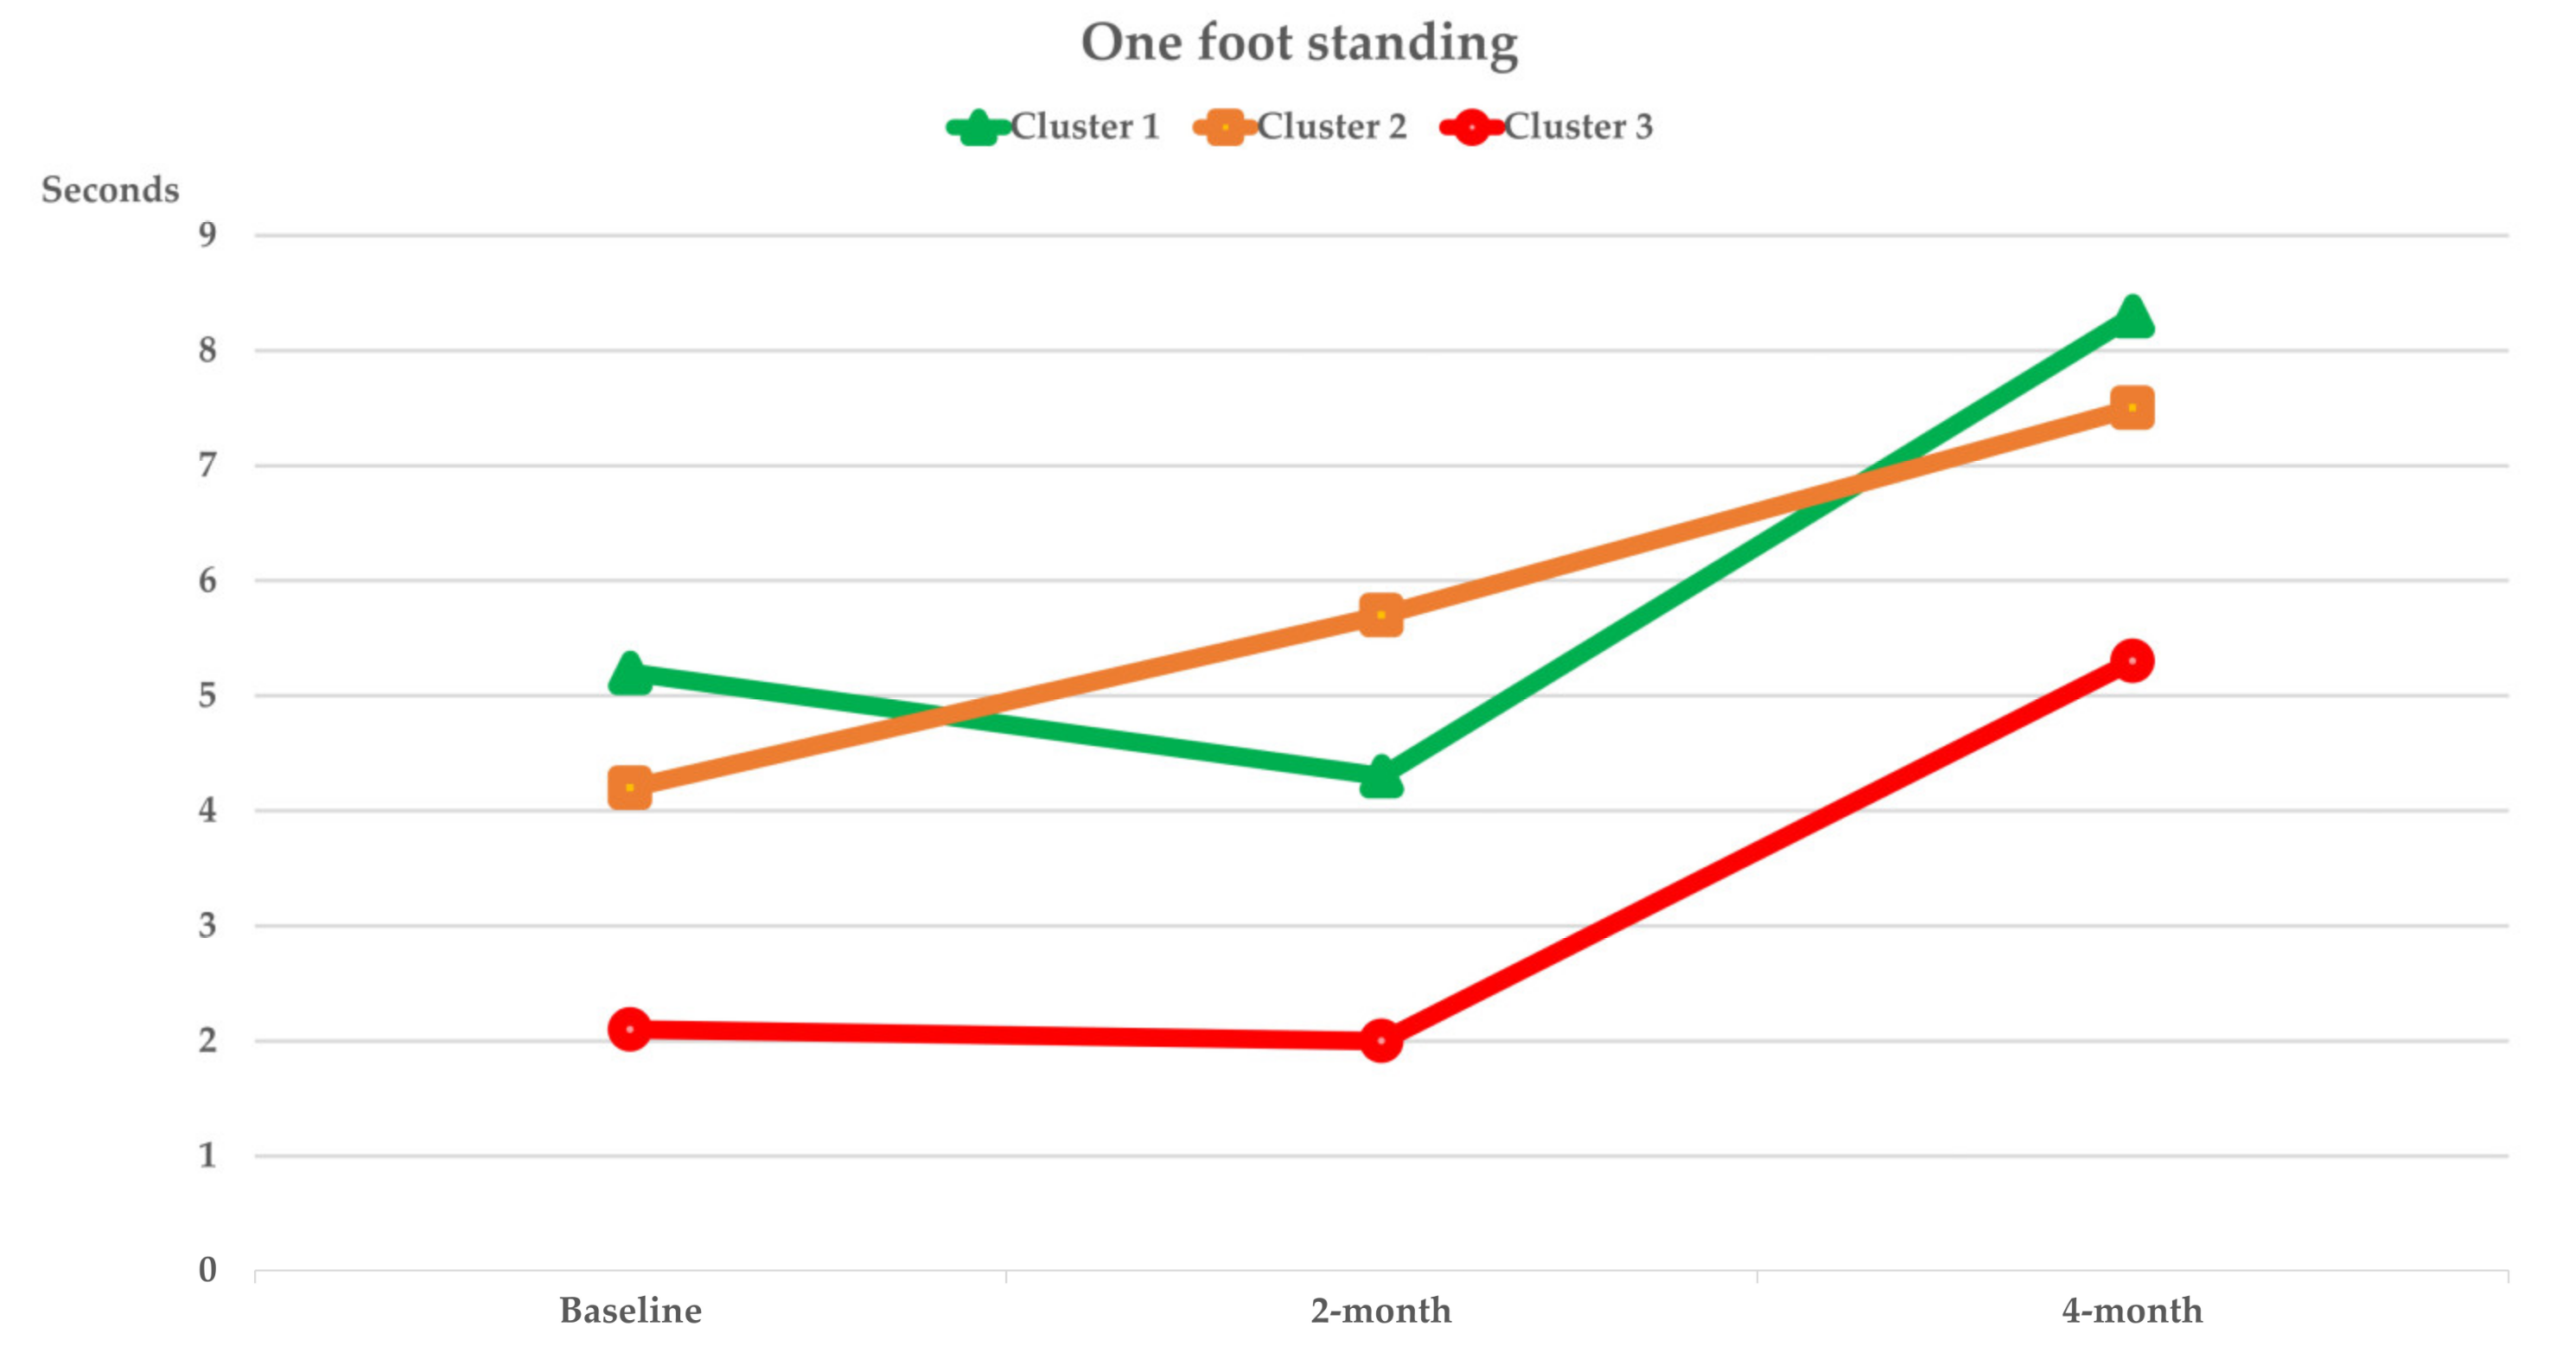
| OFS (sec) | 8.9 ± 1.3 | 12.7 ± 3.9 | 9.1 ± 1.7 | 5.4 ± 1.9 | 0.101 | |
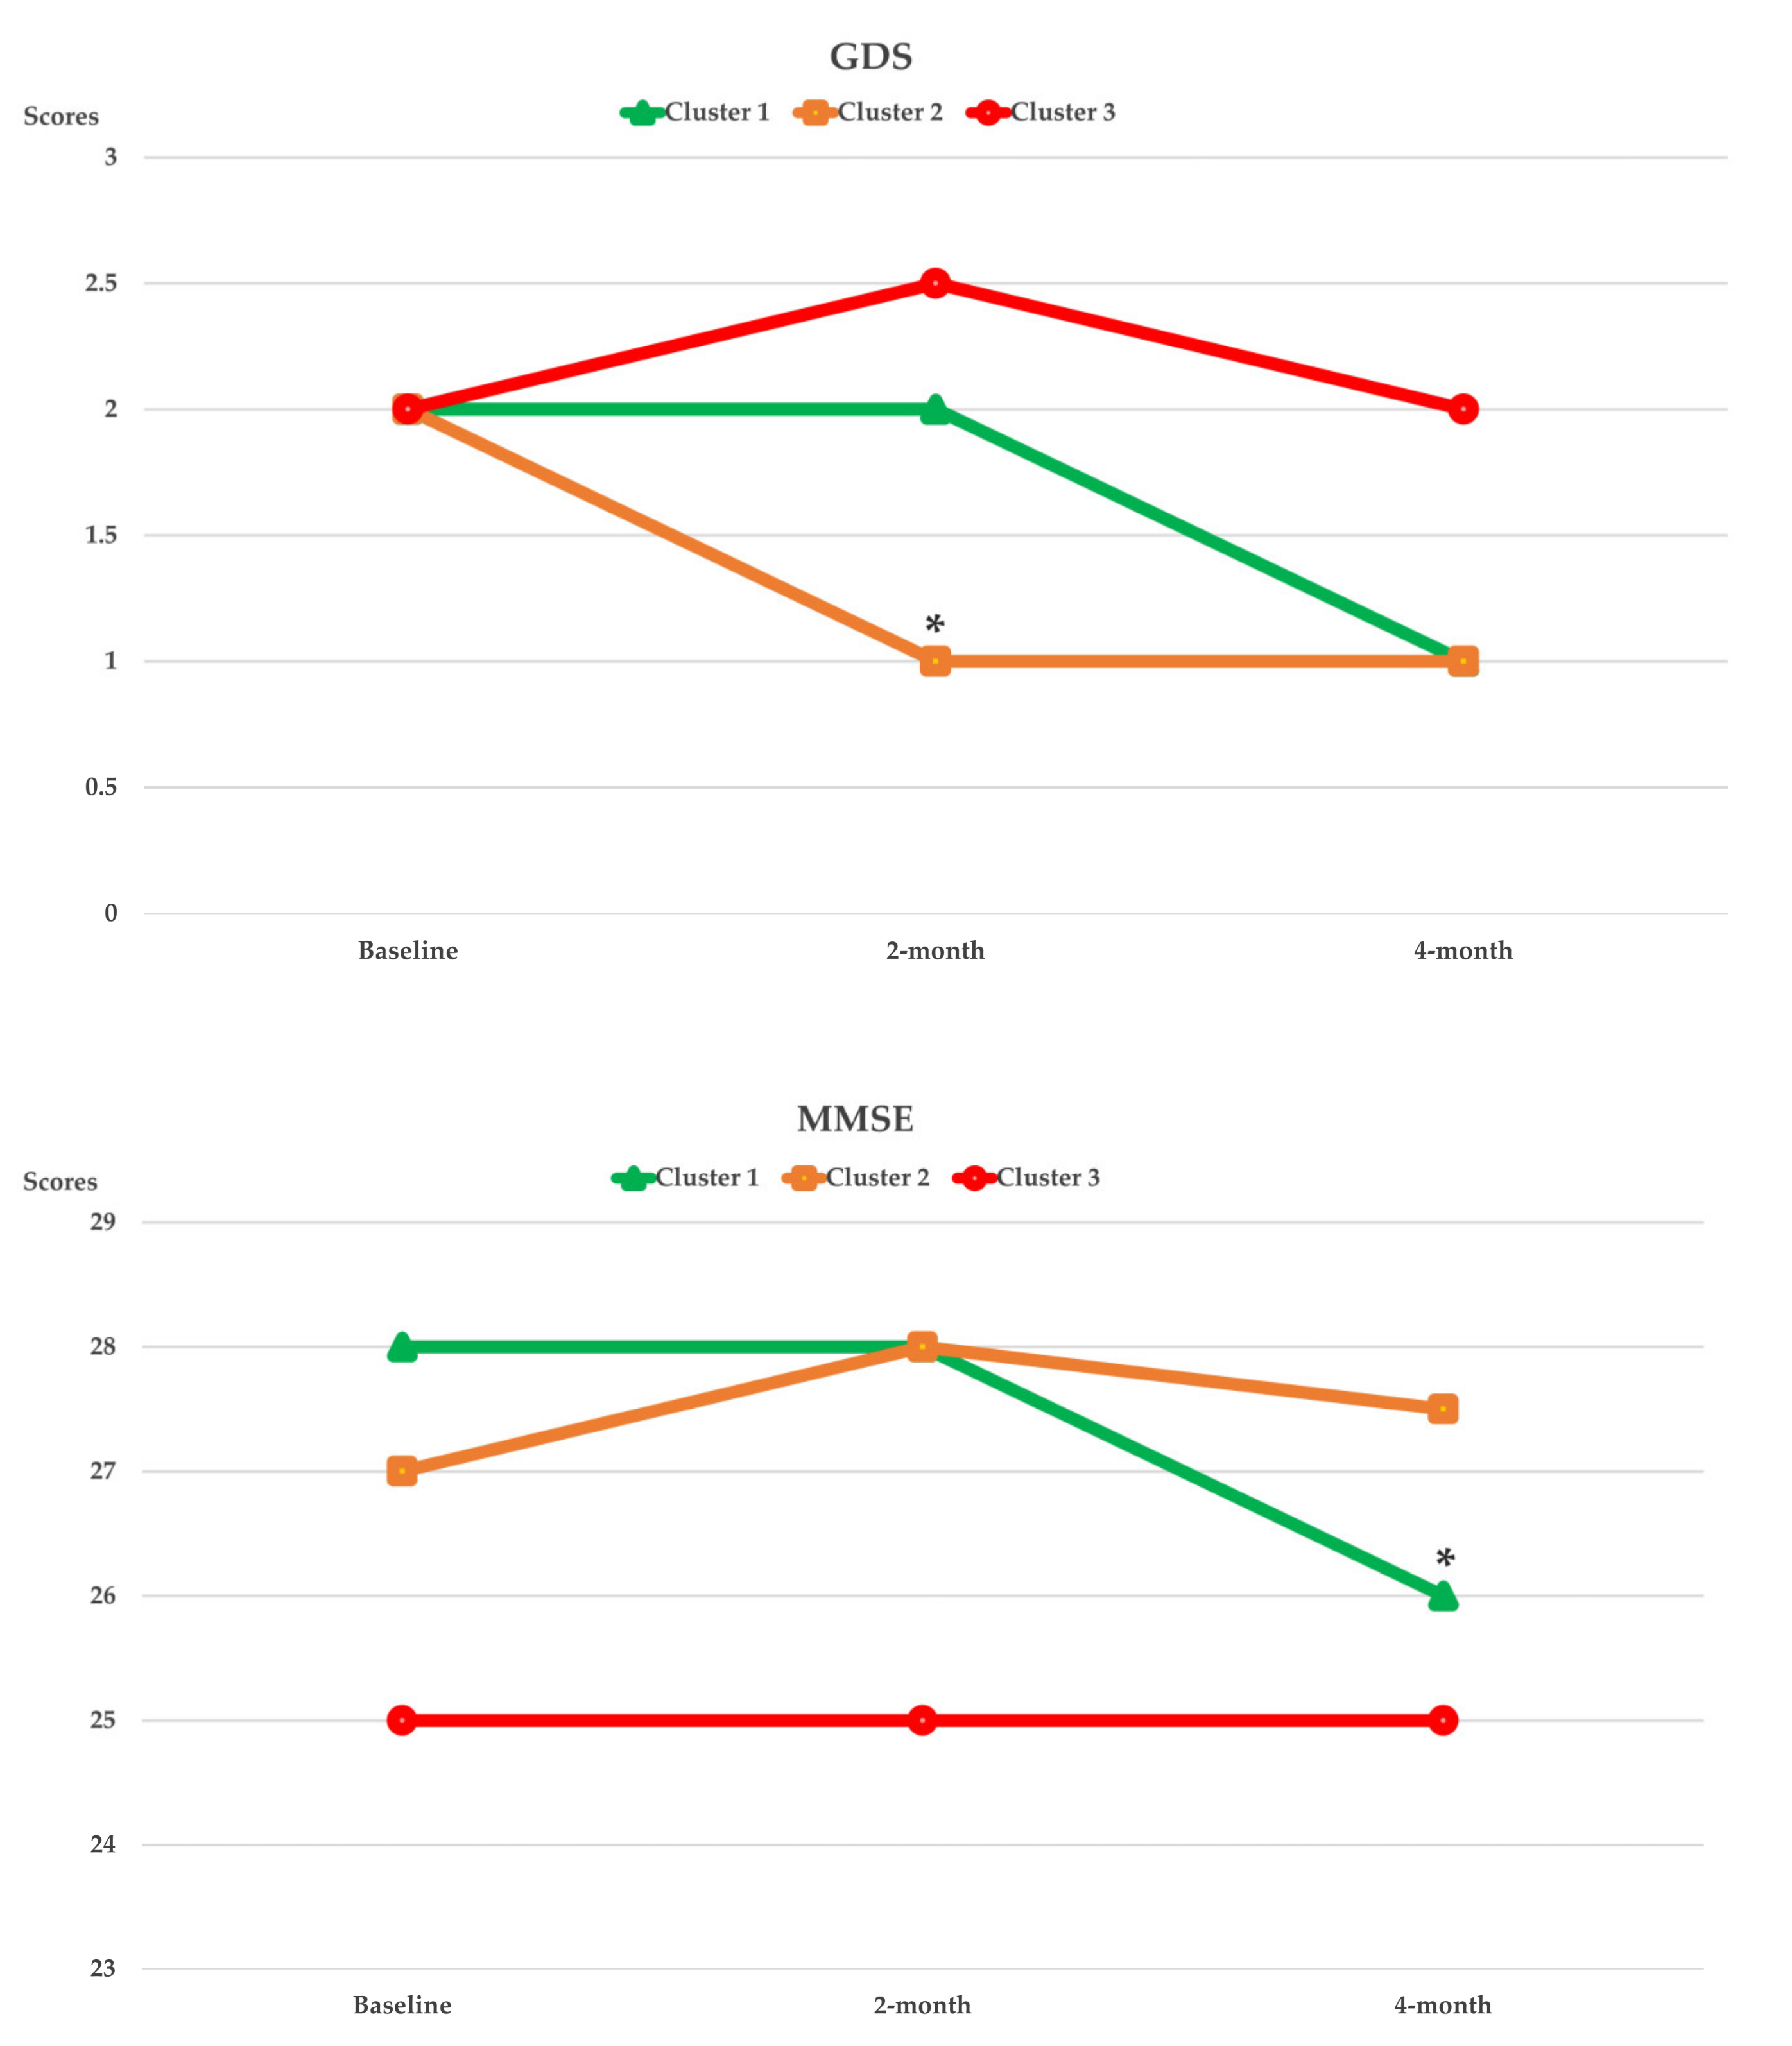
| Psychology | GDS (0–15) | 2.6 ± 0.3 | 2.7 ± 0.6 | 2.3 ± 0.4 | 3.0 ± 0.7 | 0.702 |
| Cognition | MMSE (0–30) | 25.7 ± 0.6 | 27.5 ± 0.7 | 25.6 ± 1.0 | 24.4 ± 1.0 | 0.074 |
| Cluster 1 (n = 13) | Cluster 2 (n = 30) | Cluster 3 (n = 16) | Pclusters | Ptime | Pinteraction3 | |||
|---|---|---|---|---|---|---|---|---|
| Vitality | MNA | Baseline | 25.5 ± 0.6 | 26.9 ± 0.4 | 26.4 ± 0.5 | 0.180 | 0.764 | 0.407 |
| 2-month | 25.9 ± 0.7 | 27 ± 0.4 | 26.5 ± 0.4 | |||||
| 4-month | 26.7 ± 0.6 | 26.6 ± 0.4 | 26.4 ± 0.5 | |||||
| HGS | Baseline | 20.8 ± 1.6 | 22.7 ± 1.2 | 17.7 ± 1.8 | 0.704 | 0.284 | 0.126 | |
| 2-month | 20.2 ± 1.5 | 22.1 ± 1.0 | 18.0 ± 1.7 | |||||
| 4-month | 18.9 ± 1.7 | 22.3 ± 1.1 | 18.2 ± 2.0 | |||||
| TMS | Baseline | 75.5 ± 11.9 | 76.3 ± 5.0 | 66.8 ± 5.8 | 0.010 | 0.031 | 0.009 | |
| 2-month | 75.0 ± 11.4 | 83.2 ± 4.4 | 66.4 ± 6.4 | |||||
| 4-month | 87.7 ± 9.1 | 88.8 ± 3.6 | 64.7 ± 6.2 | |||||
| Locomotion | BST | Baseline | −4.2 ± 3.2 | −12.6 ± 3.2 | −8.4 ± 3.4 | 0.310 | 0.595 | 0.295 |
| 2-month | −6.1 ± 4.2 | −13.0 ± 2.9 | −10.4 ± 4.2 | |||||
| 4-month | −6.7 ± 4.2 | −11.6 ± 2.9 | −10.3 ± 4.1 | |||||
| CSR | Baseline | −1.6 ± 3.3 | −3.1 ± 2.2 | −8.2 ± 2.9 | 0.090 | 0.093 | 0.989 | |
| 2-month | 14.1 ± 2.2 | 9.7 ± 1.8 | −0.6 ± 3.9 | |||||
| 4-month | 12.4 ± 3.2 | 7.8 ± 2.0 | −2.2 ± 3.7 | |||||
| CST | Baseline | 14.3 ± 1.7 | 14.2 ± 1.2 | 10.6 ± 0.9 | 0.878 | <0.001 | 0.079 | |
| 2-month | 17.3 ± 2.1 | 15.3 ± 0.8 | 12.0 ± 1.2 | |||||
| 4-month | 14.8 ± 2.0 | 13.9 ± 1.0 | 11.4 ± 1.1 | |||||
| GS | Baseline | 0.7 ± 0.1 | 0.6 ± 0 | 0.5 ± 0.1 | 0.034 | 0.110 | 0.105 | |
| 2-month | 0.6 ± 0.1 | 0.6 ± 0 | 0.5 ± 0 | |||||
| 4-month | 0.6 ± 0.1 | 0.6 ± 0 | 0.4 ± 0 | |||||
| OFS | Baseline | 12.7 ± 3.9 | 9.1 ± 1.7 | 5.4 ± 1.9 | 0.139 | 0.162 | 0.602 | |
| 2-month | 10.9 ± 3.5 | 10.9 ± 1.9 | 4.9 ± 2.0 | |||||
| 4-month | 13.6 ± 3.6 | 11.5 ± 1.9 | 5.3 ± 1.9 | |||||
| Psychology | GDS | Baseline | 2.7 ± 0.6 | 2.3 ± 0.4 | 3.0 ± 0.7 | 0.268 | 0.545 | 0.779 |
| 2-month | 2.0 ± 0.4 | 1.6 ± 0.3 | 2.6 ± 0.4 | |||||
| 4-month | 1.9 ± 0.5 | 1.8 ± 0.3 | 2.9 ± 0.6 | |||||
| Cognition | MMSE | Baseline | 27.5 ± 0.7 | 25.6 ± 1.0 | 24.4 ± 1.0 | 0.078 | 0.028 | 0.022 |
| 2-month | 26.7 ± 0.9 | 25.4 ± 1.0 | 24.1 ± 1.0 | |||||
| 4-month | 25.7 ± 1.1 | 25.5 ± 1.0 | 23.9 ± 0.9 |
| Cluster 1 (n = 13) | Cluster 2 (n = 30) | Cluster 3 (n = 16) | Pclusters | Ptime | Pinteraction3 | ||
|---|---|---|---|---|---|---|---|
| ADL | Baseline | 91.5 ± 3.9 | 97.2 ± 1.1 | 94.4 ± 1.8 | 0.471 | 0.498 | 0.034 |
| 2-month | 90.4 ± 4.2 | 97.5 ± 1.1 | 94.4 ± 1.8 | ||||
| 4-month | 96.2 ± 1.7 | 95.2 ± 1.6 | 93.1 ± 2 | ||||
| IADL | Baseline | 19.5 ± 1.4 | 18.9 ± 1 | 15.9 ± 1.5 | 0.792 | 0.177 | 0.139 |
| 2-month | 17.8 ± 1.8 | 18.7 ± 1.1 | 15.9 ± 1.5 | ||||
| 4-month | 18.8 ± 1.5 | 18.9 ± 1.1 | 15.8 ± 1.5 |
Publisher’s Note: MDPI stays neutral with regard to jurisdictional claims in published maps and institutional affiliations. |
© 2022 by the authors. Licensee MDPI, Basel, Switzerland. This article is an open access article distributed under the terms and conditions of the Creative Commons Attribution (CC BY) license (https://creativecommons.org/licenses/by/4.0/).
Share and Cite
Lim, K.-Y.; Lo, H.-C.; Cheong, I.-F.; Wang, Y.-Y.; Jian, Z.-R.; Chen, I.-C.; Chan, Y.-C.; Lee, S.-D.; Chou, C.-C.; Yang, F.L. Healthy Eating Enhances Intrinsic Capacity, Thus Promoting Functional Ability of Retirement Home Residents in Northern Taiwan. Nutrients 2022, 14, 2225. https://0-doi-org.brum.beds.ac.uk/10.3390/nu14112225
Lim K-Y, Lo H-C, Cheong I-F, Wang Y-Y, Jian Z-R, Chen I-C, Chan Y-C, Lee S-D, Chou C-C, Yang FL. Healthy Eating Enhances Intrinsic Capacity, Thus Promoting Functional Ability of Retirement Home Residents in Northern Taiwan. Nutrients. 2022; 14(11):2225. https://0-doi-org.brum.beds.ac.uk/10.3390/nu14112225
Chicago/Turabian StyleLim, Kian-Yuan, Hui-Chen Lo, In-Fai Cheong, Yi-Yen Wang, Zi-Rong Jian, I-Chen Chen, Yun-Chun Chan, Shyh-Dye Lee, Chi-Chun Chou, and Feili Lo Yang. 2022. "Healthy Eating Enhances Intrinsic Capacity, Thus Promoting Functional Ability of Retirement Home Residents in Northern Taiwan" Nutrients 14, no. 11: 2225. https://0-doi-org.brum.beds.ac.uk/10.3390/nu14112225