
Sex-Specific Effects of Nutritional Supplements for Infants Born Early or Small: An Individual Participant Data Meta-Analysis (ESSENCE IPD-MA) II: Growth

 , , , , , , , , and add
Show full author list
, , , , , , , , and add
Show full author list
Abstract
:1. Introduction
2. Methods
2.1. Search Strategies
2.2. Criteria for Inclusion and Exclusion
2.3. Quality Assessment
2.4. Data Synthesis and Statistical Analysis
2.5. Planned Subgroup and Sensitivity Analyses
3. Results
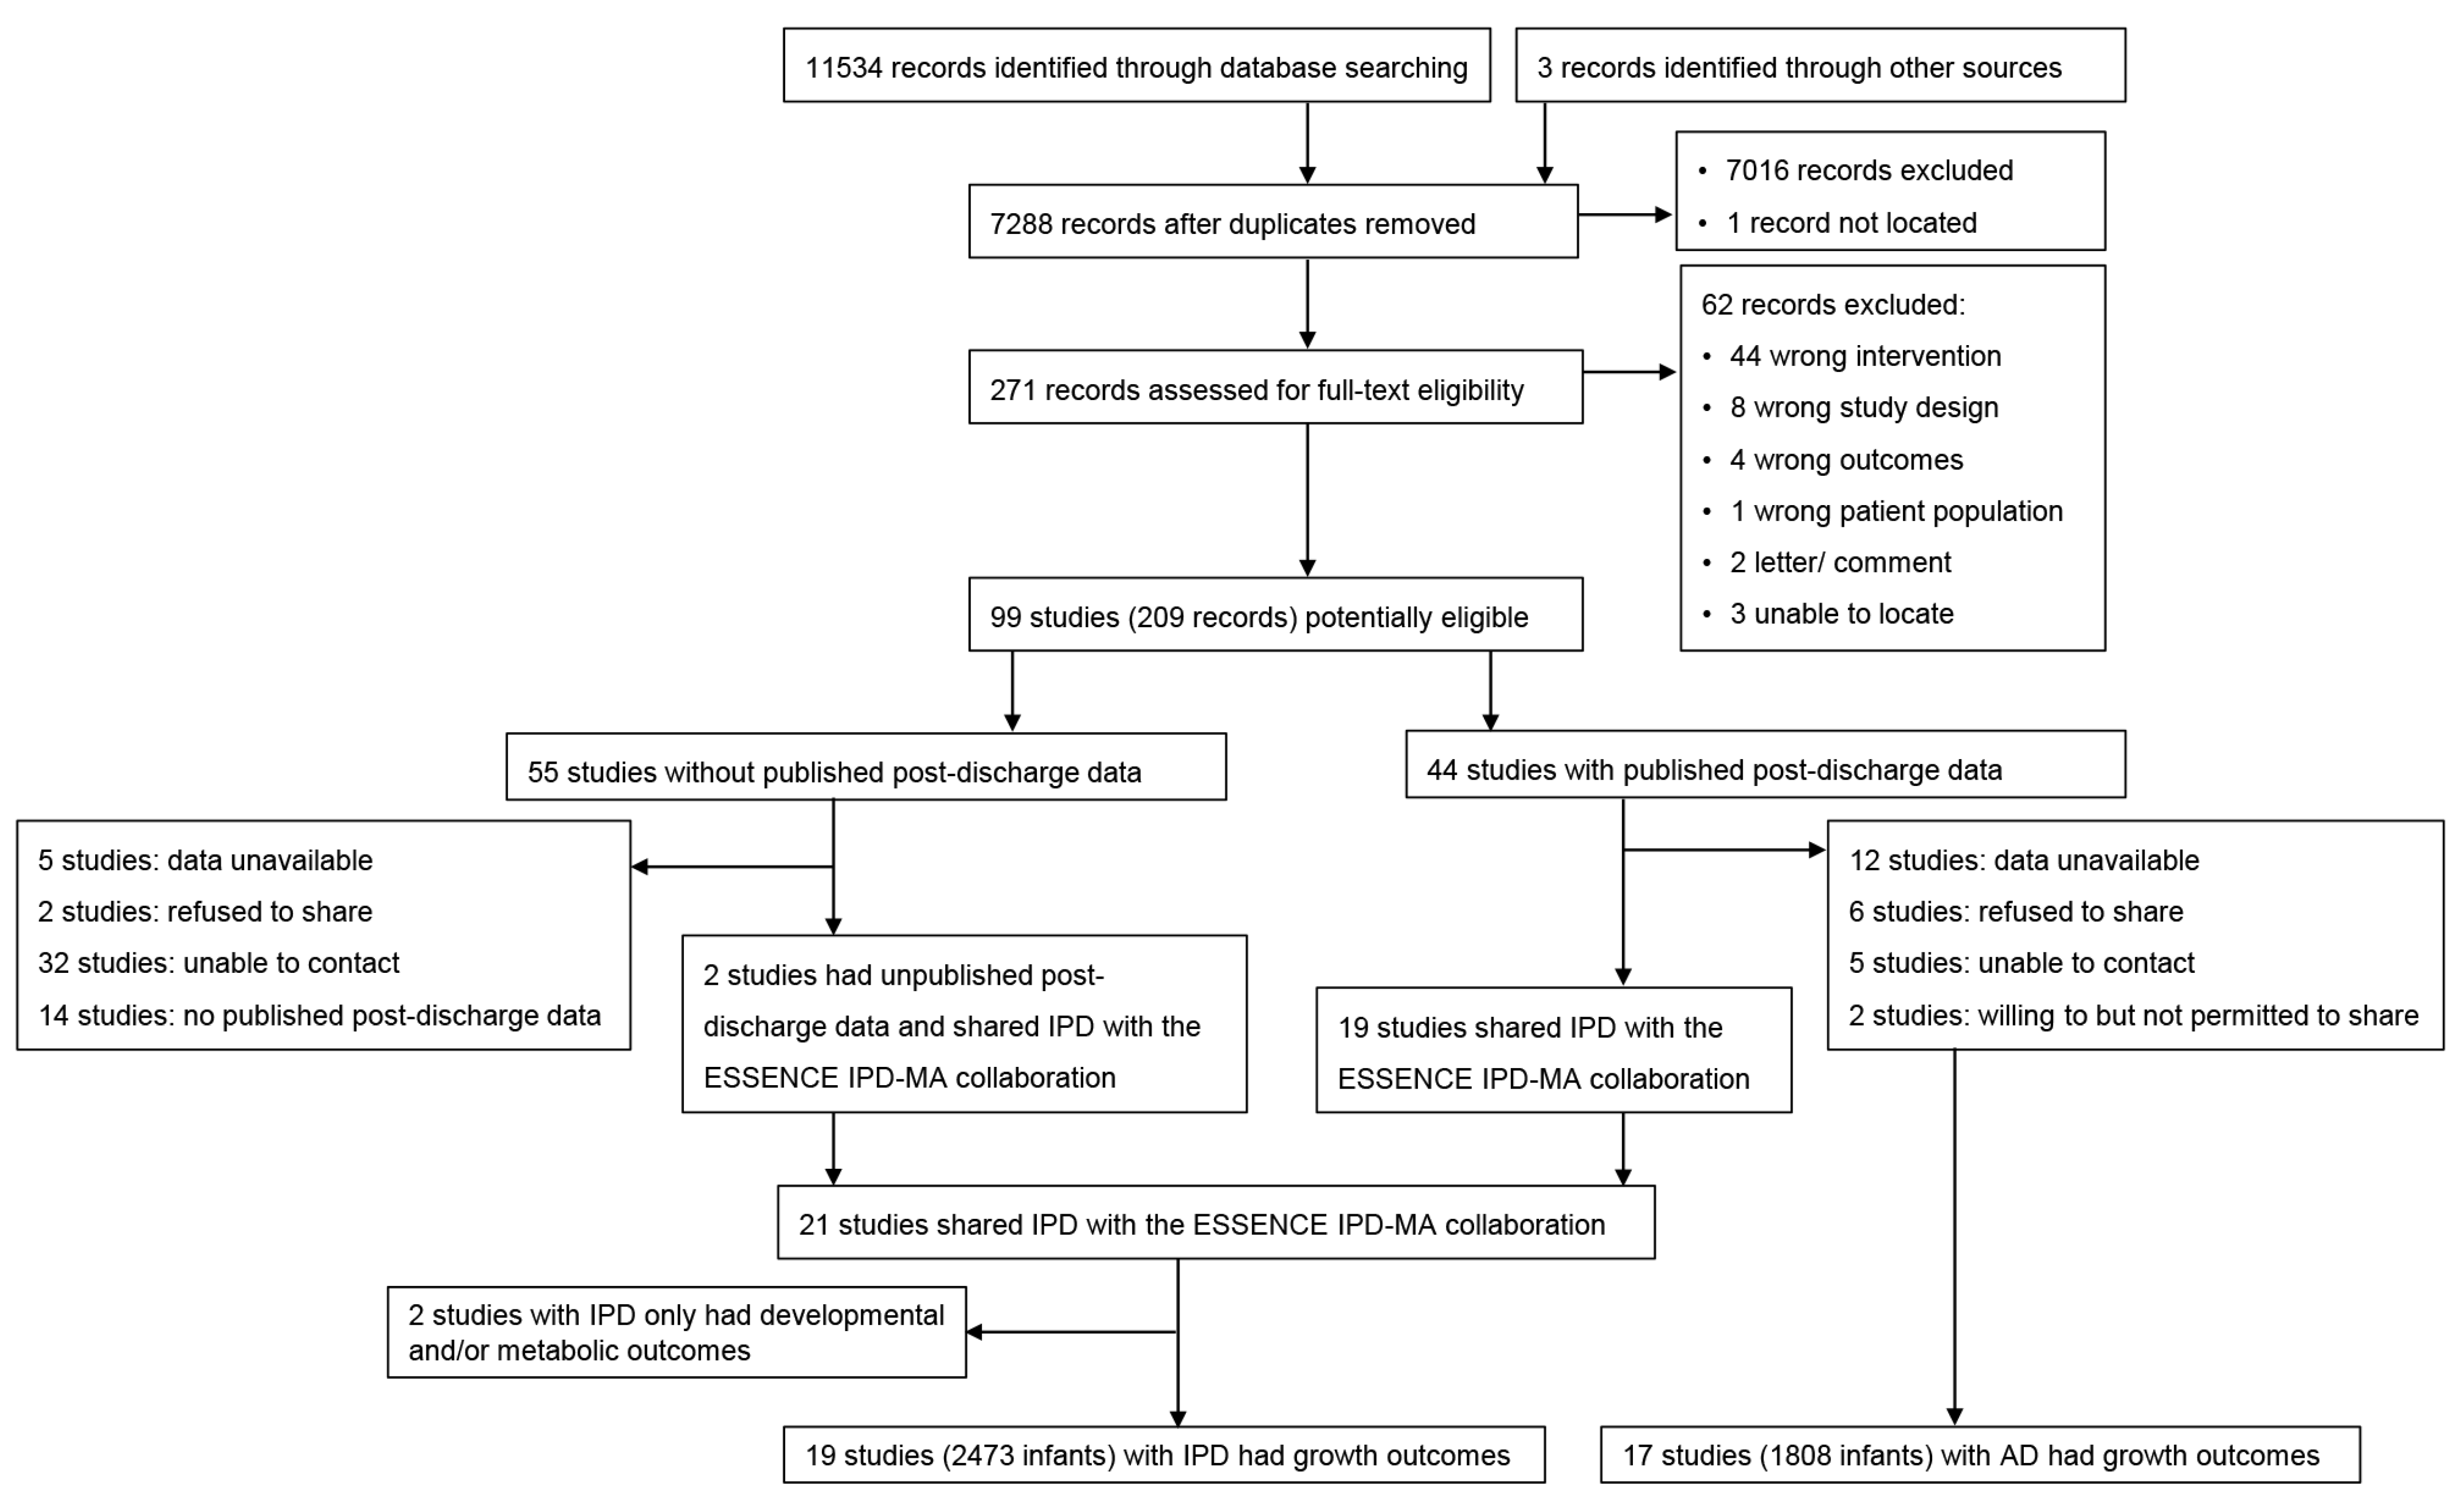
3.1. Search Results
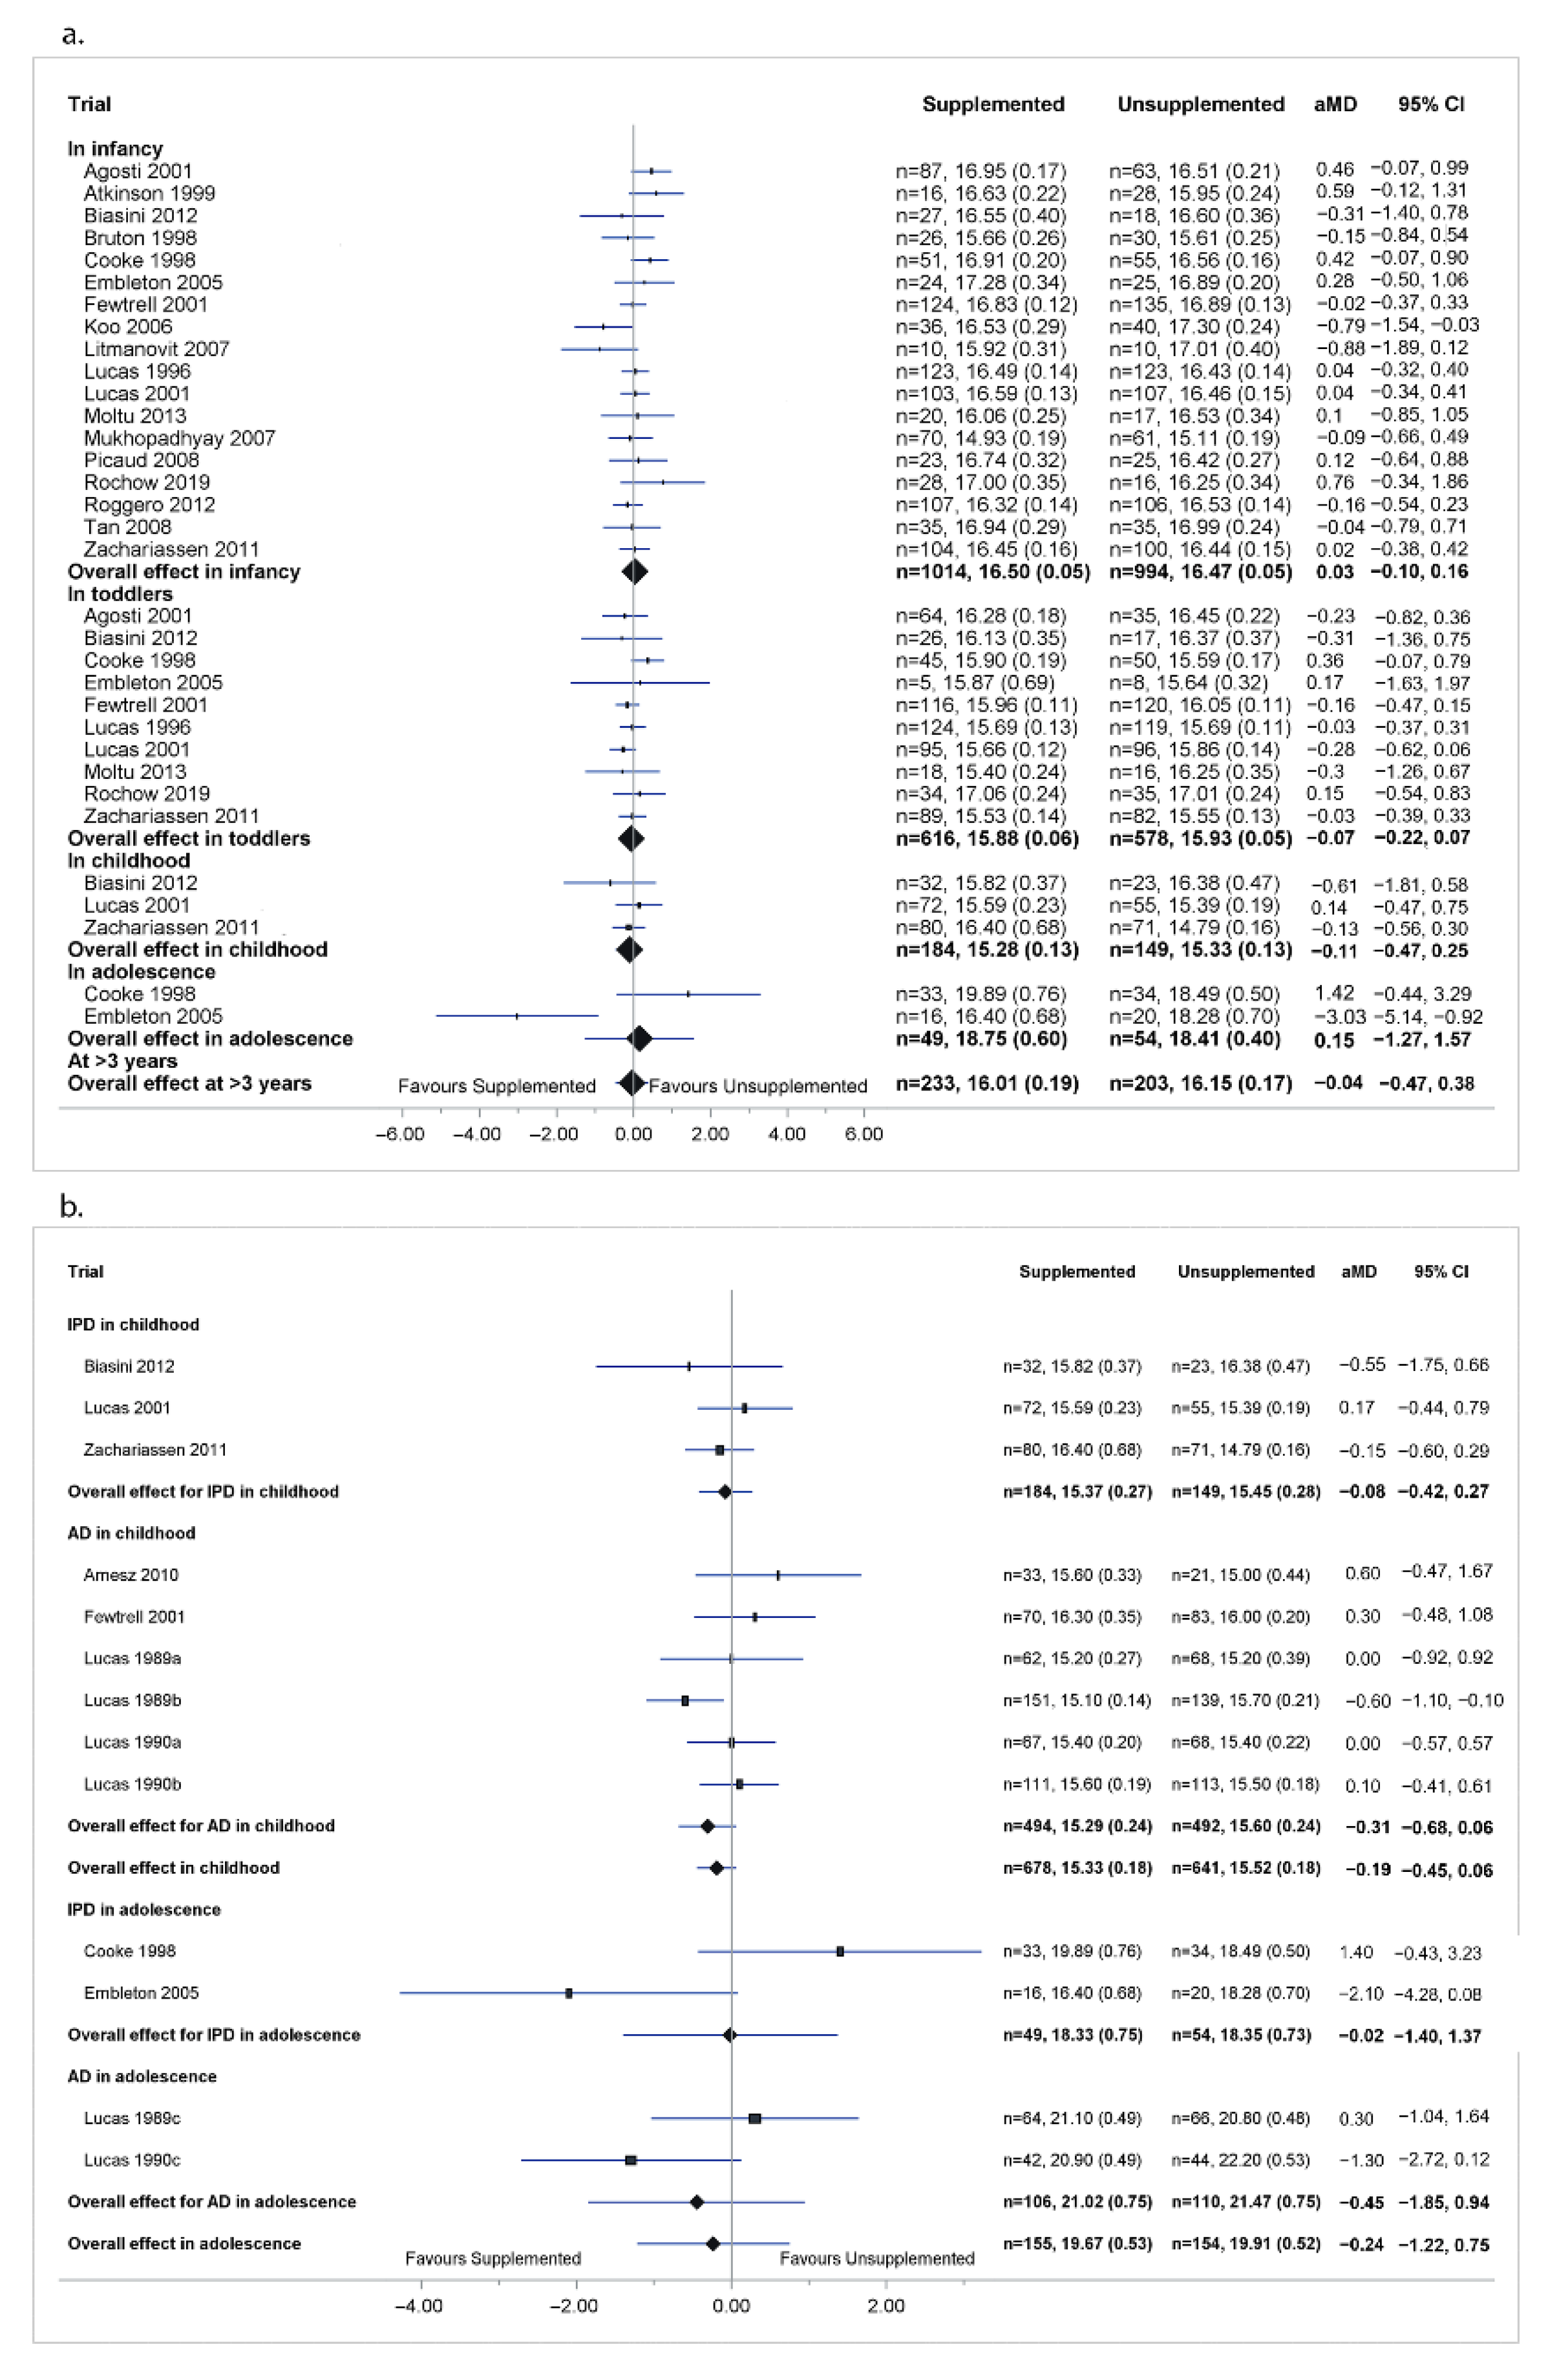
3.2. Primary Outcome-BMI in Childhood
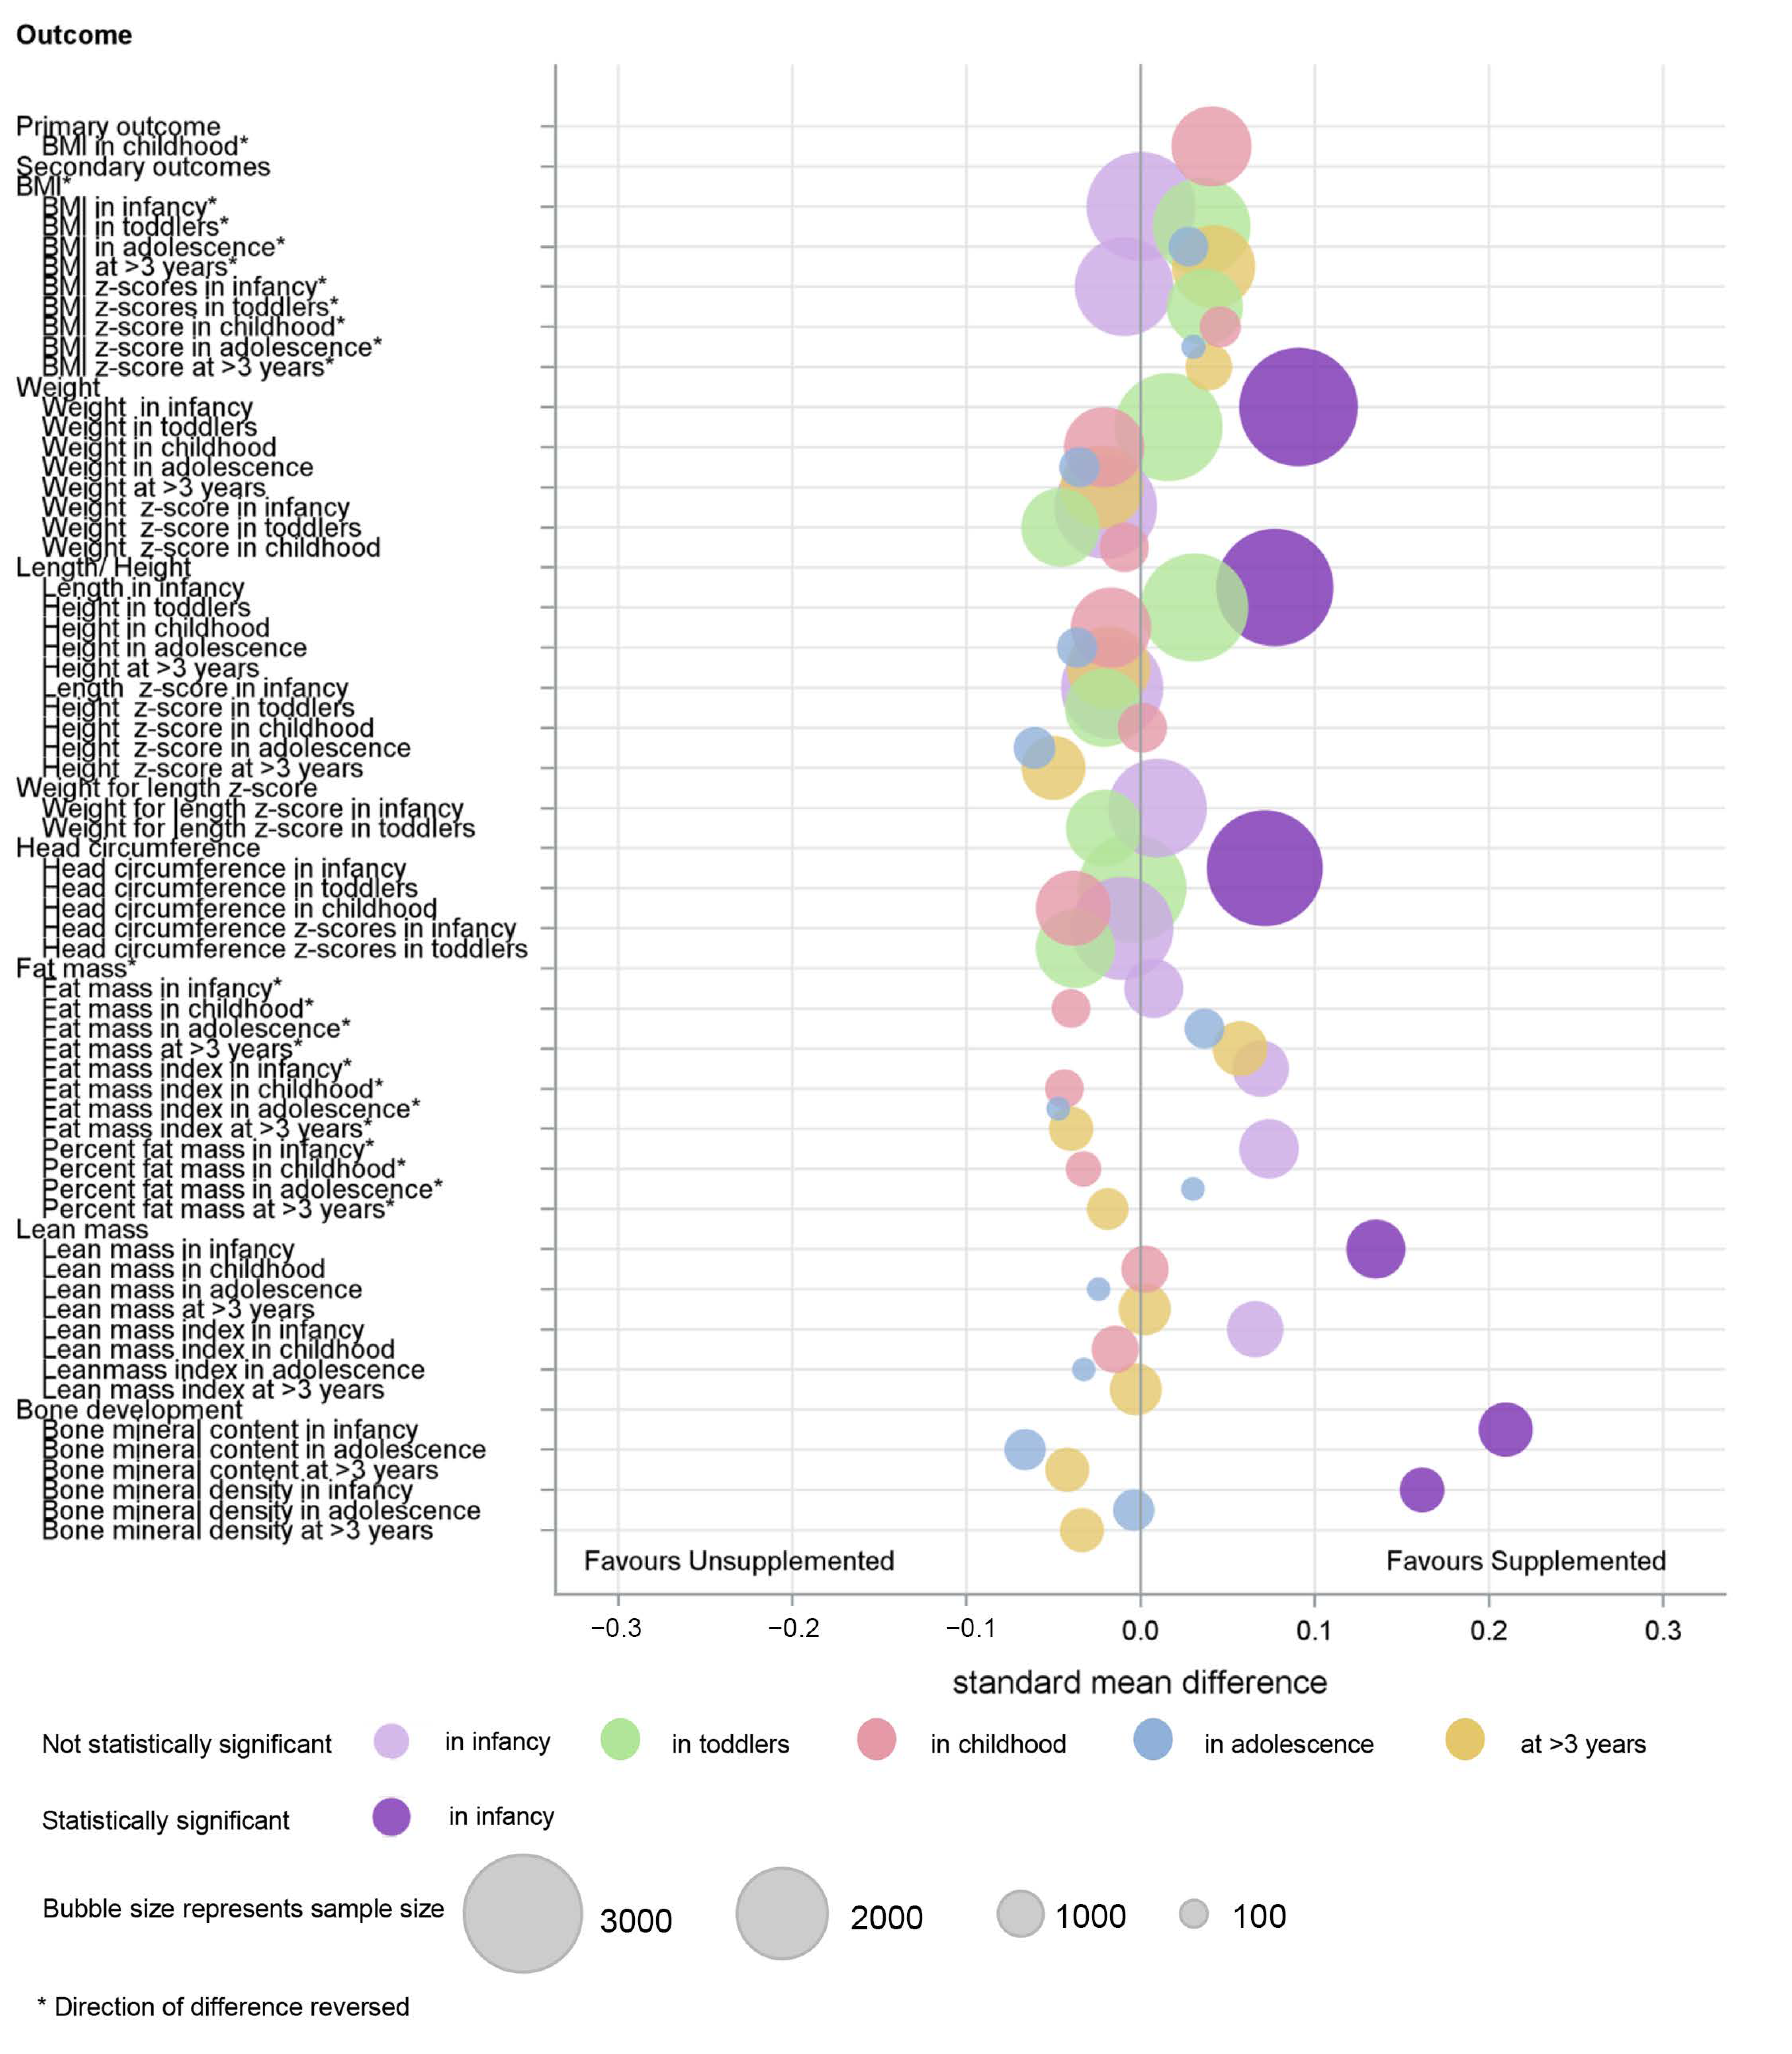
3.3. Secondary Outcomes

3.4. Subgroup Analysis
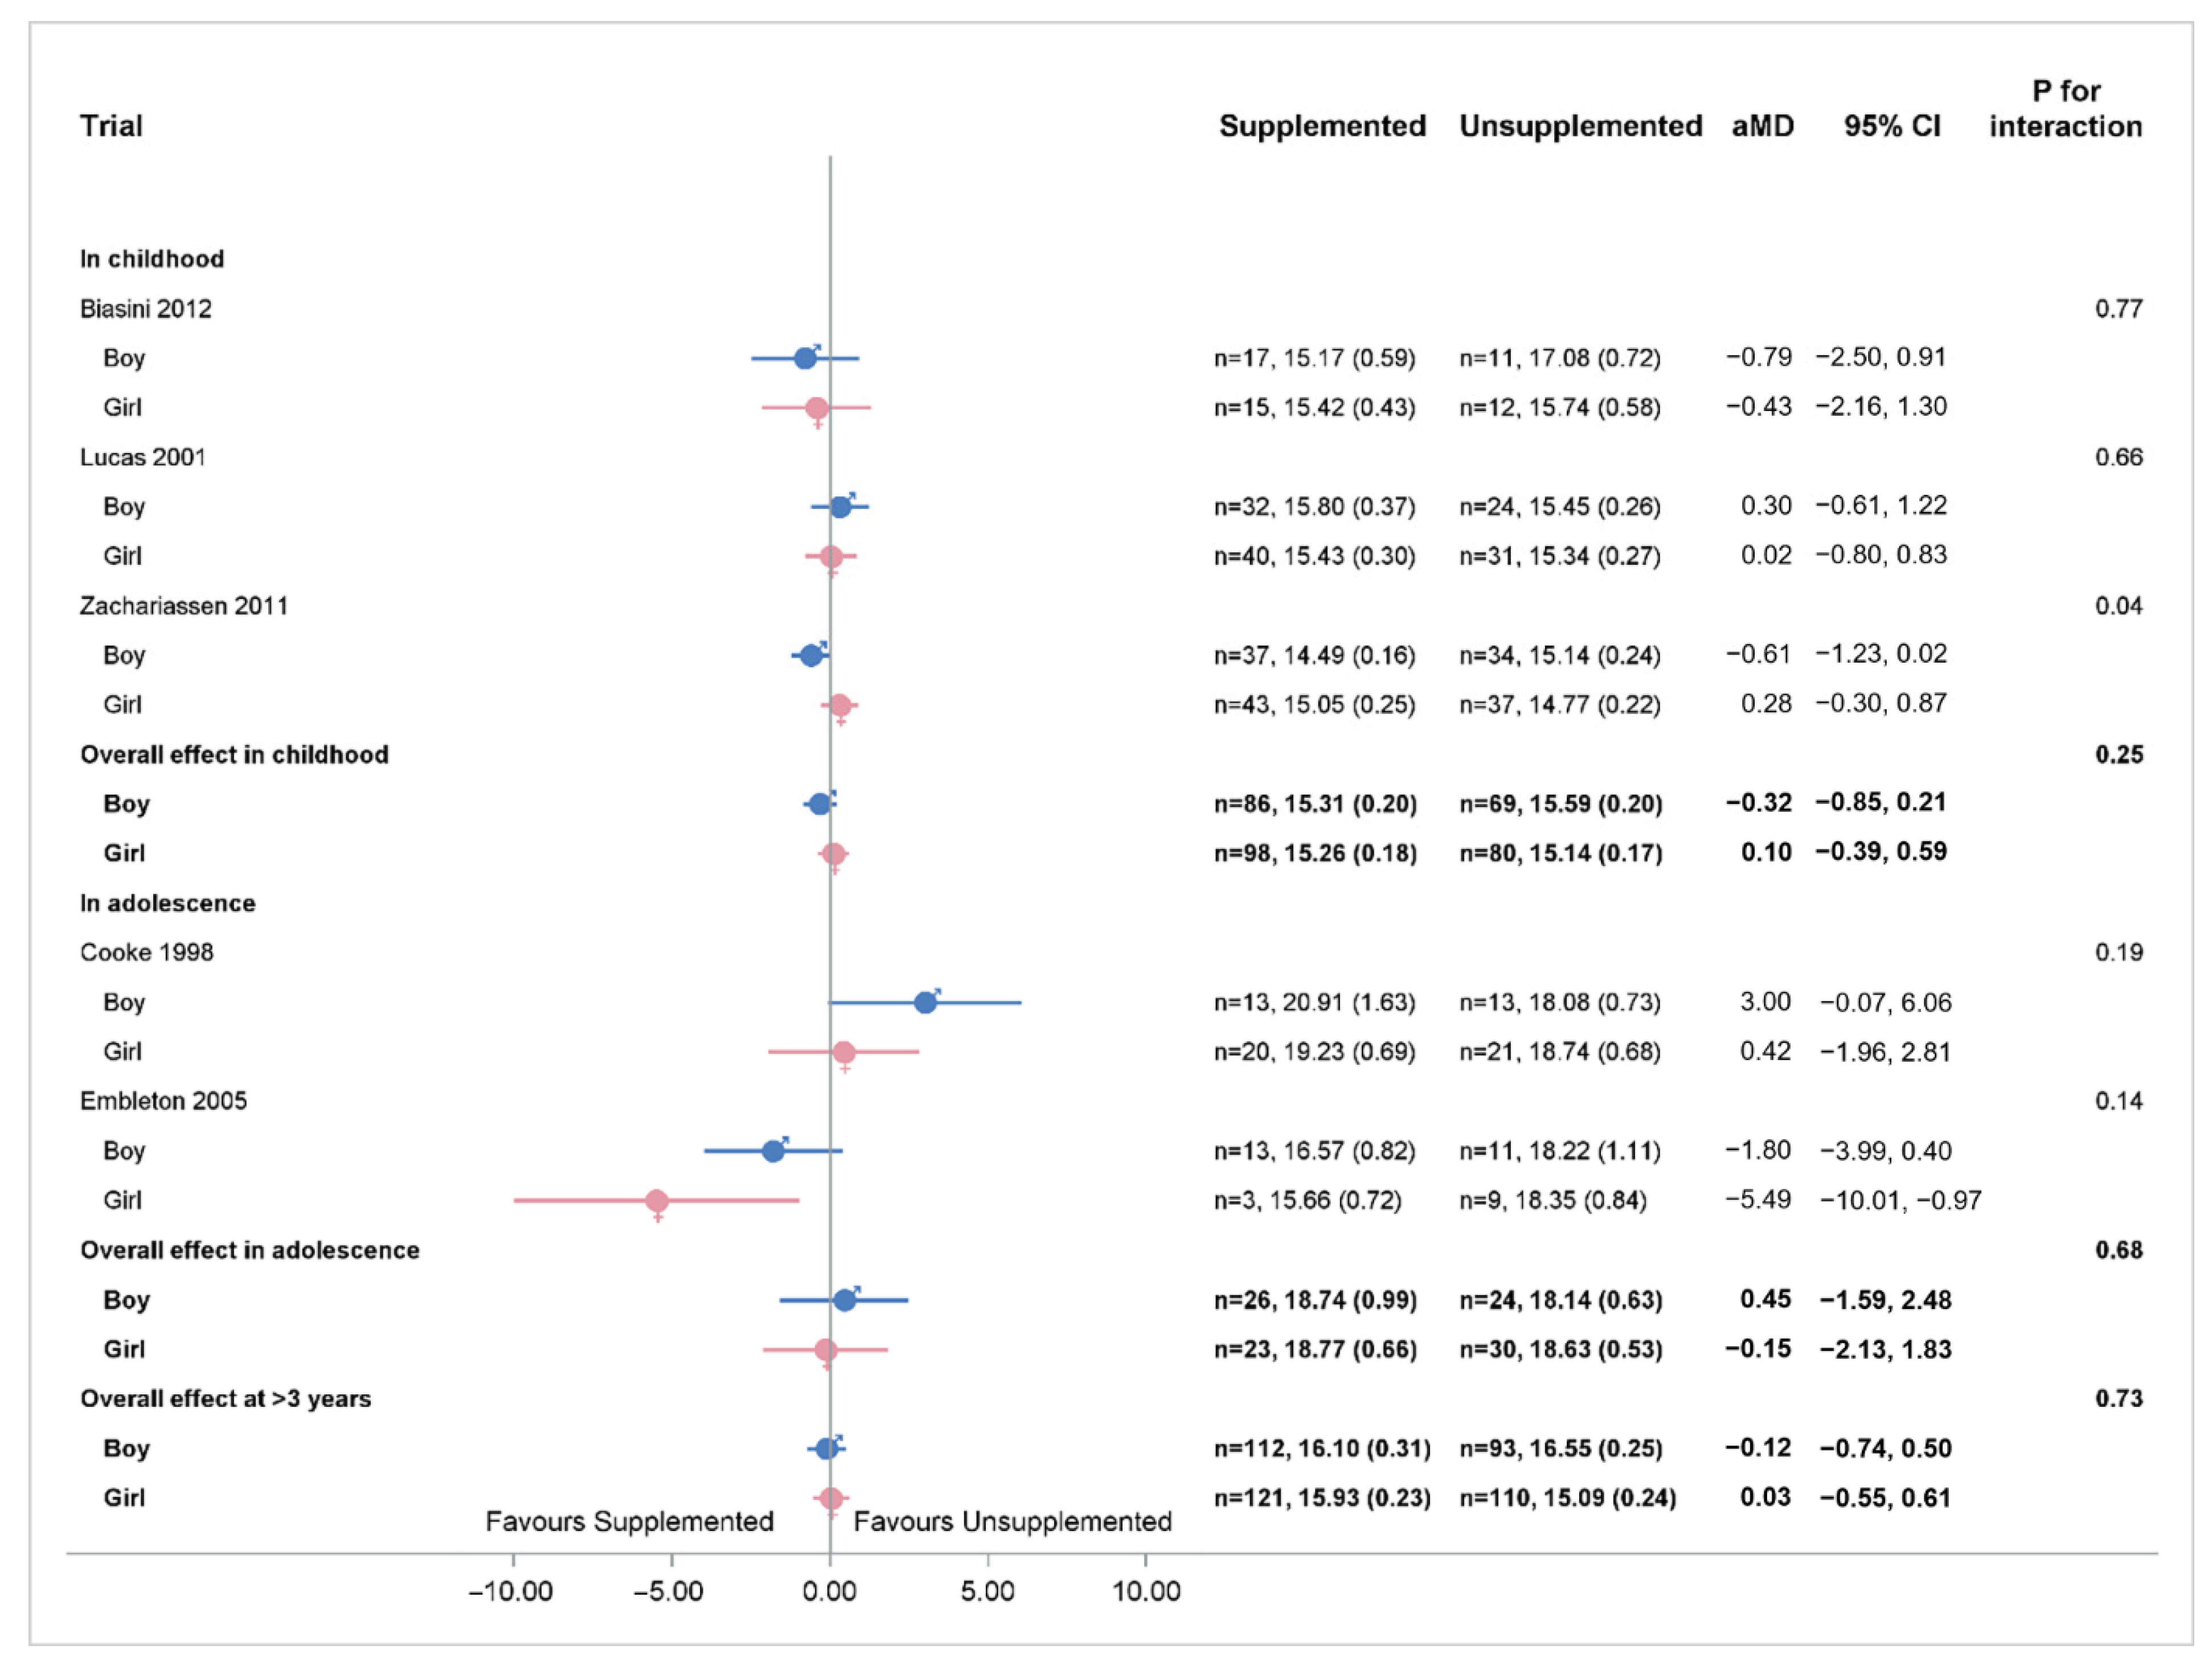
3.4.1. Sex of Infant
3.4.2. Size for Gestation of the Infant
3.4.3. Size of Infant at Birth
3.4.4. Gestational Age of Infant at Birth
3.4.5. Timing of Supplement
3.4.6. Type of Supplement
3.4.7. Primary Feed
3.4.8. Different Trial Timing
4. Discussion
Supplementary Materials
Author Contributions
Funding
Institutional Review Board Statement
Informed Consent Statement
Data Availability Statement
Acknowledgments
Conflicts of Interest
References
- Blencowe, H.; Cousens, S.; Chou, D.; Oestergaard, M.; Say, L.; Moller, A.-B.; Kinney, M.; Lawn, J.; The Born Too Soon Preterm Birth Action Group. Born Too Soon: The global epidemiology of 15 million preterm births. Reprod. Health 2013, 10 (Suppl. 1), S2. [Google Scholar] [CrossRef] [Green Version]
- Scharf, R.; Stroustrup, A.; Conaway, M.R.; DeBoer, M. Growth and development in children born very low birthweight. Arch. Dis. Child. Fetal Neonatal Ed. 2016, 101, F433–F438. [Google Scholar] [CrossRef] [PubMed] [Green Version]
- Katz, J.; Lee, A.C.; Kozuki, N.; Lawn, J.E.; Cousens, S.; Blencowe, H.; Ezzati, M.; Bhutta, Z.A.; Marchant, T.; Willey, B.A.; et al. Mortality risk in preterm and small-for-gestational-age infants in low-income and middle-income countries: A pooled country analysis. Lancet 2013, 382, 417–425. [Google Scholar] [CrossRef] [Green Version]
- Christian, P.; Lee, S.E.; Angel, M.D.; Adair, L.S.; Arifeen, S.; Ashorn, P.; Barros, F.C.; Fall, C.; Fawzi, W.W.; Hao, W.; et al. Risk of childhood undernutrition related to small-for-gestational age and preterm birth in low- and middle-income countries. Int. J. Epidemiol. 2013, 42, 1340–1355. [Google Scholar] [CrossRef]
- Lucas, A.; Fewtrell, M.S.; Morley, R.; Lucas, P.J.; Baker, B.A.; Lister, G.; Bishop, N.J. Randomized outcome trial of human milk fortification and developmental outcome in preterm infants. Am. J. Clin. Nutr. 1996, 64, 142–151. [Google Scholar] [CrossRef] [Green Version]
- Lucas, A.; Morley, R.; Cole, T.J. Randomised trial of early diet in preterm babies and later intelligence quotient. BMJ 1998, 317, 1481–1487. [Google Scholar] [CrossRef] [Green Version]
- Lucas, A.; Morley, R.; Cole, T.J.; Gore, S.M. A randomised multicentre study of human milk versus formula and later development in preterm infants. Arch. Dis. Child. Fetal Neonatal Ed. 1994, 70, F141–F146. [Google Scholar] [CrossRef] [Green Version]
- Kumar, R.K.; Singhal, A.; Vaidya, U.; Banerjee, S.; Anwar, F.; Rao, S. Optimizing Nutrition in Preterm Low Birth Weight Infants—Consensus Summary. Front. Nutr. 2017, 4, 20. [Google Scholar] [CrossRef] [Green Version]
- Belfort, M.B.; Rifas-Shiman, S.L.; Sullivan, T.; Collins, C.T.; McPhee, A.J.; Ryan, P.; Kleinman, K.P.; Gillman, M.W.; Gibson, R.A.; Makrides, M. Infant Growth Before and After Term: Effects on Neurodevelopment in Preterm Infants. Pediatrics 2011, 128, e899–e906. [Google Scholar] [CrossRef] [PubMed]
- Brown, J.V.E.; Embleton, N.; Harding, J.E.; McGuire, W. Multi-nutrient fortification of human milk for preterm infants. Cochrane Database Syst. Rev. 2016, 2016, CD000343. [Google Scholar] [CrossRef] [Green Version]
- Peacock, J.L.; Marston, L.; Marlow, N.; Calvert, S.A.; Greenough, A. Neonatal and infant outcome in boys and girls born very prematurely. Pediatr. Res. 2012, 71, 305–310. [Google Scholar] [CrossRef] [PubMed] [Green Version]
- Rustico, S.E.; Calabria, A.C.; Garber, S.J. Metabolic bone disease of prematurity. J. Clin. Transl. Endocrinol. 2014, 1, 85–91. [Google Scholar] [CrossRef] [Green Version]
- Embleton, N.; Wood, C.L. Growth, bone health, and later outcomes in infants born preterm. J. Pediatr. 2014, 90, 529–532. [Google Scholar] [CrossRef]
- Rehman, M.U.; Narchi, H. Metabolic bone disease in the preterm infant: Current state and future directions. World J. Methodol. 2015, 5, 115–121. [Google Scholar] [CrossRef] [PubMed]
- Aiken, C.E.; Ozanne, S.E. Sex differences in developmental programming models. Reproduction 2013, 145, R1–R13. [Google Scholar] [CrossRef] [PubMed] [Green Version]
- Cooke, R.J.; Embleton, N.D.; Griffin, I.J.; Wells, J.C.; McCormick, K.P. Feeding Preterm Infants after Hospital Discharge: Growth and Development at 18 Months of Age. Pediatr. Res. 2001, 49, 719–722. [Google Scholar] [CrossRef] [PubMed] [Green Version]
- Lin, L.; Amissah, E.; Gamble, G.D.; Crowther, C.A.; Harding, J.E. Impact of macronutrient supplements on later growth of children born preterm or small for gestational age: A systematic review and meta-analysis of randomised and quasirandomised controlled trials. PLoS Med. 2020, 17, e1003122. [Google Scholar] [CrossRef] [PubMed]
- Lin, L.; Crowther, C.; Gamble, G.; Bloomfield, F.; Harding, J.E. Sex-specific effects of nutritional supplements in infants born early or small: Protocol for an individual participant data meta-analysis (ESSENCE IPD-MA). BMJ Open 2020, 10, e033438. [Google Scholar] [CrossRef] [PubMed] [Green Version]
- Tierney, J.F.; Vale, C.; Riley, R.; Smith, C.T.; Stewart, L.; Clarke, M.; Rovers, M. Individual Participant Data (IPD) Meta-analyses of Randomised Controlled Trials: Guidance on Their Use. PLoS Med. 2015, 12, e1001855. [Google Scholar] [CrossRef] [Green Version]
- Higgins, J.P.T.; Green, S.; The Cochrane Collaboration. Cochrane Handbook for Systematic Reviews of Interventions Version 5.1.0 [Updated March 2011]. 2011. Available online: www.cochrane-handbook.org (accessed on 15 June 2020).
- Review Manager (RevMan). Computer Program; Version 5.3; The Nordic Cochrane Centre, The Cochrane Collaboration: Copenhagen, Denmark, 2014. [Google Scholar]
- Biasini, A.; Marvulli, L.; Neri, E.; China, M.; Stella, M.; Monti, F. Growth and neurological outcome in ELBW preterms fed with human milk and extra-protein supplementation as routine practice: Do we need further evidence? J. Matern. Neonatal Med. 2012, 25, 64–66. [Google Scholar] [CrossRef]
- Litmanovitz, I.; Eliakim, A.; Arnon, S.; Regev, R.; Bauer, S.; Shainkin-Kestenbaum, R.; Dolfin, T. Enriched post-discharge formula versus term formula for bone strength in very low birth weight infants: A longitudinal pilot study. J. Périnat. Med. 2007, 35, 431–435. [Google Scholar] [CrossRef] [PubMed]
- Embleton, N.D.; Cooke, R.J. Protein Requirements in Preterm Infants: Effect of Different Levels of Protein Intake on Growth and Body Composition. Pediatr. Res. 2005, 58, 855–860. [Google Scholar] [CrossRef] [PubMed] [Green Version]
- Kerkhof, G.F.; Willemsen, R.H.; Leunissen, R.W.; Breukhoven, P.E.; Hokken-Koelega, A.C. Health Profile of Young Adults Born Preterm: Negative Effects of Rapid Weight Gain in Early Life. J. Clin. Endocrinol. Metab. 2012, 97, 4498–4506. [Google Scholar] [CrossRef] [Green Version]
- Euser, A.M.; Finken, M.J.J.; Keijzer-Veen, M.G.; Hille, E.T.M.; Wit, J.M.; Dekker, F.; on behalf of the Dutch POPS-19 Collaborative Study Group. Associations between prenatal and infancy weight gain and BMI, fat mass, and fat distribution in young adulthood: A prospective cohort study in males and females born very preterm. Am. J. Clin. Nutr. 2005, 81, 480–487. [Google Scholar] [CrossRef] [PubMed] [Green Version]
- Belfort, M.B.; Gillman, M.W.; Buka, S.; Casey, P.H.; McCormick, M.C. Preterm Infant Linear Growth and Adiposity Gain: Trade-Offs for Later Weight Status and Intelligence Quotient. J. Pediatr. 2013, 163, 1564–1569.e2. [Google Scholar] [CrossRef] [Green Version]
- Kartiosuo, N.; Ramakrishnan, R.; Lemeshow, S.; Juonala, M.; Burns, T.L.; Woo, J.G.; Jacobs, D.R.; Daniels, S.R.; Venn, A.; Steinberger, J.; et al. Predicting overweight and obesity in young adulthood from childhood body-mass index: Comparison of cutoffs derived from longitudinal and cross-sectional data. Lancet Child Adolesc. Health 2019, 3, 795–802. [Google Scholar] [CrossRef]
- Woo, J.G.; Zhang, N.; Fenchel, M.; Jacobs, D.R., Jr.; Hu, T.; Urbina, E.M.; Burns, T.L.; Raitakari, O.; Steinberger, J.; Bazzano, L.; et al. Prediction of adult class II/III obesity from childhood BMI: The i3C consortium. Int. J. Obes. 2020, 44, 1164–1172. [Google Scholar] [CrossRef]
- Wood, C.L.; Wood, A.M.; Harker, C.; Embleton, N.D. Bone Mineral Density and Osteoporosis after Preterm Birth: The Role of Early Life Factors and Nutrition. Int. J. Endocrinol. 2013, 2013, 902513. [Google Scholar] [CrossRef] [PubMed] [Green Version]
- Bozzetti, V.; Tagliabue, P. Metabolic Bone Disease in preterm newborn: An update on nutritional issues. Ital. J. Pediatr. 2009, 35, 20–28. [Google Scholar] [CrossRef] [Green Version]
- Glass, H.C.; Costarino, A.T.; Stayer, S.A.; Brett, C.M.; Cladis, F.; Davis, P.J. Outcomes for Extremely Premature Infants. Anesth. Analg. 2015, 120, 1337–1351. [Google Scholar] [CrossRef] [Green Version]
- Manikkam, M.; Crespi, E.J.; Doop, D.D.; Herkimer, C.; Lee, J.S.; Yu, S.; Brown, M.B.; Foster, D.L.; Padmanabhan, V. Fetal Programming: Prenatal Testosterone Excess Leads to Fetal Growth Retardation and Postnatal Catch-Up Growth in Sheep. Endocrinology 2004, 145, 790–798. [Google Scholar] [CrossRef] [Green Version]
- Tudehope, D.; Vento, M.; Bhutta, Z.; Pachi, P. Nutritional Requirements and Feeding Recommendations for Small for Gestational Age Infants. J. Pediatr. 2013, 162, S81–S89. [Google Scholar] [CrossRef]
- Stoll, B.J.; Hansen, N.I.; Adams-Chapman, I.; Fanaroff, A.A.; Hintz, S.R.; Vohr, B.; Higgins, R.D. Neurodevelopmental and Growth Impairment Among Extremely Low-Birth-Weight Infants with Neonatal Infection. JAMA 2004, 292, 2357–2365. [Google Scholar] [CrossRef] [PubMed] [Green Version]
- Saigal, S.; Stoskopf, B.L.; Streiner, D.L.; Burrows, E. Physical growth and current health status of infants who were of extremely low birth weight and controls at adolescence. Pediatrics 2001, 108, 407–415. [Google Scholar] [CrossRef] [PubMed]
- Ramel, S.E.; Zhang, L.; Misra, S.; Anderson, C.G.; Demerath, E.W. Do anthropometric measures accurately reflect body composition in preterm infants? Pediatr. Obes. 2017, 12, 72–77. [Google Scholar] [CrossRef] [PubMed]
- Savino, F.; Nanni, G.; Maccario, S.; Oggero, R.; Mussa, G. Relationships between IGF-I and Weight Z Score, BMI, Tricipital Skin-Fold Thickness, Type of Feeding in Healthy Infants in the First 5 Months of Life. Ann. Nutr. Metab. 2005, 49, 83–87. [Google Scholar] [CrossRef]
- Savino, F.; Fissore, M.F.; Grassino, E.C.; Nanni, G.E.; Oggero, R.; Silvestro, L. Ghrelin, leptin and IGF-I levels in breast-fed and formu-la-fed infants in the first years of life. Acta Paediatr. 2005, 94, 531–537. [Google Scholar] [CrossRef]
- Stocker, C.J.; Cawthorne, M.A. The influence of leptin on early life programming of obesity. Trends Biotechnol. 2008, 26, 545–551. [Google Scholar] [CrossRef] [PubMed]
- Palou, A.; Pico, C. Leptin intake during lactation prevents obesity and affects food intake and food preferences in later life. Appetite 2009, 52, 249–252. [Google Scholar] [CrossRef]
- NCD Risk Factor Collaboration (NCD-RisC). A century of trends in adult human height. eLife 2016, 5, e13410. [Google Scholar] [CrossRef]
- Abarca-Gómez, L.; Abdeen, Z.A.; Hamid, Z.A.; Abu-Rmeileh, N.M.; Acosta-Cazares, B.; Acuin, C.; Adams, R.J.; Aekplakorn, W.; Afsana, K.; Aguilar-Salinas, C.A.; et al. Worldwide trends in body-mass index, underweight, overweight, and obesity from 1975 to 2016: A pooled analysis of 2416 population-based measurement studies in 128.9 million children, adolescents, and adults. Lancet 2017, 390, 2627–2642. [Google Scholar] [CrossRef] [Green Version]
- Young, L.; Embleton, N.D.; McGuire, W. Nutrient-enriched formula versus standard formula for preterm infants following hospital discharge. Cochrane Database Syst. Rev. 2016, 2016, CD004696. [Google Scholar] [CrossRef] [PubMed]
- Young, L.; Embleton, N.; McCormick, F.M.; McGuire, W. Multinutrient fortification of human breast milk for preterm infants following hospital discharge. Cochrane Database Syst. Rev. 2013, 2013, CD004866. [Google Scholar] [CrossRef] [PubMed]
- Bender, R.; Bunce, C.; Clarke, M.; Gates, S.; Lange, S.; Pace, N.L.; Thorlund, K. Attention should be given to multiplicity issues in systematic reviews. J. Clin. Epidemiol. 2008, 61, 857–865. [Google Scholar] [CrossRef]
- Higgins, J.P.T.; Thompson, S.G.; Deeks, J.J.; Altman, D.G. Measuring inconsistency in meta-analyses. BMJ 2003, 327, 557–560. [Google Scholar] [CrossRef] [Green Version]


| Author/Year | Country | Participants | Participants: n | Intervention | Control | Duration | Outcomes |
|---|---|---|---|---|---|---|---|
| Studies with IPD Available | |||||||
| Agosti 2003 | Italy | Inclusion criteria: preterm BW < 1500 g and previously fed with a preterm formula. Exclusion criteria: malformations, intraventricular haemorrhage, periventricular leukomalacia, chronic lung disease, necrotising enterocolitis grade >1, total parenteral nutrition >2 weeks, sepsis, retinopathy of prematurity grade >1. | Intervention: 89 Control: 67 | Preterm formula (protein 2.4 g/100 mL, energy 80 kcal/100 mL) | Standard term formula (protein 1.7 g/100 mL, energy 70 kcal/100 mL) | Started from 40 weeks PMA, stopped at 55 weeks PMA | Weight (raw and z-scores), length (raw and z-scores), HC (raw and z-scores), BMI (raw and z-scores), weight-for-length z-scores in infancy and in toddlers. |
| Atkinson 1999 | Canada | Inclusion criteria: BW < 2500 g; GA < 42 weeks. birthweight <5th percentile and fed only formula at entry into the study. | Intervention: 22 Control: 28 | Ross Discharge formula (protein: 1.8 g/100 mL, energy 74 kcal/100 mL) | Similac with Iron formula (68 kcal/100 mL) | Started from discharge, stopped at 1 year CA | Weight (raw and z-scores), length (raw and z-scores), HC (raw and z-scores), BMI (raw and z-scores), weight-for-length z-scores, lean mass, lean mass index, fat mass, fat mass index, percent fat mass, BMC, and BMD in infancy. |
| Biasini 2012 | Italy | Inclusion criteria: preterm BW 580 to 1250 g and GA < 32 weeks. | Intervention: 34 Control: 27 | Protein supplemented group (protein 4.8 g/kg/day, energy 141 kcal/day) | Control group (protein 3.5 g/kg/day, energy 135 kcal/day) | Started from the first day of full enteral feeding, stopped at discharge. | Weight (raw and z-scores), length (raw and z-scores), HC (raw and z-scores), BMI (raw and z-scores), weight-for-length z-scores in infancy and in toddlers. Weight (raw and z-scores), length (raw and z-scores), BMI (raw and z-scores) in childhood. |
| Brunton 1998 | Canada | Inclusion criteria: preterm BW < 1500 g and appropriate for gestational age, had BPD, were formula-fed by parental choice, and had not undergone gastrointestinal surgery. Exclusion criterion: major congenital anomalies. | Intervention: 26 Control: 30 | Enriched formula (protein 2.3 g/100 mL, energy 90 kcal/100 mL) | Standard isoenergetic formula (protein 1.5 g/100 mL, energy 90 kcal/100 mL) | Started at 37 weeks PMA, stopped at 3 months’ CA. | Weight (raw and z-scores), length (raw and z-scores), HC (raw and z-scores), BMI (raw and z-scores), weight-for-length z-scores, BMC and BMD in infancy. |
| Cooke 1998 | UK | Inclusion criteria: GA ≤ 34 weeks and BW ≤ 1750 g, and growing normally at the time of hospital discharge, i.e., ≥25 g/d. Exclusion criterion: systemic disease or require medication. | Intervention: 56 Control: 57 | Preterm formula (protein 2.2 g/100 mL, fat 4.4 g/100 mL, carbohydrate 8.5 g/100 mL, energy 80 kcal/100 mL) | Term formula (protein 1.4 g/100 mL, fat 3.6 g/100 mL, carbohydrate 7.5 g/100 mL, energy 66 kcal/100 mL) | Started from discharge, stopped at 6 months’ CA. | Weight (raw and z-scores), length (raw and z-scores), HC (raw and z-scores), BMI (raw and z-scores), weight-for-length z-scores in infancy and in toddlers. Weight (raw), length (raw and z-scores), BMI (raw and z-scores) in adolescence. Lean mass, lean mass index, fat mass, fat mass index, percent fat mass, BMC and BMD in infancy and in adolescence. |
| Embleton 2005 | UK | Inclusion criteria: preterm GA ≤ 34 weeks and BW ≤ 1750 g, tolerating enteral intake ≥150 mL/kg/day for ≥48 h and current weight ≥1000 g. | Formula A: 25 Formula C: 26 | Formula A (protein 2.6 g/100 mL, fat 4.3 g/100 mL, carbohydrate 7.9 g/100 mL, energy 80 kcal/100 mL); | Formula C (protein 2.2 g/100 mL, fat 4.5 g/100 mL, carbohydrate 7.9 g/100 mL, energy 80 kcal/100 mL) | Started when full enteral feeding 150 mL/kg/day, stopped at 12 weeks. | Weight (raw and z-scores), length (raw and z-scores), HC (raw and z-scores), BMI (raw and z-scores), weight-for-length z-scores in infancy and in toddlers. Weight (raw), length (raw and z-scores), BMI (raw and z-scores) in adolescence. Lean mass, lean mass index, fat mass, fat mass index, percent fat mass, BMC and BMD in infancy and in adolescence. |
| Fewtrell 2001 | UK | Inclusion criteria: term GA ≥ 37 weeks and BW < 10th centile for gestation and sex (UK growth charts). | Intervention: 152 Control: 147 | Enriched formula (protein 1.9 g/100 mL, fat 4.0 g/100 mL, carbohydrate 7.2 g/100 mL, energy 72 kcal/100 mL) | Term formula (protein 1.5 g/100 mL, fat 3.9 g/100 mL, carbohydrate 7.0 g/100 mL, energy 68 kcal/100 mL) | Started within the first week, stopped at 9 months’ CA. | Weight (raw and z-scores), length (raw and z-scores), HC (raw and z-scores), BMI (raw and z-scores), weight-for-length z-scores in infancy and in toddlers. |
| Koo 2006 | USA | Inclusion criteria: preterm GA ≤ 34 weeks and BW 630 to 1620 g, intact gastrointestinal tract, tolerated full enteral feeding, expected soon to be ready for hospital discharge. | Intervention: 44 Control: 45 | Nutrient-enriched formula (protein 1.9 g/100 mL, fat 4.1 g/100 mL, carbohydrate 7.6 g/100 mL, energy 74 kcal/100 mL) | Term formula (protein 1.4 g/100 mL, fat 3.6 g/100 mL, carbohydrate 7.2 g/100 mL, and energy 67 kcal/100 mL) | Started at discharge, stopped at 12 months after discharge. | Weight (raw and z-scores), length (raw and z-scores), HC (raw and z-scores), BMI (raw and z-scores), weight-for-length z-scores, lean mass, lean mass index, fat mass, fat mass index, percent fat mass, BMC and BMD in infancy. |
| Litmanovitz 2007 | Israel | Inclusion criteria: preterm BW < 1500 g and appropriate for gestational age, formula-fed. Exclusion criteria: severe central nervous system disorder, major congenital anomalies, chronic lung disease, prior diagnosis of necrotising enterocolitis. | Intervention: 10 Control: 10 | Enriched post-discharge formula (protein 1.9 g/100 mL, energy 74 kcal/100 mL) | Term formula (protein 1.5 g/100 mL, energy 67 kcal/100 mL) | Started at term (discharge), stopped at 6 months’ CA. | Weight (raw and z-scores), length (raw and z-scores), HC (raw and z-scores), BMI (raw and z-scores), weight-for-length z-scores in infancy. |
| Lucas 1996 | UK | Inclusion criteria: preterm BW < 1850 g and GA < 37 weeks, survived to be assigned to a study group between 48 and 72 h of age. Exclusion criterion: major congenital anomalies. | Intervention: 137 Control: 138 | Fortified human breast milk (fortifier contained protein 0.7 g/100 mL, fat 0.05 g/100 mL, carbohydrate 2.73 g/100 mL, energy 14 kcal/100 mL) | Human breast milk | Started within 48 h, stopped at discharge or reached 2000 g. | Weight (raw and z-scores), length (raw and z-scores), HC (raw and z-scores), BMI (raw and z-scores), weight-for-length z-scores in infancy and in toddlers. |
| Lucas 2001 | UK | Inclusion criteria: preterm GA< 37 weeks and BW < 1750 g. Exclusion criteria: congenital malformations or conditions known to affect growth or development. | Intervention: 113 Control: 116 | Post-discharge formula (protein 1.9 g/100 mL, fat 4.0 g/100 mL, carbohydrate 7.2 g/100 mL, energy 72 kcal/100 mL) | Term formula (protein 1.5 g/100 mL, fat 3.8 g/100 mL, carbohydrate 7.0 g/100 mL, energy 68 kcal/100 mL) | Started one week before discharge, stopped at 9 months CA. | Weight (raw and z-scores), length (raw and z-scores), HC (raw and z-scores), BMI (raw and z-scores), weight-for-length z-scores in infancy and in toddlers. |
| Moltu 2013 | Norway | Inclusion criteria: preterm GA < 37 weeks and BW < 1500 g. Exclusion criteria: congenital malformations, chromosomal abnormalities, critical illness with short life expectancy, clinical syndromes known to affect growth and development. | Intervention: 24 Control: 24 | Enhanced nutrient: Parenteral nutrition: started with 3.5 g/kg/day AA. Full enteral feeding: intervention group received 10% higher energy and 20% higher protein than the control group. | Standard nutrient: Parenteral nutrition: started with 2.0 g/kg/day AA. | Started within 24 h after birth, stopped at 52 weeks PMA or when reached 5.5 kg. | Weight (raw and z-scores), length (raw and z-scores), HC (raw and z-scores), BMI (raw and z-scores), weight-for-length z-scores in infancy and in toddlers. |
| Morgan 2014 | UK | Inclusion criteria: GA 24–28 weeks and BW < 1200 g. Exclusion criteria: unlikely to survive the first week after birth; diagnosed with major congenital or chromosomal abnormalities known to affect gastrointestinal function or head growth, including definite parenchymal lesions on cranial ultrasound scan in first 48 h. | Intervention: 74 Control: 76 | Higher macronutrient content (parenteral intake with protein 3.8 g/kg/day, fat 3.8 g/kg/day, carbohydrate 15.6 g/kg/day, energy 103 kcal/kg/day) | Standard macronutrient content (parenteral intake with protein 2.8 g/kg/day, fat 2.8 g/kg/day, carbohydrate 13.5 g/kg/day, energy 85 kcal/kg/day) | Started within 120 h of birth, stopped at 28 days. | HC (raw and z-scores) in toddlers. |
| Mukhopadhyay 2007 | India | Inclusion criteria: preterm GA ≤ 34 weeks and BW ≤ 1500 g reached feed volume of 150 mL/kg/day, feed constituted at least 80% breast milk. Exclusion criteria: major congenital malformation, gastrointestinal abnormalities. | Intervention: 85 Control: 81 | Fortified human milk: (fortifier contained protein 0.4 g/100 mL; fat 0.2 g/100 mL; carbohydrate 2.4 g/100 mL; energy 13 kcal/100 mL) | Exclusive human milk | Started when feed volume reached 150 mL/kg/day, stopped when it reached 2 kg or full breastfeeds. | Weight (raw and z-scores), length (raw and z-scores), HC (raw and z-scores), BMI (raw and z-scores), weight-for-length z-scores in infancy. |
| Picaud 2008 | France | Inclusion criteria: GA ≤ 33 weeks, BW < 1750 g. Exclusion criterion: major congenital malformations. | Intervention: 23 Control: 26 | Preterm formula (protein 2.3 g/100 mL, fat 4.2 g/100 mL, carbohydrate 8.5 g/100 mL, energy 81 kcal/100 mL) | Term formula (protein 1.7 g/100 mL, fat 3.2 g/100 mL, carbohydrate 7.85 g/100 mL, energy 67 kcal/100 mL) | Started after discharge, stopped 2 months after discharge. | Weight (raw and z-scores), length (raw and z-scores), HC (raw and z-scores), BMI (raw and z-scores), weight-for-length z-scores, lean mass, lean mass index, fat mass, fat mass index, percent fat mass, BMC and BMD in infancy. |
| Rochow 2019 | Canada | Inclusion criteria: GA < 30 weeks, length of stay > 21 days, and receiving fortified BM. Exclusion criteria: gastrointestinal malformation, major congenital anomalies, necrotising enterocolitis, abdominal surgery, and gram-negative sepsis. | Intervention: 52 Control: 51 | Target fortified human milk:(protein 3.0 g/100 mL, fat 4.4 g/100 mL, carbohydrates 8.5 g/100 mL) | Standard fortified human milk | Started when enteral intake was ≥100 mL/kg/day, stopped at 36 weeks’ PMA. | Weight (raw and z-scores), length (raw and z-scores), HC (raw and z-scores), BMI (raw and z-scores), weight-for-length z-scores in infancy and in toddlers. Lean mass, lean mass index, fat mass, fat mass index, and percent fat mass in infancy. |
| Roggero 2012 | Italy | Inclusion criteria: GA ≤ 32 weeks, BW ≤ 1500 g, being fed human milk for <20% of total milk intake. Exclusion criteria: congenital malformations, conditions that interfere with growth or body composition. | Intervention: 110 Control: 107 | Nutrient-enriched formula (protein 2.0 g/100 mL, fat 4.1 g/100 mL, carbohydrate 7.5 g/100 mL, energy 75 kcal/100 mL) | Term formula (protein 1.4 g/100 mL, fat 3.7 g/100 mL, carbohydrate 7.4 g/100 mL, energy 68 kcal/100 mL) | Started from term, stopped at 6 months. | Weight (raw and z-scores), length (raw and z-scores), HC (raw and z-scores), BMI (raw and z-scores), weight-for-length z-scores, lean mass, lean mass index, fat mass, fat mass index, percent fat mass in infancy. |
| Tan 2008 | UK | Inclusion criteria: GA < 29 weeks. Exclusion criteria: Triplets and higher multiplicity, admitted after 7 days of age, major congenital abnormalities. | Intervention: 68 Control: 74 | Parenteral intake with protein 4 g/kg/day, fat 4 g/kg/day, carbohydrate 16.3 g/kg/day, energy 117 kcal/kg/day; enteral intake breast milk or formula with target protein 4 g/kg/day, energy 133–150 kcal/kg/day | Parenteral intake with protein 3 g/kg/day, fat 3 g/kg/day, carbohydrate 13.5 g/kg/day, energy 93 kcal/kg/day; enteral intake breast milk or formula with target protein 3.3 g/kg/day, energy 133 kcal/kg/day | Started when infants received parenteral and enteral nutrition from the first week, stopped at 34 weeks’ PMA. | Weight (raw and z-scores), length (raw and z-scores), HC (raw and z-scores), BMI (raw and z-scores), weight-for-length z-scores in infancy. |
| Zachariassen 2001 | Denmark | Inclusion criteria: preterm GA ≤ 32 weeks, breastfeeding. Exclusion criteria: severe diseases, circumstances influencing eating and feeding ability at discharge. | Intervention: 105 Control: 102 | Fortified mother’s milk. Component of fortifier: (protein 1.4 g/day, energy 17.5 kcal/day) | Unfortified mother’s milk | Started shortly before discharge, stopped at 4 months’ CA. | Weight (raw and z-scores), length (raw and z-scores), HC (raw and z-scores), BMI (raw and z-scores), weight-for-length z-scores in infancy, in toddlers and in childhood. Lean mass, lean mass index, fat mass, fat mass index, and percent fat mass in childhood. |
| Studies with AD Available | |||||||
| Amesz 2010 | The Netherlands | Inclusion criteria: preterm GA ≤ 32 weeks or BW ≤ 1500 g. Exclusion criteria: congenital malformations or conditions known to affect growth or body composition (e.g., severe BPD, inborn error of metabolism, cardiac or renal disease, necrotising enterocolitis with substantial gut loss, grade 4 intraventricular haemorrhage). | Intervention: 52 Control:50 | Post-discharge formula (protein 1.7 g/100 mL, fat 3.5 g/100 mL, carbohydrate 7.0 g/100 mL, energy 67 kcal/100 mL) | Term formula (protein 1.47 g/100 mL, fat 3.5 g/100 mL, carbohydrate 7.2 g/100 mL, energy 70 kcal/100 mL) | Started from term, stopped at 6 months’ CA. | Weight, length, BMI, fat mass, lean mass and BMC, BMD in infancy and in childhood |
| Bellagamba 2016 | Italy | Inclusion criteria: preterm BW 500 to 1249 g. | Intervention: 82 Control: 82 | High protein intake group (protein supplementation started at 1.5 g/kg/day and increased by 0.5 g/kg/day to a maximum of 3.5 g/kg/day on the fifth day after birth) | Standard protein intake group (protein supplementation started at 1.5 g/kg/day and increased by 0.5 g/kg/day to a maximum of 2.5 g/kg/day on the third day after birth) | Started from birth, stopped at discharge. | Weight, length and HC in toddlers. |
| Brooke 1985 | UK | Inclusion criteria: term SGA infants with their parents’ consent. Exclusion criterion: infants underweight because of wasting. | Intervention: 10 Control: 7 | High energy formula (protein 2.3 g/100 mL, fat 4.2 g/100 mL, carbohydrate 10.7 g/100 mL, energy 87 kcal/100 mL) | Standard energy formula (protein 1.5 g/100 mL, fat 3.6 g/100 mL, carbohydrate 7.2 g/100 mL, energy 65 kcal/100 mL) | Started from the second week after birth, stopped at 3 months postnatal age. | Weight, length, and HC in infancy. |
| Carver 2001 | USA | Inclusion criteria: preterm BW < 1800 g or GA < 37 weeks, previous parental decision not to provide breast milk. Exclusion criteria: severe BPD, cardiac, respiratory, gastrointestinal, or other systemic diseases. | Intervention: 67 Control: 56 | Post-discharge formula (protein 1.9 g/100 mL, fat 4.0 g/100 mL, carbohydrate 7.6 g/100 mL, energy 74 kcal/100 mL) | Term formula (protein 1.4 g/100 mL, fat 3.6 g/100 mL, carbohydrate 7.2 g/100 mL energy 67 kcal/100 mL) | Started 2 to 4 days before discharge, stopped at 12 months’ CA. | Weight, length, and HC in infancy. |
| Chan 1994 | USA | Inclusion criteria: preterm BW < 1650 g and weight at hospital discharge ≥1800 gExclusion criteria: necrotising enterocolitis, congenital anomalies, hepatic disease, cardiac disease, BPD. | Preterm formula: 14 Low birthweight formula: 14 Standard formula: 15 | Preterm formula (protein 1.85–1.94 g/100 mL, fat 3.75–3.83 g/100 mL, carbohydrate 7.1–7.2 g/100 mL, energy 69.4–71.0 kcal/100 mL); Low birthweight formula (protein 1.71–1.78 g/100 mL, fat 3.62–3.81 g/100 mL, carbohydrate 6.8–7.1 g/100 mL, energy 66.7–66.9 kcal/100 mL) | Standard formula (protein 1.52–1.54 g/100 mL, fat 3.64–3.74 g/100 mL, carbohydrate 7.1–7.3 g/100 mL, energy 67.4–689 kcal/100 mL) | Started from discharge, stopped 8 weeks after discharge. | Weight and BMC at in infancy. |
| Cooper 1985 | South Africa | Inclusion criteria: preterm BW 1200–1500 g and GA < 36 weeks. Exclusion criteria: needing ventilator support. | Intervention: 4 Control: 4 | Preterm formula (protein 1.94 g/100 mL, fat 3.4 g/100 mL, carbohydrate 7.3 g/100 mL, energy 67 kcal/100 mL) | Standard formula (protein 1.5 g/100 mL, fat 1.6 g/100 mL, carbohydrate 7.2 g/100 mL, energy 67 kcal/100 mL) | Started when reached a weight of 2000 g, stopped after 8 weeks. | Weight, length, and HC in infancy. |
| De Curtis 2002 | Italy | Inclusion criteria: preterm BW < 1750 g and GA< 35 weeks. Exclusion criterion: infants with clinical problems. | Intervention: 16 Control: 17 | Post-discharge formula (protein 1.8 g/100 mL, fat 4.1 g/100 mL, carbohydrate 7.5 g/100 mL, energy 74 kcal/100 mL) | Term formula (protein 1.4 g/100 mL, fat 3.6 g/100 mL, carbohydrate 7.1 g/100 mL, energy 66 kcal/100 mL) | Started from start of enteral feeds, stopped after 2 months. | Weight, length, HC, fat mass, lean mass, and BMC in infancy. |
| Dogra 2017 | India | Inclusion criteria: preterm BW < 1500 g or GA < 32 weeks and reached a feed volume of 100 mL/kg/day. Exclusion criterion: lethal congenital malformations. | Intervention: 59 Control: 56 | Fortified breast milk with higher protein intake (fortifier contained protein 1.0 g/100 mL, fat 0.01 g/100 mL, carbohydrate 3.6 g/100 mL, energy 17.2 kcal/100 mL) | Fortified breast milk with standard protein intake (fortifier contained protein 0.4 g/100 mL, fat 0.2 g/100 mL, carbohydrate 2.4 g/100 mL; energy 13 kcal/100 mL) | Started when reached a feed volume of 100 mL/kg/day, stopped at discharge or when totally directly breast-fed, whichever was earlier. | Weight, length, and HC in toddlers. |
| Jeon 2011 | Korea | Inclusion criteria: preterm GA < 33 weeks and BW < 1500 g, formula as the primary food source. Exclusion criteria: chromosomal disorders, serious congenital malformations at discharge that would affect growth and development. | Intervention: 35 Control: 34 | Preterm formula (protein 2.3 g/100 mL, fat 4.1 g/100 mL, carbohydrate 8.5 g/100 mL, energy 80 kcal/100 mL) | Term formula (protein 1.6 g/100 mL, fat 3.5 g/100 mL, carbohydrate 7.2 g/100 mL, energy 67 kcal/100 mL) | Started at term, stopped at 6 months’ CA. | Weight (raw and z-scores), length, (raw and z-scores), and HC (raw and z-scores) in infancy and in toddlers. |
| Lin 2004 | China | Inclusion criteria: term GA ≥ 37 weeks and birthweight < 10 th centile. Exclusion criteria: severe medical problems or breast-fed. | Intervention: 20 Control: 20 | Nutrient-enriched formula (protein 1.9 g/100 mL, fat 4.1 g/100 mL, carbohydrate 7.7 g/100 mL, energy 74 kcal/100 mL) | Term formula (protein 1.4 g/100 mL, fat 3.7 g/100 mL, carbohydrate 7.1 g/100 mL, energy 68 kcal/100 mL) | Started at discharge, stopped at 3 months after discharge. | Weight, length, and HC in infancy. |
| Lucas 1989 | UK | Inclusion criteria: preterm GA < 37 weeks and BW < 1850 g. Exclusion criteria: major congenital abnormality known to impair growth or development, died before randomisation within the first 48 h | (1) Lucas 1989a Intervention: 76 Control: 83 | (1) Lucas 1989a: Preterm formula as sole diet (protein 2.0 g/100 mL, fat 4.9 g/100 mL, carbohydrate 7.0 g/100 mL, energy 80 kcal/100 mL) | (1) Lucas 1989a: Banked breast milk as sole diet (protein 1.1 g/100 mL, fat 1.7 g/100 mL, carbohydrate 7.1 g/100 mL, energy 46 kcal/100 mL) | Started within 48 h, stopped at discharge or reached 2000 g. | Weight, length and HC in infancy, in childhood, and in adolescence. BMD and BMC in adolescence. |
| (2) Lucas 1989b: Intervention: 173 Control: 170 | (2) Lucas 1989b Preterm formula as a supplement | (2) Lucas 1989 b: banked breast milk as a supplement; | |||||
| (3) Lucas 1989c: combined Lucas 1989a and Lucas 1989b | (3) Lucas 1989c: combined Lucas 1989a and Lucas 1989b | (3) Lucas 1989c: combined Lucas 1989a and Lucas 1989b | |||||
| Lucas 1990 | UK | Inclusion criteria: preterm GA < 37 weeks and BW < 1850g. Exclusion criteria: major congenital abnormality known to impair growth or development, died before randomisation within the first 48 h. | (1) Lucas 1990a:Intervention: 81 Control: 79 | (1) Lucas 1990a: Preterm formula as sole diet (protein 2.0 g/100 mL, fat 4.9 g/100 mL, carbohydrate 7.0 g/100 mL, energy 80 kcal/100 mL) | (1) Lucas 1990a: Term formula as sole diet (protein 1.5 g/100 mL, fat 3.8 g/100 mL, carbohydrate 7.0 g/100 mL, energy 68 kcal/100 mL) | Started within 48 h, stopped at discharge or reached 2000 g | Weight, length and HC in infancy, in childhood, and in adolescence. BMD and BMC in adolescence. |
| (2) Lucas 1990b: Intervention: 132 Control: 132 | (2) Lucas 1990b Preterm formula as supplement | (2) Lucas 1990b: Term formula as supplement | |||||
| (3) Lucas 1990c: Combined Lucas 1990a and Lucas 1990b Intervention: 213 Control: 211 | (3) Lucas 1990c: Combined Lucas 1990a and Lucas 1990b | (3) Lucas 1990c: Combined Lucas 1990a and Lucas 1990b | |||||
| Lucas 1992 | UK | Inclusion criteria: preterm BW < 1850 g and GA < 37 weeks, formula-fed during hospital stay. Exclusion criteria: congenital malformations and disease likely to influence growth and neurodevelopment. | Intervention: 16 Control: 15 | Post-discharge formula (protein 1.9 g/100 mL, fat 4.0 g/100 mL, carbohydrate 7.3 g/100 mL, energy 72 kcal/100 mL) | Term formula (protein 1.5 g/100 mL, energy 67 kcal/100 mL, fat and carbohydrate not specified) | Started before discharge, stopped at 9 months’ CA. | Weight, length, HC and BMC in infancy. |
| O’Connor 2008 | Canada | Inclusion criteria: preterm GA < 33 weeks, BW 750 to 1800 g, received ≥80% of their total feedings as human milk 3 days before hospital discharge. Exclusion criteria: serious congenital or chromosomal anomalies that could affect growth, grade 3 or 4 periventricular or intraventricular haemorrhage, oral steroids within 14 days of randomisation, severe asphyxia, known maternal alcohol or drug abuse. | Intervention: 19 Control: 20 | Human milk with multi-nutrient fortifier (protein 2.0 g/100 mL, fat 4.2 g/100 mL, carbohydrate 8.8 g/100 mL, energy 81 kcal/100 mL) | Unfortified human milk (protein 1.3 g/100 mL, fat 3.9 g/100 mL, carbohydrate 7.2 g/100 mL, energy 68 kcal/100 mL) | Started from discharge, stopped at 12 weeks after discharge. | Weight, length, HC, fat mass, lean mas BMC and BMD in infancy. |
| Svenningsen 1982 | Sweden | Inclusion criteria: very low birthweight preterm infants with mean ± SD: BW 1385 ± 343 g and GA 30.8 ± 2.9 weeks. | Intervention: 16 Control: 14 | Nutrition enriched formula (protein 2.1 g/100 mL, energy 69.5 kcal/100 mL) | Standard formula (protein 1.6 g/100 mL, energy 68.5 kcal/100 mL) | Started from the third week after birth, stopped at the seventh week after birth. | Weight, length, and HC in infancy and in toddlers. |
| Wauben 1998 | Canada | Inclusion criteria: BW < 1800 g, appropriate weight-for-gestational-age, postnatal age >1 week, full oral foods (no parenteral nutrition and >160 mL/kg/day enterally) tolerated for ≥5 days, weight gain >10 g/kg/day. Exclusion criteria: severe congenital malformation, chromosomal abnormalities, gastrointestinal disease. | Intervention: 12 Control: 13 | Mother’s milk with multi-nutrient fortifier (fortifier protein 0.4 g/100 mL, fat 34.7 g/100 mL) | Mother’s milk supplemented with calcium and phosphorus | Started when expressed mother’s milk >80% of total enteral intake, stopped when discharged if PMA > 38 weeks. | Weight, length, HC, percent fat mass, BMC, BMD in infancy. |
| Wheeler 1996 | USA | Inclusion criteria: preterm GA < 35 weeks and BW < 1800 g; normally grown in utero, free of medical conditions that affect nutrition and growth. Exclusion criteria: necrotising enterocolitis, chronic lung disease (oxygen need after hospital discharge), central nervous system disease, other conditions affecting nutrient intake or anthropometrics. | Intervention: 23 Control: 20 | Whey predominant premature infant formula (protein 1.8 g/100 mL, fat 3.7 g/100 mL, carbohydrate 7.2 g/100 mL, energy 68 kcal/100 mL) | Standard formula (protein 1.5 g/100 mL, fat 3.6 g/100 mL, carbohydrate 7.2 g/100 mL, energy 68 kcal/100 mL) | Started 1 week before hospital discharge, stopped 8 weeks after discharge. | Weight, length, and HC in infancy. |
Publisher’s Note: MDPI stays neutral with regard to jurisdictional claims in published maps and institutional affiliations. |
© 2022 by the authors. Licensee MDPI, Basel, Switzerland. This article is an open access article distributed under the terms and conditions of the Creative Commons Attribution (CC BY) license (https://creativecommons.org/licenses/by/4.0/).
Share and Cite
Lin, L.; Gamble, G.D.; Crowther, C.A.; Bloomfield, F.H.; Agosti, M.; Atkinson, S.A.; Biasini, A.; Embleton, N.D.; Lamy Filho, F.; Fusch, C.; et al. Sex-Specific Effects of Nutritional Supplements for Infants Born Early or Small: An Individual Participant Data Meta-Analysis (ESSENCE IPD-MA) II: Growth. Nutrients 2022, 14, 392. https://0-doi-org.brum.beds.ac.uk/10.3390/nu14020392
Lin L, Gamble GD, Crowther CA, Bloomfield FH, Agosti M, Atkinson SA, Biasini A, Embleton ND, Lamy Filho F, Fusch C, et al. Sex-Specific Effects of Nutritional Supplements for Infants Born Early or Small: An Individual Participant Data Meta-Analysis (ESSENCE IPD-MA) II: Growth. Nutrients. 2022; 14(2):392. https://0-doi-org.brum.beds.ac.uk/10.3390/nu14020392
Chicago/Turabian StyleLin, Luling, Greg D. Gamble, Caroline A. Crowther, Frank H. Bloomfield, Massimo Agosti, Stephanie A. Atkinson, Augusto Biasini, Nicholas D. Embleton, Fernando Lamy Filho, Christoph Fusch, and et al. 2022. "Sex-Specific Effects of Nutritional Supplements for Infants Born Early or Small: An Individual Participant Data Meta-Analysis (ESSENCE IPD-MA) II: Growth" Nutrients 14, no. 2: 392. https://0-doi-org.brum.beds.ac.uk/10.3390/nu14020392