
Reported Changes in Eating Habits Related to Less Healthy Foods and Beverages during the COVID-19 Pandemic among US Adults


Abstract
:
1. Introduction
2. Methods
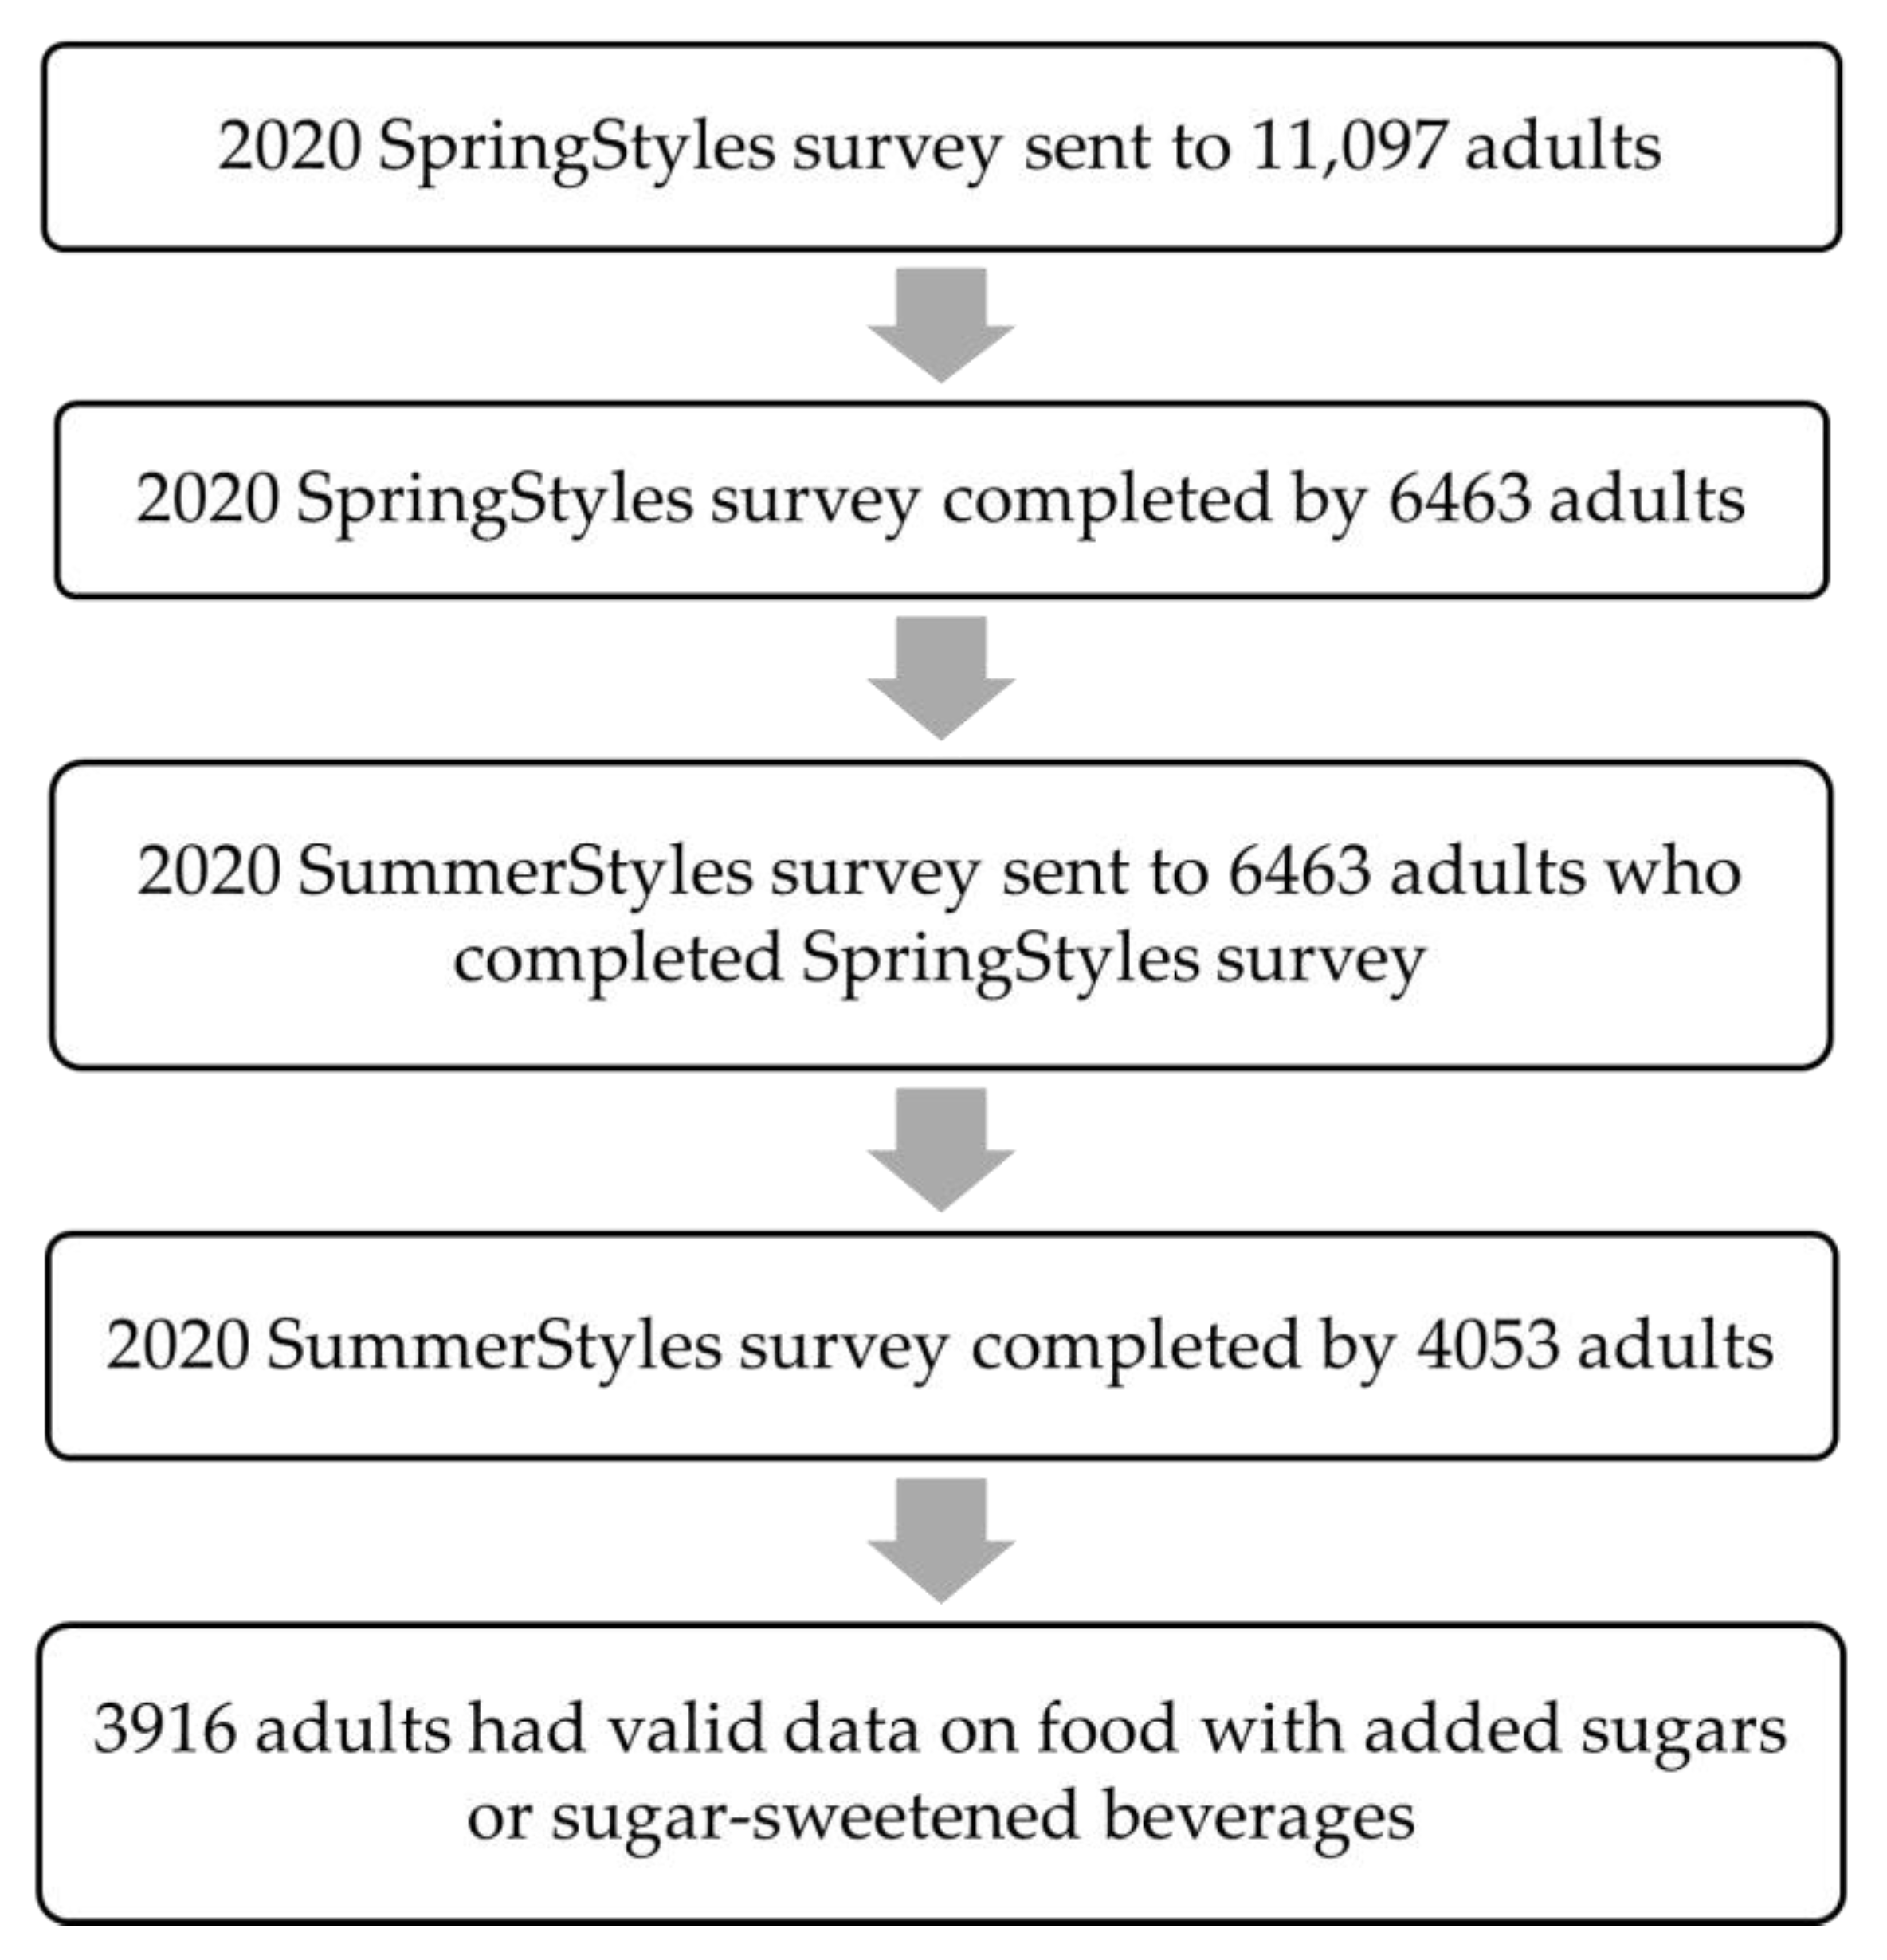
2.1. Study Sample and Survey Administration
2.2. Outcome Variables
2.3. Explanatory Variables
2.4. Statistical Analysis
3. Results
4. Discussion
Limitations
5. Conclusions
Author Contributions
Funding
Institutional Review Board Statement
Informed Consent Statement
Data Availability Statement
Conflicts of Interest
References
- Dunford, E.K.; Popkin, B.; Ng, S.W. Junk food intake among adults in the United States. J. Nutr. 2021, nxab205. [Google Scholar] [CrossRef] [PubMed]
- Liu, J.; Lee, Y.; Micha, R.; Li, Y.; Mozaffarian, D. Trends in junk food consumption among US children and adults, 2001–2018. Am. J. Clin. Nutr. 2021, 114, 1039–1048. [Google Scholar] [CrossRef] [PubMed]
- Bowman, S.A.; Friday, J.E.; Schroeder, N.; Shimizu, M.; LaComb, R.P.; Moshfegh, A.J. Food Patterns Equivalents Intakes by Americans: What We Eat in America, NHANES 2003–2004 and 2015–2016. Food Surveys Research Group Dietary Data Brief 2018, No. 20, pp. 1–8. Available online: https://www.ars.usda.gov/ARSUserFiles/80400530/pdf/DBrief/20_Food_Patterns_Equivalents_0304_1516.pdf (accessed on 23 January 2022).
- Bowman, S.A.; Clemens, J.C.; Friday, J.E.; LaComb, R.P.; Paudel, D.; Shimizu, M. Added Sugars in Adults’ Diet: What We Eat in America, NHANES 2015–2016. Food Surveys Research Group Dietary Data Brief 2019, No. 24, pp. 1–6. Available online: https://www.ars.usda.gov/ARSUserFiles/80400530/pdf/DBrief/24_Sources_of_Added_Sugars_in_Adults'_Diet_2015-2016.pdf (accessed on 23 January 2022).
- Chevinsky, J.R.; Lee, S.H.; Blanck, H.M.; Park, S. Prevalence of self-reported intake of sugar-sweetened beverages among US adults in 50 States and the District of Columbia, 2010 and 2015. Prev. Chronic. Dis. 2021, 18, E35. [Google Scholar] [CrossRef] [PubMed]
- Yang, Q.; Zhang, Z.; Steele, E.M.; Moore, L.V.; Jackson, S.L. Ultra-processed foods and excess heart age among U.S. adults. Am. J. Prev. Med. 2020, 59, e197–e206. [Google Scholar] [CrossRef]
- Kim, H.; Hu, E.A.; Rebholz, C.M. Ultra-processed food intake and mortality in the USA: Results from the Third National Health and Nutrition Examination Survey (NHANES III, 1988–1994). Public Health Nutr. 2019, 22, 1777–1785. [Google Scholar] [CrossRef]
- Lane, M.M.; Davis, J.A.; Beattie, S.; Gómez-Donoso, C.; Loughman, A.; O’Neil, A.; Jacka, F.; Berk, M.; Page, R.; Marx, W.; et al. Ultraprocessed food and chronic noncommunicable diseases: A systematic review and meta-analysis of 43 observational studies. Obes. Rev. 2021, 22, e13146. [Google Scholar] [CrossRef]
- Lippi, G.; Henry, B.M.; Bovo, C.; Sanchis-Gomar, F. Health risks and potential remedies during prolonged lockdowns for coronavirus disease 2019 (COVID-19). Diagnosis 2020, 7, 85–90. [Google Scholar] [CrossRef]
- Pfefferbaum, B.; North, C.S. Mental Health and the Covid-19 Pandemic. N. Engl. J. Med. 2020, 383, 510–512. [Google Scholar] [CrossRef]
- Holingue, C.; Badillo-Goicoechea, E.; Riehm, K.E.; Veldhuis, C.B.; Thrul, J.; Johnson, R.M.; Fallin, M.D.; Kreuter, F.; Stuart, E.A.; Kalb, L.G. Mental distress during the COVID-19 pandemic among US adults without a pre-existing mental health condition: Findings from American trend panel survey. Prev. Med. 2020, 139, 106231. [Google Scholar] [CrossRef]
- McGinty, E.E.; Presskreischer, R.; Han, H.; Barry, C.L. Psychological distress and loneliness reported by US adults in 2018 and April 2020. JAMA 2020, 324, 93–94. [Google Scholar] [CrossRef]
- Sominsky, L.; Spencer, S.J. Eating behavior and stress: A pathway to obesity. Front. Psychol. 2014, 5, 434. [Google Scholar] [CrossRef] [PubMed]
- Torres, S.J.; Nowson, C.A. Relationship between stress, eating behavior, and obesity. Nutrition 2007, 23, 887–894. [Google Scholar] [CrossRef] [PubMed] [Green Version]
- Adam, T.C.; Epel, E.S. Stress, eating and the reward system. Physiol. Behav. 2007, 91, 449–458. [Google Scholar] [CrossRef] [PubMed]
- Cummings, J.R.; Ackerman, J.M.; Wolfson, J.A.; Gearhardt, A.N. COVID-19 stress and eating and drinking behaviors in the United States during the early stages of the pandemic. Appetite 2021, 162, 105163. [Google Scholar] [CrossRef]
- Sadler, J.R.; Thapaliya, G.; Jansen, E.; Aghababian, A.H.; Smith, K.R.; Carnell, S. COVID-19 Stress and Food Intake: Protective and Risk Factors for Stress-Related Palatable Food Intake in U.S. Adults. Nutrients 2021, 13, 901. [Google Scholar] [CrossRef]
- Nicola, M.; Alsafi, Z.; Sohrabi, C.; Kerwan, A.; Al-Jabir, A.; Iosifidis, C.; Agha, M.; Agha, R. The socio-economic implications of the coronavirus pandemic (COVID-19): A review. Int. J. Surg. 2020, 78, 185–193. [Google Scholar] [CrossRef]
- Di Renzo, L.; Gualtieri, P.; Pivari, F.; Soldati, L.; Attinà, A.; Cinelli, G.; Leggeri, C.; Caparello, G.; Barrea, L.; Scerbo, F.; et al. Eating habits and lifestyle changes during COVID-19 lockdown: An Italian survey. J. Transl. Med. 2020, 18, 229. [Google Scholar] [CrossRef]
- Bemanian, M.; Mæland, S.; Blomhoff, R.; Rabben, Å.K.; Arnesen, E.K.; Skogen, J.C.; Fadnes, L.T. Emotional rating in relation to worries and psychological distress amid the COVID-19 pandemic: A population-based survey on adults in Norway. Int. J. Env. Res. Public Health 2020, 18, 130. [Google Scholar] [CrossRef]
- Robinson, E.; Boyland, E.; Chisholm, A.; Harrold, J.; Maloney, N.G.; Marty, L.; Mead, B.R.; Noonan, R.; Hardman, C.A. Obesity, eating behavior and physical activity during COVID-19 lockdown: A study of UK adults. Appetite 2021, 156, 104853. [Google Scholar] [CrossRef]
- Błaszczyk-Bębenek, E.; Jagielski, P.; Bolesławska, I.; Jagielska, A.; Nitsch-Osuch, A.; Kawalec, P. Nutrition behaviors in Polish adults before and during COVID-19 lockdown. Nutrients 2020, 12, 3084. [Google Scholar] [CrossRef]
- Miller, S.; Bruine de Bruin, W.; Livings, M.; Wilson, J.; Weber, K.; Frazzini, A.; Babboni, M.; de la Haye, K. Self-reported dietary changes among Los Angeles County adults during the COVID-19 pandemic. Appetite 2021, 166, 105586. [Google Scholar] [CrossRef] [PubMed]
- Cosgrove, K.; Wharton, C. Predictors of COVID-19-related perceived improvements in dietary health: Results from a US cross-sectional study. Nutrients 2021, 13, 2097. [Google Scholar] [CrossRef] [PubMed]
- Porter, N. Porter Novelli Styles. ConsumerStyles & YouthStyles. Available online: https://styles.porternovelli.com/consumer-youthstyles/ (accessed on 23 January 2022).
- National Heart Lung and Blood Institute. Clinical guidelines on the identification, evaluation, and treatment of overweight and obesity in adults—The evidence report. Natl. Inst. Health Obes. Res. 1998, 6 (Suppl. 2), 51S–209S. [Google Scholar]
- United States Census Bureau. Census Regions and Divisions of the United States. Available online: http://www2.census.gov/geo/pdfs/maps-data/maps/reference/us_regdiv.pdf (accessed on 23 January 2022).
- Smith, K.R.; Jansen, E.; Thapaliya, G.; Aghababian, A.H.; Chen, L.; Sadler, J.R.; Carnell, S. The influence of COVID-19-related stress on food motivation. Appetite 2021, 163, 105233. [Google Scholar] [CrossRef]
- Shen, W.; Long, L.M.; Shih, C.H.; Ludy, M.J. A humanities-based explanation for the effects of emotional eating and perceived stress on food choice motives during the COVID-19 pandemic. Nutrients 2020, 12, 2712. [Google Scholar] [CrossRef]
- Cecchetto, C.; Aiello, M.; Gentili, C.; Ionta, S.; Osimo, S.A. Increased emotional eating during COVID-19 associated with lockdown, psychological and social distress. Appetite 2021, 160, 105122. [Google Scholar] [CrossRef]
- Figueroa, J.F.; Wadhera, R.K.; Mehtsun, W.T.; Riley, K.; Phelan, J.; Jha, A.K. Association of race, ethnicity, and community-level factors with COVID-19 cases and deaths across U.S. counties. Healthcare 2021, 9, 100495. [Google Scholar] [CrossRef]
- Mackey, K.; Ayers, C.K.; Kondo, K.K.; Saha, S.; Advani, S.M.; Young, S.; Spencer, H.; Rusek, M.; Anderson, J.; Veazie, S.; et al. Racial and Ethnic Disparities in COVID-19-Related Infections, Hospitalizations, and Deaths: A Systematic Review. Ann. Intern. Med. 2021, 174, 362–373. [Google Scholar] [CrossRef]
- Bambra, C.; Riordan, R.; Ford, J.; Matthews, F. The COVID-19 pandemic and health inequalities. J. Epidemiol. Community Health 2020, 74, 964–968. [Google Scholar] [CrossRef]
- Wolfson, J.A.; Leung, C.W. Food insecurity and COVID-19: Disparities in early effects for US adults. Nutrients 2020, 12, 1648. [Google Scholar] [CrossRef]
- Puhl, R.M.; Lessard, L.M.; Larson, N.; Eisenberg, M.E.; Neumark-Stzainer, D. Weight stigma as a predictor of distress and maladaptive eating behaviors during COVID-19: Longitudinal findings from the EAT Study. Ann. Behav. Med. 2020, 54, 738–746. [Google Scholar] [CrossRef] [PubMed]
- Kompaniyets, L.; Goodman, A.B.; Belay, B.; Freedman, D.S.; Sucosky, M.S.; Lange, S.J.; Gundlapalli, A.V.; Boehmer, T.K.; Blanck, H.M. Body mass index and risk for COVID-19-related hospitalization, intensive care unit admission, invasive mechanical ventilation, and death—United States, March-December 2020. MMWR Morb. Mortal. Wkly. Rep. 2021, 70, 355–361. [Google Scholar] [CrossRef] [PubMed]


| Characteristic | All Respondents % a | After the COVID-19 Pandemic, 11 March, 2020, How Often Did You and Your Household Consume More Unhealthy Snacks and Desserts including Chips, Cookies, and Ice Cream | ||||
|---|---|---|---|---|---|---|
| Bivariate Analysis b | Multinomial Analysis c | |||||
| Never/Rarely % a ± SE | Sometimes % a ± SE | Often/Always % a ± SE | Sometimes AOR (95% CI) | Often/Always AOR (95% CI) | ||
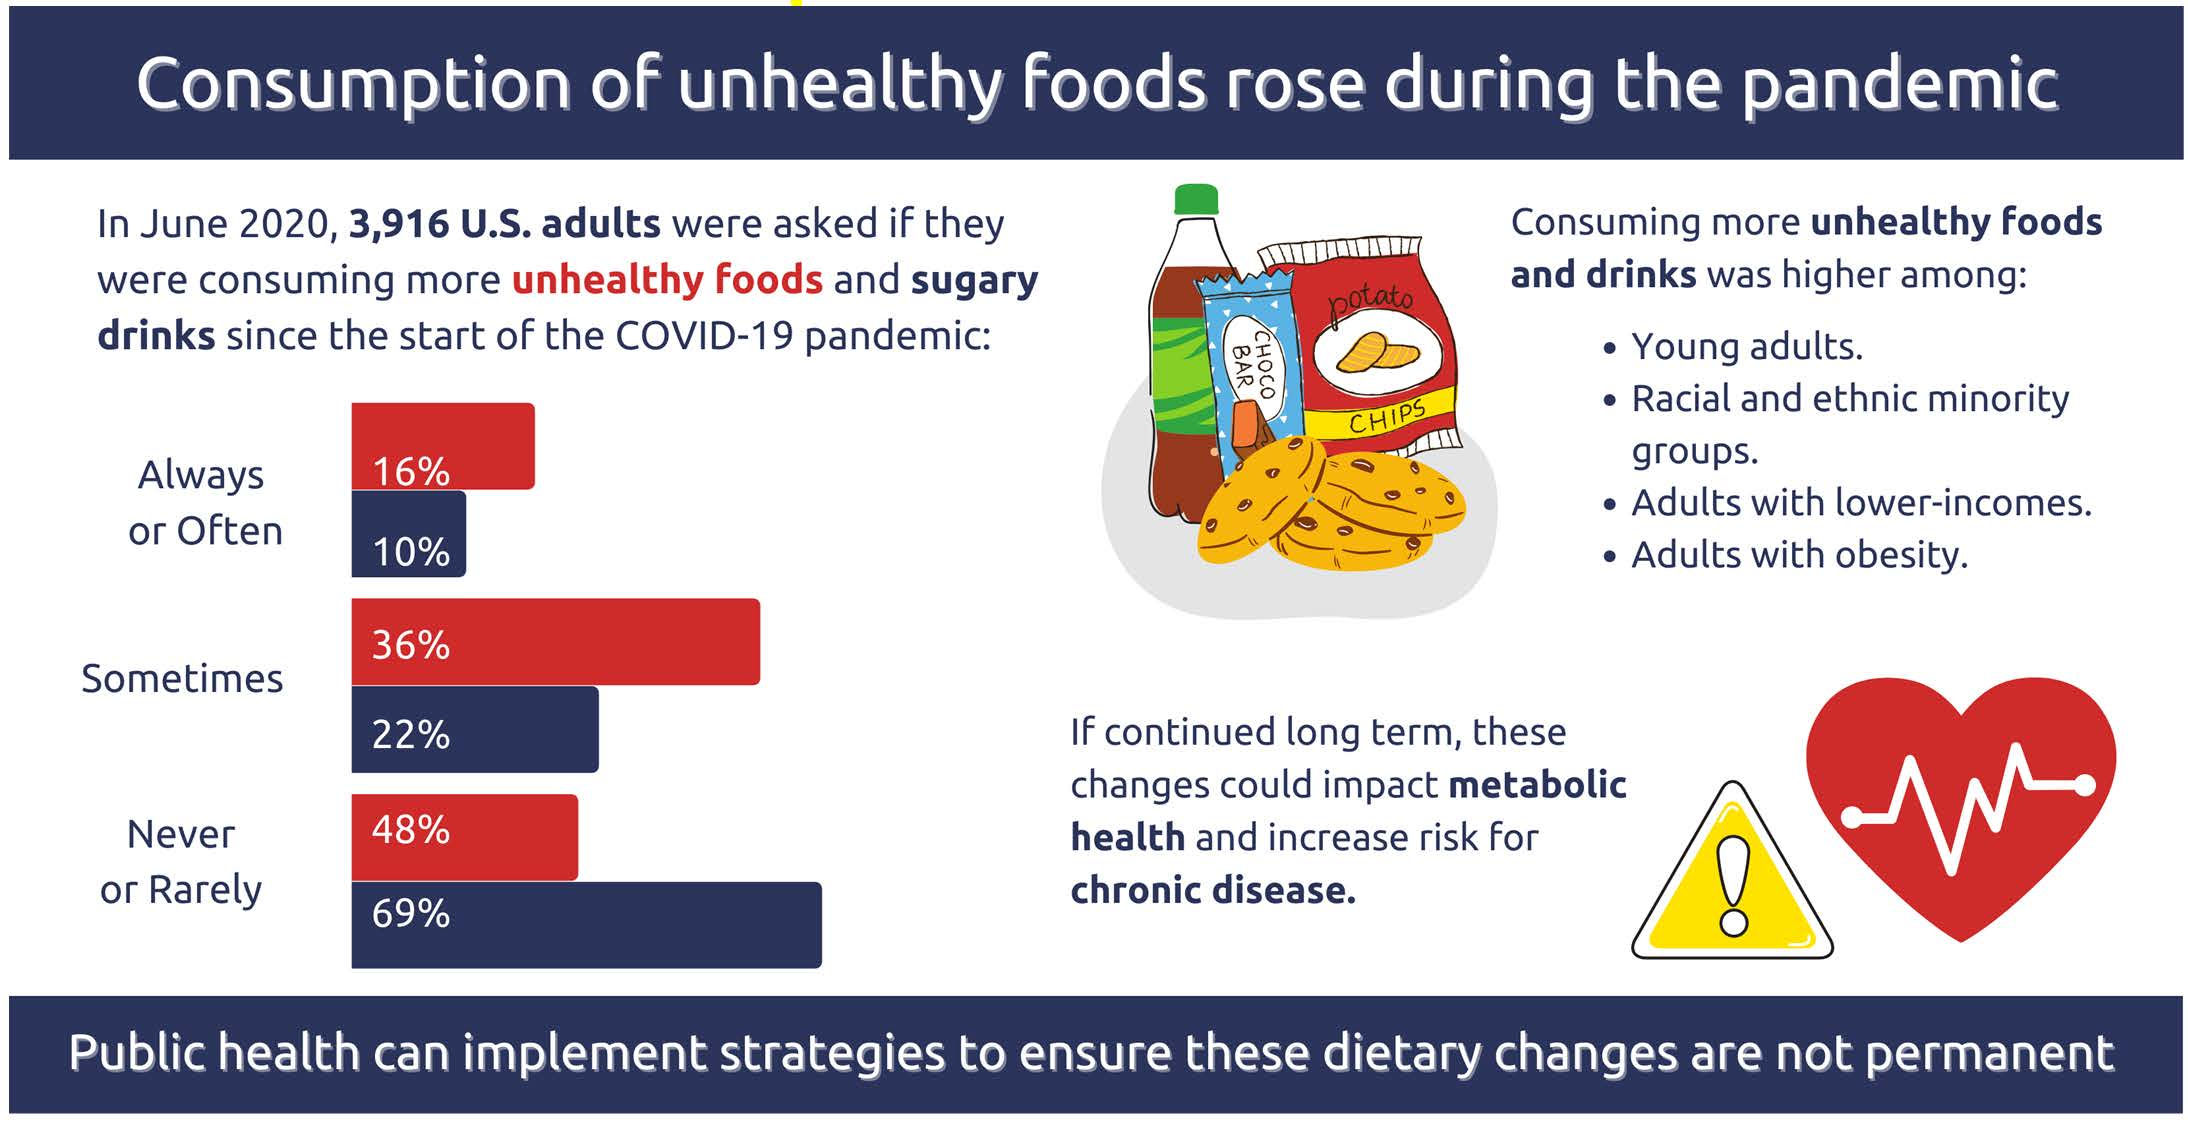
| Total (n = 3916) d | 100 | 48.3 ± 1.0 | 35.7 ± 0.9 | 16.0 ± 0.8 | - | - |
| Age | ||||||
| 18–24 years | 10.6 | 42.8 ± 4.9 | 37.0 ± 4.8 | 20.2 ± 3.9 | 1.43 (0.90, 2.27) | 2.58 (1.41, 4.70) |
| 25–44 years | 34.5 | 43.1 ± 1.6 | 35.2 ± 1.6 | 21.6 ± 1.4 | 1.23 (0.97, 1.58) | 2.86 (2.01, 4.06) |
| 45–64 years | 33.2 | 50.2 ± 1.4 | 36.7 ± 1.4 | 13.1 ± 1.0 | 1.12 (0.91, 1.37) | 1.51 (1.11, 2.05) |
| ≥65 years | 21.7 | 56.4 ± 1.7 | 34.1 ± 1.6 | 9.5 ± 1.0 | Reference | Reference |
| Sex | ||||||
| Male | 48.6 | 52.2 ± 1.4 | 34.4 ± 1.3 | 13.4 ± 1.0 | Reference | Reference |
| Female | 51.4 | 44.6 ± 1.3 | 36.9 ± 1.3 | 18.5 ± 1.1 | 1.25 (1.05, 1.49) | 1.58 (1.23, 2.02) |
| Race/ethnicity | ||||||
| White, non-Hispanic | 64.2 | 51.4 ± 1.1 | 34.4 ± 1.1 | 14.2 ± 0.8 | Reference | Reference |
| Black, non-Hispanic | 11.5 | 40.0 ± 3.1 | 35.3 ± 3.0 | 24.8 ± 3.0 | 1.18 (0.86, 1.62) | 1.89 (1.26, 2.82) |
| Hispanic | 15.8 | 43.1 ± 2.9 | 39.2 ± 2.9 | 17.6 ± 2.2 | 1.32 (1.00, 1.75) | 1.38 (0.96, 1.99) |
| Other, non-Hispanic | 8.5 | 45.9 ± 3.5 | 39.2 ± 3.5 | 15.0 ± 2.6 | 1.50 (1.07, 2.10) | 1.35 (0.84, 2.16) |
| Education level | ||||||
| High school or less | 38.1 | 45.0 ± 1.7 | 36.8 ± 1.7 | 18.2 ± 1.4 | 1.19 (0.94, 1.50) | 1.20 (0.87, 1.65) |
| Some college | 27.9 | 47.0 ± 1.9 | 37.2 ± 1.8 | 15.8 ± 1.5 | 1.21 (0.97, 1.51) | 1.17 (0.86, 1.60) |
| College graduate | 34.1 | 53.1 ± 1.4 | 33.2 ± 1.3 | 13.7 ± 1.0 | Reference | Reference |
| Marital status | ||||||
| Married/domestic partnership | 62.1 | 50.4 ± 1.1 | 35.5 ± 1.1 | 14.0 ± 0.8 | Reference | Reference |
| Not married | 37.9 | 44.9 ± 1.8 | 35.9 ± 1.8 | 19.2 ± 1.5 | 1.04 (0.85, 1.28) | 1.16 (0.86, 1.55) |
| Annual household income | ||||||
| <USD 35,000 | 20.5 | 37.2 ± 2.3 | 39.3 ± 2.4 | 23.5 ± 2.1 | 1.31 (0.97, 1.77) | 2.01 (1.35, 2.99) |
| USD 35,000–USD 74,999 | 26.6 | 49.0 ± 1.9 | 34.9 ± 1.8 | 15.2 ± 1.4 | 0.96 (0.76, 1.21) | 1.09 (0.78, 1.51) |
| USD 75,000–USD 99,999 | 14.0 | 50.6 ± 2.7 | 33.0 ± 2.4 | 16.5 ± 2.2 | 0.89 (0.68, 1.16) | 1.21 (0.82, 1.79) |
| ≥USD 100,000 | 38.9 | 52.3 ± 1.4 | 35.2 ± 1.4 | 12.4 ± 1.0 | Reference | Reference |
| Currently have children aged <18 years (n = 3910) | ||||||
| Yes | 27.5 | 41.5 ± 1.7 | 38.4 ± 1.7 | 20.0 ± 1.5 | 1.32 (1.07, 1.63) | 1.22 (0.90, 1.66) |
| No | 72.5 | 50.9 ± 1.2 | 34.6 ± 1.1 | 14.5 ± 0.9 | Reference | Reference |
| Weight status e (n = 3847) | ||||||
| Underweight/healthy weight | 35.6 | 52.0 ± 1.8 | 32.0 ± 1.6 | 16.1 ± 1.4 | Reference | Reference |
| Overweight | 32.0 | 51.4 ± 1.7 | 35.3 ± 1.6 | 13.3 ± 1.2 | 1.21 (0.97, 1.50) | 0.97 (0.71, 1.32) |
| Obesity | 32.4 | 41.2 ± 1.6 | 40.0 ± 1.6 | 18.7 ± 1.3 | 1.64 (1.32, 2.04) | 1.56 (1.17, 2.09) |
| Census regions of residence | ||||||
| Northeast | 17.8 | 46.1 ± 2.3 | 36.9 ± 2.2 | 16.9 ± 1.9 | 1.10 (0.86, 1.41) | 1.26 (0.89, 1.79) |
| Midwest | 20.9 | 47.7 ± 2.1 | 34.2 ± 1.9 | 18.1 ± 1.7 | 0.90 (0.71, 1.15) | 1.10 (0.80, 1.52) |
| South | 37.7 | 47.3 ± 1.6 | 36.7 ± 1.6 | 16.0 ± 1.2 | Reference | Reference |
| West | 23.6 | 52.2 ± 2.0 | 34.3 ± 1.9 | 13.5 ± 1.4 | 0.83 (0.66, 1.05) | 0.81 (0.58, 1.13) |
| Characteristic | After the COVID-19 Pandemic, 11 March, 2020, How Often Did You and Your Household Drink More SSBs like Regular Soda, Fruit Drinks, Sports or Energy Drinks, Sweetened Coffee/Teas Drinks | ||||
|---|---|---|---|---|---|
| Bivariate Analysis a | Multinomial Analysis b | ||||
| Never/Rarely % c ± SE | Sometimes % c ± SE | Often/Always % c ± SE | Sometimes AOR (95% CI) | Often/Always AOR (95% CI) | |
| Total (n = 3916) d | 68.8 ± 1.0 | 21.6 ± 0.9 | 9.6 ± 0.6 | - | - |
| Age | |||||
| 18–24 years | 58.6 ± 4.9 | 30.8 ± 4.6 | 10.6 ± 3.1 | 2.10 (1.26, 3.49) | 3.00 (1.34, 6.71) |
| 25–44 years | 62.8 ± 1.6 | 23.4 ± 1.4 | 13.8 ± 1.2 | 1.56 (1.15, 2.10) | 4.39 (2.69, 7.19) |
| 45–64 years | 72.3 ± 1.3 | 19.1 ± 1.2 | 8.5 ± 0.9 | 1.09 (0.84, 1.41) | 2.26 (1.45, 3.51) |
| ≥ 65 years | 78.0 ± 1.6 | 18.0 ± 1.5 | 4.0 ± 0.7 | Reference | Reference |
| Sex | |||||
| Male | 70.5 ± 1.3 | 20.8 ± 1.2 | 8.7 ± 0.8 | Reference | Reference |
| Female | 67.2 ± 1.4 | 22.3 ± 1.2 | 10.4 ± 0.9 | 1.12 (0.90, 1.38) | 1.18 (0.87, 1.60) |
| Race/ethnicity | |||||
| White, non-Hispanic | 74.8 ± 1.0 | 18.1 ± 0.9 | 7.1 ± 0.6 | Reference | Reference |
| Black, non-Hispanic | 52.1 ± 3.2 | 28.3 ± 2.8 | 19.6 ± 2.8 | 2.06 (1.49, 2.85) | 3.25 (2.02, 5.22) |
| Hispanic | 57.1 ± 2.9 | 31.3 ± 2.8 | 11.7 ± 1.9 | 1.83 (1.35, 2.49) | 1.75 (1.14, 2.67) |
| Other, non-Hispanic | 67.9 ± 3.3 | 20.8 ± 2.9 | 11.2 ± 2.3 | 1.53 (1.03, 2.27) | 2.41 (1.42, 4.11) |
| Education level | |||||
| High school or less | 59.6 ± 1.8 | 27.9 ± 1.7 | 12.4 ± 1.2 | 1.89 (1.44, 2.48) | 2.03 (1.32, 3.12) |
| Some college | 68.4 ± 1.8 | 21.1 ± 1.6 | 10.4 ± 1.3 | 1.40 (1.06, 1.84) | 1.80 (1.22, 2.67) |
| College graduate | 79.4 ± 1.2 | 14.9 ± 1.0 | 5.8 ± 0.7 | Reference | Reference |
| Marital status | |||||
| Married/domestic partnership | 72.8 ± 1.0 | 19.2 ± 0.9 | 8.0 ± 0.7 | Reference | Reference |
| Not married | 62.3 ± 1.8 | 25.5 ± 1.7 | 12.2 ± 1.2 | 1.11 (0.87, 1.41) | 1.12 (0.77, 1.62) |
| Annual household income | |||||
| <USD 35,000 | 51.9 ± 2.5 | 31.4 ± 2.4 | 16.7 ± 1.9 | 1.84 (1.31, 2.59) | 3.15 (1.93, 5.14) |
| USD 35,000–USD 74,999 | 68.2 ± 1.8 | 20.9 ± 1.5 | 10.3 ± 1.2 | 1.08 (0.81, 1.45) | 1.64 (1.07, 2.51) |
| USD 75,000–USD 99,999 | 66.8 ± 2.7 | 22.8 ± 2.4 | 10.4 ± 1.9 | 1.30 (0.93, 1.81) | 2.02 (1.25, 3.25) |
| ≥USD 100,000 | 78.4 ± 1.3 | 16.5 ± 1.2 | 5.1 ± 0.7 | Reference | Reference |
| Currently have children aged <18 years (n = 3910) | |||||
| Yes | 62.8 ± 1.7 | 24.4 ± 1.5 | 12.8 ± 1.3 | 1.33 (1.03, 1.72) | 1.21 (0.82, 1.78) |
| No | 71.0 ± 1.4 | 20.6 ± 1.0 | 8.4 ± 0.7 | Reference | Reference |
| Weight status e (n = 3847) | |||||
| Underweight/healthy weight | 72.5 ± 1.7 | 18.5 ± 1.5 | 9.0 ± 1.1 | Reference | Reference |
| Overweight | 71.6 ± 1.7 | 21.6 ± 1.5 | 6.9 ± 1.0 | 1.30 (0.99, 1.71) | 0.85 (0.56, 1.27) |
| Obesity | 61.8 ± 1.7 | 25.4 ± 1.5 | 12.8 ± 1.2 | 1.64 (1.26, 2.15) | 1.61 (1.11, 2.35) |
| Census regions of residence | |||||
| Northeast | 73.1 ± 2.2 | 18.5 ± 1.9 | 8.4 ± 1.4 | 0.86 (0.62, 1.18) | 0.95 (0.60, 1.50) |
| Midwest | 69.3 ± 2.0 | 19.1 ± 1.6 | 11.7 ± 1.6 | 0.86 (0.64, 1.15) | 1.13 (0.76, 1.69) |
| South | 66.7 ± 1.6 | 23.0 ± 1.5 | 10.3 ± 1.0 | Reference | Reference |
| West | 68.6 ± 2.0 | 23.9 ± 1.8 | 7.5 ± 1.1 | 1.06 (0.80, 1.40) | 0.76 (0.51, 1.15) |
Publisher’s Note: MDPI stays neutral with regard to jurisdictional claims in published maps and institutional affiliations. |
© 2022 by the authors. Licensee MDPI, Basel, Switzerland. This article is an open access article distributed under the terms and conditions of the Creative Commons Attribution (CC BY) license (https://creativecommons.org/licenses/by/4.0/).
Share and Cite
Park, S.; Lee, S.H.; Yaroch, A.L.; Blanck, H.M. Reported Changes in Eating Habits Related to Less Healthy Foods and Beverages during the COVID-19 Pandemic among US Adults. Nutrients 2022, 14, 526. https://0-doi-org.brum.beds.ac.uk/10.3390/nu14030526
Park S, Lee SH, Yaroch AL, Blanck HM. Reported Changes in Eating Habits Related to Less Healthy Foods and Beverages during the COVID-19 Pandemic among US Adults. Nutrients. 2022; 14(3):526. https://0-doi-org.brum.beds.ac.uk/10.3390/nu14030526
Chicago/Turabian StylePark, Sohyun, Seung Hee Lee, Amy L. Yaroch, and Heidi M. Blanck. 2022. "Reported Changes in Eating Habits Related to Less Healthy Foods and Beverages during the COVID-19 Pandemic among US Adults" Nutrients 14, no. 3: 526. https://0-doi-org.brum.beds.ac.uk/10.3390/nu14030526