Amino Acid Profiles in Term and Preterm Human Milk through Lactation: A Systematic Review


Abstract
:1. Introduction
2. Experimental Section
2.1. Data Origin
2.2. Inclusion Criteria
2.3. Data Analysis and Standard Unit Conversion
3. Results
3.1. The Dataset

| Reference | Region | Country | Term |
|---|---|---|---|
| Atkinson 1980 [18] | NA | Canada | Preterm and Term |
| Bellomonte 1990 [19] | EU | Italy | Not Specified |
| Britton 1986 [15] | NA | USA | Preterm and Term |
| Chavalittamrong 1981 [20] | AP | Thailand | Not Specified |
| Cheung, Pratt, and Fowler 1953 [21] | NA | Puerto Rico | Not Specified |
| Darling 1997 and 1999 [22,23] | NA | Canada | Preterm |
| Darragh 1998 [24] | AP | New Zealand | Term |
| Davis 1994 [25] | NA | USA | Not Specified |
| Donovan 1989 [26] | NA | USA | Term |
| Feng 2009 [27] | EU, AP, NA, SA | 9 Countries | Not Specified |
| Hanning 1992 [28] | NA | Canada | Term |
| Harzer 1985 [29] | EU | Germany | Term |
| Janas 1986 [30] | NA | USA | Term |
| Janas 1987 [31] | NA | USA | Term |
| Lauber 1979 [32] | AF | Ivory Coast | Not Specified |
| London Department of Health [33] | EU | England | Term |
| Lönnerdal 1976 [34] | EU | Sweden | Not Specified |
| Lönnerdal 1985 [35] | EU | Sweden | Not Specified |
| Sarwar 1996 [36] | NA | Canada | Preterm and Term |
| Shaikhiev 1978 [37] | AP | Russia | Not Specified |
| Svanberg 1977 [6] | AF | Ethiopia and Sweden | Not Specified |
| Villapando 1998 [38] | NA | USA and Mexico | Term |
| Wu 2000 [39] | AP | Taiwan | Term |
| Yamawaki 2005 [40] | AP | Japan | Term |
| Yonekubo 1989 [41] | AP | Japan | Not Specified |
| Zhao 1989 [42] | AP | China | Term |
| Reference | Region | Country | Term |
|---|---|---|---|
| Agostoni 2000 [3] | EU | Italy | Term |
| Agostoni 2000 [7] | EU | Italy | Term |
| Armstrong 1963 [43] | NA | USA | Not Specified |
| Atkinson 1980 [18,44] | NA | Canada | Preterm and Term |
| Carratù 2003 [5] | EU | Italy | Term |
| Chuang 2005 [8] | AP | Taiwan | Preterm and Term |
| Darling 1997 and 1999 [22,23] | NA | Canada | Preterm |
| DeSantiago 1998 [45] | NA | Mexico | Not Specified |
| Donovan 1989 [26] | NA | USA | Not Specified |
| Elmastas 2008 [9] | AP | Turkey | Term |
| Gutikova 2001 [46] | AP | Russia | Not Specified |
| Harzer 1984 [47] | EU | Germany | Term |
| Lemons 1983 [2] | NA | USA | Preterm and Term |
| López-Sánchez Solís 1988 [48] | EU | Spain | Not Specified |
| Motil 1995 [49] | NA | USA | Term |
| Pamblanco 1989 [11] | EU | Spain | Preterm and Term |
| Rassin 1977 [50] | EU and NA | Finland and USA | Not Specified |
| Singh 2004 [51] | AP | India | Term |
| Viña 1987 [52] | EU | Spain | Not Specified |
| Wu 2000 [39] | AP | Taiwan | Term |
| Wurtman 1979 [53] | NA | USA and Guatemala | Not Specified |
| Yonekubo 1989 [41] | AP | Japan | Not Specified |
| Study | Reason for Exclusion |
|---|---|
| Total Amino Acids | |
| Beach 1941 [54] | Microbiological determination |
| Block 1946 [55] | Microbiological determination |
| Davis 1993 [56] | Mean from many studies; Duplicate representation |
| Davis 1994 [57] | No total nitrogen or total protein reported |
| DeSantiago 1999 [58] | Marginally nourished lactating women |
| Flippova 1974 [59] | No method for amino acid quantification |
| Guo 2007 [60] | Single milk donor |
| Heine 1991 [61] | Same data as Renner 1983 |
| Järvenpää 1982 [62] | Same data as Rassin 1976 |
| Lemons 1983 [2] | Only protein-bound amino acid profiles excluded |
| Macy 1949 [63] | Microbiological determination |
| Macy 1961 [64] | Microbiological determination |
| Miller 1950 [65] | Microbiological determination |
| Mitton 1992 [66] | Source of amino acid values not given |
| Motil 1995 [49] | Only protein-bound amino acid profiles excluded |
| Nagasawa 1970 [67] | Casein amino acid profile |
| Nayman 1979 [68] | Mean from many studies; duplicate representation; microbiological determination |
| Picone 1989 [69] | No information given on milk sampling, number of samples, or method of amino acid quantification |
| Räihä 2002 [70] | Same data as Nayman 1979 |
| Rassin 1977 [50] | Lactation stage unclear |
| Renner 1983 [71] | Duplicate representation |
| Rigo 1994 [72] | Same data as Harzer 1985 |
| Saito 1975 [73] | Microbiological determination; lactation stage unclear |
| Scott 1990 [74] | No information given on milk sampling or method of amino acid quantification |
| Soupart 1954 [75] | Lactation stage unclear |
| Tikanoja 1982 [76] | Lactation stage unclear |
| Volz 1983 [77] | Same as Agricultural Handbook 1976 |
| Williamson 1944 [78] | Lactation stage unclear |
| Woodward 1976 [79] | Casein amino acid profile |
| Free Amino Acids | |
| Farriauz 1971 [80] | Single milk donor |
| Faus 1984 [81] | Data presented only in chart form |
| Ghadimi 1963 [82] | Values unconvertible |
| Nayman 1979 [68] | References by microbiological determination, duplicated representation |
| Pajarón 1992 [83] | Values represent mean of all stages of lactation |
| Periago 1994 [84] | Values represent mean of all stages of lactation |
3.2. Effect of Lactation Stage
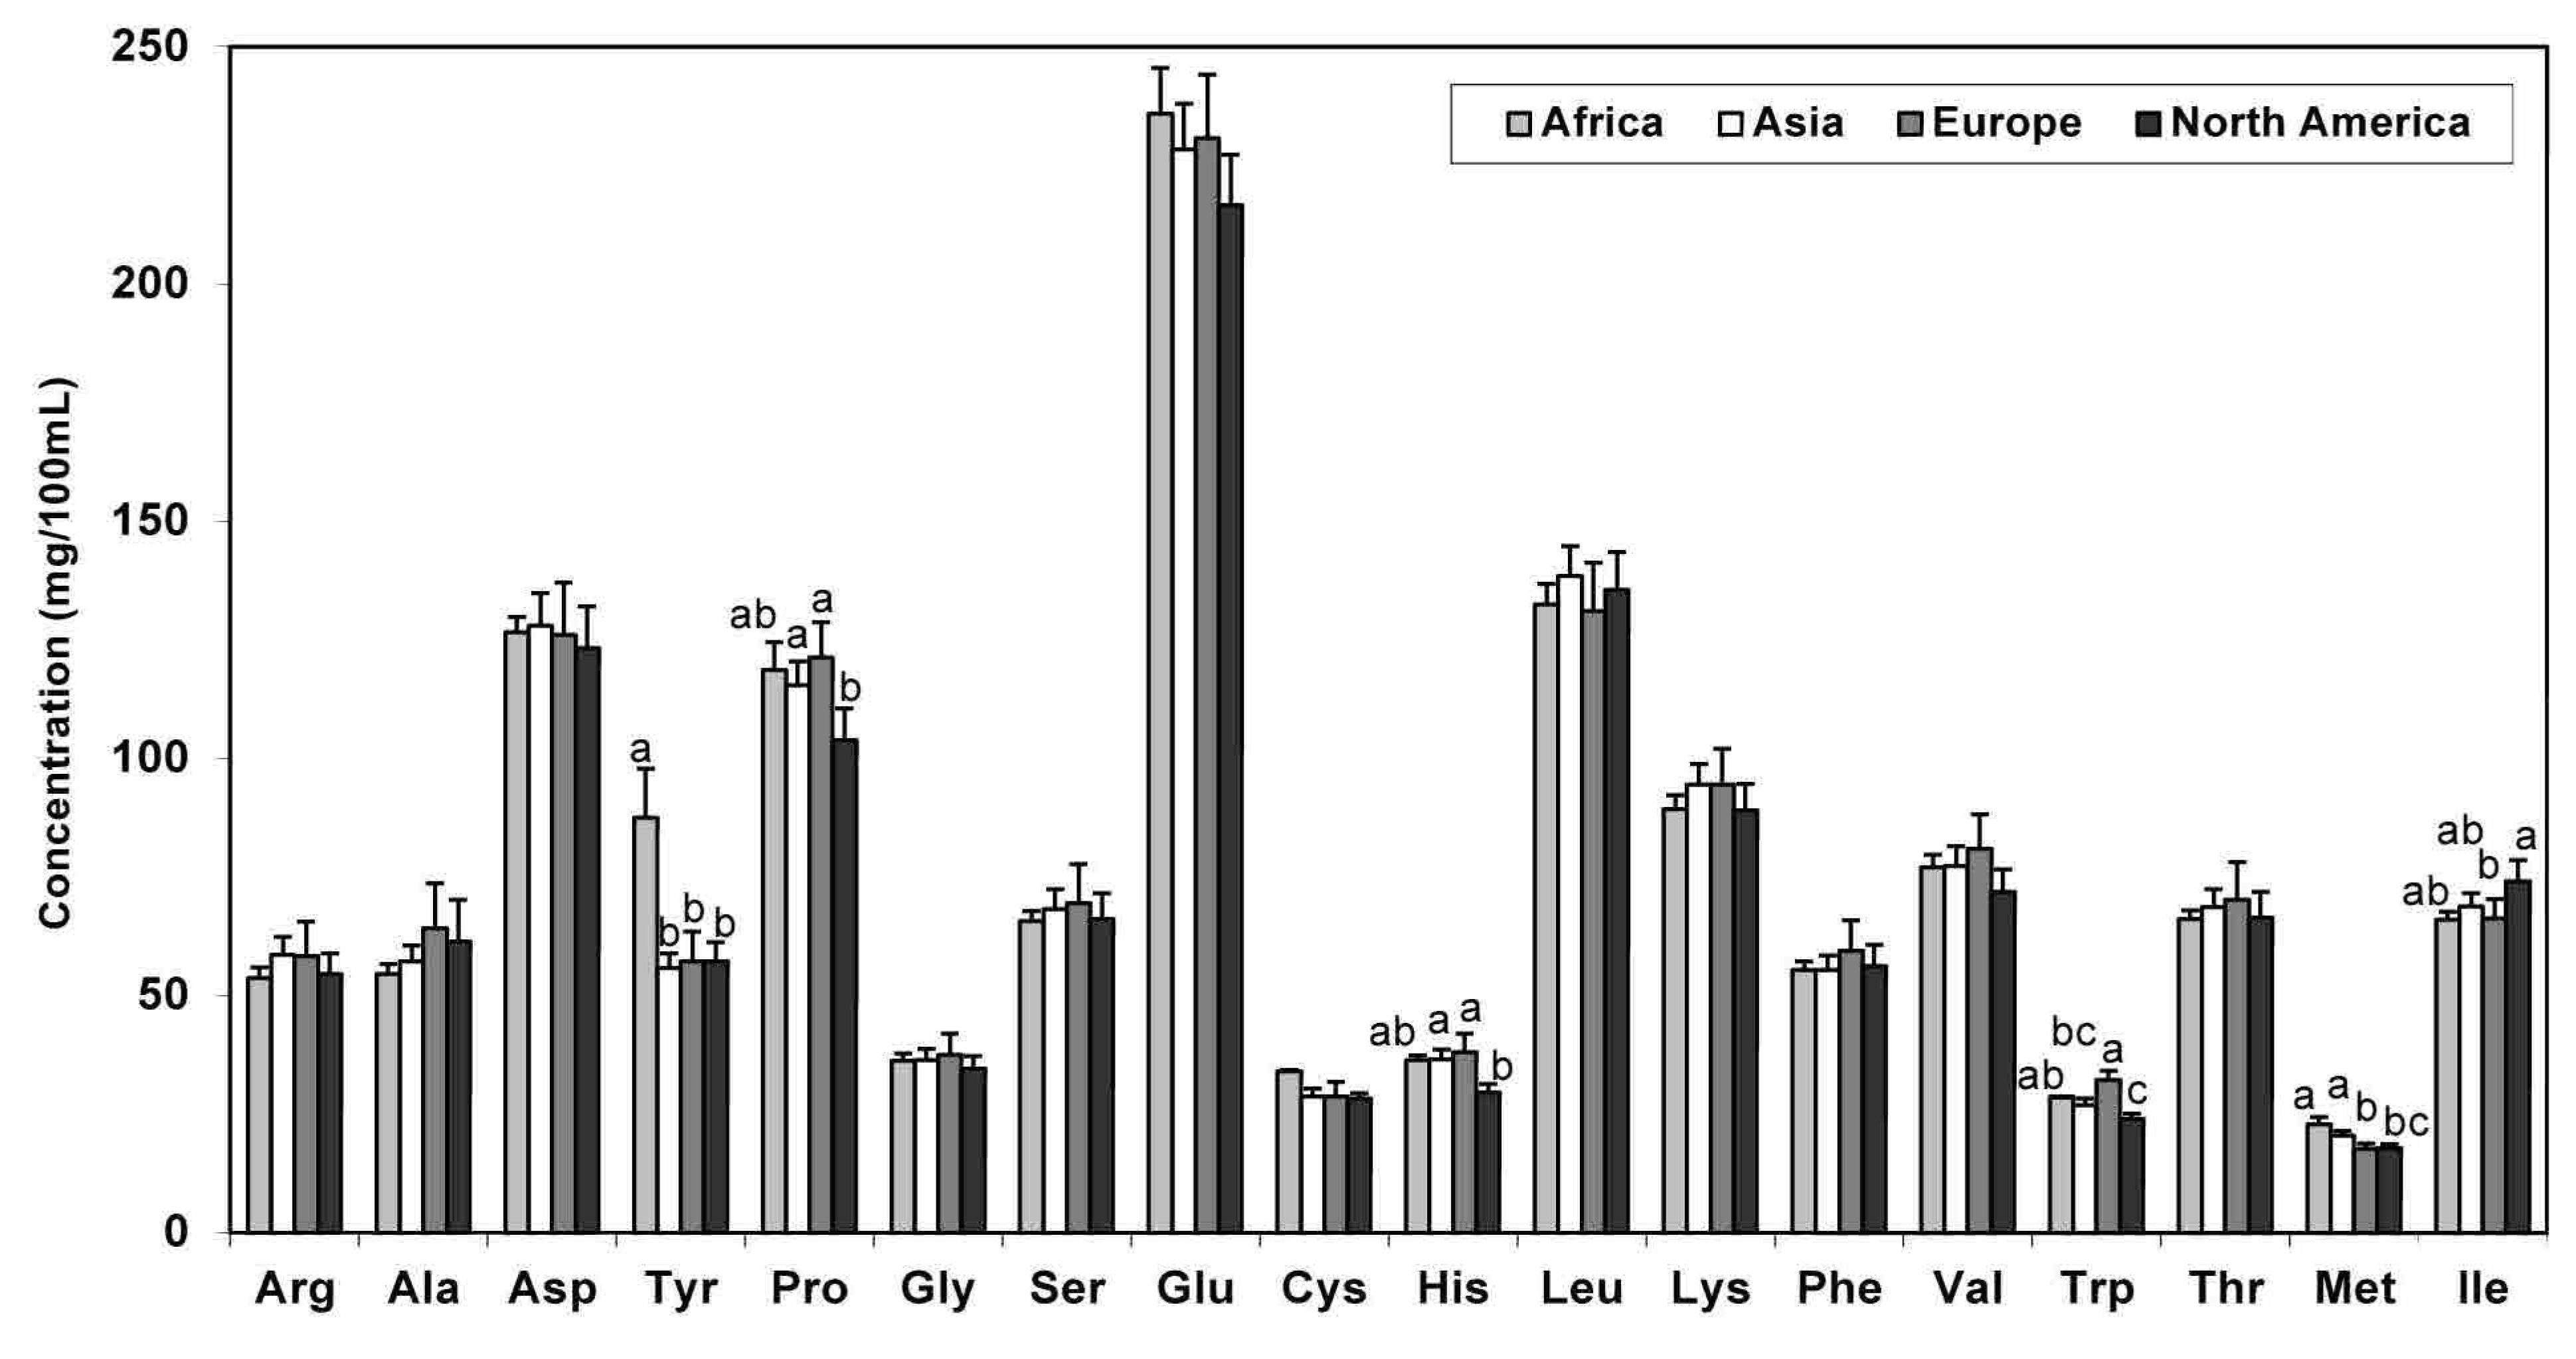
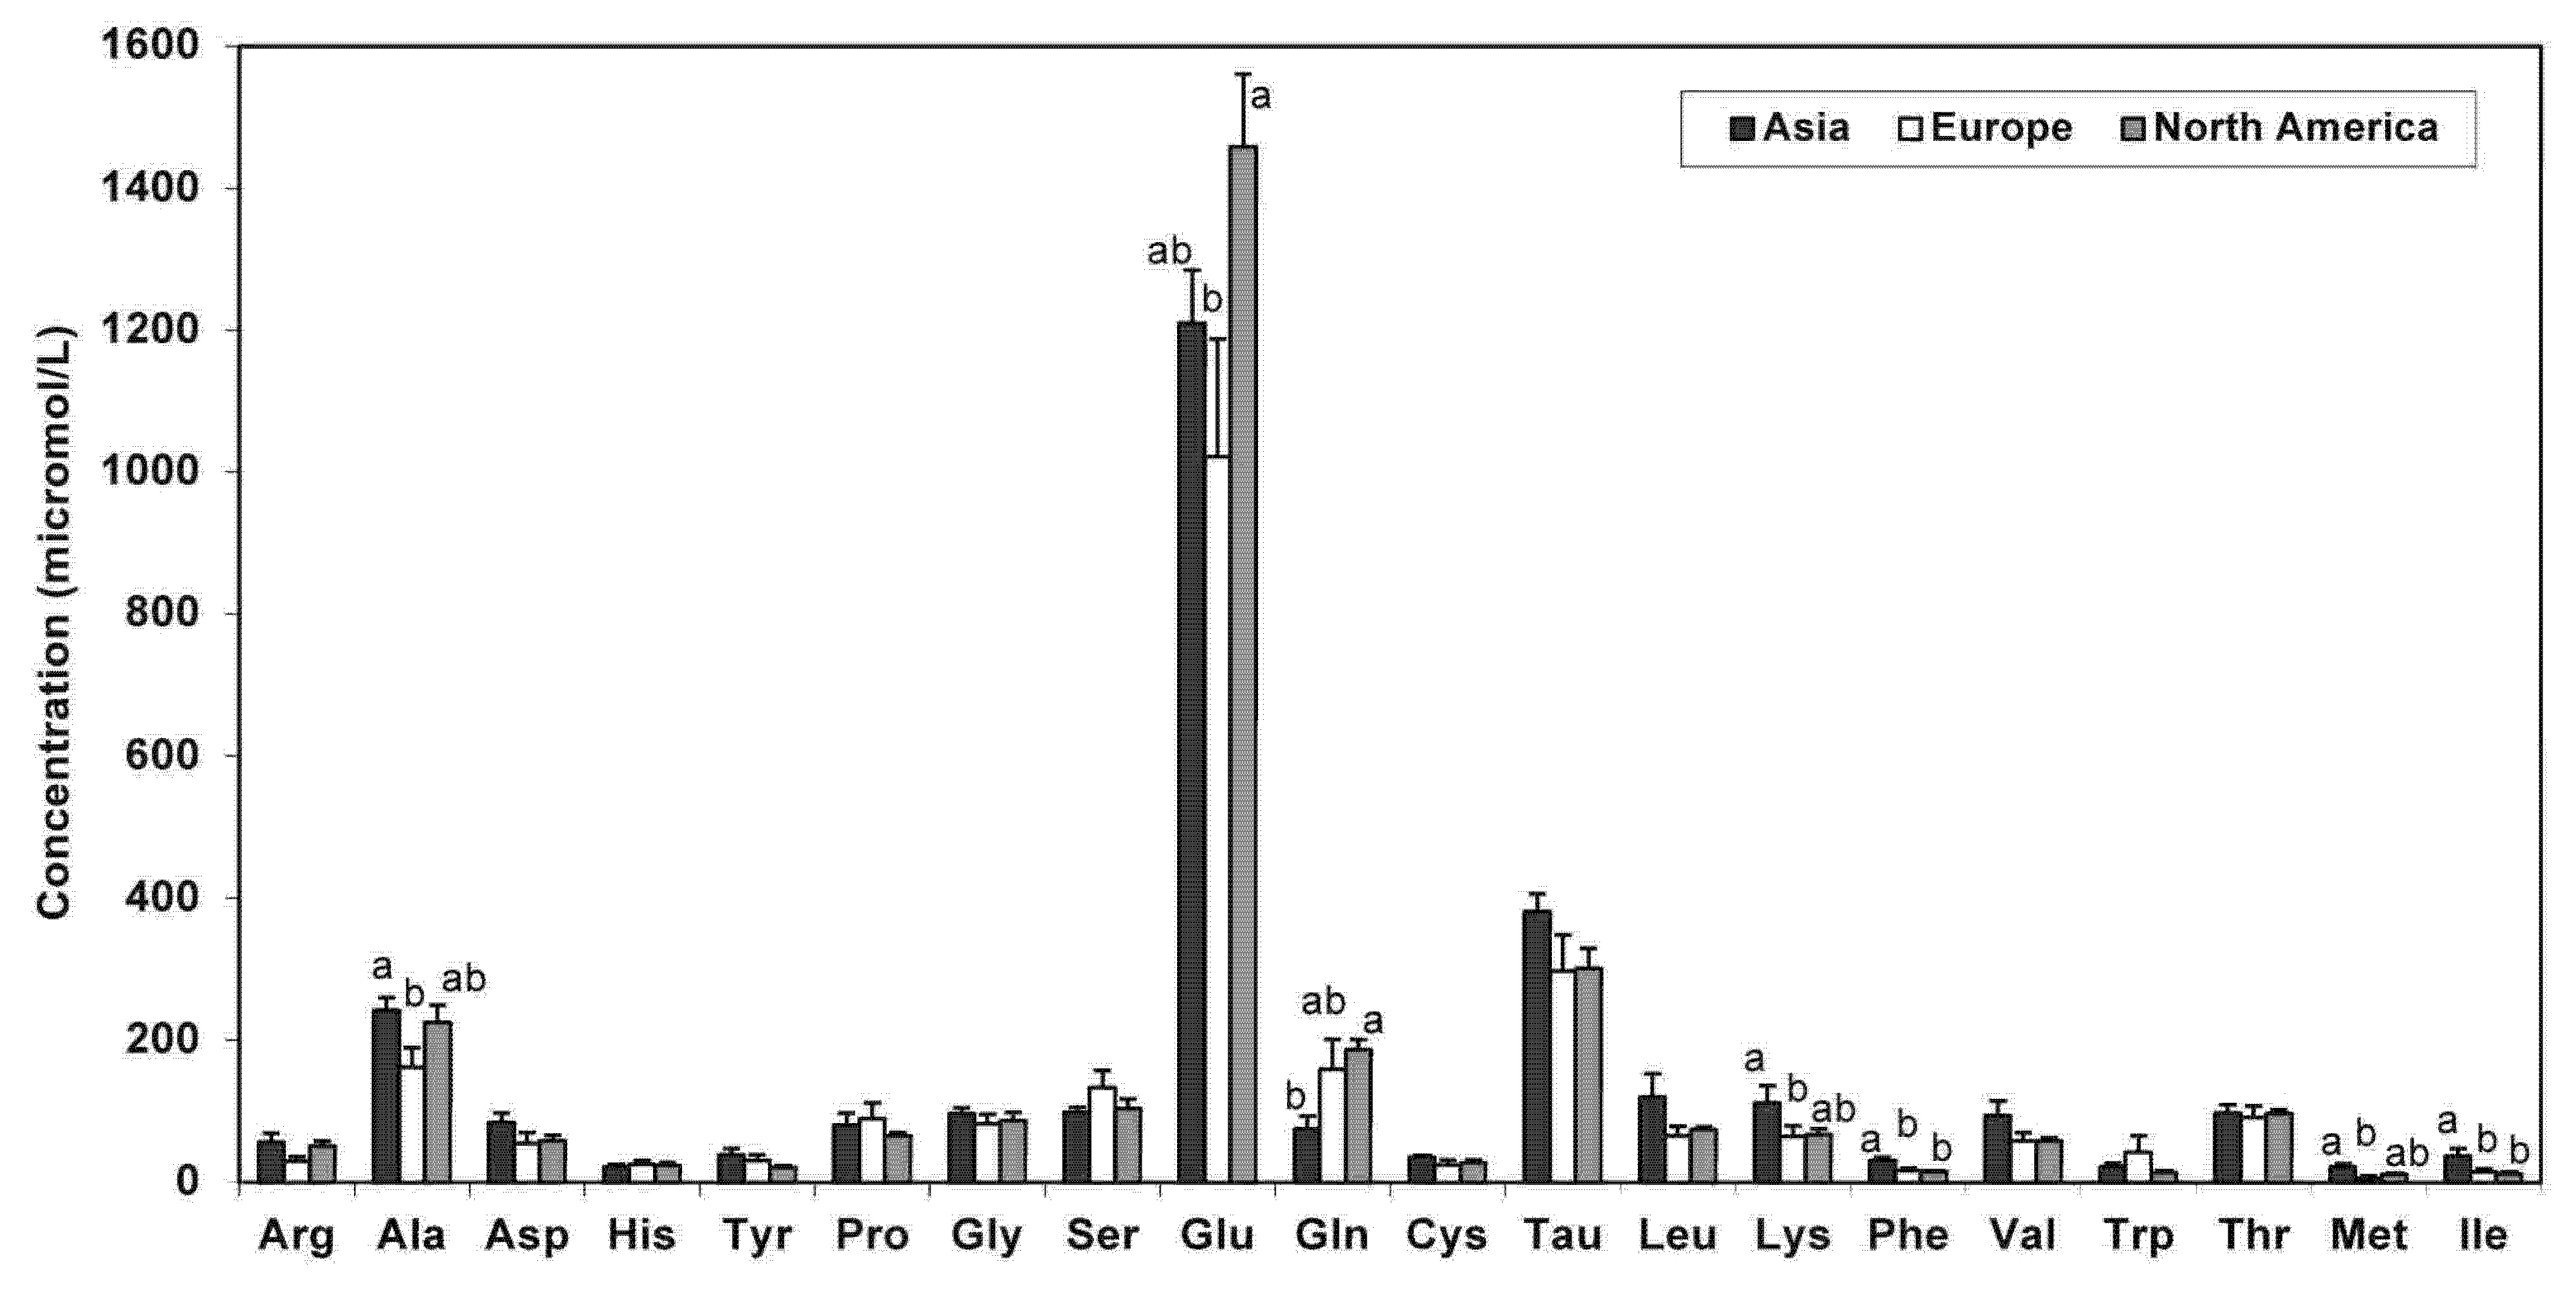
3.3. Geographical Distribution
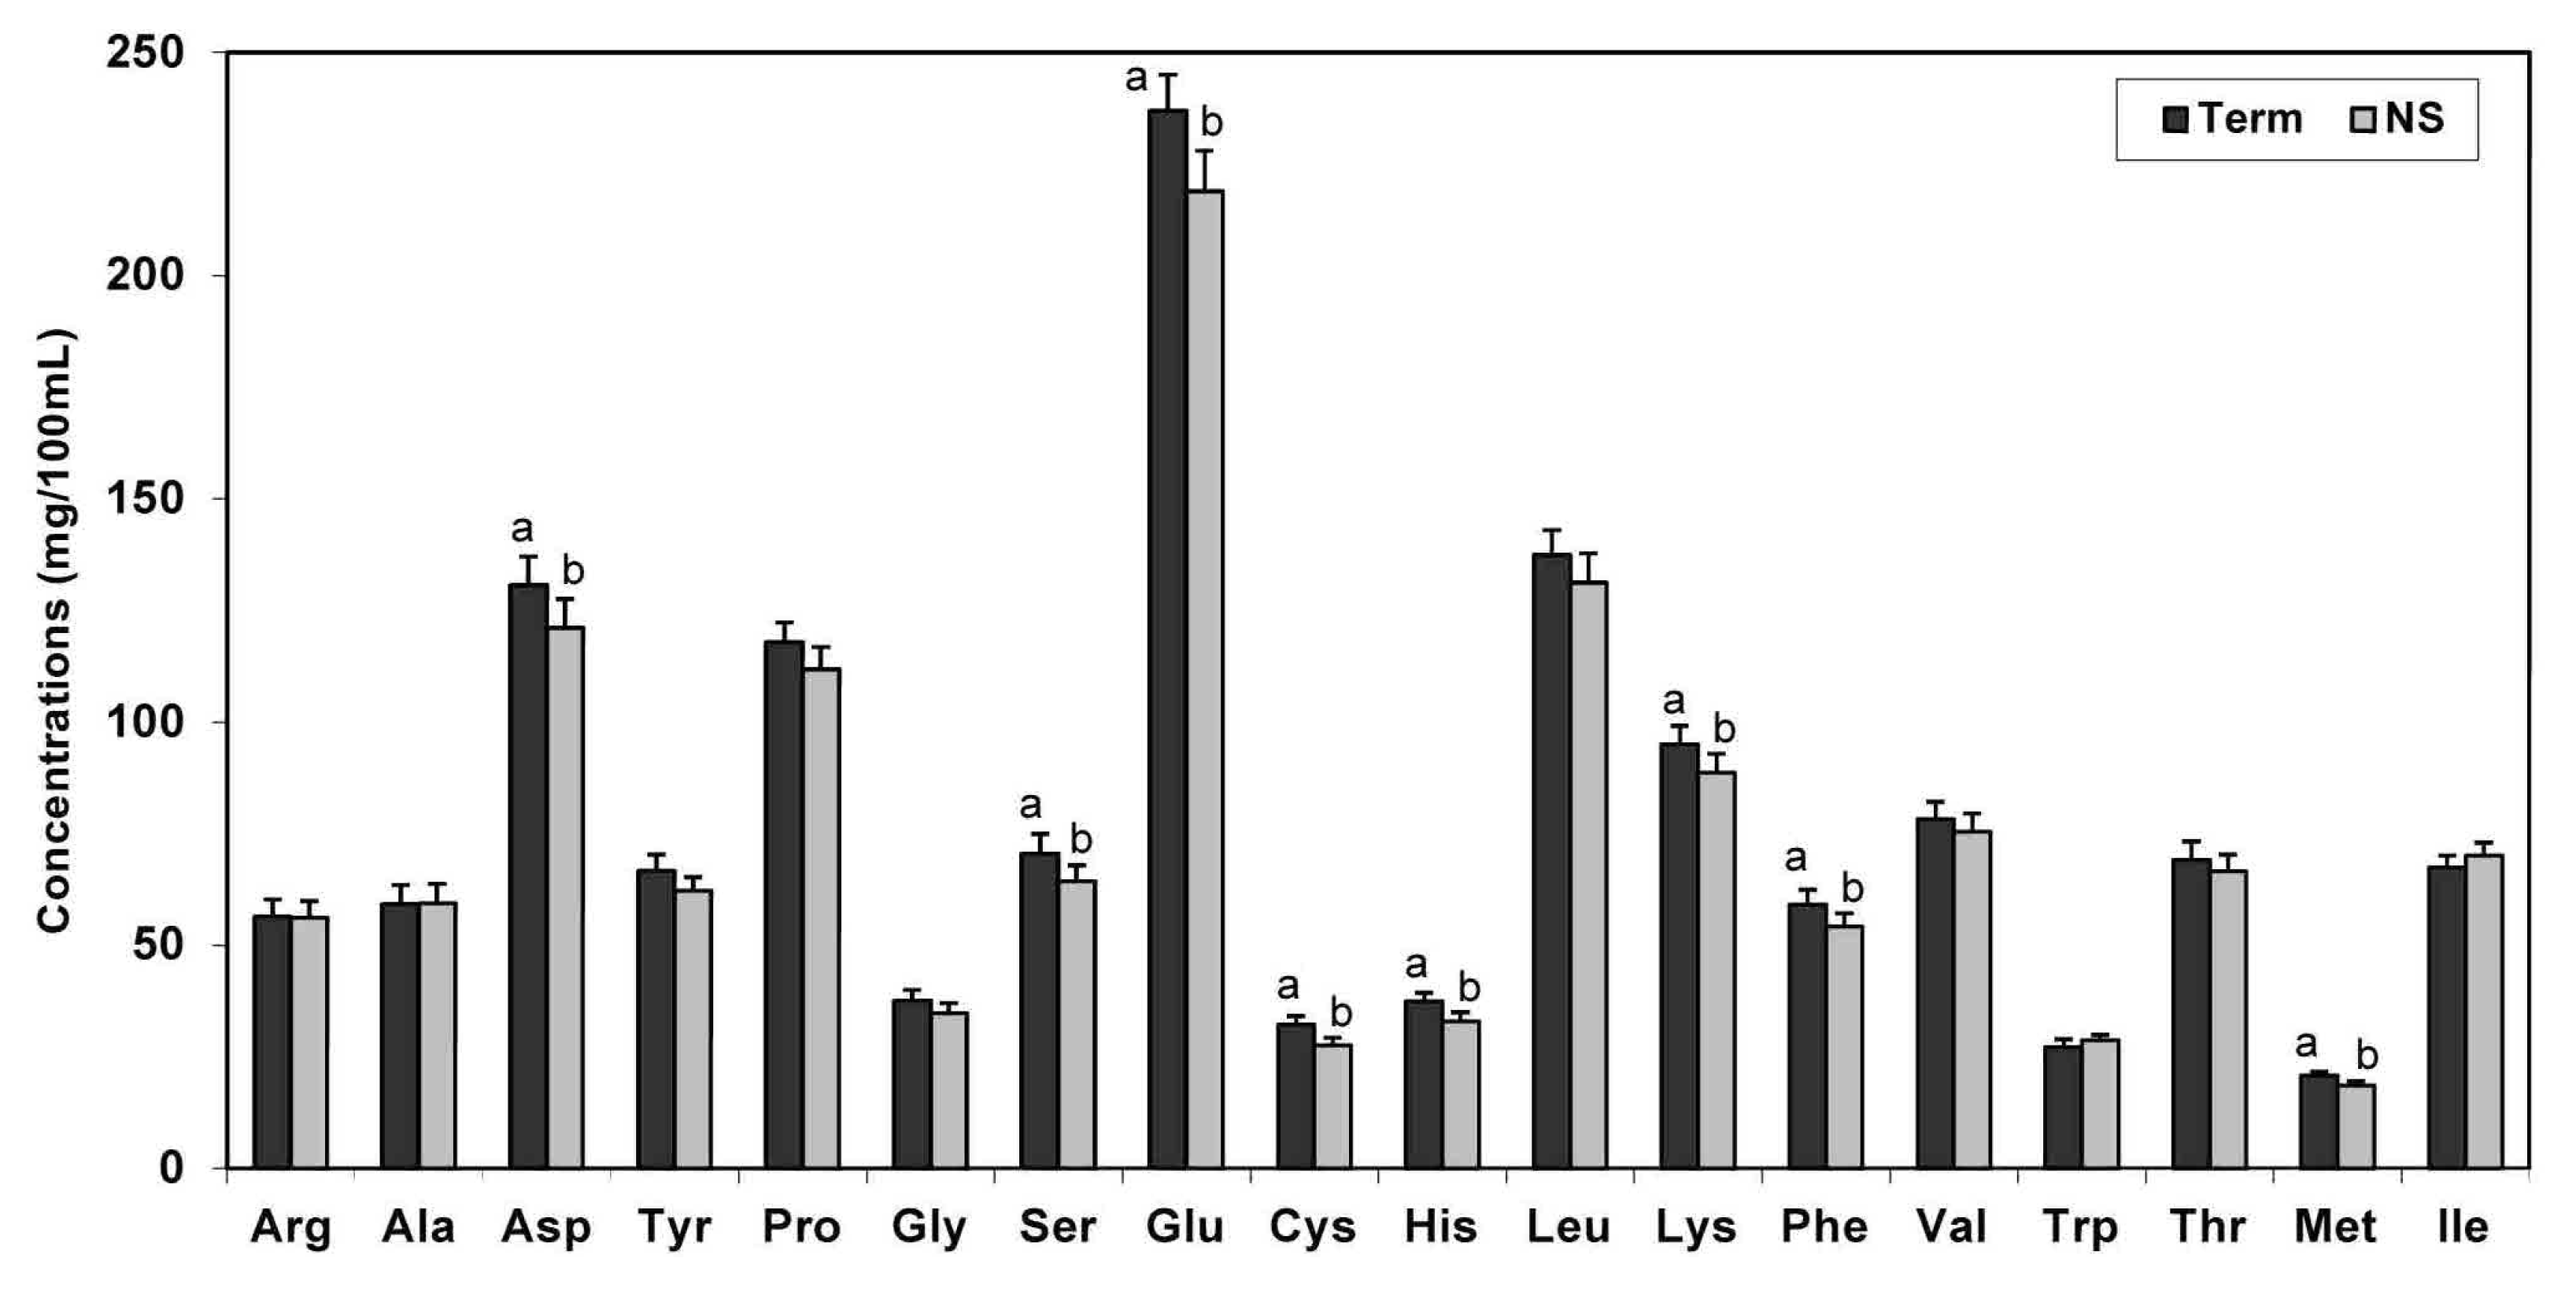
3.4. Effect of Gestational Age
| AA | Lactation Stage | ||||
|---|---|---|---|---|---|
| Colo | Trans | MT 2 mo | MT4mo | MT18mo | |
| IAA | |||||
| His | 57.0 a | 38.7 b | 29.1 c | 26.5 c | 24.6 c |
| Leu | 206.2 a | 147.2 b | 118.8 c | 104.6 d | 94.5 d |
| Lys | 141.8 a | 99.6 b | 82.2 c | 68.9 d | 66.8 d |
| Phe | 95.3 a | 59.2 b | 46.0 c | 39.0 d | 43.9 cd |
| Val | 125.3 a | 79.1 b | 67.0 c | 58.0 d | 54.8 d |
| Trp | 43.3 a | 30.7 b | 24.3 c | 20.1 d | 21.4 cd |
| Thr | 119.3 a | 72.3 b | 54.9 c | 47.2 d | 45.6 d |
| Met | 28.7 a | 21.3 b | 17.8 c | 16.6 cd | 14.3 d |
| Ile | 93.5 a | 79.5 b | 64.7 c | 54.8 d | 51.6 d |
| DAA | |||||
| Arg | 102.9 a | 62.0 b | 44.5 c | 37.4 d | 35.0 d |
| Ala | 110.7 a | 59.3 b | 48.1 c | 39.2 c | 39.5 d |
| Asp | 207.3 a | 138.6 b | 107.2 c | 90.9 d | 85.3 e |
| Tyr | 100.3 a | 69.5 b | 52.8 c | 50.2 c | 49.3 c |
| Pro | 165.3 a | 125 b | 100.3 c | 94.9 c | 88.3 c |
| Gly | 66.2 a | 38.1 b | 28.9 c | 24.3 d | 23.5 d |
| Ser | 119 a | 74.1 b | 52.7 c | 47.2 cd | 44.1 d |
| Glu | 332.7 a | 241.9 b | 201.3 c | 189.2 cd | 174.4 d |
| Cys | 50.2 a | 31.0 b | 23.5 c | 23.9 c | 21.2 c |
| TN | 3.5 a | 2.6 b | 2.1 c | 1.9 d | 1.7 d |
| AA | Lactation Stage | |||||||
|---|---|---|---|---|---|---|---|---|
| Colo | Trans | MT2mo | MT ≥ 2 mo | |||||
| IAA | ||||||||
| His | 31.7 | 27.1 | 21.5 | 20.9 | ||||
| Leu | 204.7 a | 67.0 b | 54.9 b | 59.4 b | ||||
| Lys | 187.3 a | 87.8 b | 58.1 b | 43.0 b | ||||
| Phe | 42.2 a | 19.3 b | 15.9 b | 16.4 b | ||||
| Val | 160.1 a | 69.2 b | 57.4 b | 46.3 b | ||||
| Thr | 143.1 a | 81.6 b | 79.1 b | 92.9 b | ||||
| Met | 34.1 a | 18.3 b | 10.1 bc | 4.0 c | ||||
| Ile | 55.1 a | 31.6 ab | 14.2 b | 8.6 b | ||||
| Tau | 452.8 a | 386.1 ab | 287.1 bc | 237.9 c | ||||
| DAA | ||||||||
| Arg | 94.3 a | 35.6 b | 30.2 b | 31.5 b | ||||
| Ala | 218.5 | 189.4 | 199.9 | 224.5 | ||||
| Asp | 114.3 a | 60.7 b | 55.3 b | 58.4 b | ||||
| Tyr | 72.4 a | 25.8 b | 22.3 b | 22.1 b | ||||
| Pro | 172.0 a | 70.5 b | 49.1 b | 61.7 b | ||||
| Gly | 84.6 | 81.4 | 84.0 | 101.4 | ||||
| Ser | 122.5 | 80.9 | 99.8 | 128.9 | ||||
| Glu | 1089.9 b | 960.1 b | 1175.0 ab | 1529.0 a | ||||
| Gln | 13.5 c | 92.6 bc | 134.6 ab | 225.8 a | ||||
| Cys | 27.5 | 30.5 | 32.2 | 28.3 | ||||


3.5. Comparison to Global Human Milk Standards
| AA | Gestation Period | |
|---|---|---|
| Preterm | Term | |
| IAA | ||
| His | 41.7 | 34.5 |
| Leu | 192.4 | 159.3 |
| Lys | 134.7 | 107.8 |
| Phe | 79.1 | 63.8 |
| Val | 117.1 a | 83.3 b |
| Trp | 32.1 | 21.4 |
| Thr | 102.1 a | 68.4 b |
| Met | 27.8 | 21.1 |
| Ile | 95.5 | 84.0 |
| DAA | ||
| Arg † | 93.8 a | 64.9 b |
| Ala | 90.9 | 56.8 |
| Asp | 174.4 | 130.1 |
| Tyr † | 88.3 | 68.8 |
| Pro | 153.0 | 128.2 |
| Gly † | 55.0 | 41.7 |
| Ser | 111.8 | 90.2 |
| Glu | 305.3 | 252.9 |
| Cys † | 32.0 | 28.0 |
| TN | 3.5 | 2.8 |

| AA | Gestation Periods | ||
|---|---|---|---|
| Preterm | Term | NS | |
| IAA | |||
| His | 19.8 | 28.6 | 27.4 |
| Leu | 80.6 ab | 65.0 b | 143.9 a |
| Lys | 104.0 | 76.0 | 102.2 |
| Phe | 21.1 | 23.9 | 25.4 |
| Val | 79.9 | 73.0 | 96.9 |
| Thr | 82.9 | 92.6 | 121.9 |
| Met | 17.1 | 16.1 | 16.7 |
| Ile | 23.0 | 32.7 | 26.5 |
| Tau† | 366.7 ab | 387.4 a | 268.8 b |
| DAA | |||
| Arg† | 56.7 | 36.7 | 50.2 |
| Ala | 181.7 | 210.9 | 231.6 |
| Asp | 67.8 | 77.9 | 70.9 |
| Tyr† | 33.1 | 34.9 | 38.9 |
| Pro | 92.4 | 68.3 | 104.3 |
| Gly | 81.5 | 99.3 | 82.8 |
| Ser | 76.0 | 125.0 | 123.0 |
| Glu | 1201.2 | 1168.1 | 1196.2 |
| Gln | 52.9 b | 159.9 a | 137.0 ab |
| Cys† | 21.9 | 31.7 | 35.2 |
| Present Analysis | Koletzko 2005; CODEX 2007 [86,88] | LSRO 1998 [1] | Panel of Macronutrients 2005; Kleinman 2009 [89,90] | USDA 2009 [91] | European Commission 2003 [92] | WHO/FAO 2007 [87] | |
|---|---|---|---|---|---|---|---|
| No. of Studies | 26 | 7 | 4 | 4 | * | 6 | 3 |
| IAA | |||||||
| His | 143 ± 2.8 | 141 | * | 112.13 | 136.72 | 137.5 | 102.38 |
| Leu | 570 ± 8.1 | 586 | 491.4 | 492.38 | 566.41 | 575 | 468 |
| Lys | 389 ± 6.0 | 395 | 355.39 | 336.38 | 410.16 | 393.5 | 336.38 |
| Phe | 224 ± 6.2 | 282 | 181.84 | 195.0 | 273.44 | 287.5 | 204.75 |
| Val | 318 ± 6.0 | 315 | 258.38 | 273.0 | 371.09 | 306.25 | 268.13 |
| Trp | 111 ± 2.8 | 114 | 75.56 | 87.75 | 97.66 | 112.5 | 82.88 |
| Thr | 263 ± 3.4 | 268 | 220.35 | 229.13 | 273.44 | 268.75 | 214.5 |
| Met | 86 ± 1.8 | 85 | 71.66 | 78.0 | 117.19 | 81.25 | 78 |
| Ile | 305 ± 5.0 | 319 | 251.55 | 277.83 | 332.03 | 312.5 | 268.13 |
| DAA | |||||||
| Arg | 211 ± 3.2 | 196 | * | * | 253.91 | * | 112.13 |
| Ala | 221 ± 4.2 | * | * | * | 214.84 | * | 185.25 |
| Asp | 503 ± 6.7 | * | * | * | 488.28 | * | * |
| Tyr | 242 ± 8.1 | 259 | 199.88 | 229.13 | 312.5 | 262.5 | 253.5 |
| Pro | 498 ± 9.0 | * | * | * | 488.28 | * | 390 |
| Gly | 135 ± 2.0 | * | * | * | 156.25 | * | 112.13 |
| Ser | 256 ± 9.0 | * | * | * | 253.91 | * | 243.75 |
| Glu | 994 ± 14.7 | * | * | * | 1015.63 | * | * |
| Cys | 117 ± 2.9 | 131 | 94.09 | 107.25 | 117.19 | 131.25 | 82.88 |
| Asp + Asn | 438.75 | ||||||
| Glu + Gln | 867.75 | ||||||
4. Discussion
5. Conclusions
Abbreviations
| HM | human milk |
| TN | total nitrogen |
| TAA | total amino acids |
| FAA | free amino acids |
| IEG | International Expert Group |
| NPN | Non-protein nitrogen |
| AP | Asia |
| EU | Europe |
| NA | North America |
| AF | Africa |
| ANOVA | Analysis of Variance |
| IAA | Indispensable amino acids |
| DAA | Dispensable amino acids |
| NS | Not-specified |
| PC | Principal component |
| Mo | month |
| Wk | week |
| Yr | year |
| H | hour |
| d | day |
| g | gram |
| LS | least-squares |
| Leu | Leucine |
| Lys | Lysine |
| Phe | Phenylalanine |
| Val | Valine |
| Trp | Tryptophan |
| Thr | Threonine |
| Met | Methionine |
| Ile | Isoleucine |
| Tau | Taurine |
| Arg | Arginine |
| Ala | Alanine |
| Asp | Aspartate |
| Tyr | Tyrosine |
| Pro | Proline |
| Gly | Glycine |
| Ser | Serine |
| Glu | Glutamate |
| Gln | Glutamine |
| Cys | Cysteine |
| Colo | Colostrum |
| Trans | Transitional |
| MT | Mature |
| LacStage | Lactation Stage |
Acknowledgments
Conflicts of Interest
References
- Raiten, D.J.; Talbot, J.M.; Waters, J.H. Assessment of nutrient requirements of infant formulas. J. Nutr. 1998, 128, 2116S–2118S. [Google Scholar]
- Lemons, J.A.; Reyman, D.; Moye, L. Amino acid composition of preterm and term breast milk during early lactation. Early Hum. Dev. 1983, 8, 323–329. [Google Scholar] [CrossRef]
- Agostoni, C.; Carratù, B.; Boniglia, C.; Lammardo, A.M.; Riva, E.; Sanzini, E. Free glutamine and glutamic acid increase in human milk through a three-month lactation period. J. Pediatr. Gastroenterol. Nutr. 2000, 31, 508–512. [Google Scholar] [CrossRef]
- Atkinson, S.A.; Schnurr, C.; Donovan, S.M.; Lönnerdal, B. The Non-Protein Nitrogen Components of Human Milk: Biochemistry and Potential Functional Role. In Protein and Non-Protein Nitrogen in Human Milk; Atkinson, S.A., Lönnerdal, B., Eds.; CRC Press: Boca Raton, FL, USA, 1989; pp. 117–133. [Google Scholar]
- Carratù, B.; Boniglia, C.; Scalise, F.; Ambruzzi, A.; Sanzini, E. Nitrogenous components of human milk: Non-protein nitrogen, true protein and free amino acids. Food Chem. 2003, 81, 357–362. [Google Scholar] [CrossRef]
- Svanberg, U.; Gebre-Medhin, M.; Ljungqvist, B.; Olsson, M. Breast milk composition in Ethiopian and Swedish mothers. III. Amino acids and other nitrogenous substances. Am. J. Clin. Nutr. 1977, 30, 499–507. [Google Scholar]
- Agostoni, C.; Carratù, B.; Boniglia, C.; Riva, E.; Sanzini, E. Free amino acid content in standard infant formulas: Comparison with human milk. J. Am. Coll. Nutr. 2000, 19, 434–438. [Google Scholar] [CrossRef]
- Chuang, C.K.; Lin, S.P.; Lee, H.C.; Wang, T.J.; Shih, Y.S.; Huang, F.Y.; Yeung, C.Y. Free amino acids in full-term and pre-term human milk and infant formula. J. Pediatr. Gastroenterol. Nutr. 2005, 40, 496–500. [Google Scholar] [CrossRef]
- Elmastas, M.; Keha, E.E.; Keles, M.S.; Aboul-Enein, H.Y. Analysis of free amino acids and protein contents of mature human milk from Turkish mothers. Anal. Lett. 2008, 41, 725–736. [Google Scholar] [CrossRef]
- Sarwar, G. Comparative free amino acid profiles of human milk and some infant formulas sold in Europe. J. Am. Coll. Nutr. 2001, 20, 92–93. [Google Scholar] [CrossRef]
- Pamblanco, M.; Portolés, M.; Paredes, C.; Ten, A.; Comín, J. Free amino acids in preterm and term milk from mothers delivering appropriate- or small-for-gestational-age infants. Am. J. Clin. Nutr. 1989, 50, 778–781. [Google Scholar]
- Ferreira, I.M. Quantification of non-protein nitrogen components of infant formulae and follow-up milks: Comparison with cows’ and human milk. Br. J. Nutr. 2003, 90, 127–133. [Google Scholar] [CrossRef]
- Klein, C.J. Nutrient requirements for preterm infant formulas. J. Nutr. 2002, 132, 1395S–1577S. [Google Scholar]
- Agostoni, C.; Buonocore, G.; Carnielli, V.P.; de Curtis, M.; Darmaun, D.; Decsi, T.; Domellof, M.; Embleton, N.D.; Fusch, C.; Genzel-Boroviczeny, O.; et al. Enteral nutrient supply for preterm infants: Commentary from the European Society of Paediatric Gastroenterology, Hepatology and Nutrition Committee on Nutrition. J. Pediatr. Gastroenterol. Nutr. 2010, 50, 85–91. [Google Scholar] [CrossRef]
- Britton, J.R. Milk protein quality in mothers delivering prematurely: Implications for infants in the intensive care unit nursery setting. J. Pediatr. Gastroenterol. Nutr. 1986, 5, 116–121. [Google Scholar] [CrossRef]
- Lönnerdal, B.; Smith, C.; Keen, C.L. Analysis of breast milk: Current methodologies and future needs. J. Pediatr. Gastroenterol. Nutr. 1984, 3, 290–295. [Google Scholar] [CrossRef]
- Donovan, S.M.; Lönnerdal, B. Isolation of the nonprotein nitrogen fraction from human milk by gel-filtration chromatography and its separation by fast protein liquid chromatography. Am. J. Clin. Nutr. 1989, 50, 53–57. [Google Scholar]
- Atkinson, S.A. Human Milk Feeding of Premature Infants <1.3 kg Birthweight: Milk Analysis and Clinical Studies during Early Postnatal Life; University of Toronto: Toronto, ON, Canada, 1980. [Google Scholar]
- Bellomonte, G.; Boniglia, C.; Carratù, B.; Filesi, C.; Giammarioli, S.; Mosca, M.; Sanzini, E. Protein and lipid composition of human milk and infant formulas: Comparison and nutritional consequences. Ann. Ist. Super. Sanita 1990, 26, 131–139. [Google Scholar]
- Chavalittamrong, B.; Suanpan, S.; Boonvisut, S.; Chatranon, W.; Gershoff, S.N. Protein and amino acids of breast milk from Thai mothers. Am. J. Clin. Nutr. 1981, 34, 1126–1130. [Google Scholar]
- Cheung, M.W.; Pratt, E.L.; Fowler, D.I. Total amino acid composition in mature human milk; analysis by the ion exchange resin column chromatographic technic. Pediatrics 1953, 12, 353–357. [Google Scholar]
- Darling, P. Threonine and Phenylalanine Metabolism in the Human Neonate; University of Toronto: Toronto, ON, Canada, 1997. [Google Scholar]
- Darling, P.B.; Dunn, M.; Sarwar, G.; Brookes, S.; Ball, R.O.; Pencharz, P.B. Threonine kinetics in preterm infants fed their mothers’ milk or formula with various ratios of whey to casein. Am. J. Clin. Nutr. 1999, 69, 105–114. [Google Scholar]
- Darragh, A.J.; Moughan, P.J. The amino acid composition of human milk corrected for amino acid digestibility. Br. J. Nutr. 1998, 80, 25–34. [Google Scholar] [CrossRef]
- Davis, T.A.; Nguyen, H.V.; Garcia-Bravo, R.; Fiorotto, M.L.; Jackson, E.M.; Reeds, P.J. Amino acid composition of the milk of some mammalian species changes with stage of lactation. Br. J. Nutr. 1994, 72, 845–853. [Google Scholar] [CrossRef]
- Donovan, S.M.; Lönnerdal, B. Non-protein nitrogen and true protein in infant formulas. Acta Paediatr. Scand. 1989, 78, 497–504. [Google Scholar] [CrossRef]
- Feng, P.; Gao, M.; Holley, T.; Zhou, T.; Burgher, A.; Trabulsi, J.; Pramuk, K.; Nazzario, J. Amino acid composition and protein content of mature human milk from nine countries. FASEBJ. 2009, 23, LB448. [Google Scholar]
- Hanning, R.M.; Paes, B.; Atkinson, S.A. Protein metabolism and growth of term infants in response to a reduced-protein, 40:60 whey: Casein formula with added tryptophan. Am. J. Clin. Nutr. 1992, 56, 1004–1011. [Google Scholar]
- Harzer, G.; Bindels, J.G. Changes in Human Milk Immunoglobulin A and Lactoferrin during Early Lactation. In Composition and Physiological Properties of Human Milk; Elsevier Science: Amsterdam, The Netherlands, 1985; pp. 285–295. [Google Scholar]
- Janas, L.M.; Picciano, M.F. Quantities of amino acids ingested by human milk-fed infants. J. Pediatr. 1986, 109, 802–807. [Google Scholar] [CrossRef]
- Janas, L.M.; Picciano, M.F.; Hatch, T.F. Indices of protein metabolism in term infants fed either human milk or formulas with reduced protein concentration and various whey/casein ratios. J. Pediatr. 1987, 110, 838–848. [Google Scholar] [CrossRef]
- Lauber, E.; Reinhardt, M. Studies on the quality of breast milk during 23 months of lactation in a rural community of the Ivory Coast. Am. J. Clin. Nutr. 1979, 32, 1159–1173. [Google Scholar]
- London Department of Health. The Composition of Mature Human Milk. In Report of a Working Party of the Committee on Medical Aspects of Food Policy; HM Stationery Office: London, UK, 1977; pp. xi–47. [Google Scholar]
- Lönnerdal, B.; Forsum, E.; Hambraeus, L. The protein content of human milk I. Transversal study of Swedish normal material. Nutr. Rep. Int. 1976, 13, 125–134. [Google Scholar]
- Lönnerdal, B.; Forsum, E. Casein content of human milk. Am. J. Clin. Nutr. 1985, 41, 113–120. [Google Scholar]
- Sarwar, G.; Darling, P.; Ujiie, M.; Botting, H.G.; Pencharz, P.B. Use of amino acid profiles of preterm and term human milks in evaluating scoring patterns for routine protein quality assessment of infant formulas. J. AOAC Int. 1996, 79, 498–502. [Google Scholar]
- Shaikhiev, A.A. Amino acid composition of breast milk in the first month of lactation. Vopr. Okhr. Materin. Det. 1980, 25, 12–15. [Google Scholar]
- Villalpando, S.; Butte, N.F.; Flores-Huerta, S.; Thotathuchery, M. Qualitative analysis of human milk produced by women consuming a maize-predominant diet typical of rural Mexico. Ann. Nutr. Metab. 1998, 42, 23–32. [Google Scholar] [CrossRef]
- Wu, Z.C.; Chuang, C.C.; Lau, B.H.; Hwang, B.; Sugawara, M.; Idota, T. Crude protein content and amino acid composition in Taiwanese human milk. J. Nutr. Sci. Vitaminol. (Tokyo) 2000, 46, 246–251. [Google Scholar] [CrossRef]
- Yamawaki, N.; Yamada, M.; Kan-no, T.; Kojima, T.; Kaneko, T.; Yonekubo, A. Macronutrient, mineral and trace element composition of breast milk from Japanese women. J. Trace Elem. Med. Biol. 2005, 19, 171–181. [Google Scholar] [CrossRef]
- Yonekubo, A.; Onoda, T.; Fumikura, M.; Fudota, K.; Tsuchiya, F. Total and free amino acid compositions of human milk from Japan. J. Jap. Soc. Nutr. Grains 1989, 42, 194–196. [Google Scholar]
- Zhao, X.; Xu, Z.; Wang, Y.; Sun, Y. Studies of the relation between the nutritional status of lactating mothers and milk composition as well as the milk intake and growth of their infants in Beijing. Pt. 4. The protein and amino acid content of breast milk. Ying Yang Xue Bao 1989, 11, 227–232. [Google Scholar]
- Armstrong, M.; Yates, K. Free amino acids in milk. Proc. Soc. Exp. Biol. Med. 1963, 113, 680–684. [Google Scholar] [CrossRef]
- Atkinson, S.A.; Anderson, G.H.; Bryan, M.H. Human milk: Comparison of the nitrogen composition in milk from mothers of premature and full-term infants. Am. J. Clin. Nutr. 1980, 33, 811–815. [Google Scholar]
- DeSantiago, S.; Ramírez, I.; Tovar, A.R.; Alonso, L.; Ortíz-Olaya, N.; Torres, N. Free amino acids in plasma and milk of Mexican rural lactating women. Rev. Investig. Clin. 1998, 50, 405–412. [Google Scholar]
- Gutikova, L.V. The concentration of amino acids in the breast milk of nursing women. Klin. Lab. Diagn. 2001, 7, 21–24. [Google Scholar]
- Harzer, G.; Franzke, V.; Bindels, J.G. Human milk nonprotein nitrogen components: Changing patterns of free amino acids and urea in the course of early lactation. Am. J. Clin. Nutr. 1984, 40, 303–309. [Google Scholar]
- López-Sánchez Solís, M.; Pajarón de Ahumada, M.; Cámara Palop, J.; García Campos, M.; Alvarez Martínez, J.A.; Martínez-Artero, I.; Borrajo Guadarrama, E. Free amino acids and hydrolyzed proteins in breast milk. Rev. Esp. Pediatr. 1988, 44, 557–560. [Google Scholar]
- Motil, K.J.; Thotathuchery, M.; Bahar, A.; Montandon, C.M. Marginal dietary protein restriction reduced nonprotein nitrogen, but not protein nitrogen, components of human milk. J. Am. Coll. Nutr. 1995, 14, 184–191. [Google Scholar] [CrossRef]
- Rassin, D.K.; Gaull, G.E.; Heinonen, K.; Räihä, N.C. Milk protein quantity and quality in low-birth-weight infants: II. Effects on selected aliphatic amino acids in plasma and urine. Pediatrics 1977, 59, 407–422. [Google Scholar]
- Singh, P.; Saxena, S.K.; Mallick, H.N. Free glutamic acid content of milk in Indian mothers. Indian J. Physiol. Pharmacol. 2004, 48, 365–369. [Google Scholar]
- Viña, J.R.; Puertes, I.R.; Rodriguez, A.; Saez, G.T.; Viña, J. Effect of fasting on amino acid metabolism by lactating mammary gland: Studies in women and rats. J. Nutr. 1987, 117, 533–538. [Google Scholar]
- Wurtman, J.J.; Fernstrom, J.D. Free amino acid, protein, and fat contents of breast milk from Guatemalan mothers consuming a corn-based diet. Early Hum. Dev. 1979, 3, 67–77. [Google Scholar]
- Beach, E.F.; Bernstein, S.; Hoffman, O.D.; Teague, D.M.; Macy, I. Distribution of nitrogen and protein amino aids in human and in cow’s milk. J. Biol. Chem. 1941, 139, 57–63. [Google Scholar]
- Block, R.; Bolling, D. The amino acid composition of cow and human milk proteins. Arch. Biochem. 1946, 10, 359–363. [Google Scholar]
- Davis, T.A.; Fiorotto, M.L.; Reeds, P.J. Amino acid compositions of body and milk protein change during the suckling period in rats. J. Nutr. 1993, 123, 947–956. [Google Scholar]
- Davis, T.A.; Nguyen, H.V.; Garcia-Bravo, R.; Fiorotto, M.L.; Jackson, E.M.; Lewis, D.S.; Lee, D.R.; Reeds, P.J. Amino acid composition of human milk is not unique. J. Nutr. 1994, 124, 1126–1132. [Google Scholar]
- DeSantiago, S.; Ramírez, I.; Tovar, A.R.; Ortíz, N.; Torres, N.; Bourges, H. Amino acid profiles in diet, plasma, and human milk in Mexican rural lactating women. Nutr. Res. 1999, 19, 1133–1143. [Google Scholar] [CrossRef]
- Filippova, G.I.; Aronova, B.N. Amino acid composition of human milk at different periods of lactation and effect on it of hedge nettle extract administered in the early puerperal. Zdravookhr. Kirg. 1974, 6, 24–26. [Google Scholar]
- Guo, H.Y.; Pang, K.; Zhang, X.Y.; Zhao, L.; Chen, S.W.; Dong, M.L.; Ren, F.Z. Composition, physiochemical properties, nitrogen fraction distribution, and amino acid profile of donkey milk. J. Dairy Sci. 2007, 90, 1635–1643. [Google Scholar] [CrossRef]
- Heine, W.E.; Klein, P.D.; Reeds, P.J. The importance of alpha-lactalbumin in infant nutrition. J. Nutr. 1991, 121, 277–283. [Google Scholar]
- Järvenpää, A.L.; Rassin, D.K.; Räihä, N.C.; Gaull, G.E. Milk protein quantity and quality in the term infant. II. Effects on acidic and neutral amino acids. Pediatrics 1982, 70, 221–230. [Google Scholar]
- Macy, I.G. Composition of human colostrum and milk. Am. J. Dis. Child. 1949, 78, 589–603. [Google Scholar]
- Macy, I.; Kelly, H.J. Human and Cow’s Milk in Infant Nutrition. In Milk the Mammary Gland and Its Secretion; Kon, S.K., Cowie, A.T., Eds.; Acadmeic Press: New York, NY, USA, 1961; Volume 2, pp. 265–304. [Google Scholar]
- Miller, S.; Ruttinger, V.; Frahm, R.; Maurer, S.; Moyer, E.; Kaucher, M.; Macy, I. Human milk studies XXVII. Essential amino acids in colostrum and transitional milk. J. Nutr. 1950, 40, 499–541. [Google Scholar]
- Mitton, S.G.; Garlick, P.J. Changes in protein turnover after the introduction of parenteral nutrition in premature infants: Comparison of breast milk and egg protein-based amino acid solutions. Pediatr. Res. 1992, 32, 447–454. [Google Scholar] [CrossRef]
- Nagasawa, T.; Kiyosawa, I.; Kuwahara, K. Acrylamide gel electrophoresis and amino acid compositions of human colostral casein. J. Dairy Sci. 1970, 53, 92–94. [Google Scholar] [CrossRef]
- Nayman, R.; Thomson, M.E.; Scriver, C.R.; Clow, C.L. Observations on the composition of milk-substitute products for treatment of inborn errors of amino acid metabolism. Comparisons with human milk. A proposal to rationalize nutrient content of treatment products. Am. J. Clin. Nutr. 1979, 32, 1279–1289. [Google Scholar]
- Picone, T.A.; Benson, J.D.; Moro, G.; Minoli, I.; Fulconis, F.; Rassin, D.K.; Räihä, N.C. Growth, serum biochemistries, and amino acids of term infants fed formulas with amino acid and protein concentrations similar to human milk. J. Pediatr. Gastroenterol. Nutr. 1989, 9, 351–360. [Google Scholar] [CrossRef]
- Räihä, R.; Fazzolari Nesci, A.; Cajozzo, C.; Puccio, G.; Minoli, I.; Moro, G.E.; Monestier, A.; Haschke-Becher, E.; Carrie, A.L.; Haschke, F. Protein quantity and quality in infant formula: Closer to the reference. Nestle Nutr. Workshop Ser. Pediatr. Program 2002, 47, 111–120. [Google Scholar]
- Renner, E. Milk Protein. In Milk and Dairy Products in Human Nutrition; Renner, E., Ed.; Friedrich Pustet: Regensburg, Germany, 1983; pp. 90–129. [Google Scholar]
- Rigo, J.; Salle, B.L.; Cavero, E.; Richard, P.; Putet, G.; Senterre, J. Plasma amino acid and protein concentrations in infants fed human milk or a whey protein hydrolysate formula during the first month of life. Acta Paediatr. 1994, 83, 127–131. [Google Scholar] [CrossRef]
- Saito, K.; Furuichi, E.; Kondo, S.; Kawanishi, G.; Nishikawa, I.; Nakazato, H.; Noguchi, Y.; Doi, T.; Noguchi, A.; Shingo, S. Studies on Human Milk; Snow Brand Products: Tokyo, Japan, 1975; pp. 1–112. [Google Scholar]
- Scott, P.H.; Sandham, S.; Balmer, S.E.; Wharton, B.A. Diet-related reference values for plasma amino acids in newborns measured by reversed-phase HPLC. Clin. Chem. 1990, 36, 1922–1927. [Google Scholar]
- Soupart, P.; Moore, S.; Bigwood, E.J. Amino acid composition of human milk. J. Biol. Chem. 1954, 206, 699–704. [Google Scholar]
- Tikanoja, T.; Simell, O.; Viikari, M.; Järvenpää, A.L. Plasma amino acids in term neonates after a feed of human milk or formula. II. Characteristic changes in individual amino acids. Acta Paediatr. Scand. 1982, 71, 391–397. [Google Scholar] [CrossRef]
- Volz, V.R.; Book, L.S.; Churella, H.R. Growth and plasma amino acid concentrations in term infants fed either whey-predominant formula or human milk. J. Pediatr. 1983, 102, 27–31. [Google Scholar] [CrossRef]
- Williamson, M.B. The amino acid composition of human milk proteins. J. Biol. Chem. 1944, 156, 47–52. [Google Scholar]
- Woodward, D.R.; Messer, M. Chemical composition of rat casein. Comp. Biochem. Physiol. B 1976, 55, 141–143. [Google Scholar]
- Farriauz, J.P.; Razemon-Pinta, M.; Fontaine, G. The free amino acids of milk. Revue Pediatr. 1971, 9, 639–670. [Google Scholar]
- Faus, O.; Lopez Morales, J.; Faus, M.J.; Periago, J.L.; Bueno Sánchez, A.; Gil, A.; Martínez Valverde, A. Content of free amino acids in human milk in Spain. An. Esp. Pediatr. 1984, 21, 557–563. (in Spanish). [Google Scholar]
- Ghadimi, H.; Pecora, P. Free amino acids of different kinds of milk. Am. J. Clin. Nutr. 1963, 13, 75–81. [Google Scholar]
- Pajarón, M.; López Sánchez Solís, M.; Morán, J. Quantification of free amino acids in human milk. Rev. Esp. Pediatr. 1992, 48, 303–308. [Google Scholar]
- Periago, J.L.; Faus, O.; Martínez Valverde, A.; Bueno Sánchez, A.; Faus, M.J.; Gil, A. Content of free amino acids in some milk formulas used in Spain. An. Esp. Pediatr. 1984, 21, 635–641. [Google Scholar]
- Rassin, D.K. Essential and Non-Essential Amino Acids in Neonatal Nutrition. In Protein Metabolism During Infancy; Räihä, N.C.R., Ed.; Raven Press: New York, NY, USA, 1994; Volume 33, pp. 183–192. [Google Scholar]
- Koletzko, B.; Baker, S.; Cleghorn, G.; Neto, U.F.; Gopalan, S.; Hernell, O.; Hock, Q.S.; Jirapinyo, P.; Lönnerdal, B.; Pencharz, P.; et al. Global standard for the composition of infant formula: Recommendations of an ESPGHAN coordinated international expert group. J. Pediatr. Gastroenterol. Nutr. 2005, 41, 584–599. [Google Scholar] [CrossRef]
- World Health Organization. Protein and Amino Acid Requirements in Human Nutrition. In Report of a Joint WHO/FAO/UNU Consultation; World Health Organization: Geneva, Switzerland, 2007; pp. 161–182. [Google Scholar]
- CODEX Alimentarius Standard for Infant Formula and Formulas for Special Medical Purposes Intended for Infants. In CODEX STAN 72-1981; CODEX Alimentarius: Rome, Italy, 2007; pp. 2–21.
- Panel on Macronutrients; Panel on the Definition of Dietary Fiber; Subcommittee on Upper Reference Levels of Nutrients; Subcommittee on Interpretation and Uses of Dietary Reference Intakes; Standing Committee on the Scientific Evaluation of Dietary Reference Intakes. Protein and Amino Acids. In Dietary Reference Intakes for Energy, Carbohydrate, Fiber, Fat, Fatty Acids; National Academies Press: Washington, DC, USA, 2005; pp. 589–768. [Google Scholar]
- Kleinman, R. Pediatric Nutrition Handbook, 6th ed.; American Academy of Pediatrics: Elk Grove Village, IL, USA, 2009. [Google Scholar]
- USDA. USDA National Nutrient Database for Standard Reference, Release 22; USDA: Washington, DC, USA, 2009.
- European Commission Scientific Committee on Food. Report of the Scientific Committee on Food on the Revision of Essential Requirements of Infant Formulae and Follow-on Formulae (Adopted on 4 April 2003); European Commission: Brussels, Belgium, 2003. [Google Scholar]
- Schanler, R.J.; Garza, C. Plasma amino acid differences in very low birth weight infants fed either human milk or whey-dominant cow milk formula. Pediatr. Res. 1987, 21, 301–305. [Google Scholar] [CrossRef]
- Dupont, C. Protein requirements during the first year of life. Am. J. Clin. Nutr. 2003, 77, 1544S–1549S. [Google Scholar]
- Ventura, A.K.; Beauchamp, G.K.; Mennella, J.A. Infant regulation of intake: The effect of free glutamate content in infant formulas. Am. J. Clin. Nutr. 2012, 95, 875–881. [Google Scholar] [CrossRef]
- Roig, J.C.; Meetze, W.H.; Auestad, N.; Jasionowski, T.; Veerman, M.; McMurray, C.A.; Neu, J. Enteral glutamine supplementation for the very low birthweight infant: Plasma amino acid concentrations. J. Nutr. 1996, 126, 1115S–1120S. [Google Scholar]
- Molinari, C.E.; Casadio, Y.S.; Hartmann, B.T.; Livk, A.; Bringans, S.; Arthur, P.G.; Hartmann, P.E. Proteome mapping of human skim milk proteins in term and preterm milk. J. Proteome Res. 2012, 11, 1696–1714. [Google Scholar] [CrossRef]
- Bauer, J.; Gerss, J. Longitudinal analysis of macronutrients and minerals in human milk produced by mothers of preterm infants. Clin. Nutr. 2011, 30, 215–220. [Google Scholar] [CrossRef]
- Armaforte, E.; Curran, E.; Huppertz, T.; Ryan, A.; Caboni, M.F.; O’Connor, P.M.; Ross, R.P.; Hirtz, C.; Sommerer, N.; Chevalier, F.; et al. Proteins and proteolysis in pre-term and term human milk and possible implications for infant formulae. Int. Dairy J. 2010, 20, 715–723. [Google Scholar]
- Beijers, R.J.; Graaf, F.V.; Schaafsma, A.; Siemensma, A.D. Composition of premature breast-milk during lactation: Constant digestible protein content (as in full term milk). Early Hum. Dev. 1992, 29, 351–356. [Google Scholar] [CrossRef]
- Gross, S.J.; David, R.J.; Bauman, L.; Tomarelli, R.M. Nutritional composition of milk produced by mothers delivering preterm. J. Pediatr. 1980, 96, 641–644. [Google Scholar] [CrossRef]
- Lepage, G.; Collet, S.; Bougle, D.; Kien, L.C.; Lepage, D.; Dallaire, L.; Darling, P.; Roy, C.C. The composition of preterm milk in relation to the degree of prematurity. Am. J. Clin. Nutr. 1984, 40, 1042–1049. [Google Scholar]
- Lindblad, B.S.; Rahimtoola, R.J. A pilot study of the quality of human milk in a lower socio-economic group in Karachi, Pakistan. Acta Paediatr. Scand. 1974, 63, 125–128. [Google Scholar] [CrossRef]
- Lönnerdal, B. Effects of maternal dietary intake on human milk composition. J. Nutr. 1986, 116, 499–513. [Google Scholar]
- Trugo, N.M.; Donangelo, C.M.; Koury, J.C.; Silva, M.I.; Freitas, L.A. Concentration and distribution pattern of selected micronutrients in preterm and term milk from urban Brazilian mothers during early lactation. Eur. J. Clin. Nutr. 1988, 42, 497–507. [Google Scholar]
- Ding, M.; Li, W.; Zhang, Y.; Wang, X.; Zhao, A.; Zhao, X.; Wang, P.; Sheng, Q.H. Amino acid composition of lactating mothers’ milk and confinement diet in rural North China. Asia Pac. J. Clin. Nutr. 2010, 19, 344–349. [Google Scholar]
© 2013 by the authors; licensee MDPI, Basel, Switzerland. This article is an open access article distributed under the terms and conditions of the Creative Commons Attribution license (http://creativecommons.org/licenses/by/3.0/).
Share and Cite
Zhang, Z.; Adelman, A.S.; Rai, D.; Boettcher, J.; Lőnnerdal, B. Amino Acid Profiles in Term and Preterm Human Milk through Lactation: A Systematic Review. Nutrients 2013, 5, 4800-4821. https://0-doi-org.brum.beds.ac.uk/10.3390/nu5124800
Zhang Z, Adelman AS, Rai D, Boettcher J, Lőnnerdal B. Amino Acid Profiles in Term and Preterm Human Milk through Lactation: A Systematic Review. Nutrients. 2013; 5(12):4800-4821. https://0-doi-org.brum.beds.ac.uk/10.3390/nu5124800
Chicago/Turabian StyleZhang, Zhiying, Alicia S. Adelman, Deshanie Rai, Julia Boettcher, and Bo Lőnnerdal. 2013. "Amino Acid Profiles in Term and Preterm Human Milk through Lactation: A Systematic Review" Nutrients 5, no. 12: 4800-4821. https://0-doi-org.brum.beds.ac.uk/10.3390/nu5124800