Protein Beverage vs. Protein Gel on Appetite Control and Subsequent Food Intake in Healthy Adults

Abstract
:
1. Introduction
2. Methods
2.1. Clinical Trial
2.1.1. Participants
2.1.2. Study Design
2.1.3. Protein Snacks

| Bev-3.0 | Bev-7.0 | Gel-Heated | Gel-Acid | CON | |
|---|---|---|---|---|---|
| Energy content (kcal) | 96 | 96 | 96 | 96 | 0 |
| Total protein (g) | 24 | 24 | 24 | 24 | 0 |
| Protein content (%) | 8 | 8 | 12 | 8 | 0 |
| pH | 3.0 | 7.0 | 7.0 | 5.0 | 7.0 |
| Serving size * | 300 g | 300 g | 200 g | 300 g | 300 g |
| Food type | Beverage | Beverage | Gel | Gel | Beverage |
| Flavor | Raspberry | Vanilla | Vanilla | Vanilla | - |
| Sweetener | Sucralose | Sucralose | Sucralose | Sucralose | - |
2.1.4. Meals
2.1.5. Appetite Questionnaire
2.1.6. Data and Statistical Analysis
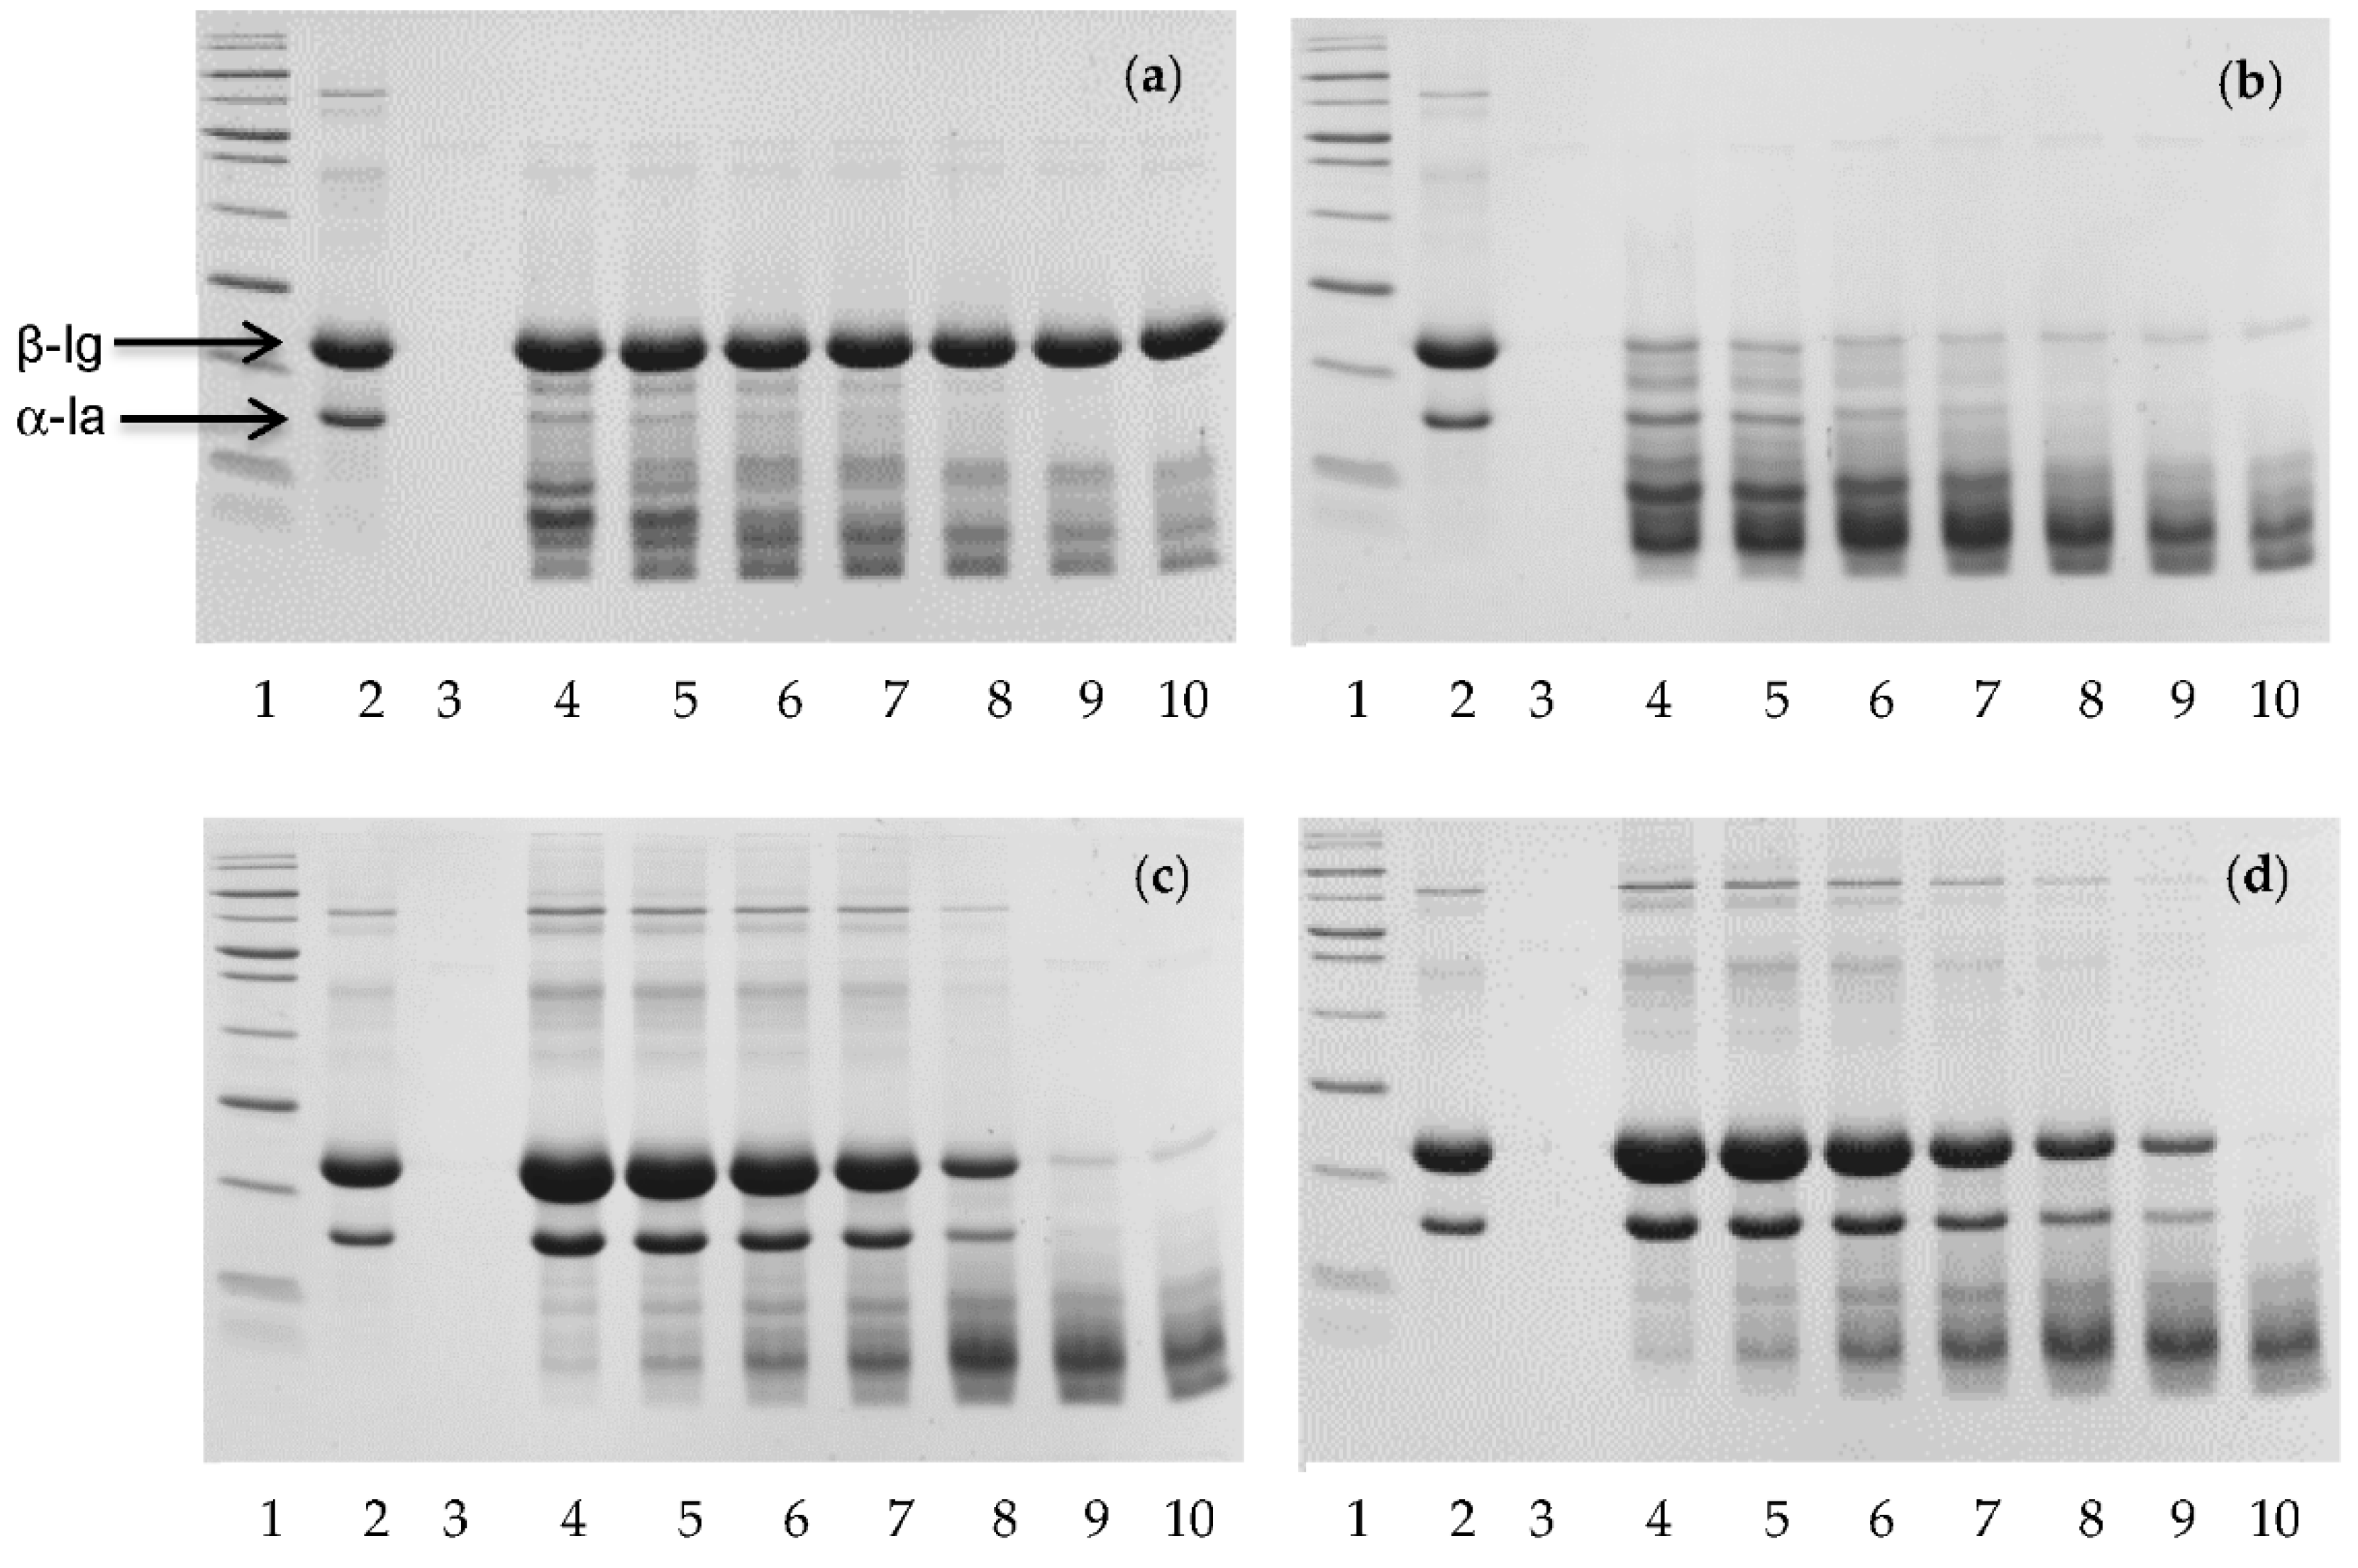
2.2. In Vitro Digestion
3. Results
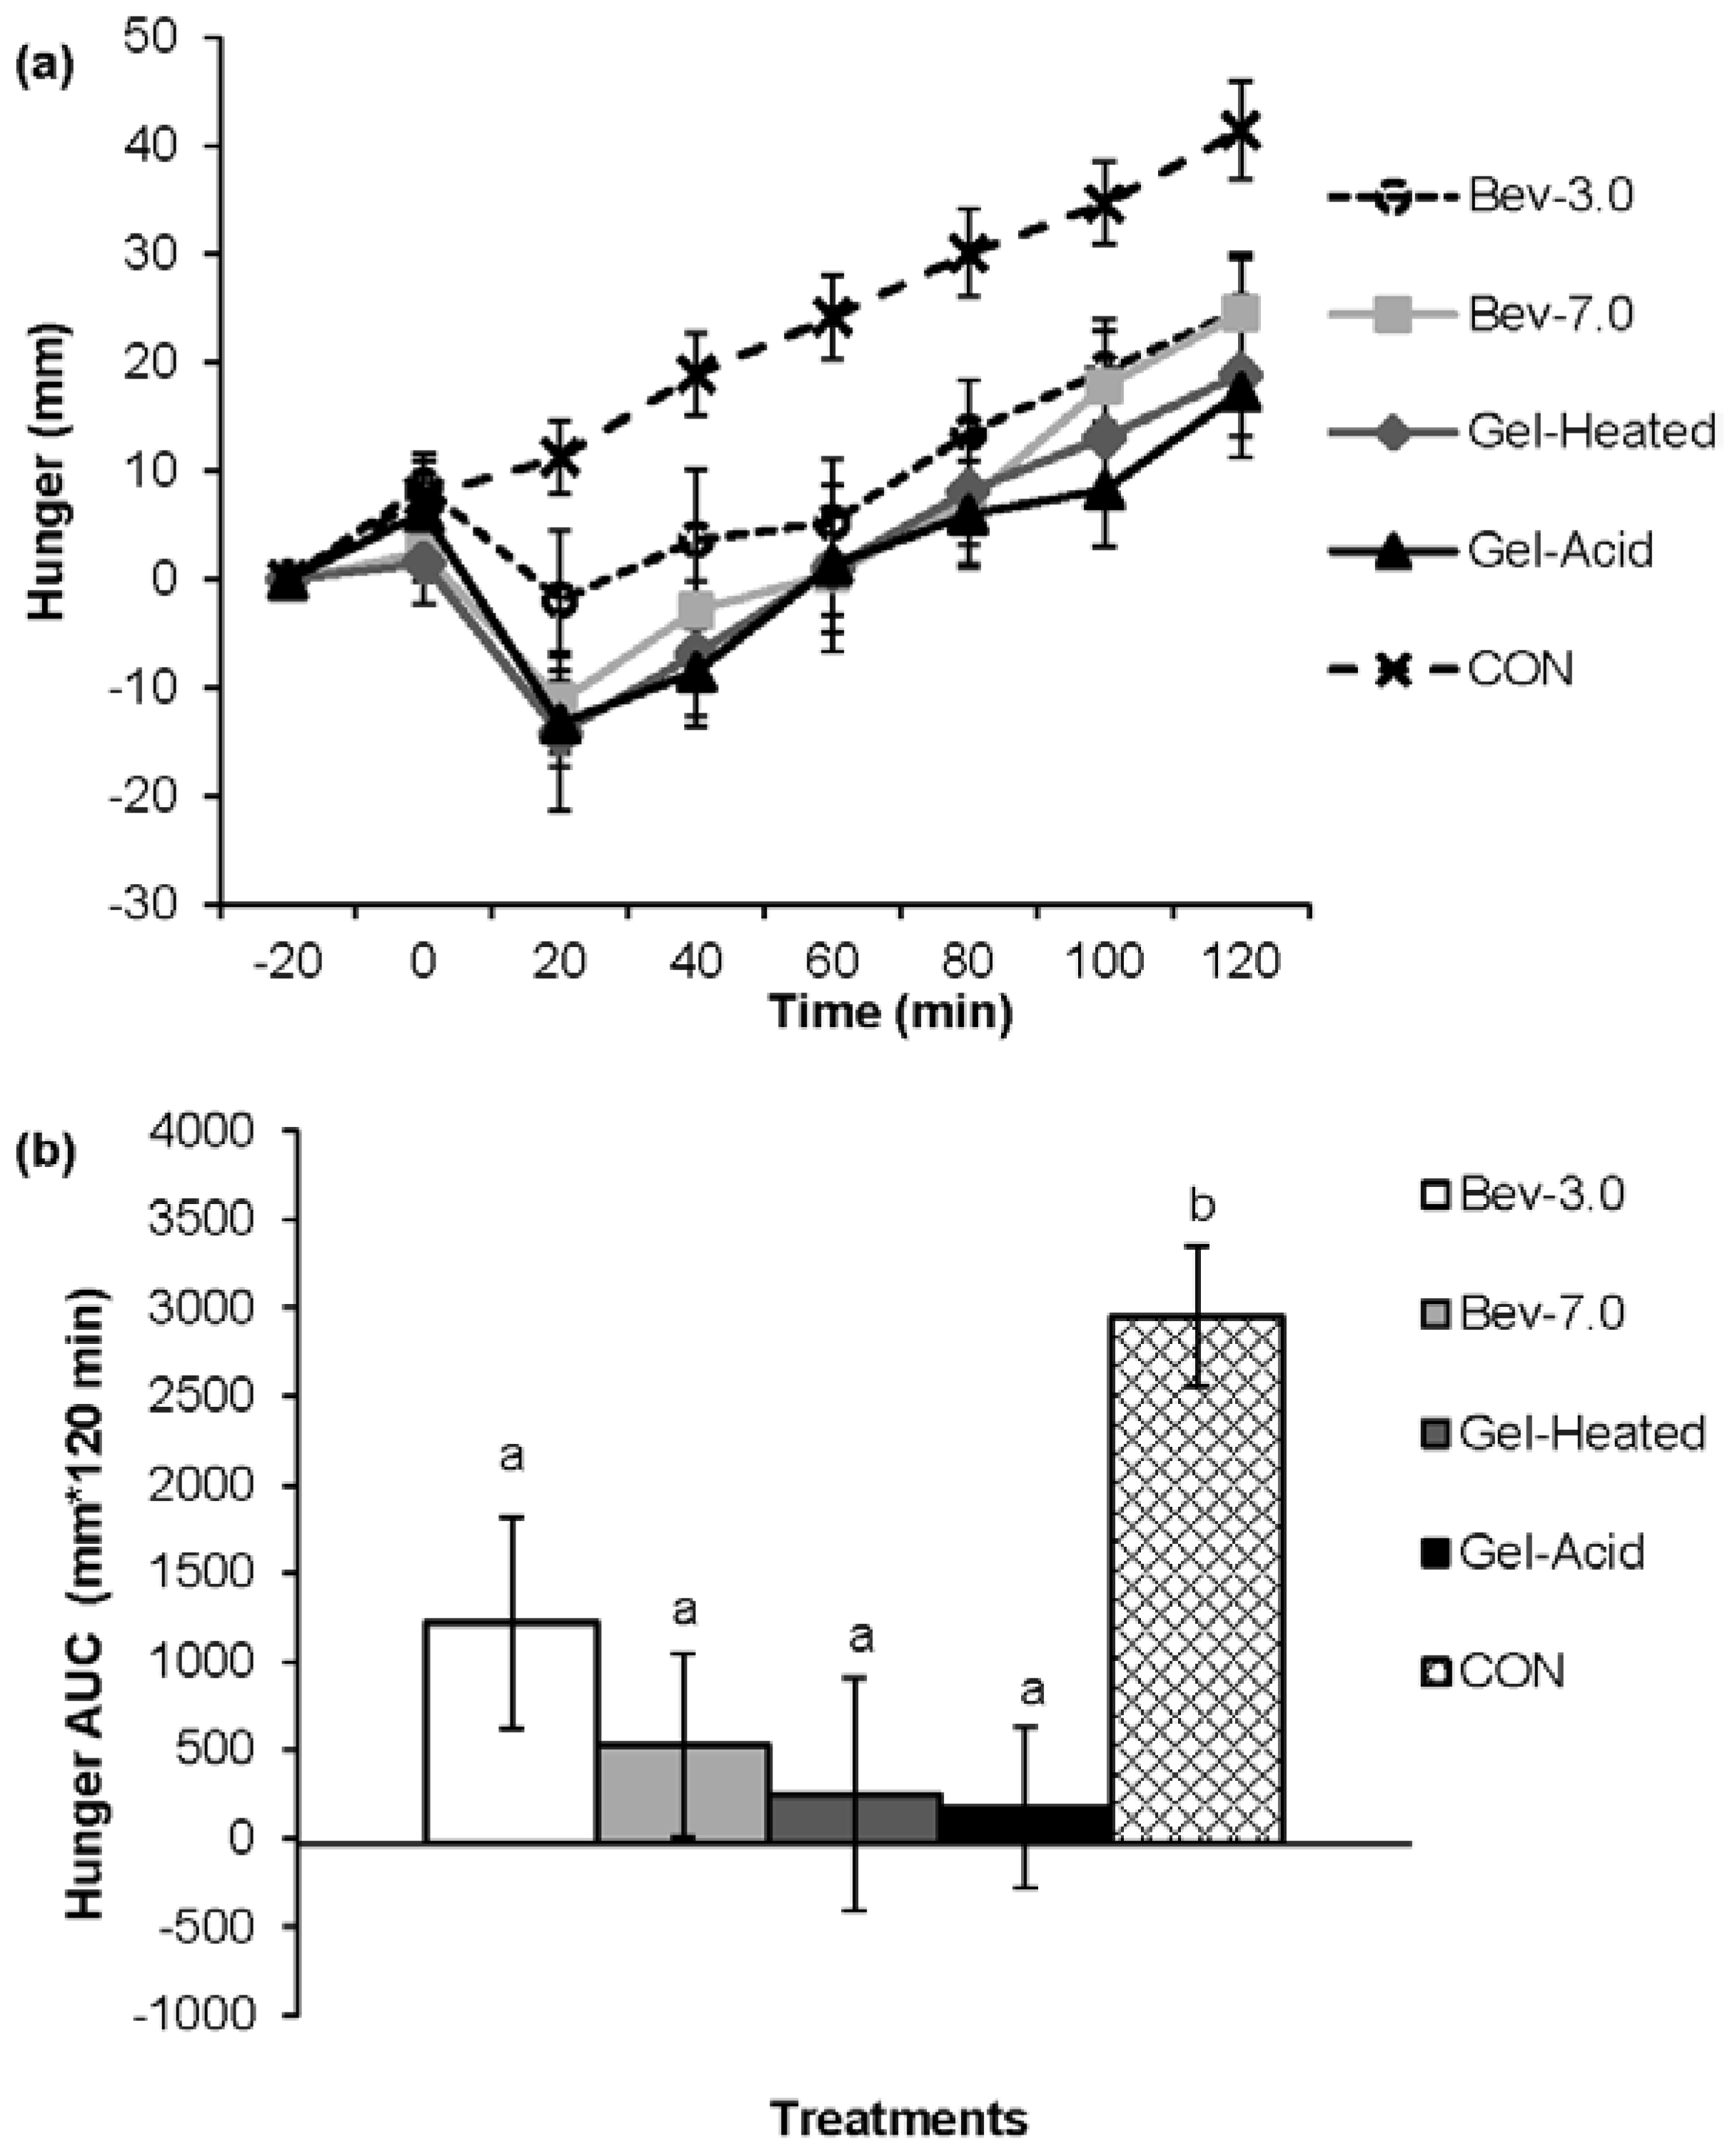
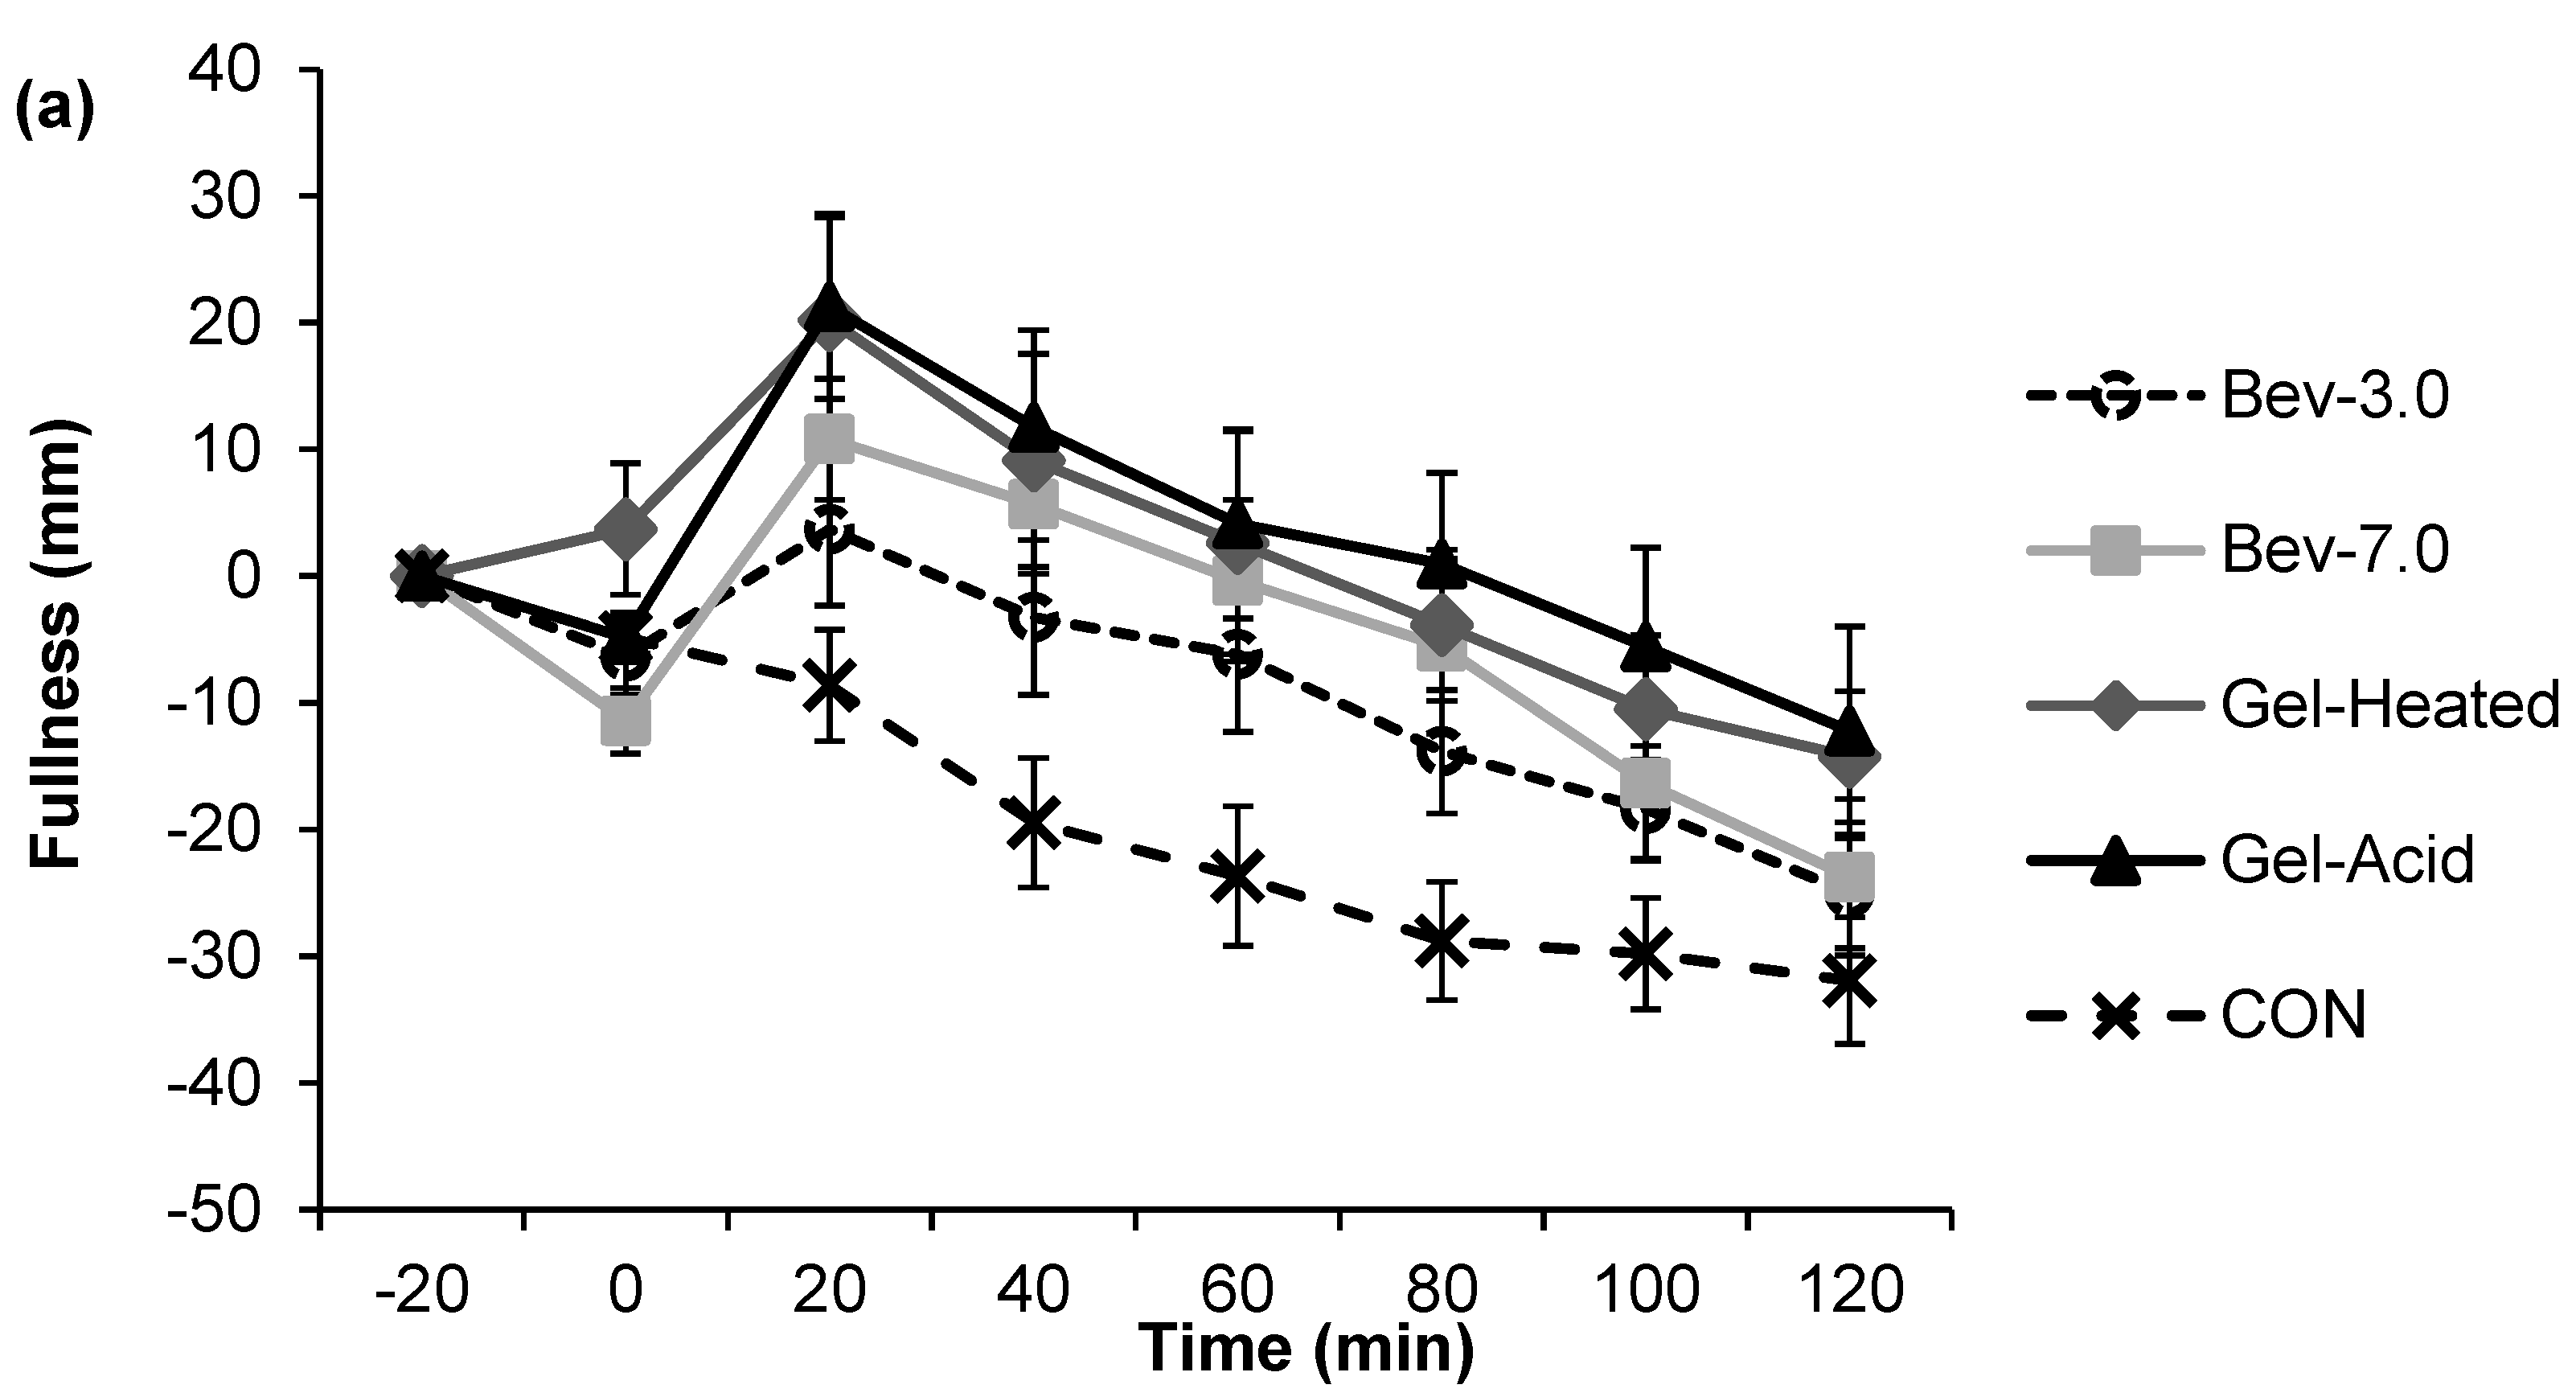
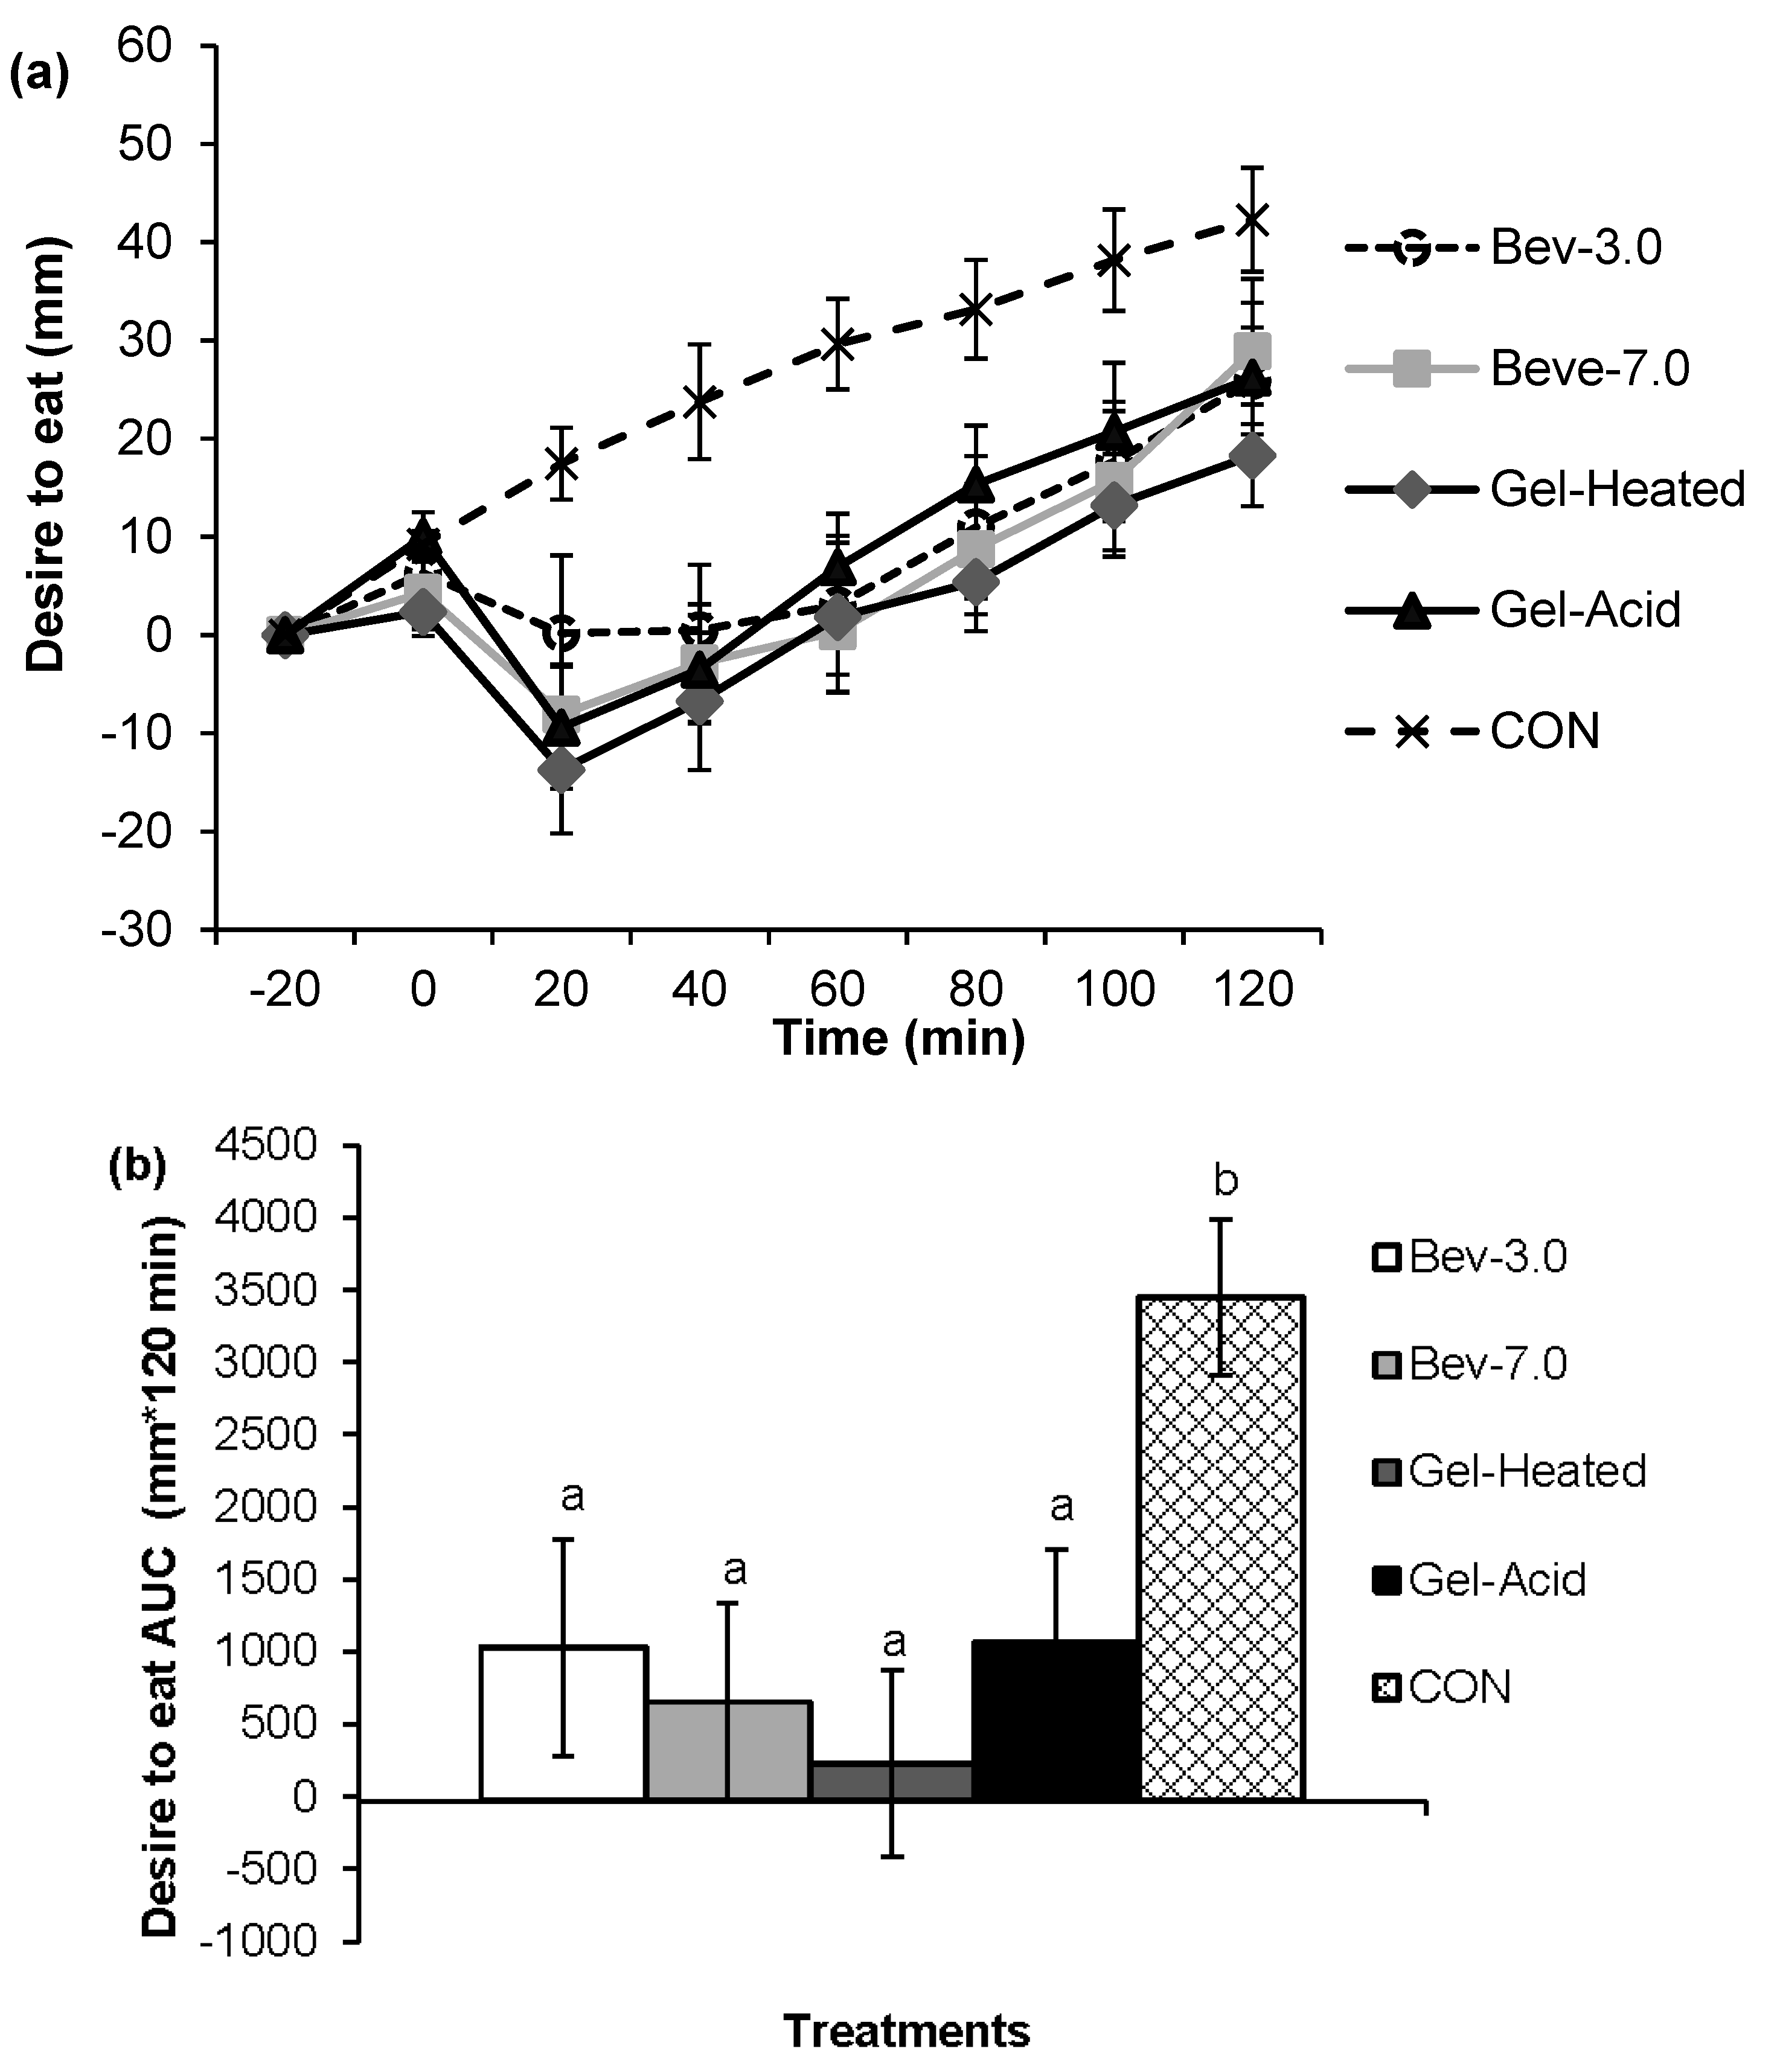
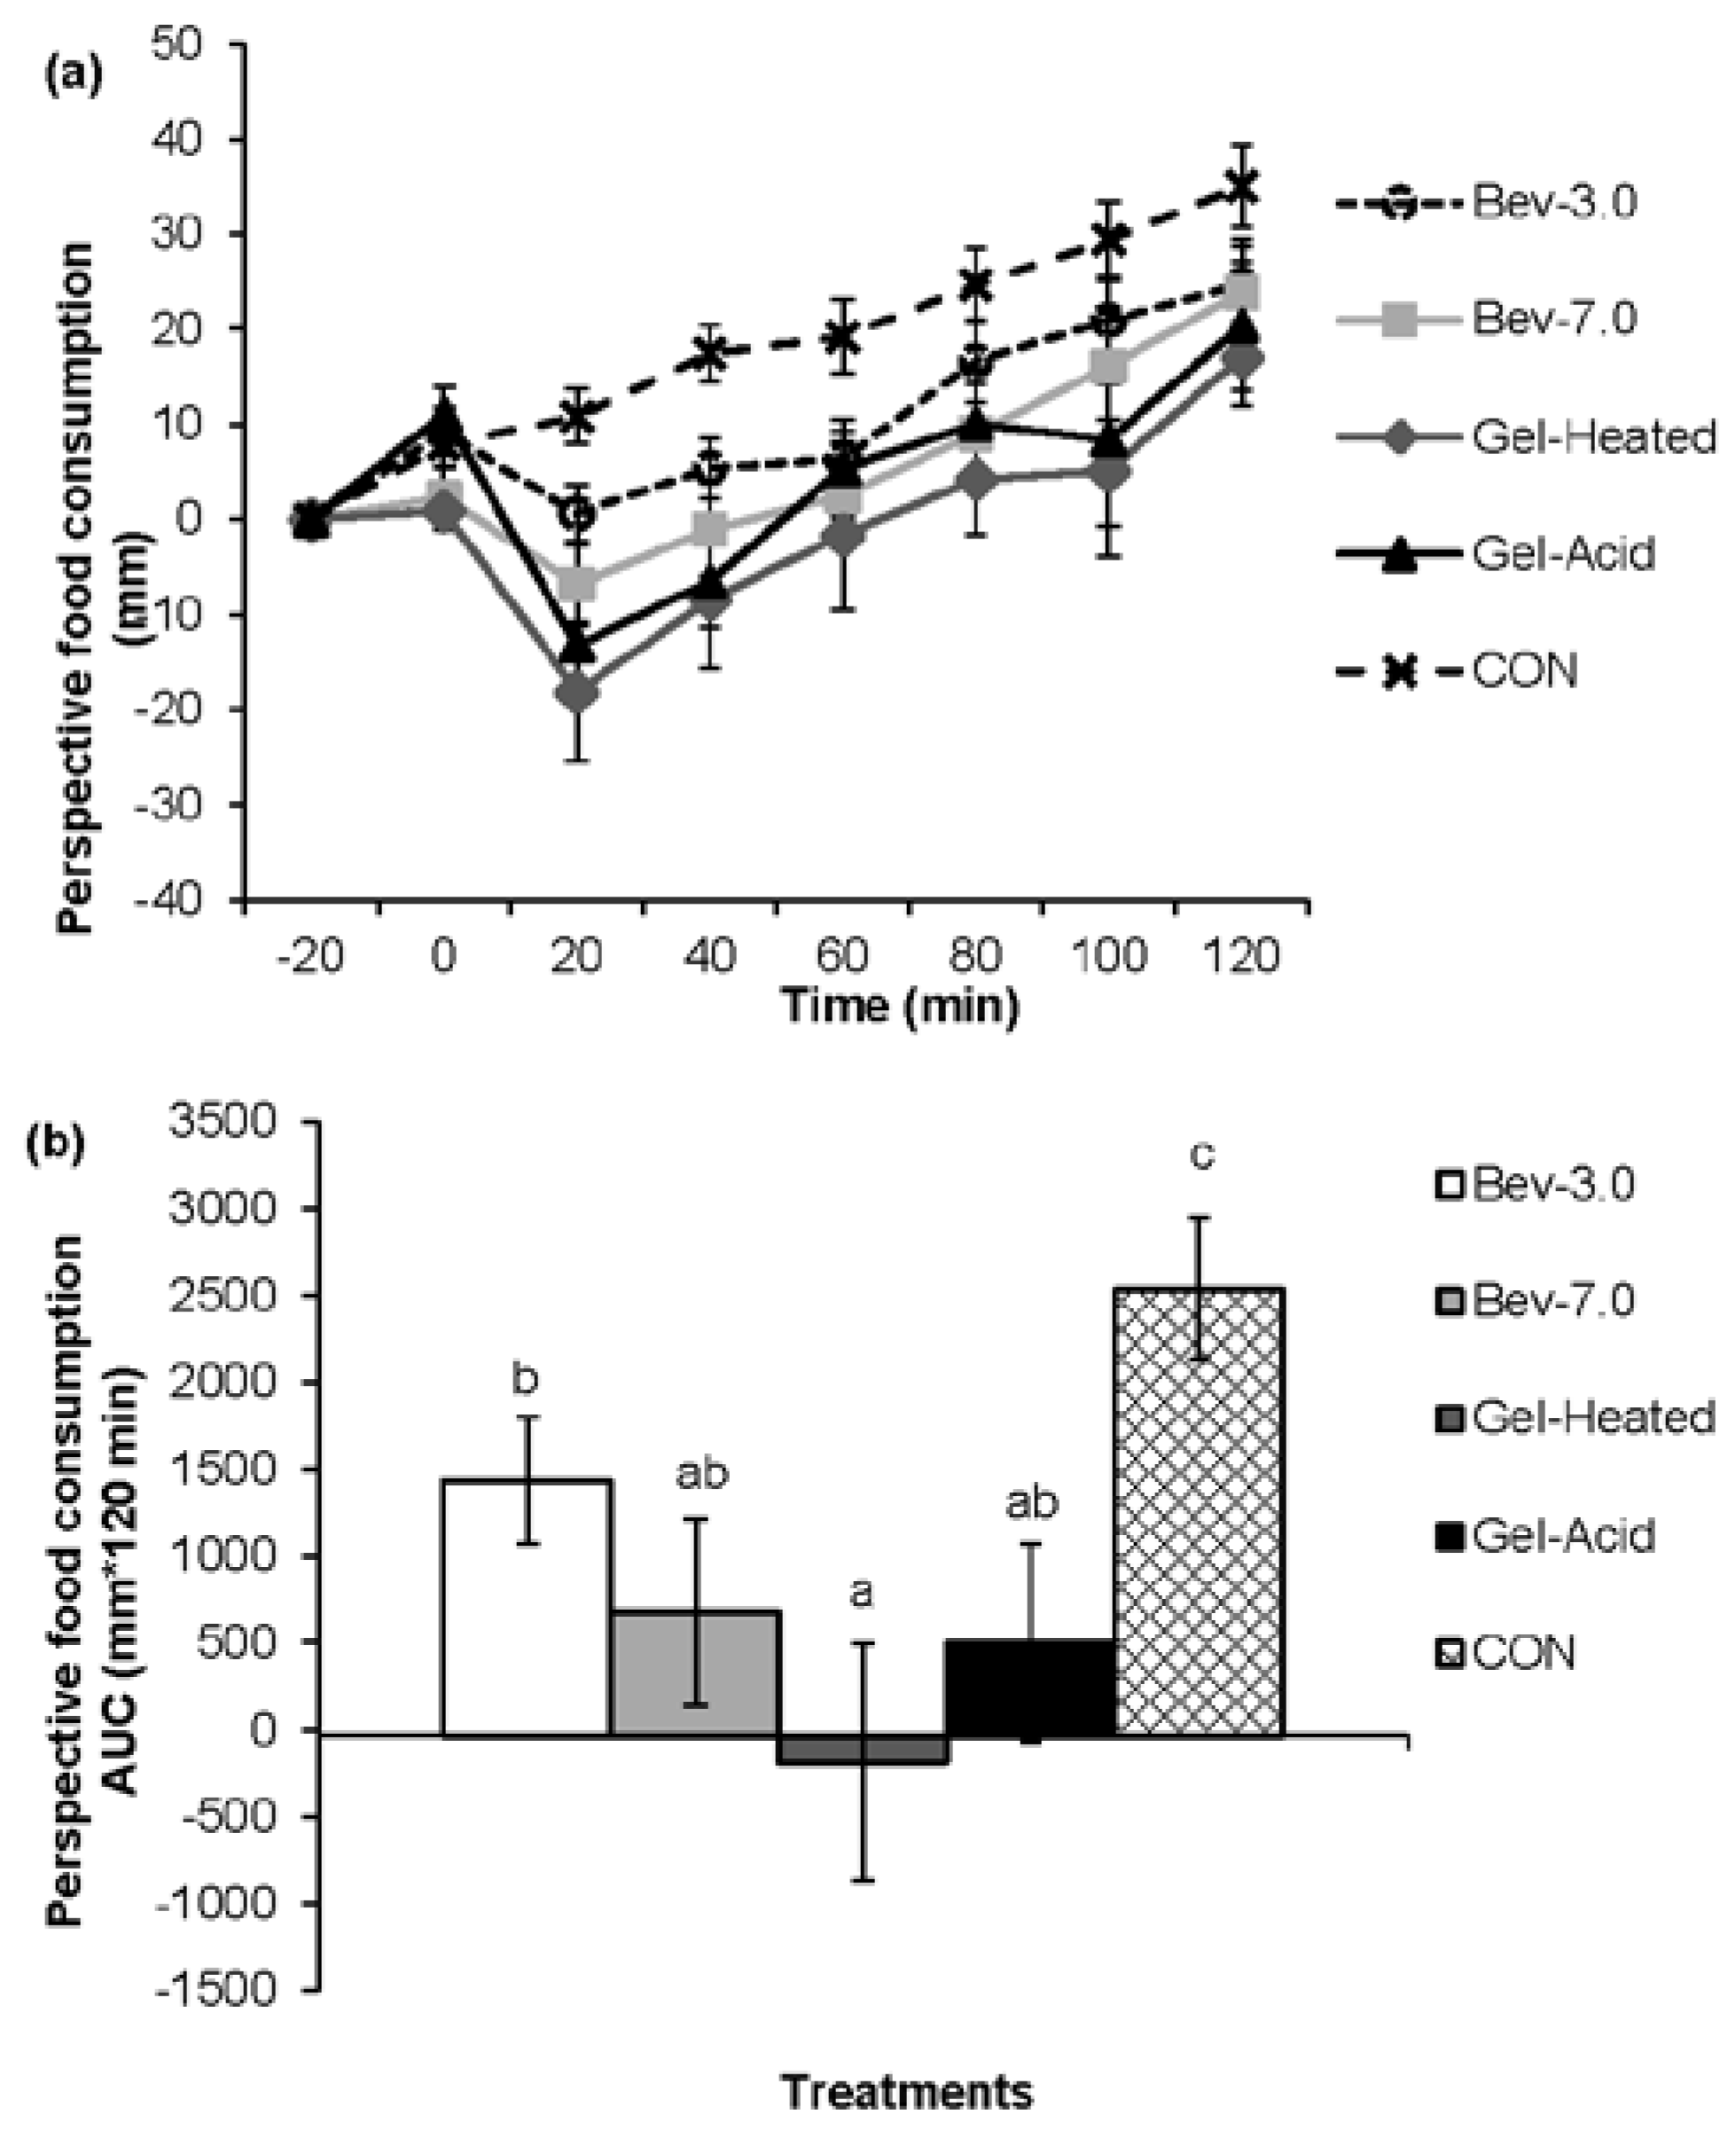
3.1. Appetite


3.2. Energy Intake

4. Discussion

5. Conclusions
Acknowledgments
Author Contributions
Conflicts of Interest
References
- Bendtsen, L.Q.; Lorenzen, J.K.; Bendsen, N.T.; Rasmussen, C.; Astrup, A. Effect of dairy proteins on appetite, energy expenditure, body weight, and composition: A review of the evidence from controlled clinical trials. Adv. Nutr. Int. Rev. J. 2013, 4, 418–438. [Google Scholar] [CrossRef] [PubMed]
- Leidy, H. Increased dietary protein as a dietary strategy to prevent and/or treat obesity. Mo. Med. 2013, 111, 54–58. [Google Scholar]
- Luhovyy, B.L.; Akhavan, T.; Anderson, G.H. Whey proteins in the regulation of food intake and satiety. J. Am. Coll. Nutr. 2007, 26, 704S–712S. [Google Scholar] [CrossRef] [PubMed]
- Veldhorst, M.A.; Nieuwenhuizen, A.G.; Hochstenbach-Waelen, A.; van Vught, A.J.; Westerterp, K.R.; Engelen, M.P.; Brummer, R.-J.M.; Deutz, N.E.; Westerterp-Plantenga, M.S. Dose-dependent satiating effect of whey relative to casein or soy. Physiol. Behav. 2009, 96, 675–682. [Google Scholar] [CrossRef] [PubMed]
- Bowen, J.; Noakes, M.; Clifton, P.M. Appetite regulatory hormone responses to various dietary proteins differ by body mass index status despite similar reductions in ad libitum energy intake. J. Clin. Endocrinol. Metab. 2006, 91, 2913–2919. [Google Scholar] [CrossRef] [PubMed]
- Hall, W.; Millward, D.; Long, S.; Morgan, L. Casein and whey exert different effects on plasma amino acid profiles, gastrointestinal hormone secretion and appetite. Br. J. Nutr. 2003, 89, 239–248. [Google Scholar] [CrossRef] [PubMed]
- Potier, M.; Darcel, N.; Tomé, D. Protein, amino acids and the control of food intake. Curr. Opin. Clin. Nutr. Metab. Care 2009, 12, 54–58. [Google Scholar] [CrossRef] [PubMed]
- Mattes, R. Fluid calories and energy balance: The good, the bad, and the uncertain. Physiol. Behav. 2006, 89, 66–70. [Google Scholar] [CrossRef] [PubMed]
- Pan, A.; Hu, F.B. Effects of carbohydrates on satiety: Differences between liquid and solid food. Curr. Opin. Clin. Nutr. Metab. Care 2011, 14, 385–390. [Google Scholar] [CrossRef] [PubMed]
- DiMeglio, D.P.; Mattes, R.D. Liquid versus solid carbohydrate: Effects on food intake and body weight. Int. J. Obes. 2000, 24, 794–800. [Google Scholar] [CrossRef]
- Leidy, H.J.; Bales-Voelker, L.I.; Harris, C.T. A protein-rich beverage consumed as a breakfast meal leads to weaker appetitive and dietary responses v. A protein-rich solid breakfast meal in adolescents. Br. J. Nutr. 2011, 106, 37–41. [Google Scholar] [CrossRef] [PubMed]
- Mourao, D.; Bressan, J.; Campbell, W.; Mattes, R. Effects of food form on appetite and energy intake in lean and obese young adults. Int. J. Obes. 2007, 31, 1688–1695. [Google Scholar] [CrossRef] [PubMed]
- Errington, A.D.; Foegeding, E.A. Factors determining fracture stress and strain of fine-stranded whey protein gels. J. Agric. Food Chem. 1998, 46, 2963–2967. [Google Scholar] [CrossRef]
- Boye, J.I.; Kalab, M.; Alli, I.; Ma, C.Y. Microstructural properties of heat-set whey protein gels: Effect of pH. LWT Food Sci. Technol. 2000, 33, 165–172. [Google Scholar] [CrossRef]
- Ikeda, S.; Morris, V.J. Fine-stranded and particulate aggregates of heat-denatured whey proteins visualized by atomic force microscopy. Biomacromolecules 2002, 3, 382–389. [Google Scholar] [CrossRef] [PubMed]
- Peram, M.R.; Loveday, S.M.; Ye, A.; Singh, H. In vitro gastric digestion of heat-induced aggregates of β-lactoglobulin. J. Dairy Sci. 2013, 96, 63–74. [Google Scholar] [CrossRef] [PubMed]
- Bateman, L.; Ye, A.; Singh, H. In vitro digestion of β-lactoglobulin fibrils formed by heat treatment at low ph. J. Agric. Food Chem. 2010, 58, 9800–9808. [Google Scholar] [CrossRef] [PubMed]
- Mackie, A.; Macierzanka, A. Colloidal aspects of protein digestion. Curr. Opin. Colloid Interface Sci. 2010, 15, 102–108. [Google Scholar] [CrossRef]
- Barbé, F.; Ménard, O.; le Gouar, Y.; Buffière, C.; Famelart, M.-H.; Laroche, B.; le Feunteun, S.; Dupont, D.; Rémond, D. The heat treatment and the gelation are strong determinants of the kinetics of milk proteins digestion and of the peripheral availability of amino acids. Food Chem. 2013, 136, 1203–1212. [Google Scholar] [CrossRef] [PubMed]
- O’Loughlin, I.B.; Murray, B.A.; Kelly, P.M.; FitzGerald, R.J.; Brodkorb, A. Enzymatic hydrolysis of heat-induced aggregates of whey protein isolate. J. Agric. Food Chem. 2012, 60, 4895–4904. [Google Scholar] [CrossRef] [PubMed]
- Zhang, S.; Vardhanabhuti, B. Effect of initial protein concentration and ph on in vitro gastric digestion of heated whey proteins. Food Chem. 2014, 145, 473–480. [Google Scholar] [CrossRef] [PubMed]
- Macierzanka, A.; Böttger, F.; Lansonneur, L.; Groizard, R.; Jean, A.-S.; Rigby, N.M.; Cross, K.; Wellner, N.; Mackie, A.R. The effect of gel structure on the kinetics of simulated gastrointestinal digestion of bovine β-lactoglobulin. Food Chem. 2012, 134, 2156–2163. [Google Scholar] [CrossRef] [PubMed]
- Douglas, S.M.; Ortinau, L.C.; Hoertel, H.A.; Leidy, H.J. Low, moderate, or high protein yogurt snacks on appetite control and subsequent eating in healthy women. Appetite 2013, 60, 117–122. [Google Scholar] [CrossRef] [PubMed]
- Flint, A.; Raben, A.; Blundell, J.; Astrup, A. Reproducibility, power and validity of visual analogue scales in assessment of appetite sensations in single test meal studies. Int. J. Obes. Relat. Metab. Disord. 2000, 24, 38–48. [Google Scholar] [CrossRef] [PubMed]
- Brouns, F.; Bjorck, I.; Frayn, K.; Gibbs, A.; Lang, V.; Slama, G.; Wolever, T. Glycaemic index methodology. Nutr. Res. Rev. 2005, 18, 145–171. [Google Scholar] [CrossRef] [PubMed]
- Zhang, S.; Zhang, Z.; Vardhanabhuti, B. Effect of charge density of polysaccharides on self-assembled intragastric gelation of whey protein/polysaccharide under simulated gastric conditions. Food Funct. 2014, 5, 1829–1838. [Google Scholar] [CrossRef] [PubMed]
- Hur, S.J.; Lim, B.O.; Decker, E.A.; McClements, D.J. In vitro human digestion models for food applications. Food Chem. 2011, 125, 1–12. [Google Scholar] [CrossRef]
- Veldhorst, M.; Smeets, A.; Soenen, S.; Hochstenbach-Waelen, A.; Hursel, R.; Diepvens, K.; Lejeune, M.; Luscombe-Marsh, N.; Westerterp-Plantenga, M. Protein-induced satiety: Effects and mechanisms of different proteins. Physiol. Behav. 2008, 94, 300–307. [Google Scholar] [CrossRef] [PubMed]
- Tieken, S.; Leidy, H.; Stull, A.; Mattes, R.; Schuster, R.; Campbell, W. Effects of solid versus liquid meal-replacement products of similar energy content on hunger, satiety, and appetite-regulating hormones in older adults. Horm. Metab. Res. 2007, 39, 389–394. [Google Scholar] [CrossRef] [PubMed]
- Mattes, R.D.; Campbell, W.W. Effects of food form and timing of ingestion on appetite and energy intake in lean young adults and in young adults with obesity. J. Am. Diet. Assoc. 2009, 109, 430–437. [Google Scholar] [CrossRef] [PubMed]
- Kissileff, H.R. Effects of physical state (liquid-solid) of foods on food intake: Procedural and substantive contributions. Am. J. Clin. Nutr. 1985, 42, 956–965. [Google Scholar] [PubMed]
- Pal, S.; Ellis, V. The acute effects of four protein meals on insulin, glucose, appetite and energy intake in lean men. Br. J. Nutr. 2010, 104, 1241–1248. [Google Scholar] [CrossRef] [PubMed]
- Akhavan, T.; Luhovyy, B.L.; Brown, P.H.; Cho, C.E.; Anderson, G.H. Effect of premeal consumption of whey protein and its hydrolysate on food intake and postmeal glycemia and insulin responses in young adults. Am. J. Clin. Nutr. 2010, 91, 966–975. [Google Scholar] [CrossRef] [PubMed]
- Almiron-Roig, E.; Flores, S.Y.; Drewnowski, A. No difference in satiety or in subsequent energy intakes between a beverage and a solid food. Physiol. Behav. 2004, 82, 671–677. [Google Scholar] [CrossRef] [PubMed]
- Akhavan, T.; Luhovyy, B.; Anderson, G. Effect of drinking compared with eating sugars or whey protein on short-term appetite and food intake. Int. J. Obes. 2010, 35, 562–569. [Google Scholar] [CrossRef] [PubMed]
- Bowen, J.; Noakes, M.; Clifton, P.M. Appetite hormones and energy intake in obese men after consumption of fructose, glucose and whey protein beverages. Int. J. Obes. 2007, 31, 1696–1703. [Google Scholar] [CrossRef] [PubMed]
© 2015 by the authors; licensee MDPI, Basel, Switzerland. This article is an open access article distributed under the terms and conditions of the Creative Commons by Attribution (CC-BY) license (http://creativecommons.org/licenses/by/4.0/).
Share and Cite
Zhang, S.; Leidy, H.J.; Vardhanabhuti, B. Protein Beverage vs. Protein Gel on Appetite Control and Subsequent Food Intake in Healthy Adults. Nutrients 2015, 7, 8700-8711. https://0-doi-org.brum.beds.ac.uk/10.3390/nu7105421
Zhang S, Leidy HJ, Vardhanabhuti B. Protein Beverage vs. Protein Gel on Appetite Control and Subsequent Food Intake in Healthy Adults. Nutrients. 2015; 7(10):8700-8711. https://0-doi-org.brum.beds.ac.uk/10.3390/nu7105421
Chicago/Turabian StyleZhang, Sha, Heather J. Leidy, and Bongkosh Vardhanabhuti. 2015. "Protein Beverage vs. Protein Gel on Appetite Control and Subsequent Food Intake in Healthy Adults" Nutrients 7, no. 10: 8700-8711. https://0-doi-org.brum.beds.ac.uk/10.3390/nu7105421