Review

Vitamin D and Graves’ Disease: A Meta-Analysis Update

1
Department of Nutrition, Aerospace Center Hospital, Beijing 100049, China
2
School of Public Health, Peking University, Beijing 100191, China
3
Department of Respiratory, Aerospace Center Hospital, Beijing 100049, China
*
Authors to whom correspondence should be addressed.
Nutrients 2015, 7(5), 3813-3827; https://0-doi-org.brum.beds.ac.uk/10.3390/nu7053813
Submission received: 18 April 2015 / Revised: 11 May 2015 / Accepted: 12 May 2015 / Published: 21 May 2015

Abstract

:
The association between vitamin D levels and Graves’ disease is not well studied. This update review aims to further analyze the relationship in order to provide an actual view of estimating the risk. We searched for the publications on vitamin D and Graves’ disease in English or Chinese on PubMed, EMBASE, Chinese National Knowledge Infrastructure, China Biology Medical and Wanfang databases. The standardized mean difference (SMD) and 95% confidence interval (CI) were calculated for the vitamin D levels. Pooled odds ratio (OR) and 95% CI were calculated for vitamin D deficiency. We also performed sensitivity analysis and meta-regression. Combining effect sizes from 26 studies for Graves’ disease as an outcome found a pooled effect of SMD = −0.77 (95% CI: −1.12, −0.42; p < 0.001) favoring the low vitamin D level by the random effect analysis. The meta-regression found assay method had the definite influence on heterogeneity (p = 0.048). The patients with Graves’ disease were more likely to be deficient in vitamin D compared to the controls (OR = 2.24, 95% CI: 1.31, 3.81) with a high heterogeneity (I2 = 84.1%, p < 0.001). We further confirmed that low vitamin D status may increase the risk of Graves’ disease.

1. Introduction

Graves’ disease is an autoimmune thyroid disease characterized in its typical presentation by the unique association of thyrotoxicosis, goiter and ophthalmopathy [1]. As one of the most frequent diseases among autoimmune disorders, an annual incidence of Graves’ disease was approximately 14 per 100,000 [2].
Graves’ disease is a multifactorial disease caused by a complex interaction between genetic and environmental factors that lead to the loss of immune tolerance to thyroid antigens, and therefore to the initiation of an immune reaction against the thyroid. For example, vitamin D receptor (VDR) gene polymorphisms were found to be associated with the risk for Graves’ disease [3].
Several studies also explored the association between vitamin D levels and Graves’ disease [4,5,6,7,8,9,10,11,12,13,14,15,16,17]. The results of some studies demonstrated that the patients with Graves’ disease had lower vitamin D levels or higher prevalence of vitamin D deficiency, suggesting that low levels of serum vitamin D was associated with Graves’ disease [5,6,7,8,10,11,12,13,14,15], while other studies did not find that vitamin D deficiency increased the risk of Graves’ disease [4,9]. The association between vitamin D levels and Graves’ disease is still under debate. Wang et al. [18] conducted the meta-analysis of the association between vitamin D and autoimmune thyroid disease, including the Graves’ disease with 13 studies [13,19,20,21,22,23,24,25,26,27,28,29,30,31]. However, the study [18] neither included enough references nor analyzed the sources of high heterogeneity. So the relationship needs to be further evaluated.
This update review aims to analyze the association between vitamin D levels and Graves’ disease in order to provide an actual view of estimating the risk.

2. Methods

2.1. Search Strategy

We searched for publications on vitamin D and Graves’ disease in English or Chinese. PubMed, EMBASE, Chinese National Knowledge Infrastructure (CNKI), China Biology Medical (CBM) and Wanfang databases were searched (up to April 15 2015) by two investigators, independently. The MeSH search terms were adapted: “Vitamin D”, “25 Hydroxyvitamin D”, “25 Hydroxyvitamin D3” in combination with “autoimmune thyroid disease” or “Graves’ disease”.

2.2. Inclusion/Exclusion Criteria

All the studies identified were reviewed independently by two investigators and the studies were included if they fulfilled the following criteria: (1) a case-control study or cohort study was reported; (2) the cases were diagnosed as Graves’ disease and the control group was composed of healthy individuals; (3) quantitative or qualitative vitamin D levels were described in the references. The references were excluded from the meta-analysis as follows: (1) the study was not related to Graves’ diseases; (2) the reference did not describe the vitamin D level in the two groups; (3) the reference consisted of duplicate data or publications from the included studies. The Newcastle-Ottawa Quality Assessment Scale was used to assess the quality of the studies included in the meta-analysis and performed by two reviewers with a third reviewer consulted in case of discrepancy.

2.3. Data Extraction

The information were extracted from the included studies using a standard form by the two reviewers. Any disagreement was resolved by discussion between the two reviewers. If consensus could not be reached, a third reviewer was consulted. The standard form included the variables as follows: the author, publication years, the study period, the study country, the mean age of case and control groups, the sample sizes of two groups, assay method of vitamin D, the detection index, the vitamin D concentrations (ng/mL) in the two groups (nmol/L to ng/mL by dividing by 2.5) or the number of vitamin D deficiency in the two groups and the cutoff for defining vitamin D deficiency.

2.4. Outcomes Measures

The primary outcome was the vitamin D level; the secondary outcome was the vitamin D deficiency. Comparisons were performed between the Graves’ cases and control population.

2.5. Statistical Analysis
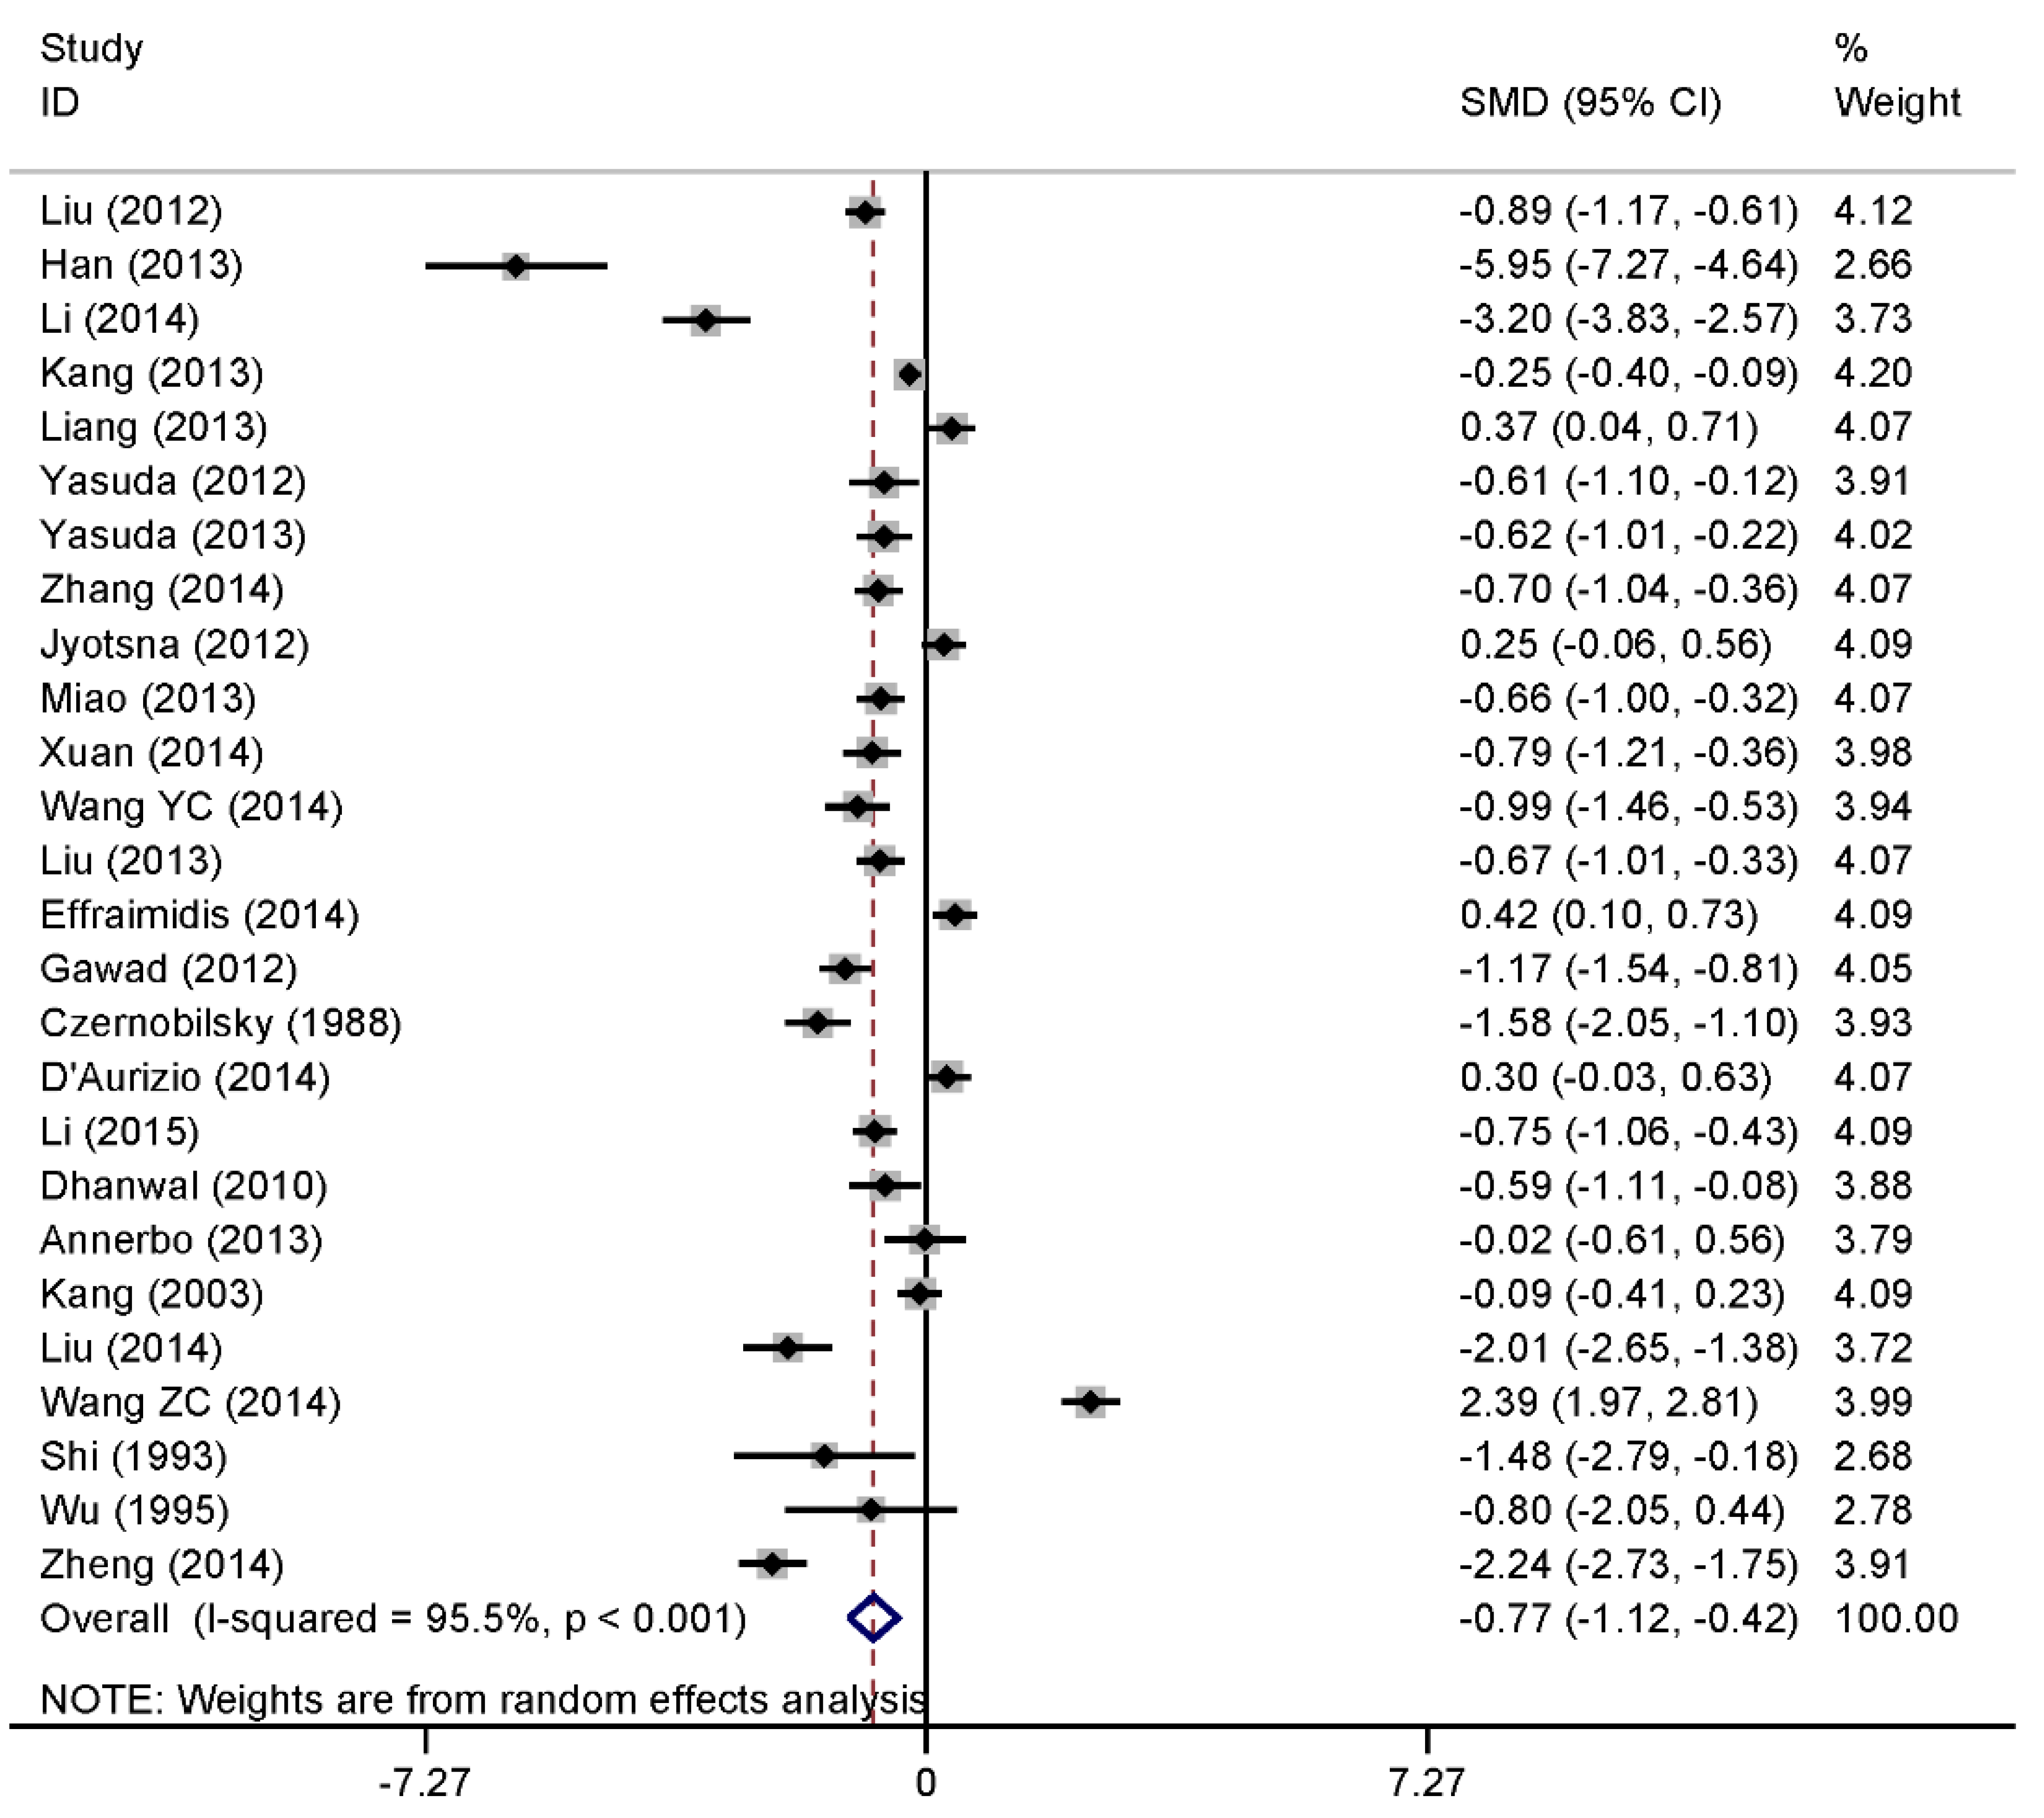
The median and range were used to estimate the mean and variance with the method by Hozo et al. [32]. Heterogeneity among the studies was assessed using the Cochran Q and the I2 statistic. For the Q statistic, p < 0.10 indicates statistically significant heterogeneity. For the I2 statistic, I2 > 50% indicates a large heterogeneity. Fixed-effects model with Mantel-Haenszel method was used if Q statistic (p < 0.10) or I2 < 0.05; otherwise, random effects model was used. The standardized mean difference (SMD) and 95% confidence interval (CI) were calculated for the primary outcome. Pooled odds ratio (OR) and 95% CI were calculated for the secondary outcome. In case of heterogeneity, subgroup analysis was conducted. The Egger weighted regression test was used to statistically assess publication bias (p < 0.05 was considered as indicative of statistically significant publication bias). All statistical analyses were performed using Stata 12.0 (Stata Corp LP, College Station, TX, USA).

3. Results

In our study, we initially searched 501 related references, among which 171 were duplicates. When removing the duplicates and other unrelated references (insufficient data about the vitamin D and disease definition unrelated to the Graves’ disease in the references), 27 references met our inclusion criteria and were recruited in the meta-analysis (Figure 1). According to the data type, 26 and 13 references were used as continuous data and categorical data on the meta-analysis of vitamin D and Graves’ disease, respectively.

3.1. Information of the Included Studies

The information of the included studies were listed in Table 1. Most studies were published after 2012 (63.0%, 17/27) and from China (66.7%, 18/27). There were 3716 study subjects, including 1770 (47.6%) cases with Graves’ disease and 1946 (52.4%) controls. All studies received a score of more than or equal to six, indicating good quality.
Figure 1. The flow diagram of the study selection.
Nutrients 07 03813 g001

3.2. Continuous Data of Vitamin D Level and Graves’ Disease

The analysis included 26 studies involving 1748 cases and 1848 controls. Combining effect sizes from 26 studies for Graves’ disease as an outcome found a pooled effect of SMD = −0.77 (95% CI: −1.12, −0.42; p < 0.001) favoring the low vitamin D level of patients with Graves’ disease by the random effect analysis (Figure 2), which was statistically significant compared to the control group. However, a high degree of heterogeneity was found (I2 = 95.5%, p < 0.001).

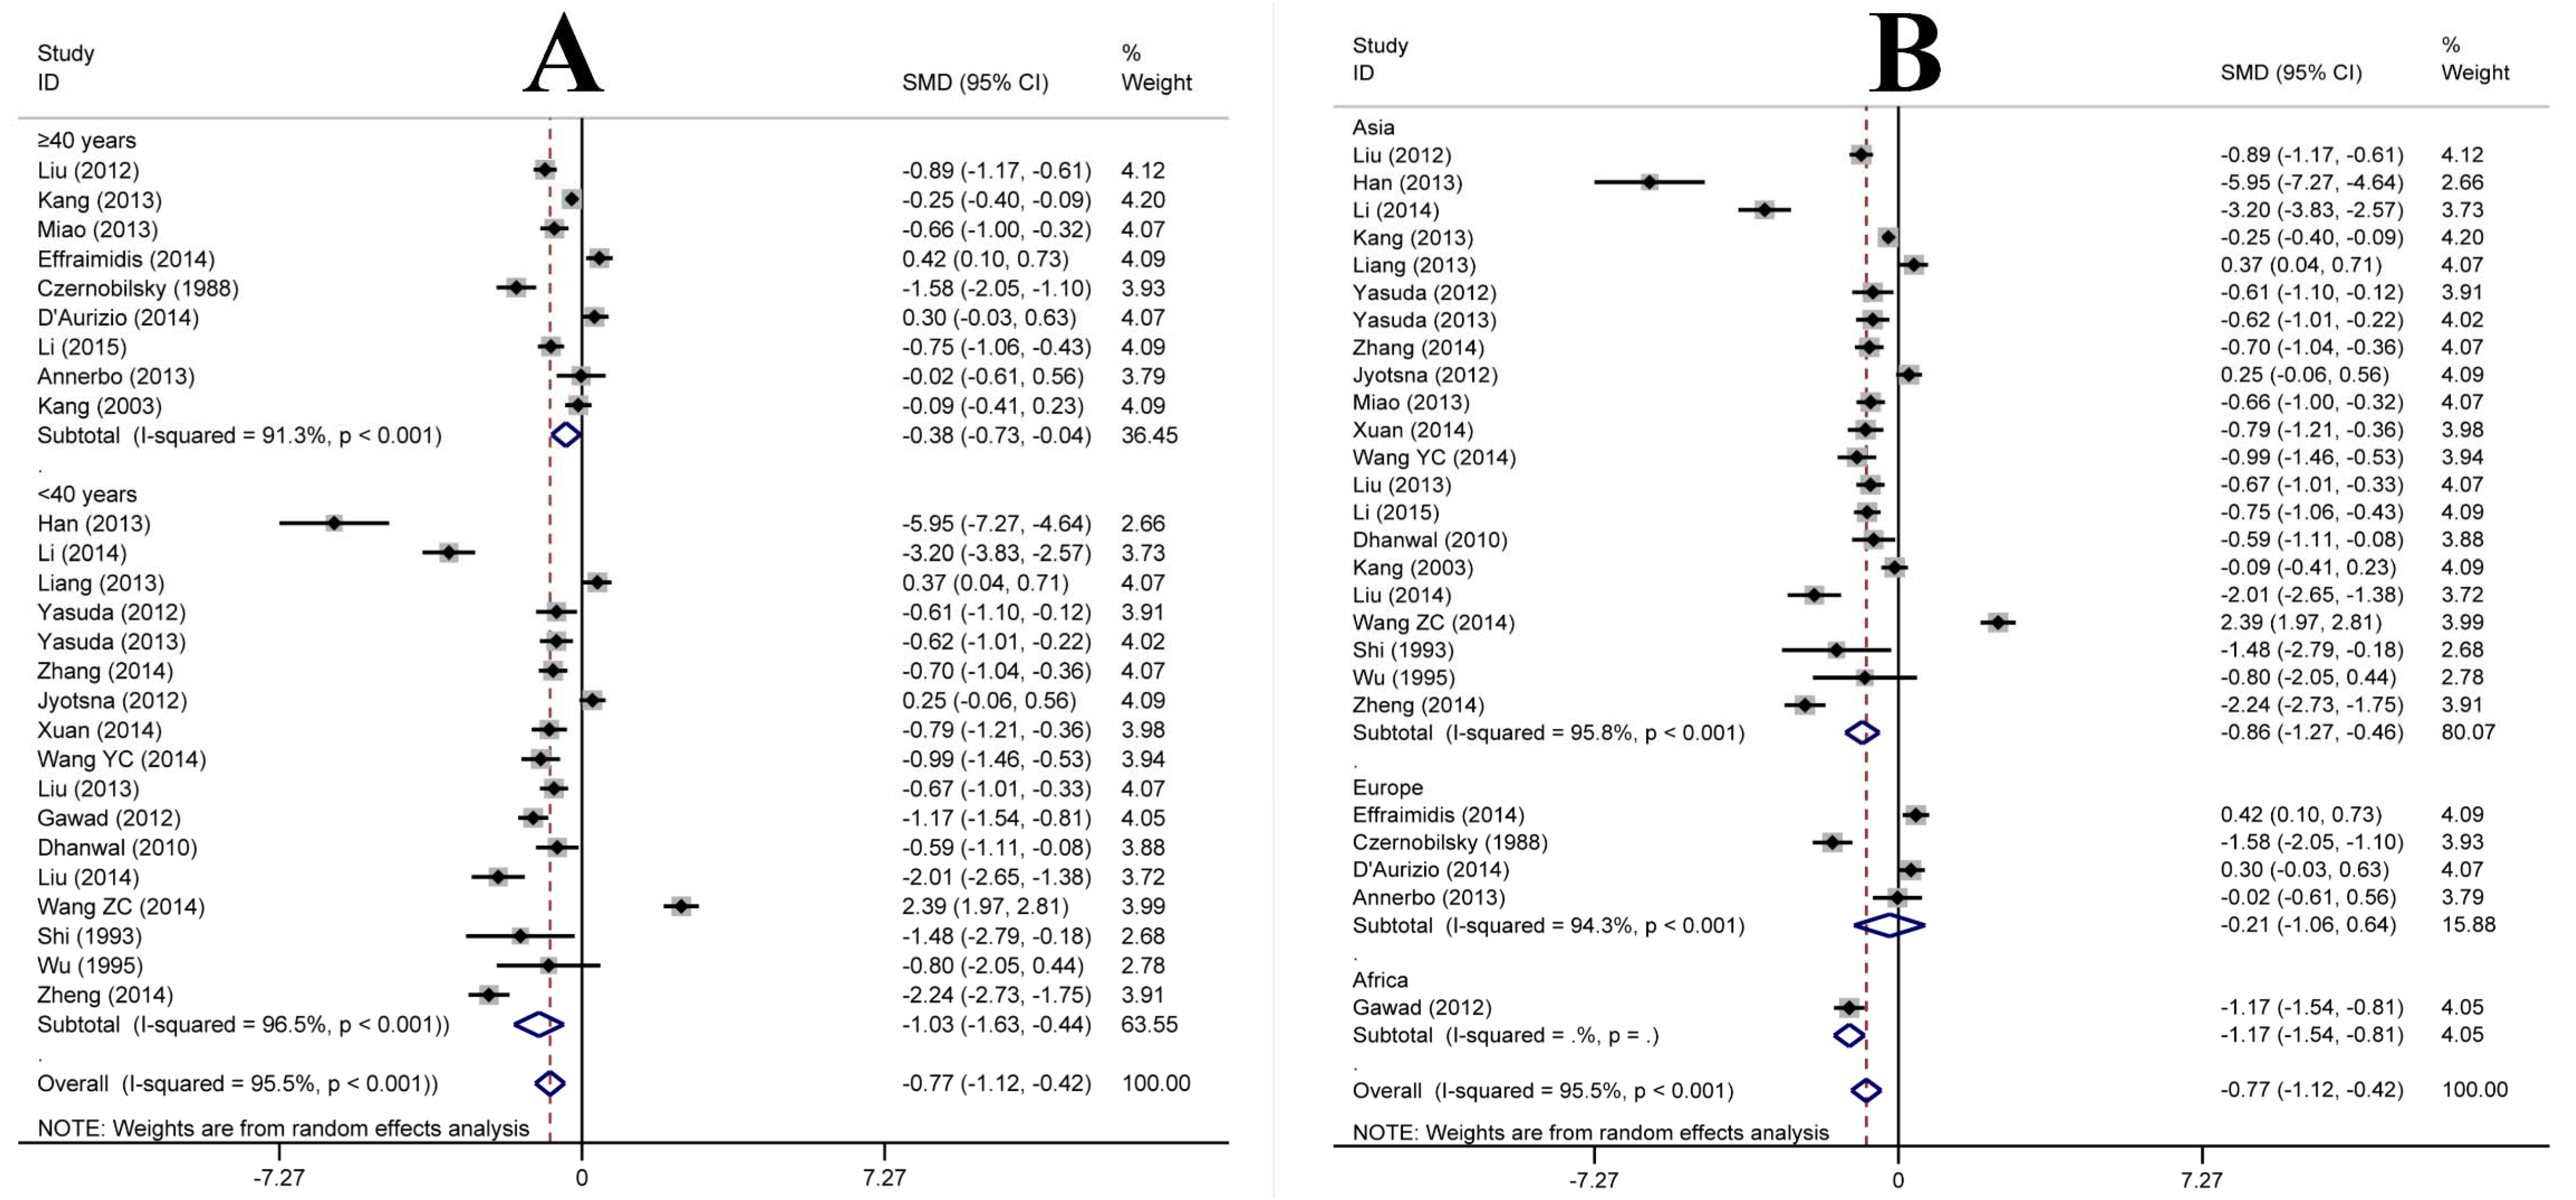
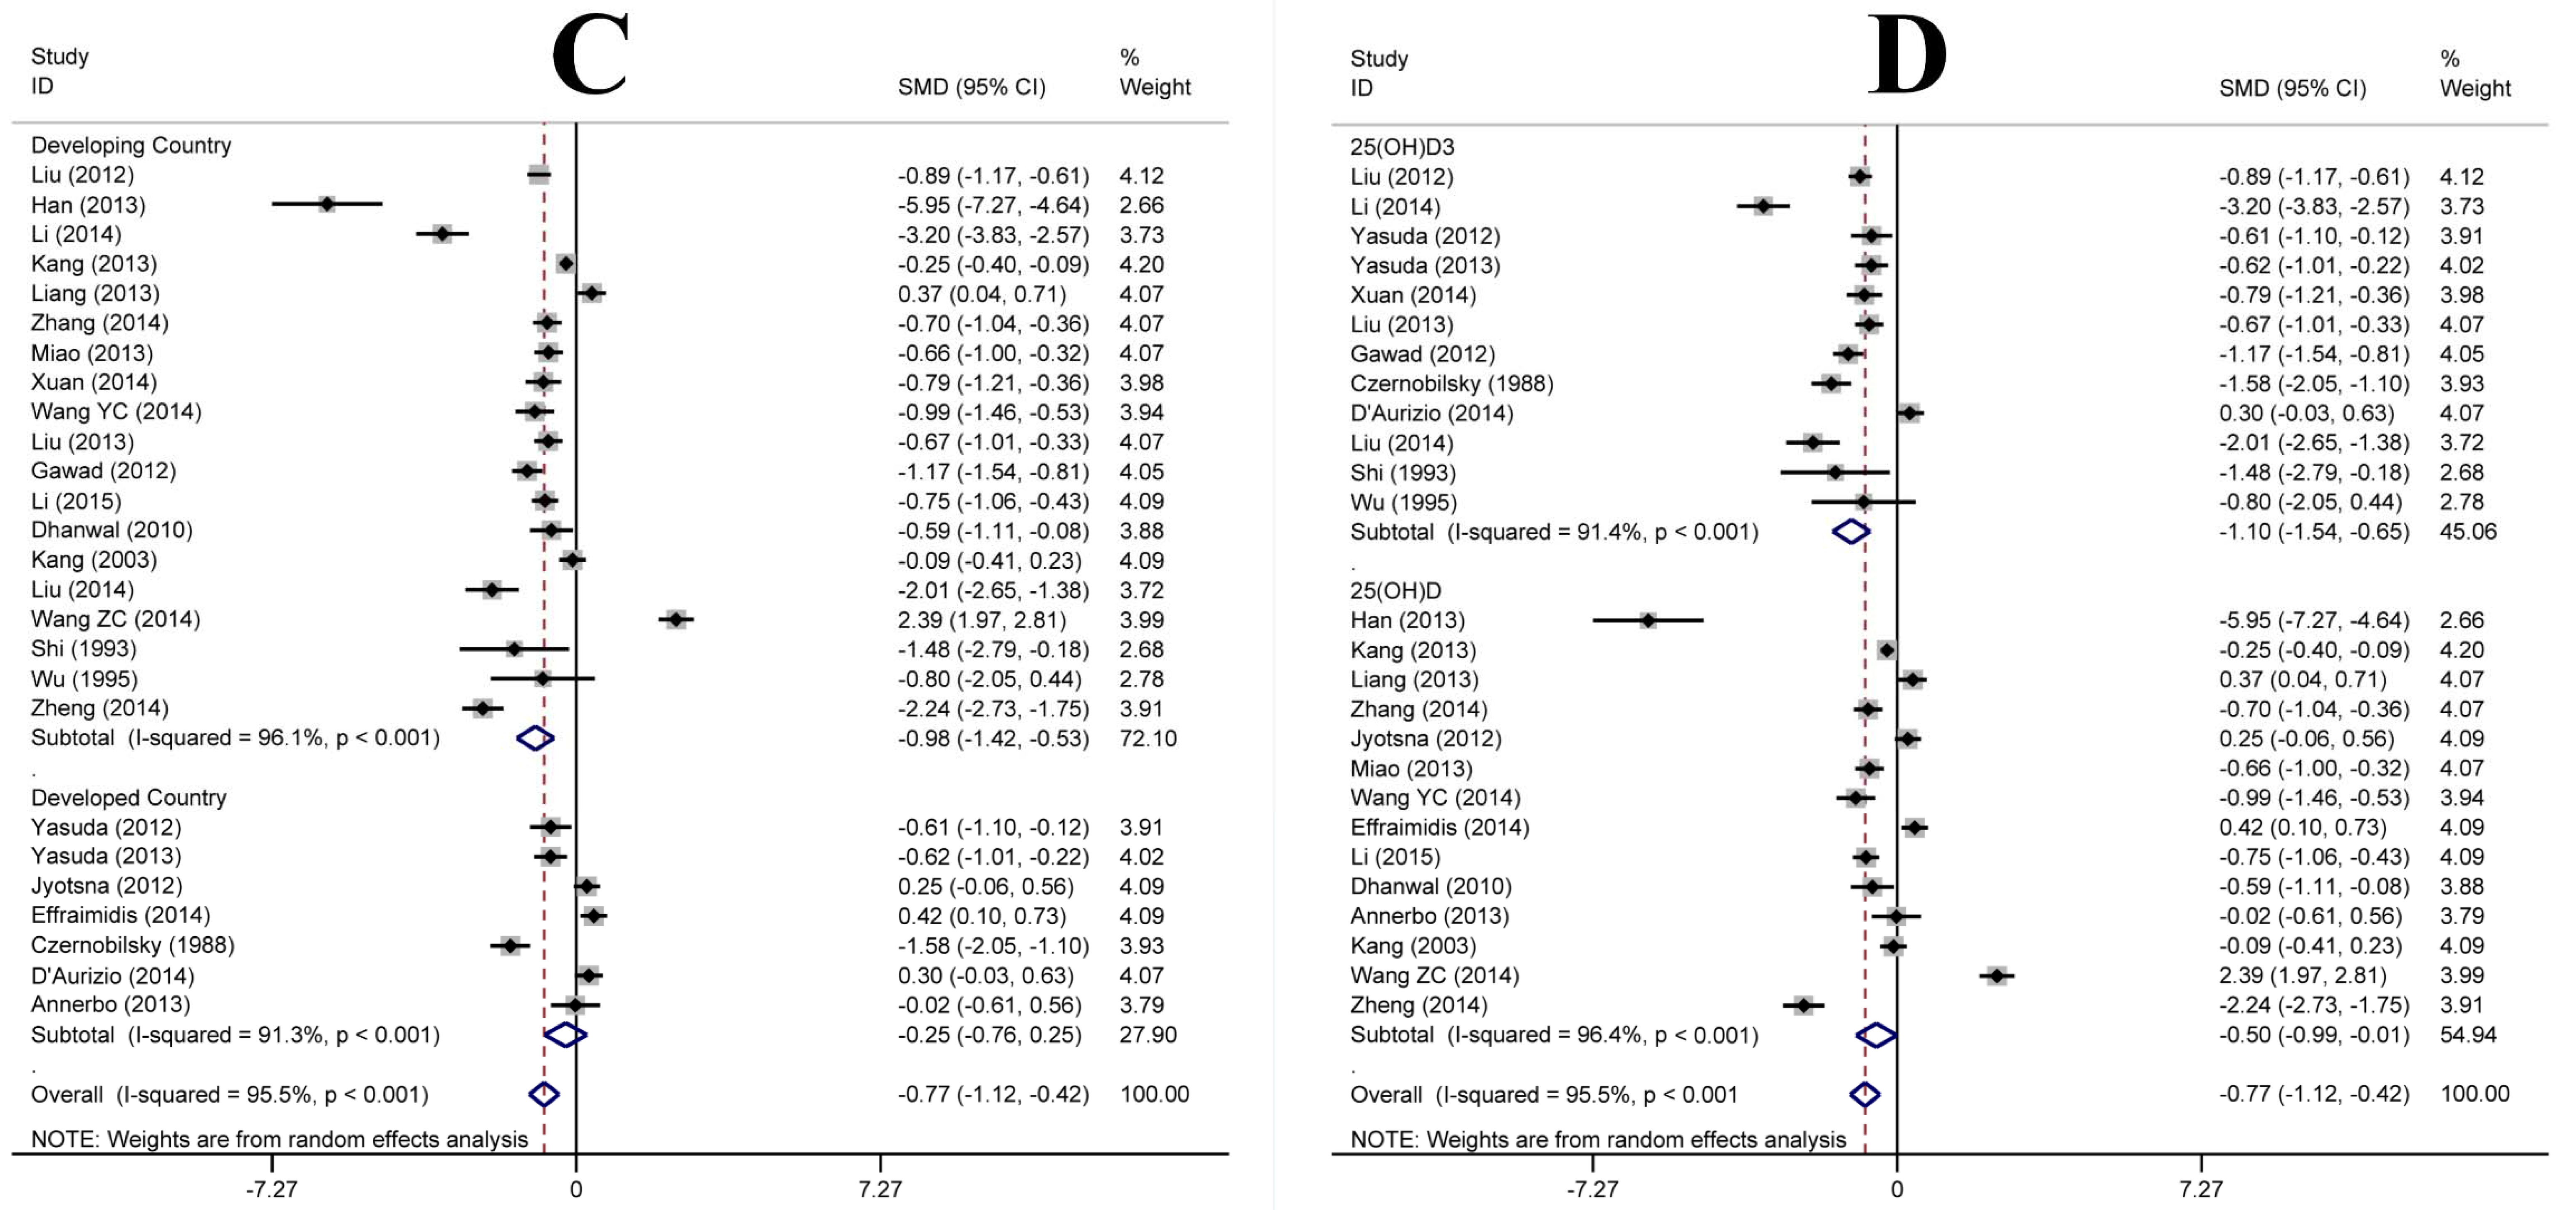
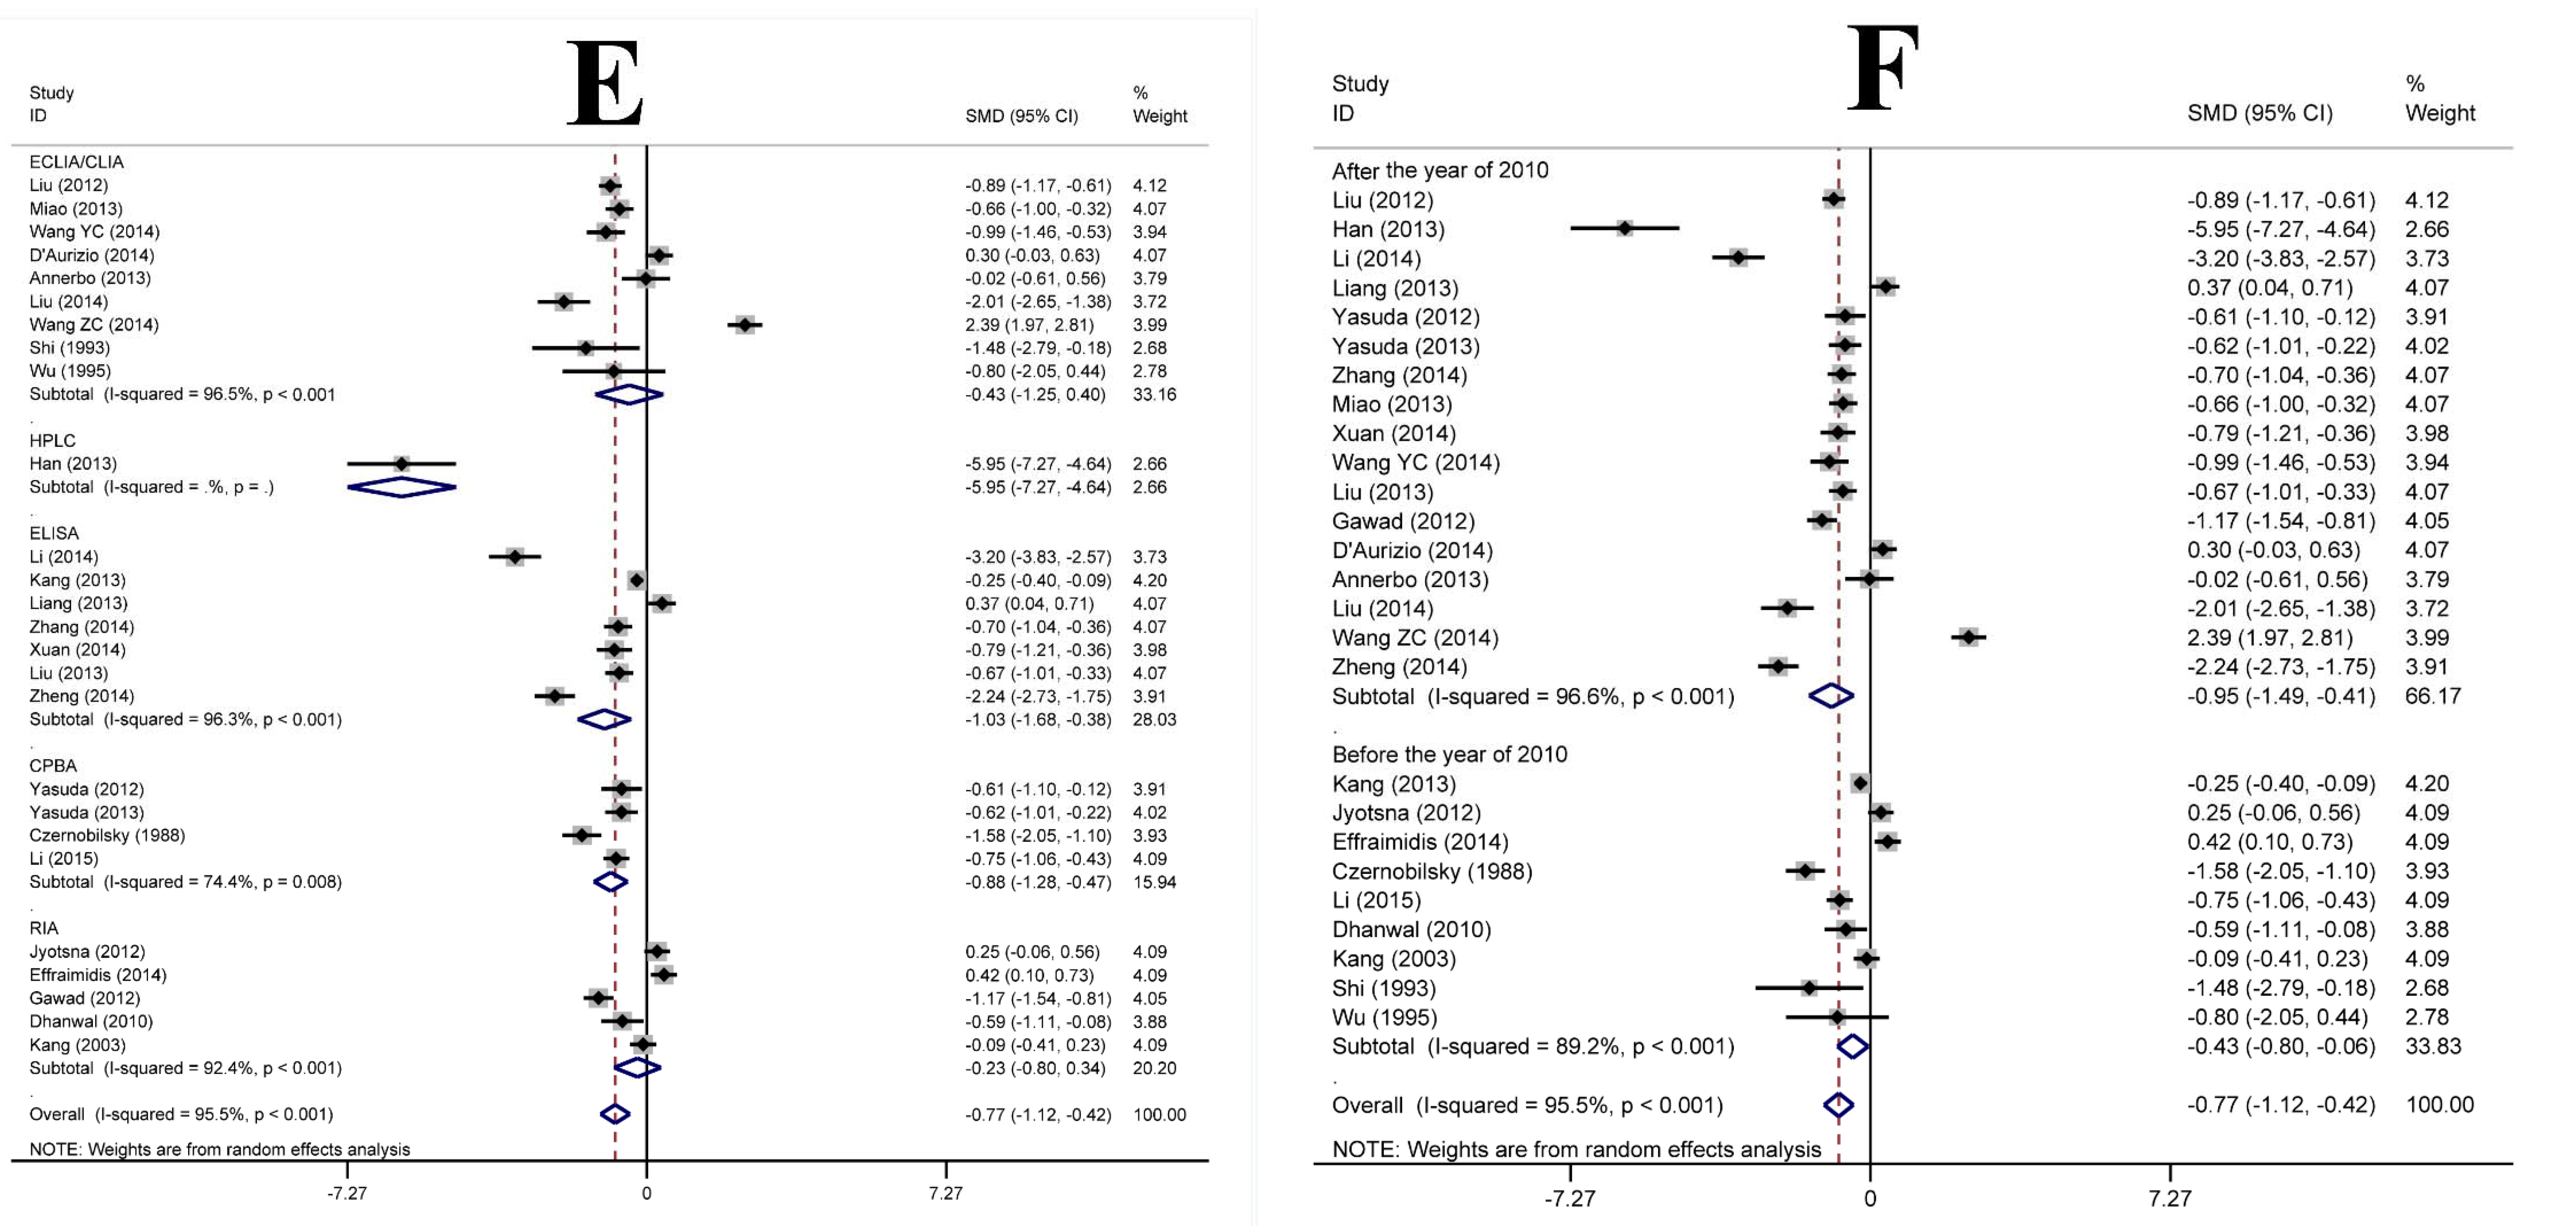
3.3. Subgroup Analysis

We performed subgroup analysis to analyze the sources of heterogeneity (Figure 3). Six factors were used for subgroup analysis, including mean age of case group (≥40/<40 years) (Figure 3A), geographic location (Asia/Europe/Africa) (Figure 3B), country type (developed/developing) (Figure 3C), detection index (25(OH)D/25(OH)D3) (Figure 3D), assay method (ELISA/ECLIA/RIA/CPBA/HPLC) (Figure 3E) and study period (before/after 2010) (Figure 3F). Figure 3 A–F shows that the heterogeneity remained high (>80%) in all subgroups, although a slight decrease occurred in the subgroups of assay method (Figure 3E). Interestingly, the SMDs were −0.21 (95% CI: −1.06, 0.64) in Europe, −0.86 (95% CI: −1.27, −0.46) in Asia, and −1.17 (95% CI: −1.54, −0.81), respectively.
Table 1. The characteristics of the included studies in the meta-analysis.
No.First AuthorYearCountryStudy YearAge of Patients (Mean ± SD)Detection IndexAssay MethodSample Size (Case/Control)Quality Score *
1Li et al. [26]2015China/Jiangsu201041 ± 1025(OH)DCPBA128/609
2Li et al. [5]2014China/Shanxi2011–201234 ± 1425(OH)D3ELISA40/508
3Zhang et al. [13]2015China/Hunan2012–201234 ± 1225(OH)DELISA70/708
4Xuan et al. [10]2014China/Jiangsu2013–201433 ± 1225(OH)D3ELISA47/457
5Wang Y.C. et al. [8]2014China/Anhui201335 ± 825(OH)DECLIA60/307
6Effraimidis et al. [24]2012Netherland200342 ± 1325(OH)DRIA78/789
7D’Aurizio et al. [22]2015Italy201447 ± 1625(OH)D3CLIA48/1269
8Liu et al. [27]2014China/Hebei201334 ± 1125(OH)D3ECLIA35/249
9Wang Z.S. et al. [9]2014China/Hainan2012–201332 ± 525(OH)DECLIA62/917
10Zheng et al. [17]2014China/Zhejiang2010–201136 ± 825(OH)DELISA72/397
11Han et al. [16]2013China/Guangdong2012–201336 ± 725(OH)DHPLC30/207
12Kang et al. [14]2013China/Shandong2009–201043 ± 825(OH)DELISA280/4397
13Liang et al. [31]2013China/Hunan2012–201234 ± 1225(OH)DELISA70/709
14Yasuda et al. [12]2013Japan201138 ± 725(OH)D3CPBA54/498
15Miao et al. [7]2013China/Liaoning2011–201240 ± 1525(OH)DECLIA70/709
16Liu et al. [28]2013China/Jiangsu2011–201237 ± 1125(OH)D3ELISA118/509
17Annerbo et al. [20]2014Sweden2009–201241 ± 1425(OH)DECLIA56/149
18Liu et al. [6]2012China/Henan2010–201142 ± 925(OH)D3ECLIA80/1658
19Yasuda et al. [11]2012Japan201137 ± 1325(OH)D3CPBA26/468
20Jyotsna et al. [4]2012India2006–200836 ± 1125(OH)DRIA80/807
21Abd El Gawad et al. [19]2012Egypt201138 ± 525(OH)D3RIA90/559
22Kivity et al. [15]2011Israel200645 ± 1625(OH)DECLIA22/988
23Dhanwal et al. [23]2010India201034 ± 925(OH)DRIA30/318
24Kang et al. [25]2003China/Tianjin200045 ± 1225(OH)DRIA74/807
25Wu et al. [30]1995China/Shanghai1990NA25(OH)D3ECLIA6/56
26Shi et al. [29]1993China/Shanghai199132 ± 425(OH)D3ECLIA6/67
27Czernobilsky et al. [21]1988Germany198840 ± 1025(OH)D3CPBA38/559
ELISA, enzyme-linked immunosorbent assay; HPLC, high performance liquid chromatography; ECLIA, electrochemiluminescence immunoassay; CLIA, chemiluminescent immunoassay method; CPBA, competitive protein binding assay; RIA, radioimmunoassay; NA, no data in the reference; SD, standard deviation; * The quality score was evaluated by the Cochrane’s Newcastle-Ottawa Scale evaluation standard for case-control study.
Figure 2. Forest plot of the studies comparing the association between vitamin D levels and Graves’ disease by meta-analysis with the random effects analysis. SMD, standardized mean difference.
Nutrients 07 03813 g002
Figure 3. Forest plot of the studies comparing the association between vitamin D levels and Graves’ disease in the subgroups by meta-analysis with the random effects analysis. SMD, standardized mean differences; (A) mean age group; (B) geographic location; (C) country type; (D) detection index; (E) assay method; (F) study period.
Nutrients 07 03813 g003aNutrients 07 03813 g003bNutrients 07 03813 g003c

3.4. Meta Regression Analysis

A meta-regression was performed further to explore the possible sources of the heterogeneity. We put the six factors in the subgroup analysis into the meta-regression. As shown in Table 2, none of the six factors had any definite influence on heterogeneity except for assay method (p = 0.048).
Table 2. Meta-regression of the six factors.
FactorCoefficientSE95% CItp
Age−0.180.65−1.541.17−0.290.779
Geographic location0.110.6−1.151.370.180.858
Country type−1.330.73−2.850.19−1.830.083
Detection index−0.600.58−1.800.61−1.040.312
Assay method −0.580.27−1.16−0.01−2.110.048
Study period−0.530.64−1.860.81−0.820.420
Constant4.752.33−0.139.632.040.056
SE, standard error; CI, confidence interval; t, t-value; p, p-value.

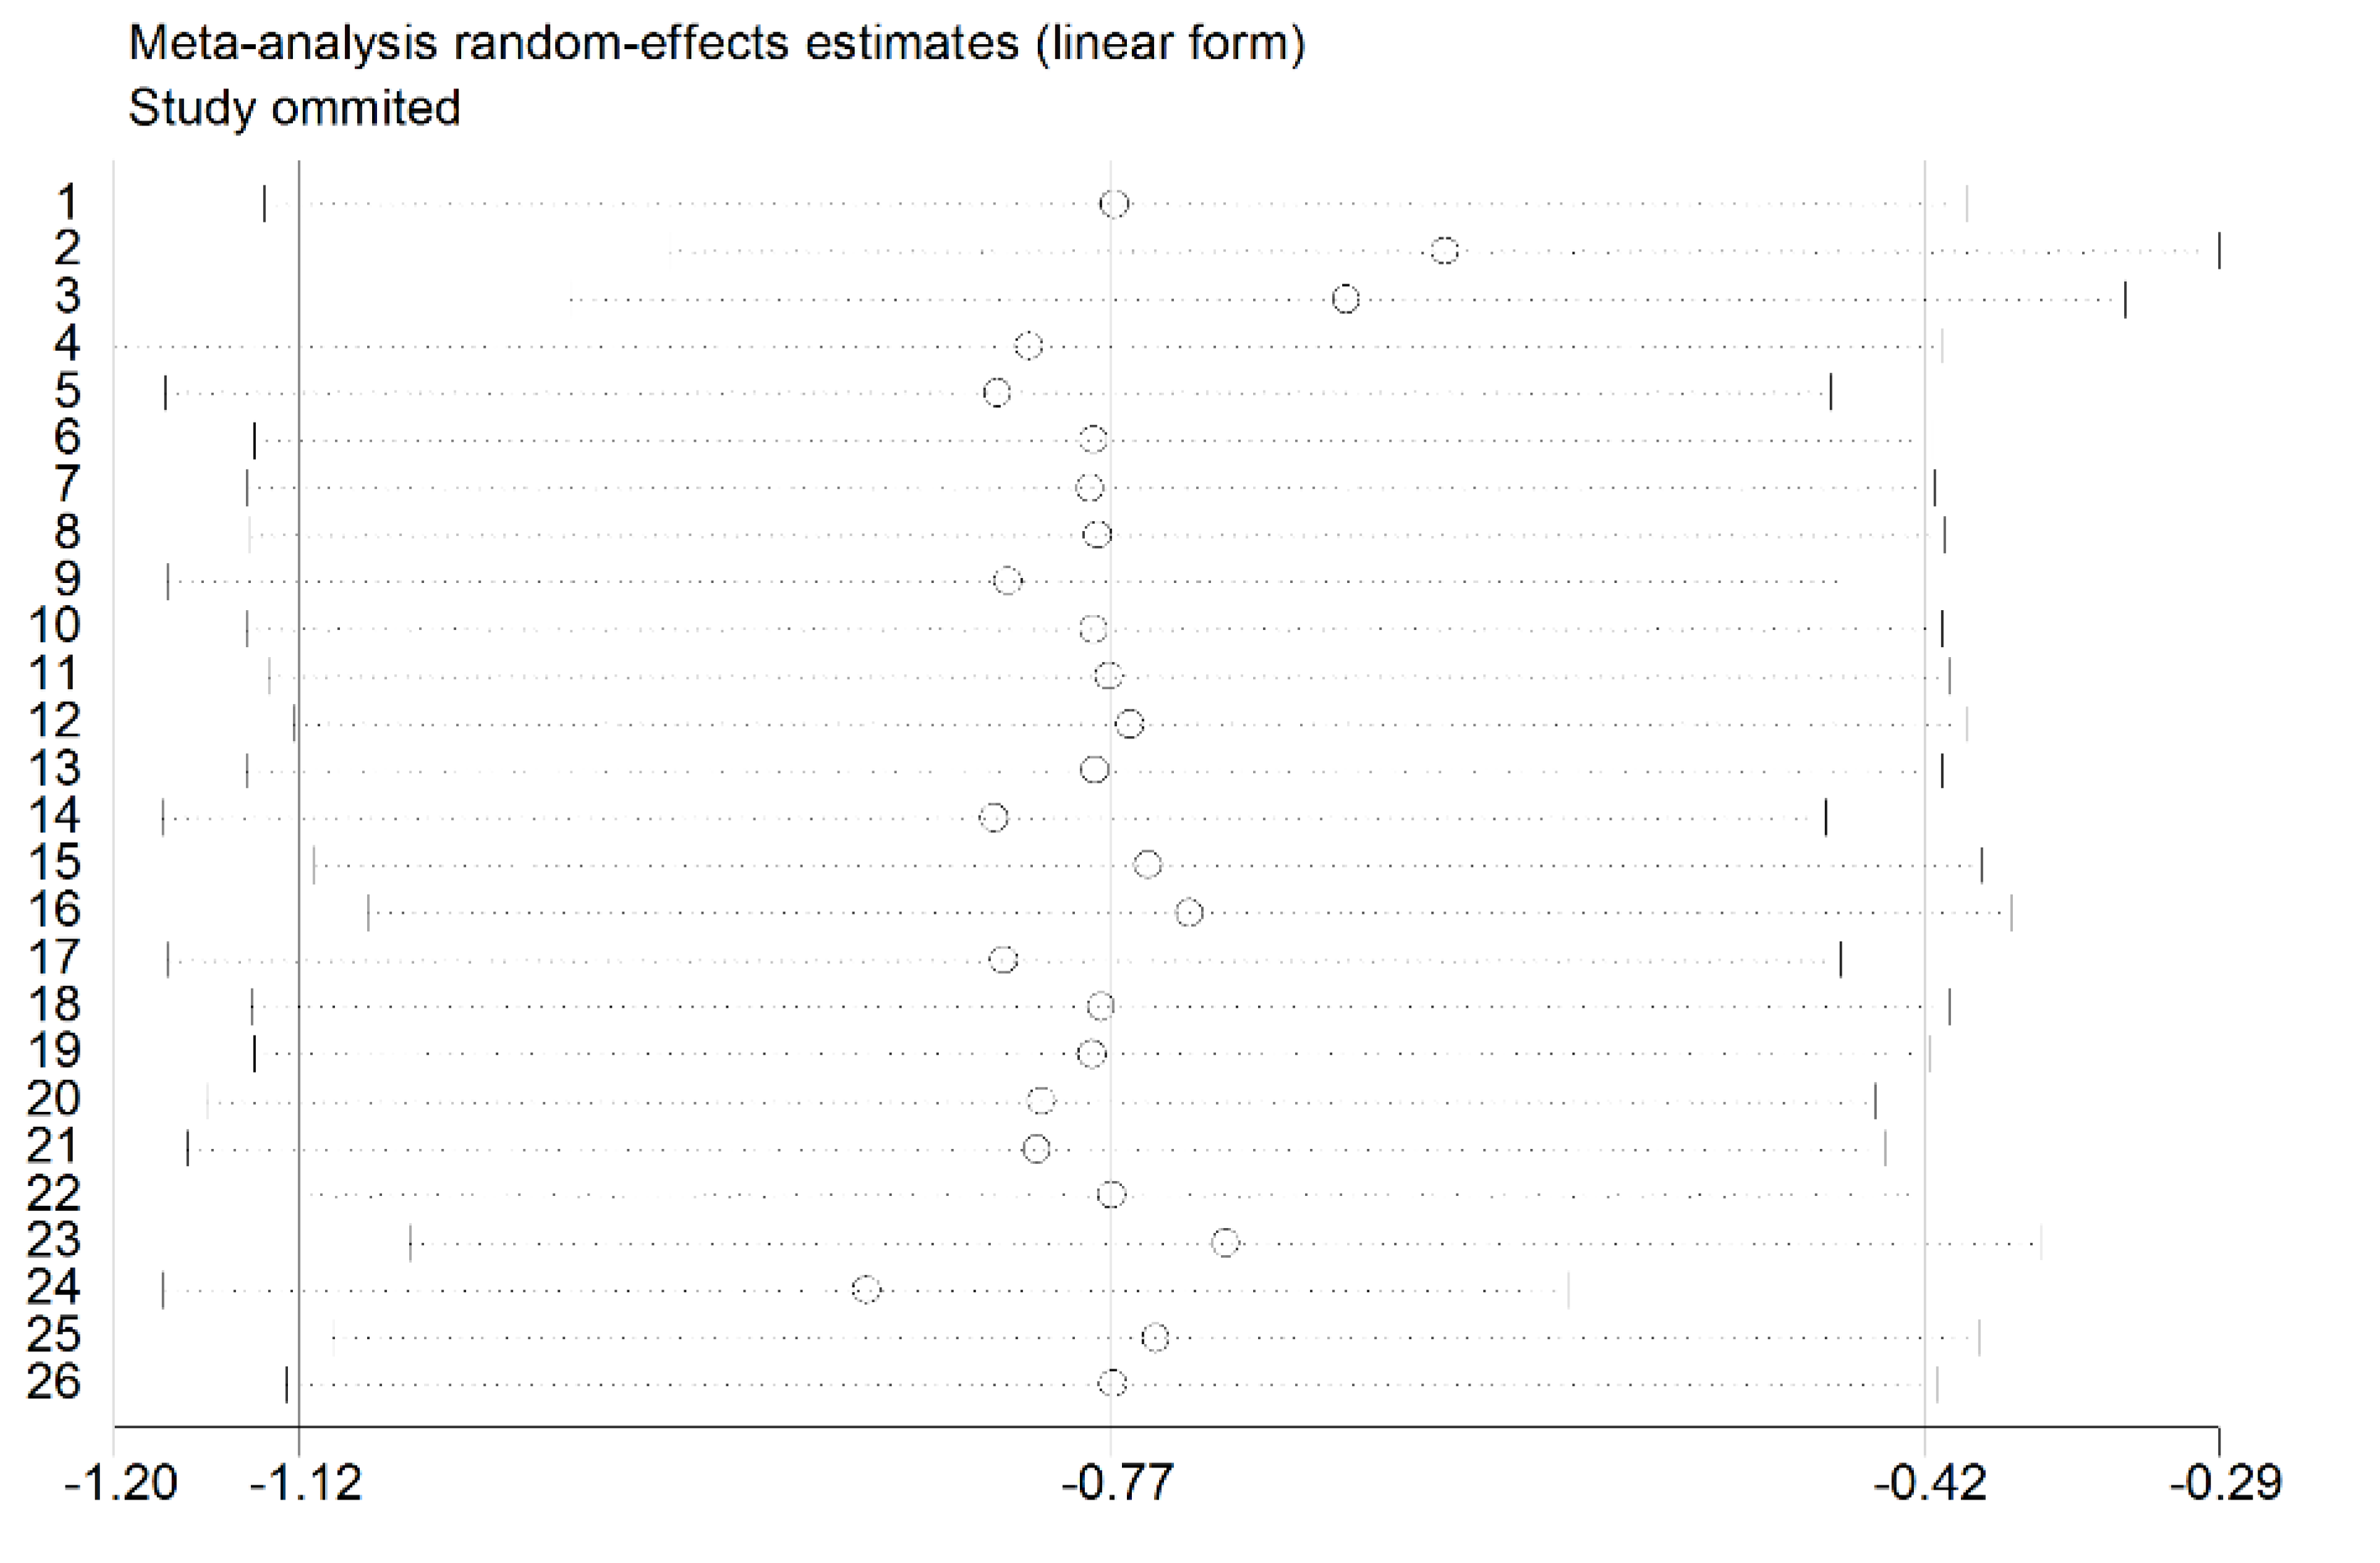
3.5. Sensitivity Analysis

The sensitivity analysis was performed and shown in Figure 4, which demonstrated stability and reliability of the meta-analysis results through consistency of meta-analysis results and between the different subgroups. Observed from the Figure 4, the omitted studies by Han et al. and Wang et al. resulted in the greater change of the estimated values compared to other studies, respectively. However, the significant relationships between the low level of vitamin D and Graves’ disease in all of the situations were evaluated.
Figure 4. The sensitivity analysis for the association between vitamin D levels and Graves’ disease by the random effects analysis.
Nutrients 07 03813 g004

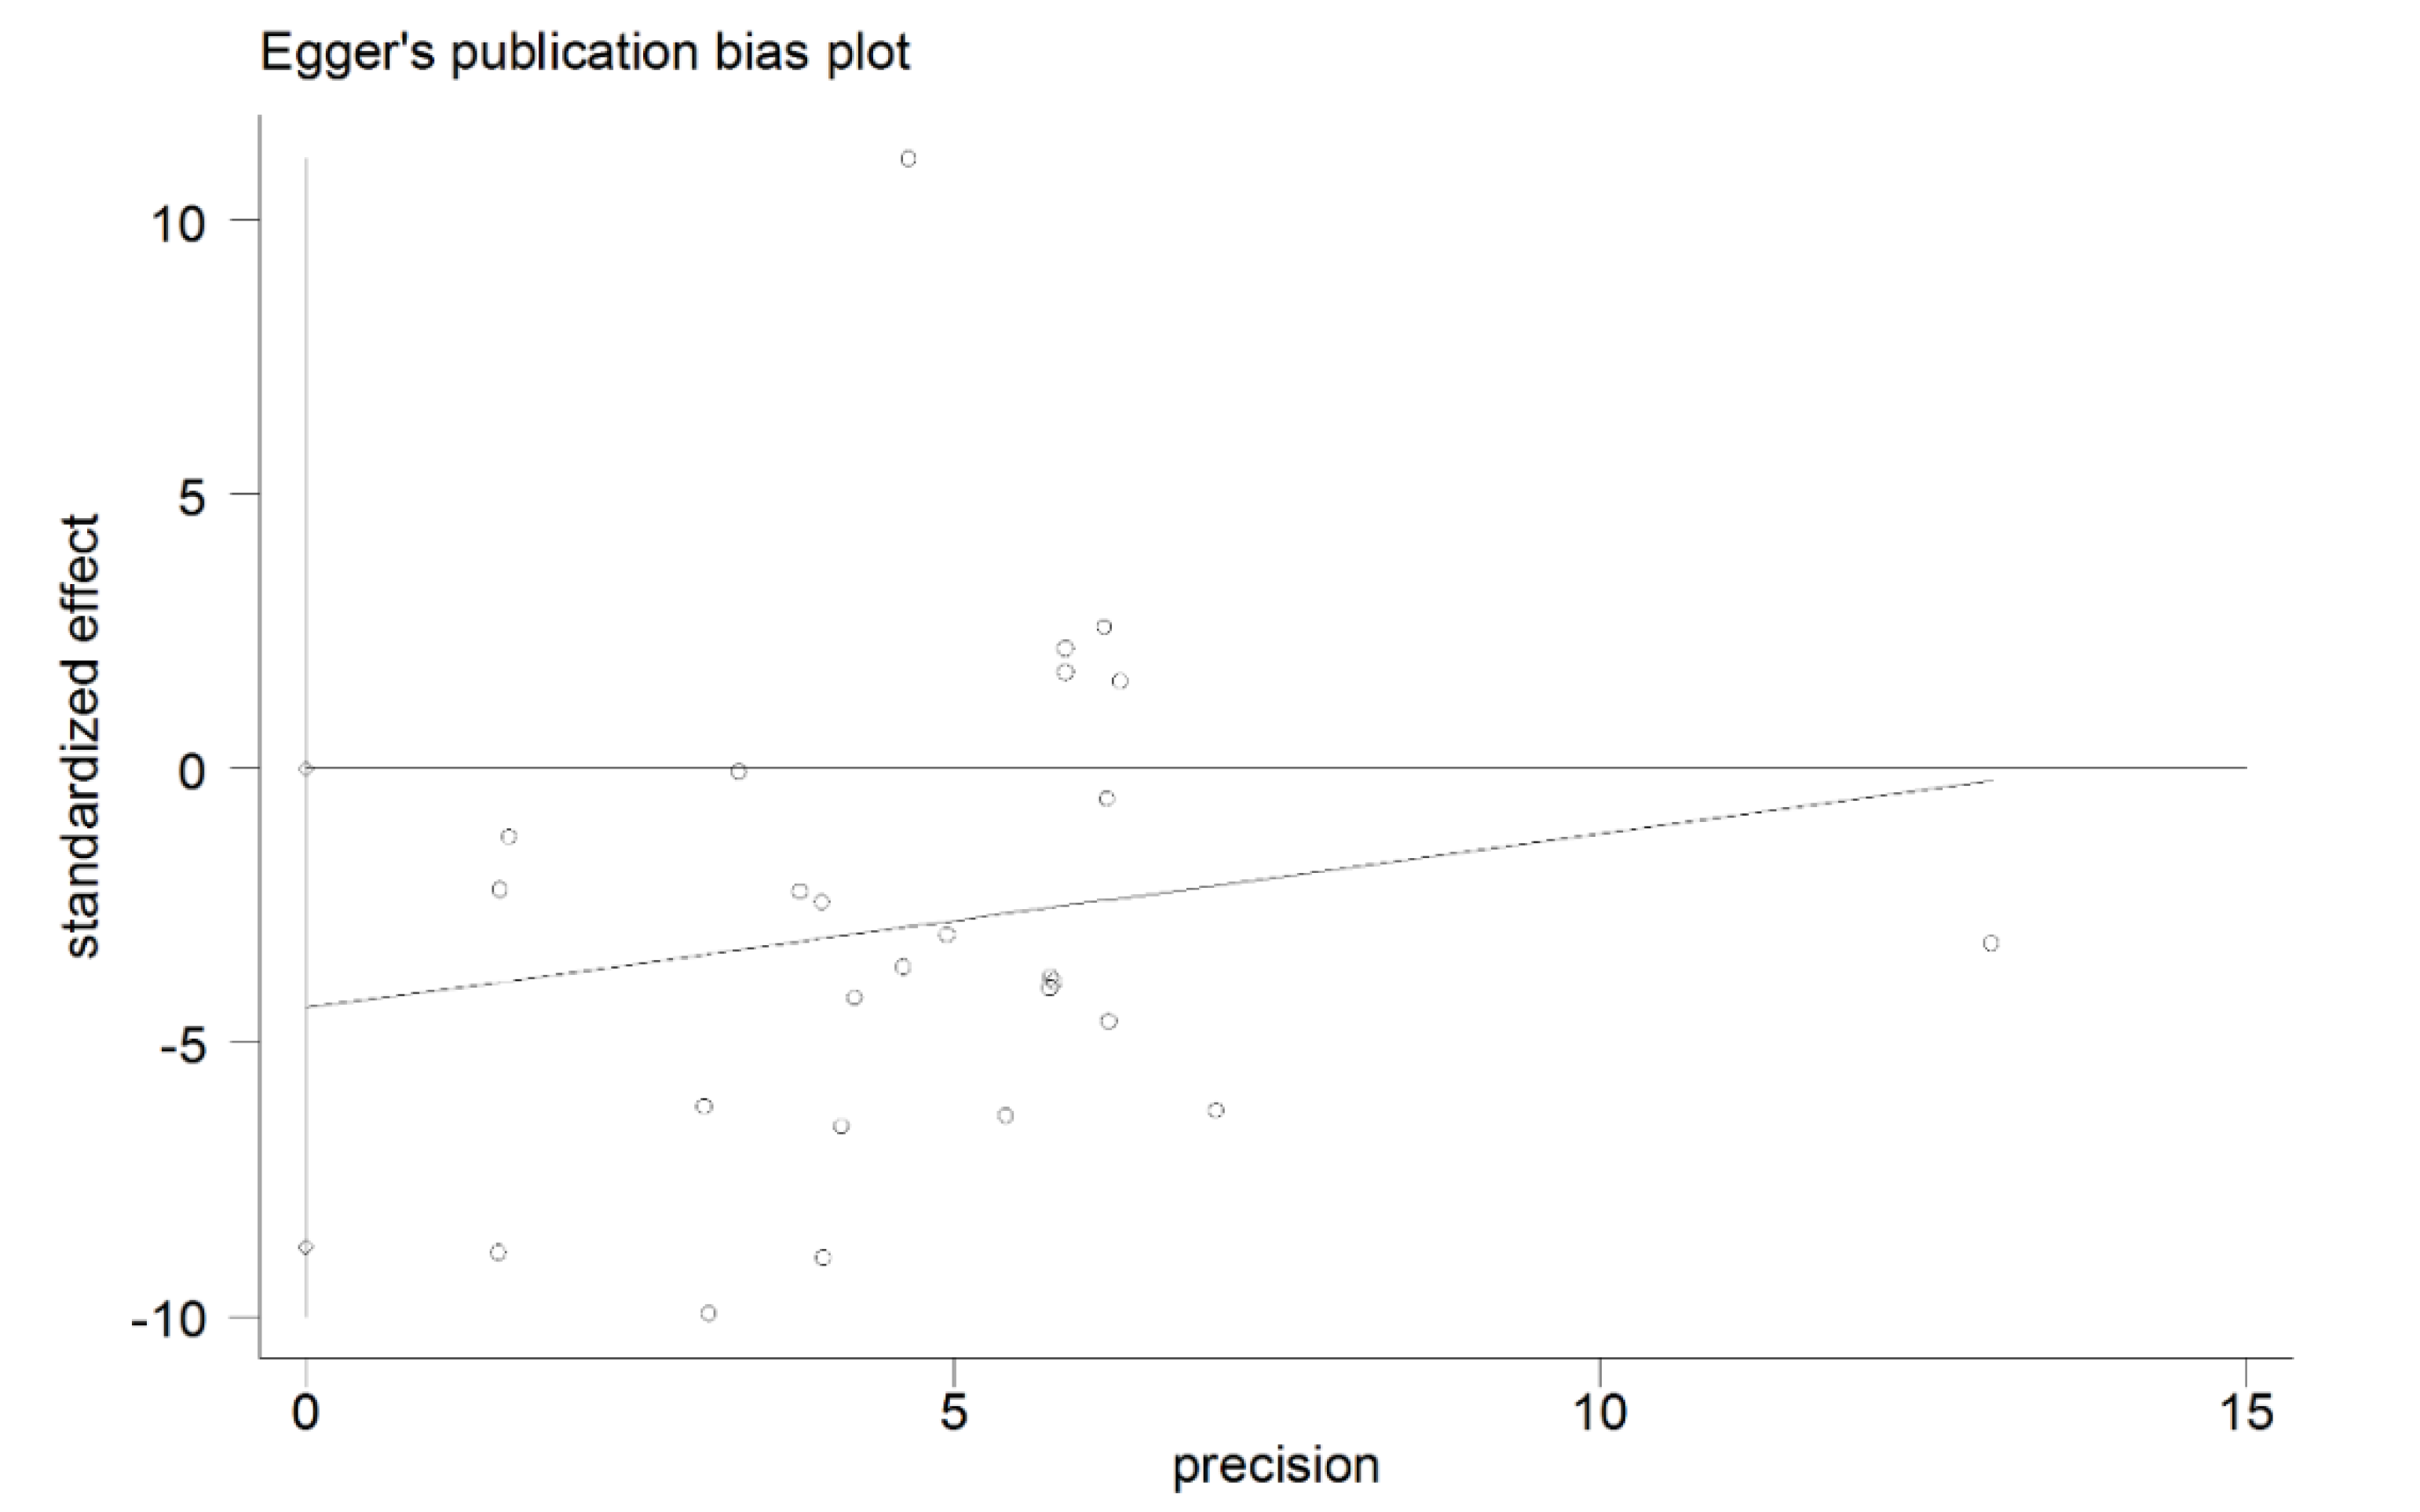
3.6. Publication Bias

Figure 5 showed the Egger’s publication bias plot in the meta-analysis. The plots shape, as well as the p value from Egger’s regression (p = 0.049), did not show strong evidence of publication bias.
Figure 5. The Egger’s publication bias plot for the association between vitamin D levels and Graves’ disease.
Nutrients 07 03813 g005

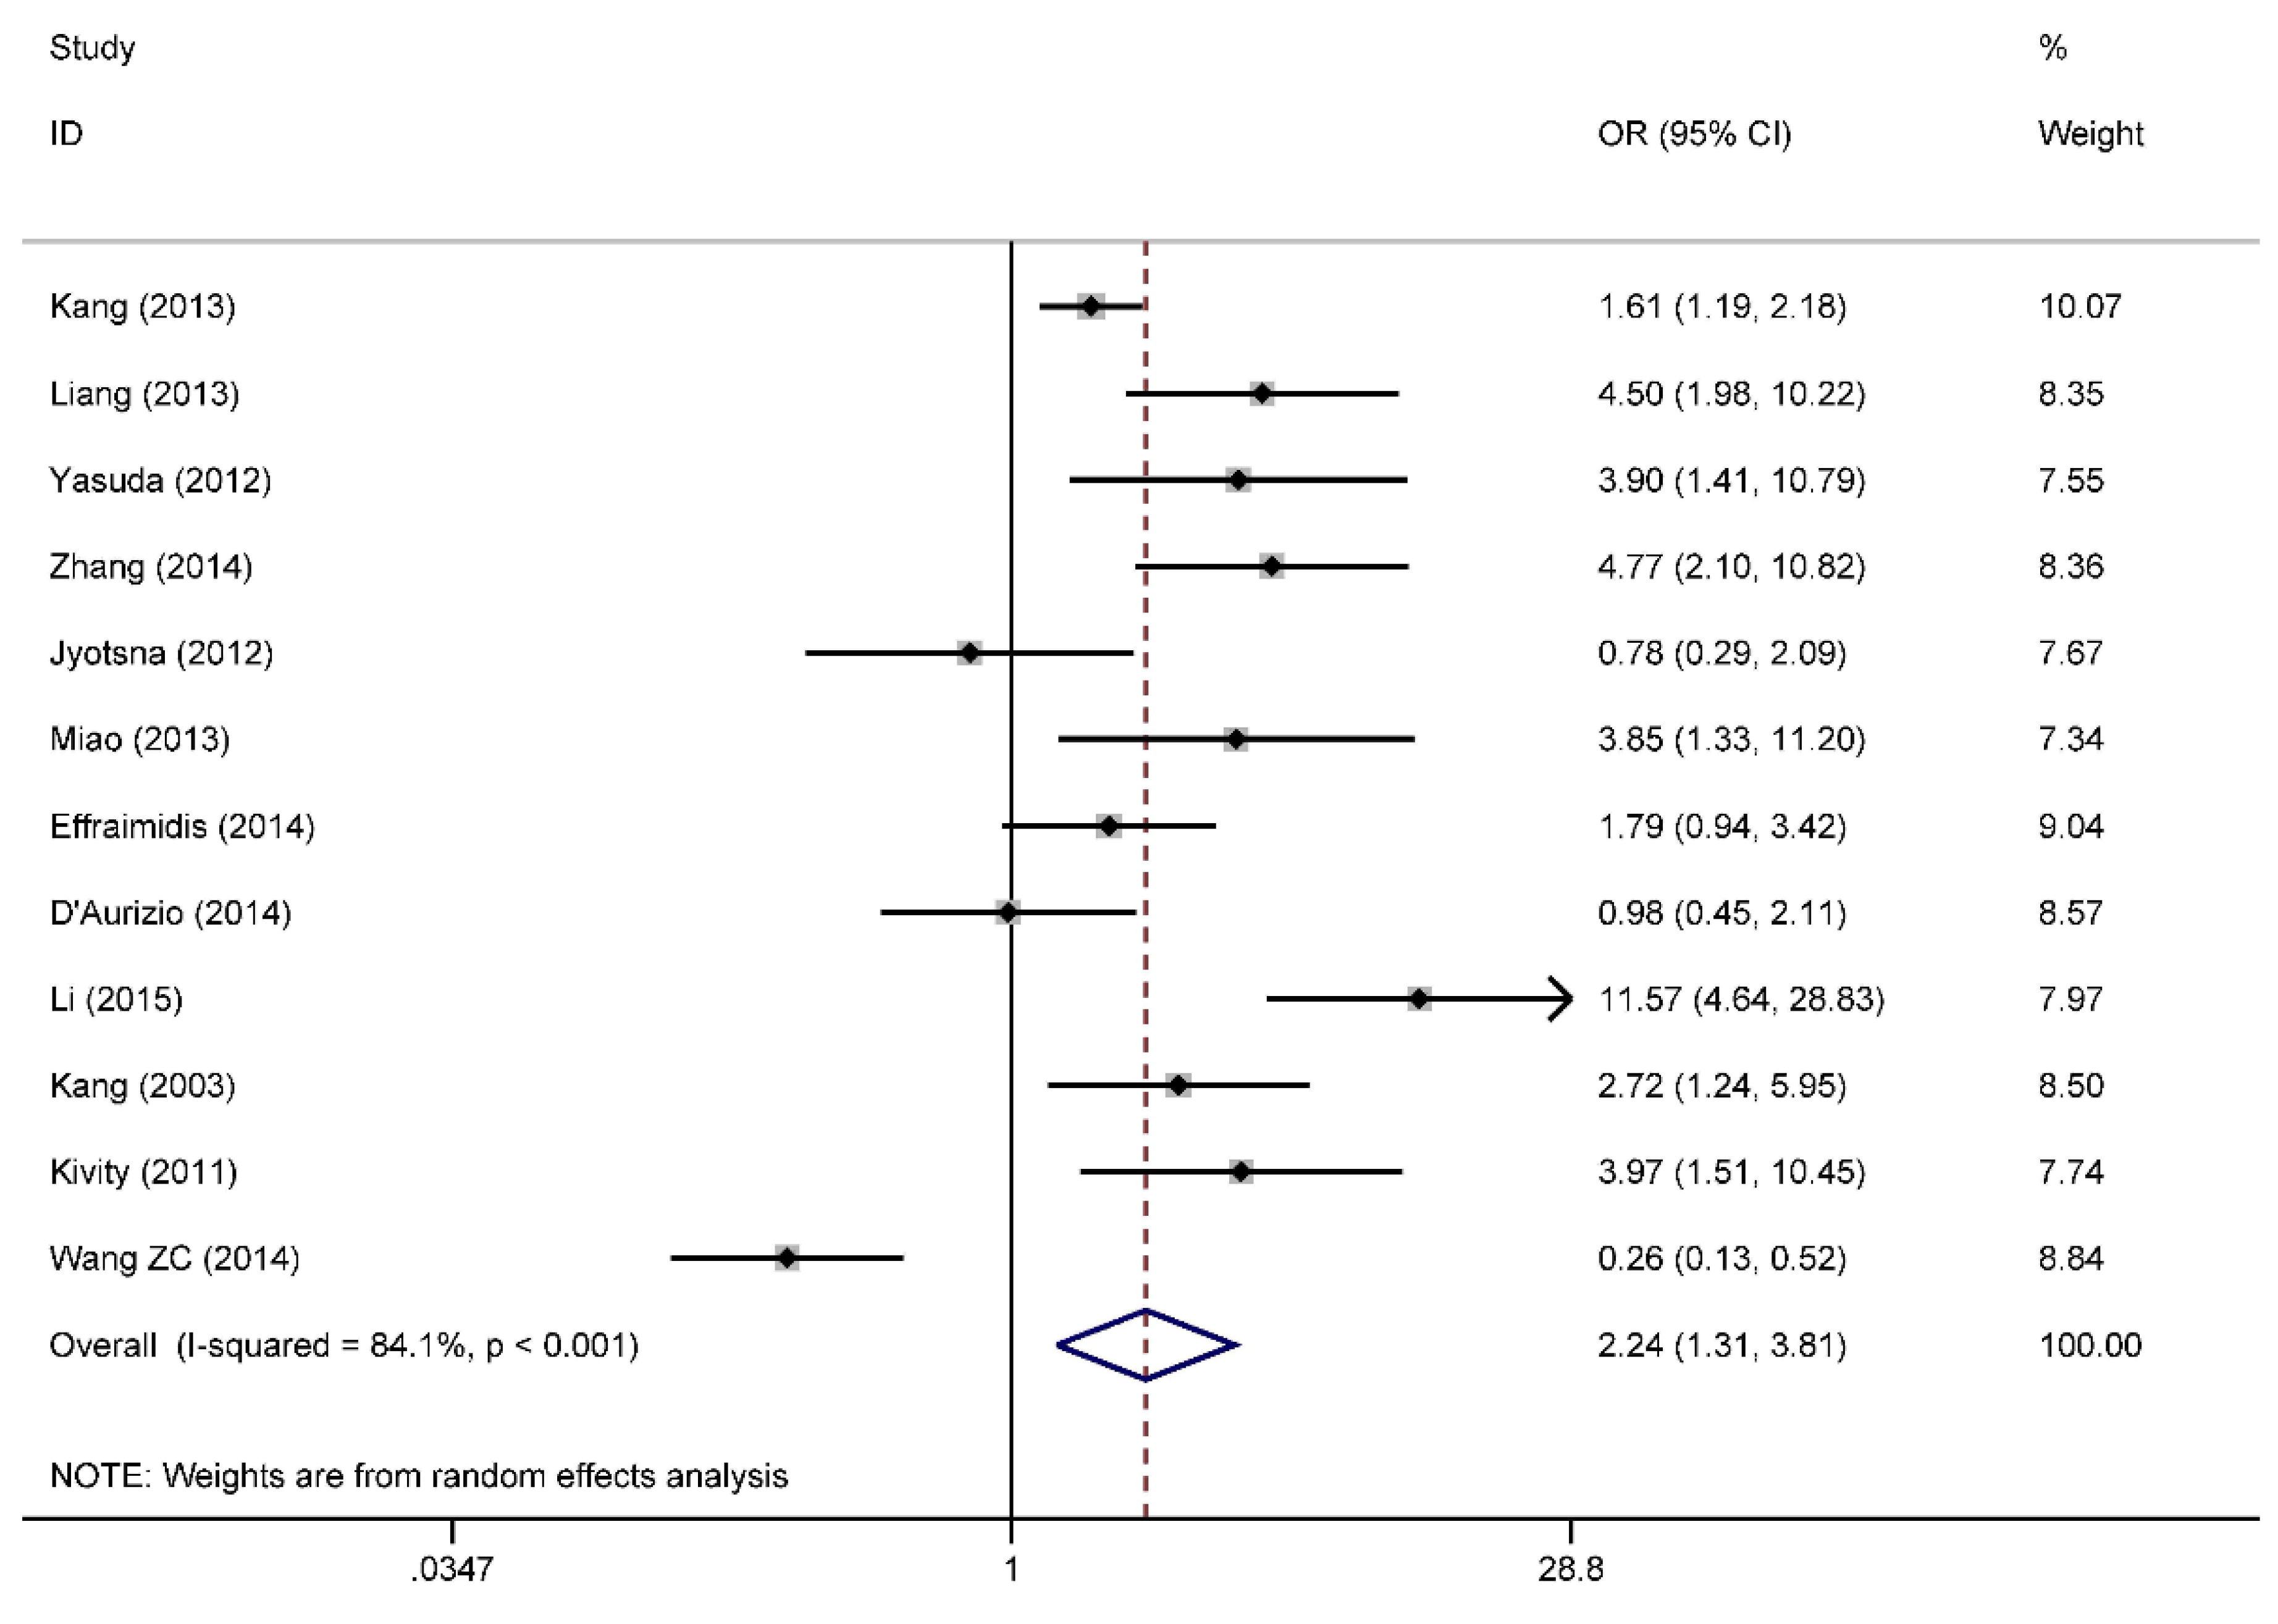
3.7. Categorical Data of Vitamin D Level and Graves’ Disease

In total, 13 studies were included to analyze the association between vitamin D deficiency and Graves’ disease. Due to the result of sensitivity analysis, the study by Han et al. was excluded. The patients with Graves’ disease were more likely to be deficient in vitamin D compared to the controls (OR = 2.24, 95% CI: 1.31, 3.81) with a high heterogeneity (I2 = 84.1%, p < 0.001) in Figure 6. We did not find the publication bias from the Egger’s regression (p = 0.136) in Figure 7.

4. Discussion

We further analysed the relationship between vitamin D levels and Graves’ disease when including more references on the basis of the previous meta-analysis by Wang et al. [18]. We also explored the sources of high heterogeneity, finding that the assay method partly contributed to it.
Most current evidence confirmed a higher prevalence of low vitamin D levels or deficiency in patients with Graves’ disease [5,6,10,11,12,14]. In our meta-analysis, which suggested the actual refinement relationship, the absolute SMD value and the OR value were lower than those in the study by Wang et al. [18], respectively. We also found that a larger significant difference between the vitamin D levels and Graves’ disease was found in Africa compared to Asia, while no significant difference was found in Europe, which may be due to the living standard and economic level. However, as Rotondi et al. noted, the existence of an association, even when supported by strong statistical significance, does not automatically imply that a causal relationship exists [33]; it is therefore necessary to perform more cohort or experimental studies to confirm the causality.
Figure 6. Forest plot of the studies comparing the association between vitamin D deficiency and Graves’ disease by meta-analysis with the random effects analysis. OR, odds ratio.
Nutrients 07 03813 g006
Figure 7. The Egger’s publication bias plot for the association between vitamin D deficiency and Graves’ disease.
Nutrients 07 03813 g007
The meta-regression analysis showed the assay method contributed to the heterogeneity. However, the heterogeneity revealed only a slight drop in the subgroup analysis of the assay method. The high heterogeneity may have also arisen due to other reasons, which could not be analyzed in the study because of the partial loss of data or unrecognizable details, such as the characteristics of study subjects, differences in the operating protocol, and so on.
Han et al. reported that the vitamin D level in the case group was obviously lower than that in the control group (58.84 ± 8.01 ng/mL) [16], which was much higher than in other studies. This may be related to the sample from healthy control or the assay method (HPLC) in the study. In the meta-analysis on the categorical data, we omitted this study to avoid the significant influence on the result when analyzing the categorical data.
Certain limitations were present in our study. We did not obtain the data of vitamin D deficiency in the references with the vitamin D levels from the authors. The strength of our study was the fact that we used a relatively wide range of references to determine the association between vitamin D and Graves’ disease and reduced the publication bias, as well as improved the accuracy of estimating the risk.
In summary, we further confirmed that low vitamin D status may increase the risk of Graves’ disease. However, whether vitamin D deficiency favor the onset of the disease or supplement of vitamin D has any beneficial therapeutic effect in Graves’ disease needs to be resolved.

Acknowledgments

The study was supported by the Youth Innovation Funding (2014QN09) from the Aerospace Center Hospital, Hospital Funding (YN201411) and the Youth Talent Support Program by the School of Public Health, Peking University. We thank Su-Yun Li from School of Public Health, Shandong University for the technical guidance.

Author Contributions

Qing-Bin Lu and Mei-Yan Xu conceived and designed the study; Mei-Yan Xu, Jian Yin and Dong-Fang Wang searched the references and collected data; Qing-Bin Lu and Bing Cao performed the statistical analysis; Qing-Bin Lu and Mei-Yan Xu drafted the manuscript; Kai-Li Chen contributed to the discussion. All the authors have read and approved the final manuscript.

Conflicts of Interest

The funding agents had no role in the design and conduct of the study; collection, management, analysis, interpretation of the data; preparation, review, or approval of the manuscript. The authors have nothing to disclose.

References

  1. Menconi, F.; Marcocci, C.; Marino, M. Diagnosis and classification of Graves’ disease. Autoimmun. Rev. 2014, 13, 398–402. [Google Scholar] [CrossRef] [PubMed]
  2. Cooper, G.S.; Stroehla, B.C. The epidemiology of autoimmune diseases. Autoimmun. Rev. 2003, 2, 119–125. [Google Scholar] [CrossRef] [PubMed]
  3. Feng, M.; Li, H.; Chen, S.F.; Li, W.F.; Zhang, F.B. Polymorphisms in the vitamin D receptor gene and risk of autoimmune thyroid diseases: A meta-analysis. Endocrine 2013, 43, 318–326. [Google Scholar] [CrossRef] [PubMed]
  4. Jyotsna, V.P.; Sahoo, A.; Ksh, S.A.; Sreenivas, V.; Gupta, N. Bone mineral density in patients of Graves’ disease pre- & post-treatment in a predominantly vitamin D deficient population. Indian J. Med. Res. 2012, 135, 36–41. [Google Scholar] [CrossRef] [PubMed]
  5. Li, Y.-B.; Xue, X.-H.; Liu, S.-W.; Xi, G.-X.; Zhao, L.-X.; Zhang, X.-L. Clinical research of serum vitamin D in early Graves’ disease. Chin. Rem. Clin. 2014, 14, 242–243. [Google Scholar]
  6. Liu, X.-H. Correlation between Serum Level of 25-(OH)D3 and Humoral Immunity in Patients with Autoimmune Thyroid Diseases. Master’s Thesis, Zhengzhou University, Zhengzhou, China, 2012. [Google Scholar]
  7. Miao, W.; Ma, J.; Guo, R.; Wang, Y.-J.; Wang, G.; Guan, H.-X. Research about the correlation between Serum 25(OH)D with Graves’ disease. Chin. J. Pract. Internal Med. 2013, 33, 394–395. [Google Scholar]
  8. Wang, Y.-C. Analysis of the Relationship between 25(OH)D, IGF-1 and Bone Metabolism in Patients with Graves’ Disease. Master’s Thesis, Anhui Medical University, Hefei, China, 2014. [Google Scholar]
  9. Wang, Z.-S.; Song, Q.-H.; Wu, Y.-P.; Chen, H.; Tan, L.-L.; Sun, S.-H. Changes of biochemical markers of bone turnover in patients with Graves’ disease. Tianjin Med. J. 2014, 42, 683–686. [Google Scholar]
  10. Xuan, L.-Y. The Study on the Relation between Vitamin D and sFas in Patients with Autoimmune Thyroid Diseases. Master’s Thesis, Nanchang University, Nanchang, China, 2014. [Google Scholar]
  11. Yasuda, T.; Okamoto, Y.; Hamada, N.; Miyashita, K.; Takahara, M.; Sakamoto, F.; Miyatsuka, T.; Kitamura, T.; Katakami, N.; Kawamori, D.; et al. Serum vitamin D levels are decreased and associated with thyroid volume in female patients with newly onset Graves’ disease. Endocrine 2012, 42, 739–741. [Google Scholar]
  12. Yasuda, T.; Okamoto, Y.; Hamada, N.; Miyashita, K.; Takahara, M.; Sakamoto, F.; Miyatsuka, T.; Kitamura, T.; Katakami, N.; Kawamori, D.; et al. Serum vitamin D levels are decreased in patients without remission of Graves’ disease. Endocrine 2013, 43, 230–232. [Google Scholar]
  13. Zhang, H.; Liang, L.; Xie, Z. Low vitamin D status is associated with increased thyrotropin-receptor antibody titer in Graves’ disease. Endocr. Pract. 2015, 21, 258–263. [Google Scholar] [CrossRef] [PubMed]
  14. Kang, D.-H.; Wang, Y.; Cao, W.; Wang, P.; Zhang, H.-M. Higher prevalence of vitamin D deficiency in female patients with Graves’ disease. Acta Nutr. Sin. 2013, 25, 299–301. [Google Scholar]
  15. Kivity, S.; Agmon-Levin, N.; Zisappl, M.; Shapira, Y.; Nagy, E.V.; Danko, K.; Szekanecz, Z.; Langevitz, P.; Shoenfeld, Y. Vitamin D and autoimmune thyroid diseases. Cell. Mol. Immunol. 2011, 8, 243–247. [Google Scholar] [CrossRef] [PubMed]
  16. Han, Y.; Cheng, Y.-K.; Chen, Y.-J.; Li, Y.-M.; Jiang, Y.-Q.; Zhang, S.-F. Abnormality of serum 25(OH)D level and its associations with thyroid hormones and auto-antibody in patients with Graves’ disease. Chin. J. Clin. Res. 2013, 26, 642–646. [Google Scholar]
  17. Zheng, Y.; Zheng, F.-P.; Li, H. The relationship of blood uric acid level and lumbar vertebra density in Graves’ disease. Chin. J. Gerontol. 2014, 34, 3017–3019. [Google Scholar]
  18. Wang, J.; Lv, S.; Chen, G.; Gao, C.; He, J.; Zhong, H.; Xu, Y. Meta-analysis of the association between vitamin d and autoimmune thyroid disease. Nutrients 2015, 7, 2485–2498. [Google Scholar] [CrossRef] [PubMed]
  19. Abd el Gawad, S.S.; Abdul Samee, E.R.; Metwali, A.A.; Abd el Gawad, M.S. Vitamin D receptor gene polymorphism and its association with 1,25-dihydroxyvitamin D(3) in patients with Graves’ disease in an Egyptian population: A pilot study. Endocr. Pract. 2012, 18, 132–139. [Google Scholar] [CrossRef] [PubMed]
  20. Annerbo, M.; Hultin, H.; Stalberg, P.; Hellman, P. Left-shifted relation between calcium and parathyroid hormone in Graves’ disease. J. Clin. Endocrinol. Metab. 2014, 99, 545–551. [Google Scholar] [CrossRef] [PubMed]
  21. Czernobilsky, H.; Scharla, S.; Schmidt-Gayk, H.; Ziegler, R. Enhanced suppression of 1,25(OH)2D3 and intact parathyroid hormone in Graves’ disease as compared to toxic nodular goiter. Calcif. Tissue Int. 1988, 42, 5–12. [Google Scholar] [CrossRef] [PubMed]
  22. D’Aurizio, F.; Villalta, D.; Metus, P.; Doretto, P.; Tozzoli, R. Is vitamin D a player or not in the pathophysiology of autoimmune thyroid diseases? Autoimmun. Rev. 2015, 14, 363–369. [Google Scholar] [CrossRef] [PubMed]
  23. Dhanwal, D.K.; Kochupillai, N.; Gupta, N.; Cooper, C.; Dennison, E.M. Hypovitaminosis D and bone mineral metabolism and bone density in hyperthyroidism. J. Clin. Densitom. 2010, 13, 462–466. [Google Scholar] [CrossRef] [PubMed]
  24. Effraimidis, G.; Badenhoop, K.; Tijssen, J.G.; Wiersinga, W.M. Vitamin D deficiency is not associated with early stages of thyroid autoimmunity. Eur. J. Endocrinol. 2012, 167, 43–48. [Google Scholar] [CrossRef] [PubMed]
  25. Kang, D.-H. Clinical Study on the Injury of 1-a Hydroxylas in Renal Tubule of Hyporalemic Patients with Hyperthyroidism of Graves’ Disease. Doctoral Thesis, Tianjin Medical University, Tianjin, China, 2003. [Google Scholar]
  26. Li, X.; Wang, G.; Lu, Z.; Chen, M.; Tan, J.; Fang, X. Serum 25-hydroxyvitamin D predict prognosis in radioiodine therapy of Graves’ disease. J. Endocrinol. Invest. 2015. [Google Scholar] [CrossRef]
  27. Liu, M. The Study on the Relationship between 25-Hydroxy Vitamin D3 Levels and Common Thyroid Diseases. Master’s Thesis, Hebei Medical University, Shijiazhuang, China, 2014. [Google Scholar]
  28. Liu, Y.; Liu, Y.-Y.; Zhang, R.-D.; Gao, P.-X. The change in metabolic status of serum 25-hydroxy-vitamin D3 in patients with hyperthyroidism. Jiangsu Med. J. 2013, 39, 2565–2567. [Google Scholar]
  29. Shi, J.-H.; Wu, Z.-C.; Gu, Y.; Shen, X.-K.; Shi, Y.; Cai, M.-X.; Teng, X.-H.; Yu, Y.-C.; Wei, X.-F. The dynamic change of serum after in Graves’ patients serum l α, 25(OH)2D, calcitonin, calcium, phosphorus after intravenous EDTA in Graves’ patients. Endocr. Metab. J. 1993, 2, 50–51. [Google Scholar]
  30. Wu, Z.-.C.; Heng, S.-.J.; Gu, Y.; Shen, X.-.K.; Teng, X.-.H.; Yu, Y.-C. Graves’ disease after a static calcium gluconate injection, EDTA plasma PTH, calcitonin, 1,25(OH)D, calcium, phosphorus dynamic observation. J. Shanghai Rail. Med. Coll. 1995, 9, 146–150. [Google Scholar]
  31. Liang, L.-Y. Vitamin D Status is Associated with the Titres of Thyroid Autoantibodies in Graves’ Disease. Master’s Thesis, Central South University, Changsha, China, 2013. [Google Scholar]
  32. Hozo, S.P.; Djulbegovic, B.; Hozo, I. Estimating the mean and variance from the median, range, and the size of a sample. BMC Med. Res. Methodol. 2005, 5, 13. [Google Scholar] [CrossRef] [PubMed] [Green Version]
  33. Rotondi, M.; Chiovato, L. Vitamin D deficiency in patients with Graves’ disease: Probably something more than a casual association. Endocrine 2013, 43, 3–5. [Google Scholar] [CrossRef] [PubMed]

