Beverage Consumption Habits in Italian Population: Association with Total Water Intake and Energy Intake


Abstract
:1. Introduction
2. Material and Methods
2.1. Study Population and Data Collection
2.2. Plain Water and Beverages Consumption
2.3. Statistical Analyses
3. Results
4. Discussion
5. Conclusions
Acknowledgments
Author Contributions
Conflicts of Interest
References
- Jéquier, E.; Constant, F. Water as an essential nutrient: The physiological basis of hydration. Eur. J. Clin. Nutr. 2010, 64, 115–123. [Google Scholar]
- European Food Safety Authority (EFSA) Panel on Dietetic Products, Nutrition and Allergies. Scientific opinion on dietary reference values for water. EFSA J. 2010, 8. [Google Scholar] [CrossRef] [Green Version]
- Popkin, B.M.; D’Anci, K.E.; Rosenberg, I.H. Water, hydration, and health. Nutr. Rev. 2010, 68, 439–458. [Google Scholar] [CrossRef] [PubMed]
- International Life Sciences Institute (ILSI). Scientific Consensus Statement regarding the Importance of Hydration and Total Water Intake for Health and Disease. J. Am. Coll. Nutr. 2007, 26, 529–623. [Google Scholar]
- World Federation of Hydrotherapy and Climatotherapy (FEMTEC). Water and Health. How Water Protects and Improves Health Overall. HYDROLIFE Definition of a Global Framework for Hydration. Available online: https://www.hydrationlab.it/pdf/Consensus_Paper_eng.pdf (accessed on 26 September 2016).
- Ferry, M. Strategies for ensuring good hydration in the elderly. Nutr. Rev. 2005, 63, S22–S29. [Google Scholar] [CrossRef] [PubMed]
- Società Italiana di Nutrizione Umana (SINU). LARN Livelli di Assunzione di Riferimento di Nutrienti ed Energia per la Popolazione Italiana IV Revisione; Coordinamento editoriale SINU-INRAN: Milan, Italy, 2014. [Google Scholar]
- Nissensohn, M.; Castro-Quezada, I.; Serra-Majem, L. Beverage and water intake of healthy adults in some European countries. Int. J. Food Sci. Nutr. 2013, 64, 801–805. [Google Scholar] [CrossRef] [PubMed]
- Flotta, D.; Micò, R.; Nobile, C.G.A.; Pileggi, C.; Bianco, A.; Pavia, M. Consumption of energy drinks, alcohol, and alcohol-mixed drinks among Italian adolescents. Alcohol. Clin. Exp. Res. 2014, 38, 1654–1661. [Google Scholar] [CrossRef] [PubMed]
- Della Valle, E.; Stranges, S.; Trevisan, M.; Krogh, V.; Fusconi, E.; Dorn, J.M.; Farinaro, E. Drinking habits and health in Northern Italian and American men. Nutr. Metab. Cardiovasc. Dis. 2009, 19, 115–122. [Google Scholar] [CrossRef] [PubMed]
- Losasso, C.; Cappa, V.; Neuhouser, M.L.; Giaccone, V.; Andrighetto, I.; Ricci, A. Students’ consumption of beverages and snacks at school and away from school: A case study in the North East of Italy. Front. Nutr. 2015, 2. [Google Scholar] [CrossRef] [PubMed]
- Leclercq, C.; Arcella, D.; Piccinelli, R.; Sette, S.; Le Donne, C.; Turrini, A.; INRAN-SCAI 2005-06 Study Group. The Italian National Food Consumption Survey INRAN-SCAI 2005-06: Main results in terms of food consumption. Public Health Nutr. 2009, 12, 2504–2532. [Google Scholar] [CrossRef] [PubMed]
- Sette, S.; Le Donne, C.; Piccinelli, R.; Arcella, D.; Turrini, A.; Leclercq, C.; INRAN-SCAI 2005-06 Study Group. The third Italian National Food Consumption Survey, INRAN-SCAI 2005-06—Part 1: Nutrient intakes in Italy. Nutr. Metab. Cardiovasc. Dis. 2011, 21, 922–932. [Google Scholar] [CrossRef] [PubMed]
- Institute of Medicine; IOM. Dietary Reference Intakes for Water, Potassium, Sodium, Chloride and Sulfate; The National Academies Press: Washington, DC, USA, 2004. [Google Scholar]
- Benelam, B.; Wyness, L. Hydration and Health: A review. Nutr. Bull. 2010, 35, 3–25. [Google Scholar] [CrossRef]
- Drewnowski, A.; Rehn, C.D.; Constant, F. Water and beverage consumption among children age 4–13 years in the United States: Analyses of 2005–2010 NHANES data. Nutr. J. 2013, 12. [Google Scholar] [CrossRef] [PubMed]
- Bellisle, F.; Thornton, S.N.; Hébe, P.; Denizeau, M.; Tahiri, M. A study of fluid intake from beverages in a sample of healthy French children, adolescents and adults. Eur. J. Clin. Nutr. 2010, 64, 350–355. [Google Scholar] [CrossRef] [PubMed]
- Drewnowski, A.; Rehm, C.D.; Constant, F. Water and beverage consumption among adults in the United States: Cross-sectional study using data from NHANES 2005–2010. BMC Public Health 2013, 13. [Google Scholar] [CrossRef] [PubMed]
- Gibson, S.; Shirreffs, S.M. Beverage consumption habits “24/7” among British adults: Association with total water intake and energy intake. Nutr. J. 2013, 12. [Google Scholar] [CrossRef] [PubMed]
- Hooper, L.; Bunn, D.; Jimoh, F.O.; Fairweather-Tait, S.J. Water-loss dehydration and aging. Mech. Ageing Dev. 2014, 136, 50–58. [Google Scholar] [CrossRef] [PubMed]
- Del Boca, F.K.; Darkes, J. The validity of self-reports of alcohol consumption: State of the science and challenges for research. Addiction 2003, 98, 1–12. [Google Scholar] [CrossRef] [PubMed]
- European Commission. Special Eurobarometer 272b: Attitudes towards Alcohol; TNS Opinion & Social: Brusssels, Belgium, 2007; pp. 40–42. [Google Scholar]
- Krall, E.A.; Dwyer, J.T. Validity of food frequency questionnaire and food diary in short-term recall situation. J. Am. Diet. Assoc. 1987, 87, 1374–1377. [Google Scholar] [PubMed]


| Contribution to Water Intake (g/Day) | Contribution to Energy Intake (kcal/Day) | ||||||
|---|---|---|---|---|---|---|---|
| Male | Female | Total | Male | Female | Total | ||
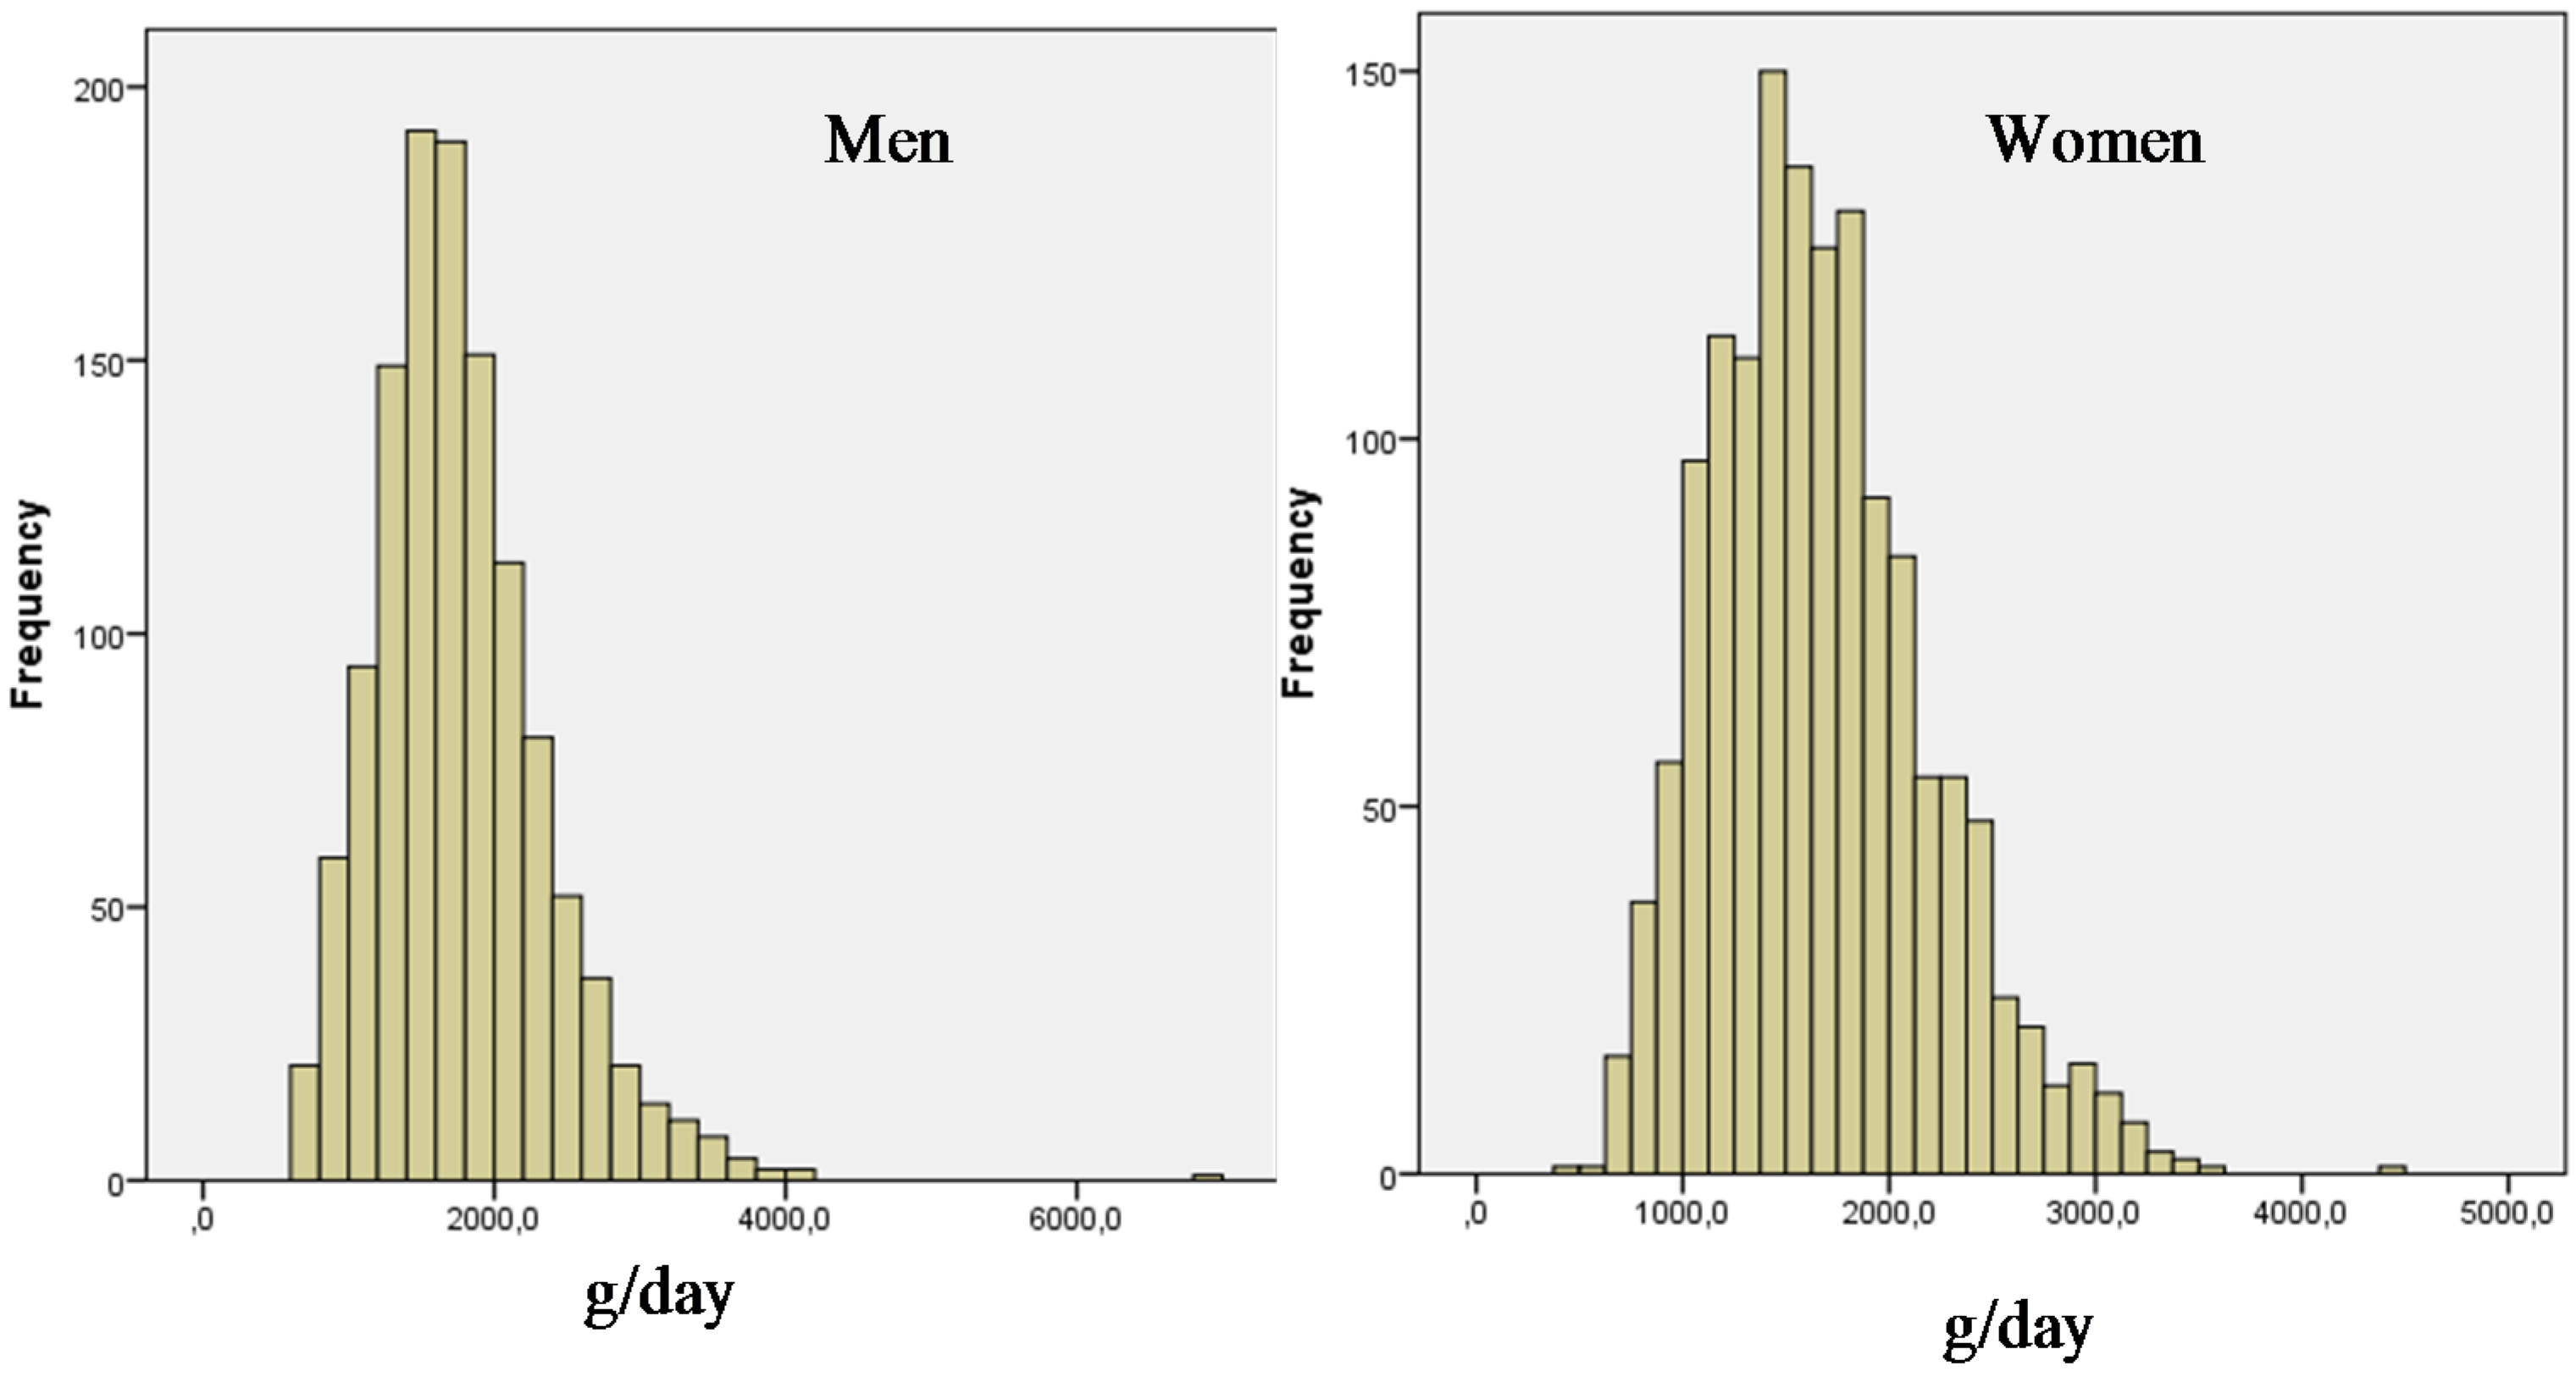
| All food and drink | Mean (SE) * | 1768 | 1668 | 1714 | 2381 | 1931 | 2138 |
| 16.9 | 14.0 | 11.0 | 18.5 | 14.0 | 12.2 | ||
| Food only | % | 44% | 44% | 45% | 93% | 95% | 94% |
| 0.3% | 0.3% | 0.2% | 0.1% | 0.1% | 0.10% | ||
| Beverages only | % | 56% | 56% | 56% | 7% | 5% | 6% |
| 0.3% | 0.3% | 0.2% | 0.1% | 0.1% | 0.1% | ||
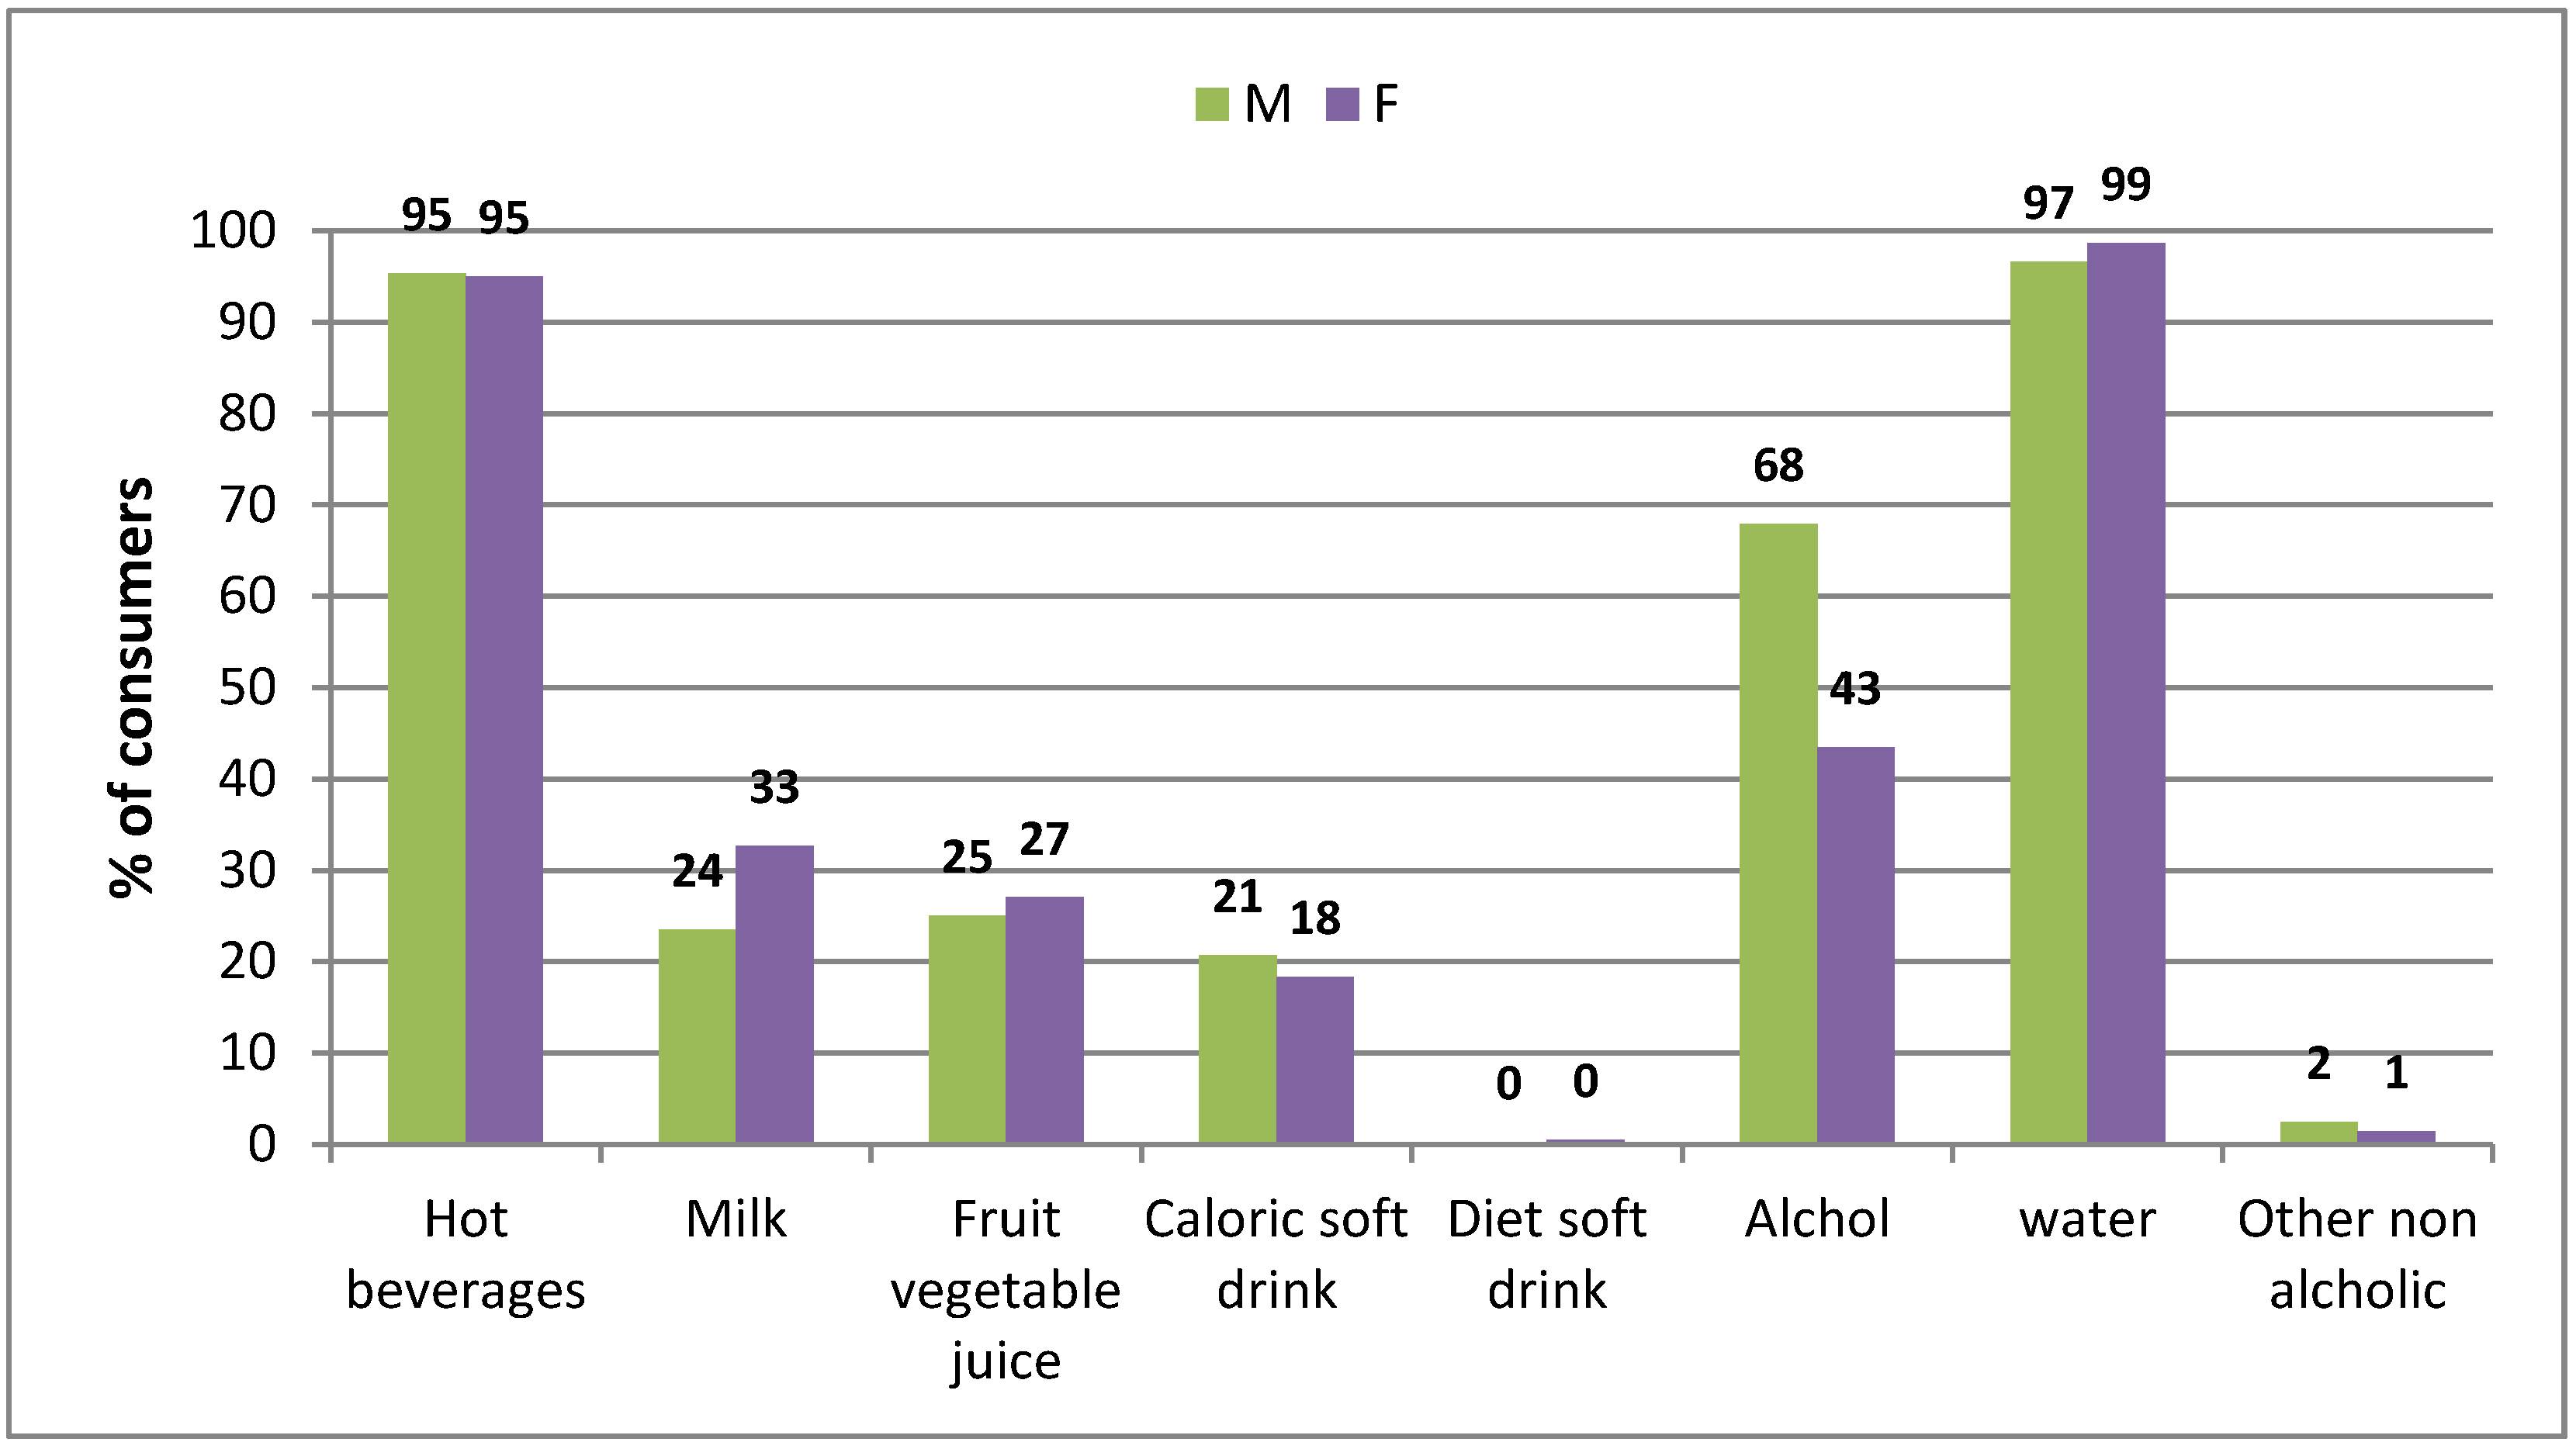
| Hot beverages | % | 8% | 8% | 8% | 0% | 0% | 0% |
| 0.2% | 0.2% | 0.1% | 0% | 0% | 0% | ||
| Milk | % | 2% | 3% | 2% | 1% | 1% | 1% |
| 0.1% | 0.1% | 0.1% | 0.1% | 0.1% | 0% | ||
| Fruit and vegetable juice | % | 1% | 1% | 1% | 1% | 1% | 1% |
| 0.1% | 0.1% | 0.1% | 0.0% | 0.0% | 0.0% | ||
| Caloric soft drink | % | 2% | 1% | 1% | 1% | 0% | 0% |
| 0.1% | 0.1% | 0.1% | 0.0% | 0.0% | 0.0% | ||
| Diet soft drink | % | 0.0% | 0.0% | 0.0% | - | - | - |
| 0.0% | 0.0% | 0.0% | |||||
| Alcoholic Beverages | % | 9% | 3% | 6% | 5% | 2% | 3% |
| 0.3% | 0.2% | 0.2% | 0.1% | 0.1% | 0.1% | ||
| Water | % | 33% | 38% | 35% | - | - | - |
| 0.4% | 0.4% | 0.3% | |||||
| Other non alcoholic beverages | % | 0% | 0% | 0% | 0% | 0% | 0% |
| 0.0% | 0.0% | 0.0% | 0.0% | 0.0% | 0.0% | ||
| Male | Female | ||||||
|---|---|---|---|---|---|---|---|
| 18–64 (n = 1068) | 65–75 (n = 134) | p | 18–64 (n = 1245) | 65–75 (n = 160) | p | ||
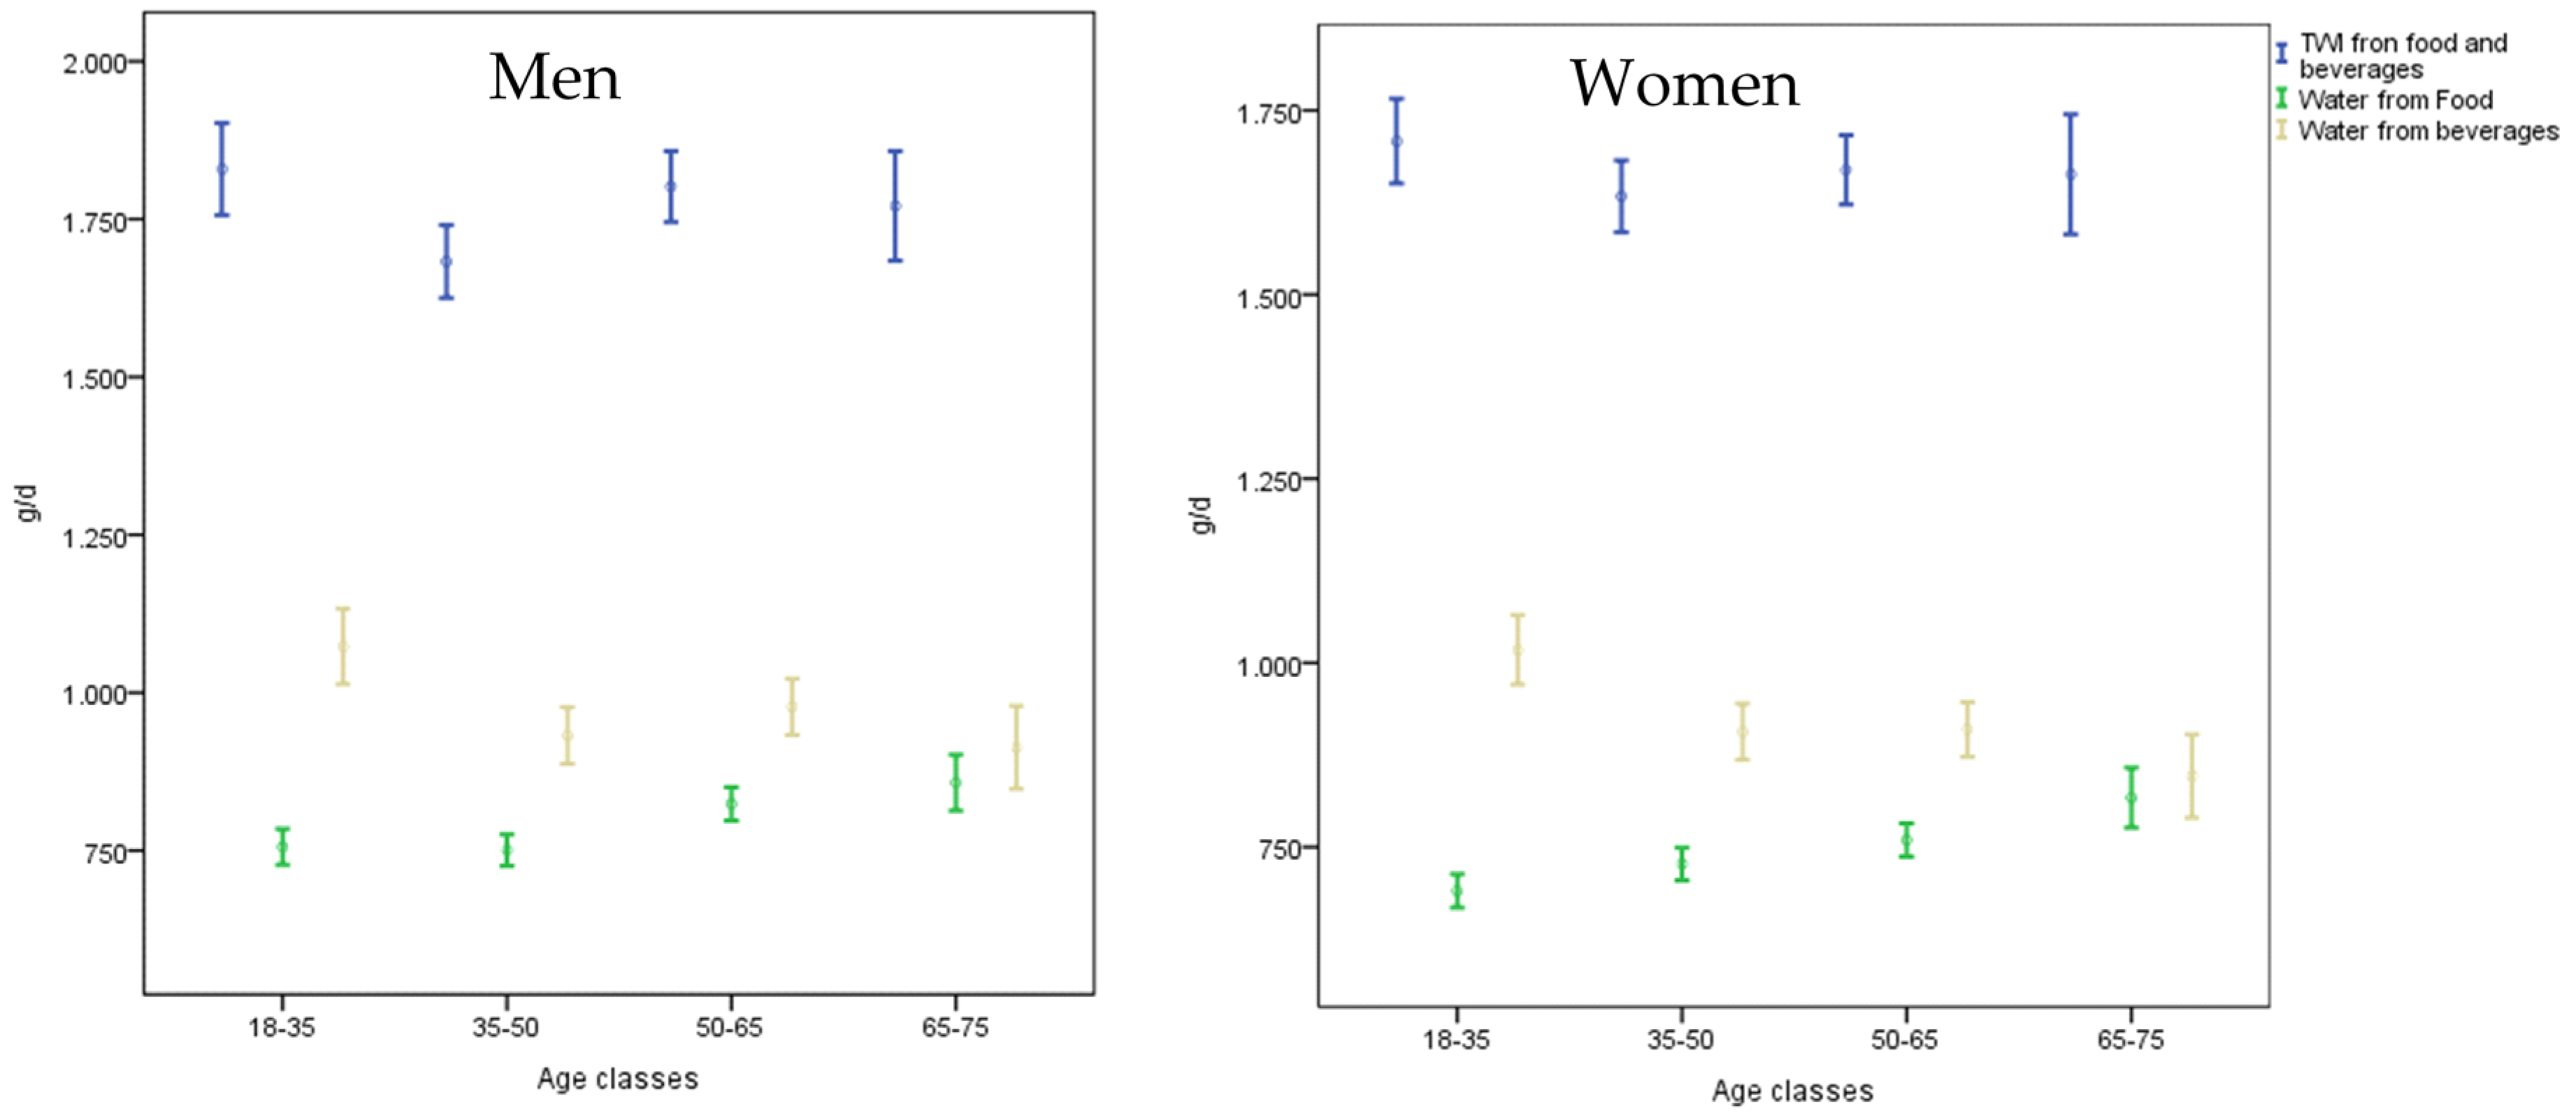
| TWI from food and beverages | Mean (SE) | 1768 (18.2) | 1771 (44.0) | n.s. * | 1669 (15.0) | 1663 (41.1) | n.s. * |
| CI | 1732.7–1804.0 | 1683.8–1857.8 | 1639.1–1697.9 | 1582.0–1744.5 | |||
| Water from food | Mean (SE) | 778 (7.9) | 856 (22.2) | 0.001 * | 727 (6.6) | 817 (20.6) | 0.000 * |
| CI | 762.6–793.5 | 813.6–901.5 | 713.8–739.9 | 776.3–857.6 | |||
| Water from beverages | Mean (SE) | 990 (14.5) | 913 (33.2) | n.s. * | 942 (12) | 846 (28.6) | 0.007 * |
| CI | 961.7–1018.8 | 847.5–979.0 | 918.1–965.2 | 789.8–902.8 | |||
| Total beverages consumption | Mean (SE) | 1024 (14.9) | 945 (33.8) | n.s. * | 965 (12.1) | 867 (29.1) | 0.006 * |
| CI | 995.1–1053.5 | 878.4–1012.0 | 940.7–988.4 | 810.2–925.0 | |||
| Hot beverages | Mean (SE) | 135 (3.3) | 139 (13.8) | n.s. § | 138 (3.2) | 129 (9) | n.s. § |
| Milk | Mean (SE) | 38 (2.8) | 39 (6.7) | n.s. § | 49 (2.4) | 53 (7.4) | n.s. § |
| Fruit vegetable juice | Mean (SE) | 27 (2.3) | 16 (4.8) | 0.003 § | 28 (1.9) | 23 (4.3) | n.s. § |
| Caloric soft drink | Mean (SE) | 33.(2.7) | 7 (2.5) | 0.000 § | 22 (1.7) | 9 (2.8) | 0.000 § |
| Diet soft drink | Mean (SE) | 1 (0.8) | 0 (0.0) | n.s § | 1 (0.3) | 0 (0.0) | n.s. § |
| Alcoholic Beverages | Mean (SE) | 163 (6.0) | 184 (15.1) | n.s. § | 58 (2.7) | 66 (8.3) | n.s. § |
| Water | Mean (SE) | 624 (12.9) | 559 (31.9) | n.s. § | 667 (11.1) | 588 (26.4) | 0.022 § |
| Other non alcoholic | Mean (SE) | 1 (0.9) | 1 (0.5) | n.s. § | 2 (0.5) | 0 (0.3) | n.s. § |
| Criteria Classification | Men (n = 1202) | Women (n = 1405) |
|---|---|---|
| Criterion 1: % (n) | 10.6 (127) | 23.9 (336) |
| Criterion 2: % (n) | 13.3 (160) | 27.0 (379) |
| Criterion 3 (1 and 2): % (n) | 5.5 (66) | 14.9 (210) |
© 2016 by the authors; licensee MDPI, Basel, Switzerland. This article is an open access article distributed under the terms and conditions of the Creative Commons Attribution (CC-BY) license (http://creativecommons.org/licenses/by/4.0/).
Share and Cite
Mistura, L.; D’Addezio, L.; Turrini, A. Beverage Consumption Habits in Italian Population: Association with Total Water Intake and Energy Intake. Nutrients 2016, 8, 674. https://0-doi-org.brum.beds.ac.uk/10.3390/nu8110674
Mistura L, D’Addezio L, Turrini A. Beverage Consumption Habits in Italian Population: Association with Total Water Intake and Energy Intake. Nutrients. 2016; 8(11):674. https://0-doi-org.brum.beds.ac.uk/10.3390/nu8110674
Chicago/Turabian StyleMistura, Lorenza, Laura D’Addezio, and Aida Turrini. 2016. "Beverage Consumption Habits in Italian Population: Association with Total Water Intake and Energy Intake" Nutrients 8, no. 11: 674. https://0-doi-org.brum.beds.ac.uk/10.3390/nu8110674