The Association between Total Protein and Vegetable Protein Intake and Low Muscle Mass among the Community-Dwelling Elderly Population in Northern Taiwan

 , ,
, ,  and
and
Abstract
:
1. Introduction
2. Materials and Methods
2.1. Study Population
2.2. Body Composition
2.3. Dietary Assessment
2.4. Demographics, Lifestyle Factors, and Nutritional Biomarkers
2.5. Statistical Analysis
3. Results
4. Discussion
5. Conclusions
Acknowledgments
Author Contribution
Conflicts of Interest
Abbreviations
| LMM | low muscle mass |
| SMI | skeletal muscle mass index |
| FFQ | Food Frequency Questionnaire |
| LS | least square |
References
- Roubenoff, R.; Hughes, V.A. Sarcopenia: Current concepts. J. Gerontol. A Biol. Sci. Med. Sci. 2000, 55, M716–M724. [Google Scholar] [CrossRef] [PubMed]
- Morley, J.E. Anorexia, sarcopenia, and aging. Nutrition 2001, 17, 660–663. [Google Scholar] [CrossRef]
- Janssen, I.; Heymsfield, S.B.; Ross, R. Low relative skeletal muscle mass (sarcopenia) in older persons is associated with functional impairment and physical disability. J. Am. Geriatr. Soc. 2002, 50, 889–896. [Google Scholar] [CrossRef] [PubMed]
- Janssen, I.; Baumgartner, R.N.; Ross, R.; Rosenberg, I.H.; Roubenoff, R. Skeletal muscle cutpoints associated with elevated physical disability risk in older men and women. Am. J. Epidemiol. 2004, 159, 413–421. [Google Scholar] [CrossRef] [PubMed]
- Janssen, I. Influence of sarcopenia on the development of physical disability: The cardiovascular health study. J. Am. Geriatr. Soc. 2006, 54, 56–62. [Google Scholar] [CrossRef] [PubMed]
- Woo, J.; Leung, J.; Sham, A.; Kwok, T. Defining sarcopenia in terms of risk of physical limitations: A 5-year follow-up study of 3153 chinese men and women. J. Am. Geriatr. Soc. 2009, 57, 2224–2231. [Google Scholar] [CrossRef] [PubMed]
- Bunout, D.; de la Maza, M.P.; Barrera, G.; Leiva, L.; Hirsch, S. Association between sarcopenia and mortality in healthy older people. Australas. J. Ageing 2011, 30, 89–92. [Google Scholar] [CrossRef] [PubMed]
- Petrella, J.K.; Kim, J.S.; Tuggle, S.C.; Bamman, M.M. Contributions of force and velocity to improved power with progressive resistance training in young and older adults. Eur. J. Appl. Physiol. 2007, 99, 343–351. [Google Scholar] [CrossRef] [PubMed]
- Thomas, D.R. Sarcopenia. Clin. Geriatr. Med. 2010, 26, 331–346. [Google Scholar] [CrossRef] [PubMed]
- Morais, J.A.; Chevalier, S.; Gougeon, R. Protein turnover and requirements in the healthy and frail elderly. J. Nutr. Health Aging 2006, 10, 272–283. [Google Scholar] [PubMed]
- Gaffney-Stomberg, E.; Insogna, K.L.; Rodriguez, N.R.; Kerstetter, J.E. Increasing dietary protein requirements in elderly people for optimal muscle and bone health. J. Am. Geriatr. Soc. 2009, 57, 1073–1079. [Google Scholar] [CrossRef] [PubMed]
- Genaro Pde, S.; Martini, L.A. Effect of protein intake on bone and muscle mass in the elderly. Nutr. Rev. 2010, 68, 616–623. [Google Scholar] [CrossRef] [PubMed]
- Castaneda, C.; Charnley, J.M.; Evans, W.J.; Crim, M.C. Elderly women accommodate to a low-protein diet with losses of body cell mass, muscle function, and immune response. Am. J. Clin. Nutr. 1995, 62, 30–39. [Google Scholar] [PubMed]
- Bos, C.; Benamouzig, R.; Bruhat, A.; Roux, C.; Mahe, S.; Valensi, P.; Gaudichon, C.; Ferriere, F.; Rautureau, J.; Tome, D. Short-term protein and energy supplementation activates nitrogen kinetics and accretion in poorly nourished elderly subjects. Am. J. Clin. Nutr. 2000, 71, 1129–1137. [Google Scholar] [PubMed]
- Bos, C.; Benamouzig, R.; Bruhat, A.; Roux, C.; Valensi, P.; Ferriere, F.; Tome, D. Nutritional status after short-term dietary supplementation in hospitalized malnourished geriatric patients. Clin. Nutr. 2001, 20, 225–233. [Google Scholar] [CrossRef] [PubMed]
- Symons, T.B.; Sheffield-Moore, M.; Wolfe, R.R.; Paddon-Jones, D. A moderate serving of high-quality protein maximally stimulates skeletal muscle protein synthesis in young and elderly subjects. J. Am. Diet. Assoc. 2009, 109, 1582–1586. [Google Scholar] [CrossRef] [PubMed]
- Arnarson, A.; Gudny Geirsdottir, O.; Ramel, A.; Briem, K.; Jonsson, P.V.; Thorsdottir, I. Effects of whey proteins and carbohydrates on the efficacy of resistance training in elderly people: Double blind, randomised controlled trial. Eur. J. Clin. Nutr. 2013, 67, 821–826. [Google Scholar] [CrossRef] [PubMed]
- Stookey, J.D.; Adair, L.S.; Popkin, B.M. Do protein and energy intakes explain long-term changes in body composition? J. Nutr. Health Aging 2005, 9, 5–17. [Google Scholar] [PubMed]
- Meng, X.; Zhu, K.; Devine, A.; Kerr, D.A.; Binns, C.W.; Prince, R.L. A 5-year cohort study of the effects of high protein intake on lean mass and bmc in elderly postmenopausal women. J. Bone Miner. Res. 2009, 24, 1827–1834. [Google Scholar] [CrossRef] [PubMed]
- Houston, D.K.; Nicklas, B.J.; Ding, J.; Harris, T.B.; Tylavsky, F.A.; Newman, A.B.; Lee, J.S.; Sahyoun, N.R.; Visser, M.; Kritchevsky, S.B. Dietary protein intake is associated with lean mass change in older, community-dwelling adults: The health, aging, and body composition (health abc) study. Am. J. Clin. Nutr. 2008, 87, 150–155. [Google Scholar] [PubMed]
- Scott, D.; Blizzard, L.; Fell, J.; Giles, G.; Jones, G. Associations between dietary nutrient intake and muscle mass and strength in community-dwelling older adults: The tasmanian older adult cohort study. J. Am. Geriatr. Soc. 2010, 58, 2129–2134. [Google Scholar] [CrossRef] [PubMed]
- Baumgartner, R.N.; Waters, D.L.; Gallagher, D.; Morley, J.E.; Garry, P.J. Predictors of skeletal muscle mass in elderly men and women. Mech. Ageing Dev. 1999, 107, 123–136. [Google Scholar] [CrossRef]
- Mitchell, D.; Haan, M.N.; Steinberg, F.M.; Visser, M. Body composition in the elderly: The influence of nutritional factors and physical activity. J. Nutr. Health Aging 2003, 7, 130–139. [Google Scholar] [PubMed]
- Haub, M.D.; Wells, A.M.; Tarnopolsky, M.A.; Campbell, W.W. Effect of protein source on resistive-training-induced changes in body composition and muscle size in older men. Am. J. Clin. Nutr. 2002, 76, 511–517. [Google Scholar] [PubMed]
- Campbell, W.W.; Barton, M.L., Jr.; Cyr-Campbell, D.; Davey, S.L.; Beard, J.L.; Parise, G.; Evans, W.J. Effects of an omnivorous diet compared with a lactoovovegetarian diet on resistance-training-induced changes in body composition and skeletal muscle in older men. Am. J. Clin. Nutr. 1999, 70, 1032–1039. [Google Scholar] [PubMed]
- Chien, M.Y.; Huang, T.Y.; Wu, Y.T. Prevalence of sarcopenia estimated using a bioelectrical impedance analysis prediction equation in community-dwelling elderly people in taiwan. J. Am. Geriatr. Soc. 2008, 56, 1710–1715. [Google Scholar] [CrossRef] [PubMed]
- Cruz-Jentoft, A.J.; Baeyens, J.P.; Bauer, J.M.; Boirie, Y.; Cederholm, T.; Landi, F.; Martin, F.C.; Michel, J.P.; Rolland, Y.; Schneider, S.M.; et al. Sarcopenia: European consensus on definition and diagnosis: Report of the european working group on sarcopenia in older people. Age Ageing 2010, 39, 412–423. [Google Scholar] [CrossRef] [PubMed]
- Pan, W.H.; Chang, Y.H.; Chen, J.Y. Nutrition and health survey Taiwan (Nahsit) 1993–1996: Dietary nutrient intakes assessed by 24-h recall. Nutr. Sci. J. 1999, 24, 11–39. [Google Scholar]
- Huang, Y.C.; Lee, M.S.; Pan, W.H.; Wahlqvist, M.L. Validation of a simplified food frequency questionnaire as used in the nutrition and health survey in Taiwan (Nahsit) for the elderly. Asia Pac. J. Clin. Nutr. 2011, 20, 134–140. [Google Scholar] [PubMed]
- Nutrient Composition Data Bank for Food of Taiwan Area; Department of Health, R.O.C.: Taipei, Taiwan, 1998.
- Sanada, K.; Miyachi, M.; Tanimoto, M.; Yamamoto, K.; Murakami, H.; Okumura, S.; Gando, Y.; Suzuki, K.; Tabata, I.; Higuchi, M. A cross-sectional study of sarcopenia in Japanese men and women: Reference values and association with cardiovascular risk factors. Eur. J. Appl. Physiol. 2010, 110, 57–65. [Google Scholar] [CrossRef] [PubMed]
- Kim, M.K.; Baek, K.H.; Song, K.H.; Il Kang, M.; Park, C.Y.; Lee, W.Y.; Oh, K.W. Vitamin D deficiency is associated with sarcopenia in older Koreans, regardless of obesity: The fourth Korea national health and nutrition examination surveys (Knhanes IV) 2009. J. Clin. Endocrinol. Metab. 2011, 96, 3250–3256. [Google Scholar] [CrossRef] [PubMed]
- Walter Willett, M.S. Implication of total energy intake for epidemiologic analysis. In Nutritional Epidemiology, 3rd ed.; Jennifer, L., Kelsey, M.G.M., Stolley, P.D., Vessey, M.P., Eds.; Oxford University Press: New York, NY, USA, 2013. [Google Scholar]
- Chin, S.O.; Rhee, S.Y.; Chon, S.; Hwang, Y.C.; Jeong, I.K.; Oh, S.; Ahn, K.J.; Chung, H.Y.; Woo, J.T.; Kim, S.W.; et al. Sarcopenia is independently associated with cardiovascular disease in older korean adults: The korea national health and nutrition examination survey (Knhanes) from 2009. PLoS ONE 2013, 8, e60119. [Google Scholar] [CrossRef] [PubMed]
- Lin, C.C.; Lin, W.Y.; Meng, N.H.; Li, C.I.; Liu, C.S.; Lin, C.H.; Chang, C.K.; Lee, Y.D.; Lee, C.C.; Li, T.C. Sarcopenia prevalence and associated factors in an elderly Taiwanese metropolitan population. J. Am. Geriatr. Soc. 2013, 61, 459–462. [Google Scholar] [CrossRef] [PubMed]
- Wu, C.H.; Yang, K.C.; Chang, H.H.; Yen, J.F.; Tsai, K.S.; Huang, K.C. Sarcopenia is related to increased risk for low bone mineral density. J. Clin. Densitom. 2013, 16, 98–103. [Google Scholar] [CrossRef] [PubMed]
- Beasley, J.M.; Shikany, J.M.; Thomson, C.A. The role of dietary protein intake in the prevention of sarcopenia of aging. Nutr. Clin. Pract. 2013, 28, 684–690. [Google Scholar] [CrossRef] [PubMed]
- Bauer, J.; Biolo, G.; Cederholm, T.; Cesari, M.; Cruz-Jentoft, A.J.; Morley, J.E.; Phillips, S.; Sieber, C.; Stehle, P.; Teta, D.; et al. Evidence-based recommendations for optimal dietary protein intake in older people: A position paper from the prot-age study group. J. Am. Med. Dir. Assoc. 2013, 14, 542–559. [Google Scholar] [CrossRef] [PubMed]
- Morley, J.E.; Argiles, J.M.; Evans, W.J.; Bhasin, S.; Cella, D.; Deutz, N.E.; Doehner, W.; Fearon, K.C.; Ferrucci, L.; Hellerstein, M.K.; et al. Nutritional recommendations for the management of sarcopenia. J. Am. Med. Dir. Assoc. 2010, 11, 391–396. [Google Scholar] [CrossRef] [PubMed]
- Young, V.R.; Pellett, P.L. Plant proteins in relation to human protein and amino acid nutrition. Am. J. Clin. Nutr. 1994, 59, 1203S–1212S. [Google Scholar] [PubMed]
- Paddon-Jones, D.; Rasmussen, B.B. Dietary protein recommendations and the prevention of sarcopenia. Curr. Opin. Clin. Nutr. Metab. Care 2009, 12, 86–90. [Google Scholar] [CrossRef] [PubMed]
- Nicastro, H.; Artioli, G.G.; Costa Ados, S.; Solis, M.Y.; da Luz, C.R.; Blachier, F.; Lancha, A.H., Jr. An overview of the therapeutic effects of leucine supplementation on skeletal muscle under atrophic conditions. Amino Acids 2011, 40, 287–300. [Google Scholar] [CrossRef] [PubMed]
- Iglay, H.B.; Apolzan, J.W.; Gerrard, D.E.; Eash, J.K.; Anderson, J.C.; Campbell, W.W. Moderately increased protein intake predominately from egg sources does not influence whole body, regional, or muscle composition responses to resistance training in older people. J. Nutr. Health Aging 2009, 13, 108–114. [Google Scholar] [CrossRef] [PubMed]
- Pennings, B.; Boirie, Y.; Senden, J.M.; Gijsen, A.P.; Kuipers, H.; van Loon, L.J. Whey protein stimulates postprandial muscle protein accretion more effectively than do casein and casein hydrolysate in older men. Am. J. Clin. Nutr. 2011, 93, 997–1005. [Google Scholar] [CrossRef] [PubMed]


| LMM (n = 94) | Normal (n = 233) | p Value | |
|---|---|---|---|
| Age (years) | 71.3 ± 5.0 | 71.6 ± 5.2 | 0.442 |
| Female (%) | 69.1 | 67.8 | 0.814 |
| BMI (kg/m2) | 23.5 ± 2.7 | 23.5 ± 3.2 | 0.841 |
| SMI (kg/m2) | 6.5 ± 1.2 | 8.5 ± 1.4 | <0.001 |
| Lifestyle factors | |||
| Education (%) | 88.3 | 93.6 | 0.111 |
| Marriage (%) | 70.2 | 73 | 0.616 |
| Exercise (%) | 79.8 | 90.1 | 0.019 * |
| Smoking (%) | 3.2 | 7.3 | 0.367 |
| Alcohol (%) | 6.4 | 15 | 0.102 |
| Coffee (%) | 31.2 | 41.1 | 0.099 |
| Tea (%) | 48.9 | 44.6 | 0.773 |
| Major diseases | |||
| DM (%) | 16 | 8.2 | 0.036 * |
| Hypertension (%) | 47.9 | 47.6 | 0.97 |
| CAD (%) | 12.8 | 12.9 | 0.979 |
| Stroke (%) | 4.3 | 3.4 | 0.721 |
| Blood biomarkers | |||
| Albumin (g/L) | 44.3 ± 2.2 | 44.5 ± 2.0 | 0.509 |
| Hemoglobin (g/L) | 130.0 ± 11.0 | 133.0 ± 13.0 | 0.122 |
| Lymphocyte (%) | 32.8 ± 6.4 | 32.0 ± 5.2 | 0.163 |
| T-CHO (mmol/L) | 5.5 ± 0.9 | 5.4 ± 1.0 | 0.338 |
| AC sugar (mmol/L) | 0.6 ± 0.2 | 0.6 ± 0.1 | 0.782 |
| LMM (n = 94) | Normal (n = 233) | p-Value | |
|---|---|---|---|
| Total energy (Kcal/day) | 1402.0 ± 358.1 | 1334.0 ± 315.1 | 0.105 |
| Carbohydrates (g/day) | 205.5 ± 58.3 | 200.5 ± 56.4 | 0.663 |
| Carbohydrate density (%) | 59.3 ± 8.7 | 60.2 ± 9.0 | 0.426 |
| Total proteins (g/day) | 50.8 ± 17.1 | 51.6 ± 15.0 | 0.528 |
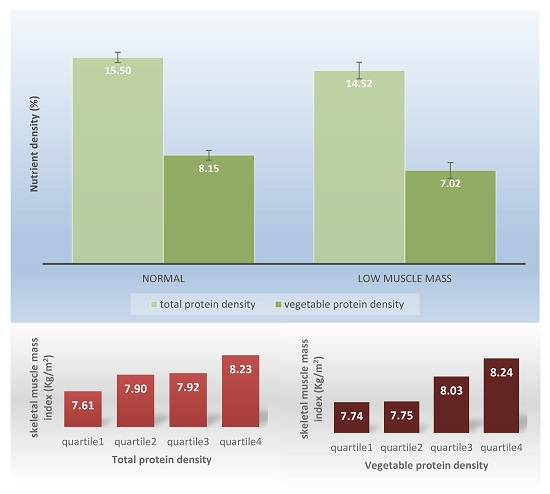
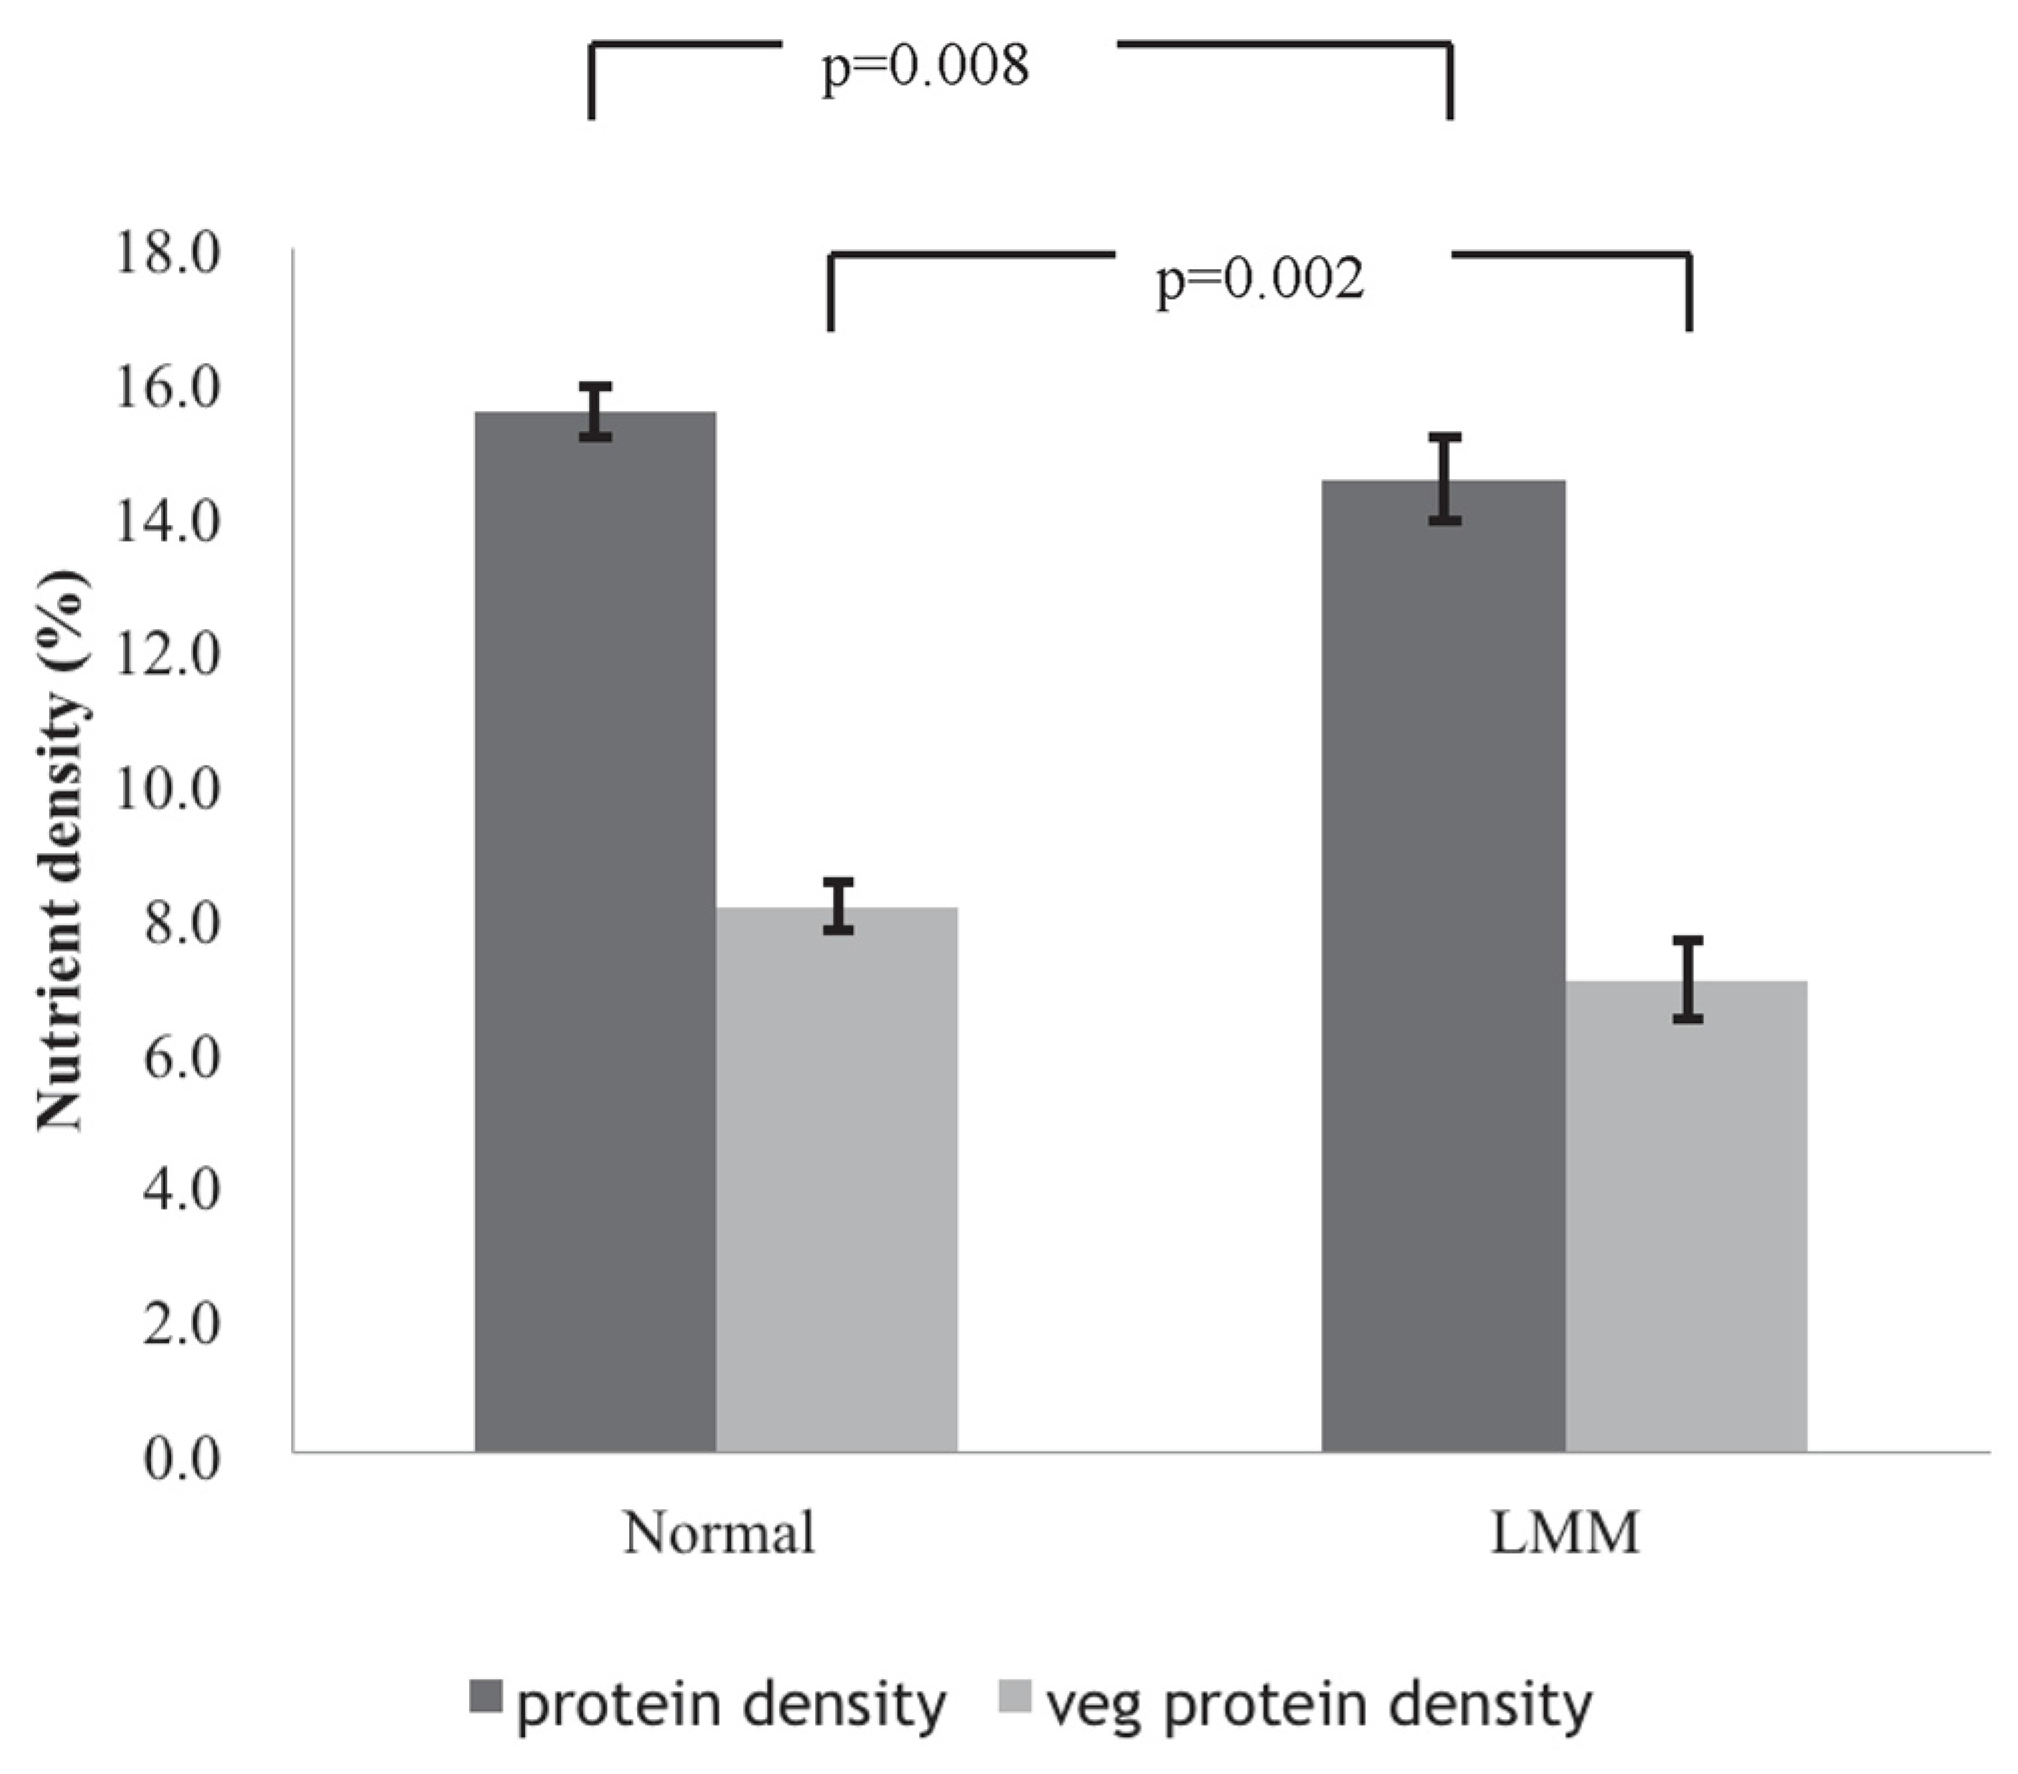
| Total protein density (%) | 14.5 ± 2.9 | 15.5 ± 3.1 | 0.007 ** |
| Vegetable protein density (%) | 7.0 ± 2.4 | 8.1 ± 3.0 | 0.004 ** |
| Animal protein density (%) | 7.5 ± 2.6 | 7.4 ± 2.7 | 0.789 |
| Fat (g/day) | 40.8 ± 16.2 | 36.1 ± 14.2 | 0.012 * |
| Fat density (%) | 26.2 ± 7.4 | 24.3 ± 7.7 | 0.028 * |
| Vitamin-mineral supplement (%) | 36.2 | 46.4 | 0.113 |
| Total Protein Density | Vegetable Protein Density | ||||
|---|---|---|---|---|---|
| Quartile | Odds Ratio (95% CIs) | p-Value | Odds Ratio (95% CIs) | p-Value | |
| Model 1 b | Quartile 1 | 3.11 (1.42–6.84) | 0.005 ** | 2.50 (1.22–5.10) | 0.012 * |
| Quartile 2 | 1.99 (0.99–4.03) | 0.055 | 2.09 (1.01–4.33) | 0.047 * | |
| Quartile 3 | 1.40 (0.68–2.90) | 0.362 | 0.99 (0.47–2.11) | 0.980 | |
| Model 2 c | Quartile 1 | 3.09 (1.40–6.82) | 0.005 ** | 2.40 (1.17–4.94) | 0.017 * |
| Quartile 2 | 2.00 (0.98–4.05) | 0.056 | 2.07 (0.99–4.30) | 0.051 | |
| Quartile 3 | 1.42 (0.68–2.95) | 0.346 | 0.96 (0.45–2.06) | 0.920 | |
| Model 3 d | Quartile 1 | 3.03 (1.37–6.72) | 0.006 ** | 2.34 (1.14–4.83) | 0.021 * |
| Quartile 2 | 1.86 (0.91–3.81) | 0.089 | 2.08 (0.99–4.36) | 0.051 | |
| Quartile 3 | 1.33 (0.64–2.79) | 0.444 | 0.97 (0.45–2.09) | 0.944 | |
© 2016 by the authors; licensee MDPI, Basel, Switzerland. This article is an open access article distributed under the terms and conditions of the Creative Commons Attribution (CC-BY) license (http://creativecommons.org/licenses/by/4.0/).
Share and Cite
Huang, R.-Y.; Yang, K.-C.; Chang, H.-H.; Lee, L.-T.; Lu, C.-W.; Huang, K.-C. The Association between Total Protein and Vegetable Protein Intake and Low Muscle Mass among the Community-Dwelling Elderly Population in Northern Taiwan. Nutrients 2016, 8, 373. https://0-doi-org.brum.beds.ac.uk/10.3390/nu8060373
Huang R-Y, Yang K-C, Chang H-H, Lee L-T, Lu C-W, Huang K-C. The Association between Total Protein and Vegetable Protein Intake and Low Muscle Mass among the Community-Dwelling Elderly Population in Northern Taiwan. Nutrients. 2016; 8(6):373. https://0-doi-org.brum.beds.ac.uk/10.3390/nu8060373
Chicago/Turabian StyleHuang, Ru-Yi, Kuen-Cheh Yang, Hao-Hsiang Chang, Long-Teng Lee, Chia-Wen Lu, and Kuo-Chin Huang. 2016. "The Association between Total Protein and Vegetable Protein Intake and Low Muscle Mass among the Community-Dwelling Elderly Population in Northern Taiwan" Nutrients 8, no. 6: 373. https://0-doi-org.brum.beds.ac.uk/10.3390/nu8060373