Body Adiposity Index Performance in Estimating Body Fat Percentage in Colombian College Students: Findings from the FUPRECOL—Adults Study

 , , ,
, , , 
Abstract
:1. Introduction
2. Methods
2.1. Participants
2.2. Procedures
2.3. Statistical Analysis
3. Results
4. Discussion
5. Conclusions
Acknowledgments
Author Contributions
Conflicts of Interest
Abbreviations
| BAI | Body adiposity index |
| BF% | Body fat percentage |
| BMI | Body mass index |
| CEMA | Centre of Studies in Physical Activity Measurements (In Spanish) |
| DEXA | Dual-energy X-ray absorptiometry |
| LMICs | Low-to-middle income countries |
| ρc | Lin’s concordance correlation coefficient |
| R2 | Coefficient of determination |
| WC | Waist circumference |
| WHtR | Waist-to-height ratio |
References
- Bhupathiraju, S.N.; Hu, F.B. Epidemiology of Obesity and Diabetes and Their Cardiovascular Complications. Circ. Res. 2016, 118, 1723–1735. [Google Scholar] [CrossRef] [PubMed]
- Lam, B.C.; Koh, G.C.; Chen, C.; Wong, M.T.; Fallows, S.J. Comparison of Body Mass Index (BMI), Body AdiposityIndex (BAI), Waist Circumference (WC), Waist-To-Hip Ratio (WHtR) and Waist-To-Height Ratio (WHtR) as predictors of cardiovascular disease risk factors in an adult population in Singapore. PLoS ONE 2015, 10, e0122985. [Google Scholar] [CrossRef] [PubMed]
- Antonopoulos, A.S.; Oikonomou, E.K.; Antoniades, C.; Tousoulis, D. From the BMI paradox to the obesity paradox: The obesity-mortality association in coronary heart disease. Obes. Rev. 2016, 17, 989–1000. [Google Scholar] [CrossRef] [PubMed]
- Gregg, E.W.; Cheng, Y.J.; Cadwell, B.L.; Imperatore, G.; Williams, D.E.; Flegal, K.M.; Narayan, K.M.; Williamson, D.F. Secular trends in cardiovascular disease risk factors according to body mass index in US adults. JAMA 2005, 293, 1868–1874. [Google Scholar] [CrossRef] [PubMed]
- Saydah, S.; Bullard, K.M.; Cheng, Y.; Ali, M.K.; Gregg, E.W.; Geiss, L.; Imperatore, G. Trends in cardiovascular disease risk factors by obesity level in adults in the United States, NHANES 1999–2010. Obes. Silver Spring 2014, 22, 1888–1895. [Google Scholar] [CrossRef] [PubMed]
- Lee, S.Y.; Gallagher, D. Assessment methods in human body composition. Curr. Opin. Clin. Nutr. Metab. Care 2008, 11, 566–572. [Google Scholar] [CrossRef] [PubMed]
- Lloret Linares, C.; Ciangura, C.; Bouillot, J.L.; Coupaye, M.; Declèves, X.; Poitou, C.; Basdevant, A.; Oppert, J.M. Validity of leg-to-leg bioelectrical impedance analysis to estimate body fat in obesity. Obes. Surg. 2011, 21, 917–923. [Google Scholar] [CrossRef] [PubMed]
- Browning, L.M.; Mugridge, O.; Dixon, A.K.; Aitken, S.W.; Prentice, A.M.; Jebb, S.A. Measuring abdominal adipose tissue: Comparison of simpler methods with MRI. Obes. Facts 2011, 4, 9–15. [Google Scholar] [CrossRef] [PubMed]
- Bergman, R.N.; Stefanovski, D.; Buchanan, T.A.; Sumner, A.E.; Reynolds, J.C.; Sebring, N.G.; Xiang, A.H.; Watanabe, R.M. A better index of body adiposity. Obes. Silver Spring 2011, 19, 1083–1089. [Google Scholar] [CrossRef] [PubMed]
- Geliebter, A.; Atalayer, D.; Flancbaum, L.; Gibson, C.D. Comparison of body adiposity index (BAI) and BMI with estimations of % body fat in clinically severe obese women. Obes. Silver Spring 2013, 21, 493–498. [Google Scholar] [CrossRef] [PubMed]
- Bernhard, A.B.; Scabim, V.M.; Serafim, M.P.; Gadducci, A.V.; Santo, M.A.; de Cleva, R. Modified body adiposity index for body fat estimation in severe obesity. J. Hum. Nutr. Diet. 2016. [Google Scholar] [CrossRef] [PubMed]
- Ezeukwu, A.O.; Ezeoranu, C.G.; Egwuonwu, A.V.; Ugwoke, U.M.; Ekechukwu, N.E.; Nwankwo, M.J. Comparison of Body Fat Percentages in Nigerian Obese Females Using Field Methods. J. Health Sci. 2015, 5, 18–23. [Google Scholar]
- Silva, M.I.; Vale, B.S.; Lemos, C.C.; Torres, M.R.; Bregman, R. Body adiposity index assess body fat with high accuracy in nondialyzed chronic kidney disease patients. Obes. Silver Spring 2013, 21, 546–552. [Google Scholar] [CrossRef] [PubMed]
- García, A.I.; Niño-Silva, L.A.; González-Ruíz, K.; Ramírez-Vélez, R. Body adiposity index as marker of obesity and cardiovascular risk in adults from Bogotá, Colombia. Endocrinol. Nutr. 2015, 130, 130–137. [Google Scholar] [CrossRef] [PubMed]
- Cerqueira, M.; Amorim, P.; Magalhaes, F.; Castro, E.; Franco, F.; Franceschini, S.; Cerqueira, L.; Marins, J.; Doimo, L. Validity of body adiposity index in predicting body fat in a sample of Brazilian women. Obes. Silver Spring 2013, 21, E696–E699. [Google Scholar] [CrossRef] [PubMed]
- Kuhn, P.C.; Vieira Filho, J.P.; Franco, L.; Dal Fabbro, A.; Franco, L.J.; Moises, R.S. Evaluation of body adiposity index (BAI) to estimate percent body fat in an indigenous population. Clin. Nutr. 2014, 33, 287–290. [Google Scholar] [CrossRef] [PubMed]
- González-Ruíz, K.; Ramírez-Vélez, R. Body adiposity index in Colombian elite athletes: A comparison between the body mass index and other measures. Rev. Colomb. Cardiol. 2015, 22, 22–26. [Google Scholar]
- Carpio-Rivera, E.; Hernández-Elizondo, J.; Salicetti-Fonseca, A.; Solera-Herrera, A.; Moncada-Jiménez, J. Predictive validity of the body adiposity index in costarican students. Am. J. Hum. Biol. 2016, 28, 394–397. [Google Scholar] [CrossRef] [PubMed]
- Segheto, W.; Coelho, F.A.; Guimarães da Silva, C.D.; Hallal, P.C.; Marins, J.C.; Ribeiro, A.Q.; Pessoa, M.C.; Morais, S.H.; Longo, G.Z. Validity of body adiposity index in predicting body fat in Brazilians adults. Am. J. Hum. Biol. 2016. [Google Scholar] [CrossRef] [PubMed]
- Lopez-Jaramillo, P.; Lahera, V.; Lopez-Lopez, J. Epidemic of cardiometabolic diseases: A Latin American point of view. Ther. Adv. Cardiovasc. Dis. 2011, 5, 119–131. [Google Scholar] [CrossRef] [PubMed]
- Parra, D.C.; Iannotti, L.; Gomez, L.F.; Pachón, H.; Haire-Joshu, D.; Sarmiento, O.L.; Kuhlmann, A.S.; Brownson, R.C. The nutrition transition in Colombia over a decade: A novel household classification system of anthropometric measures. Arch. Public Health 2015, 73, 12. [Google Scholar] [CrossRef] [PubMed]
- Cetin, D.; Lessig, B.A.; Nasr, E. Comprehensive Evaluation for Obesity: Beyond Body Mass Index. J. Am. Osteopath. Assoc. 2016, 116, 376–382. [Google Scholar] [CrossRef] [PubMed]
- Kahn, H.S.; Bullard, K.M. Beyond Body Mass Index: Advantages of Abdominal Measurements for Recognizing Cardiometabolic Disorders. Am. J. Med. 2016, 129, 74–81. [Google Scholar] [CrossRef] [PubMed]
- Johnson Stoklossa, C.A.; Forhan, M.; Padwal, R.S.; Gonzalez, M.C.; Prado, C.M. Practical Considerations for Body Composition Assessment of Adults with Class II/III Obesity Using Bioelectrical Impedance Analysis or Dual-Energy X-ray Absorptiometry. Curr. Obes. Rep. 2016, 5, 389–396. [Google Scholar] [CrossRef] [PubMed]
- González-Ruíz, K.; Correa-Bautista, J.E.; Ramírez-Vélez, R. Evaluation of the body adiposity index in predicting percentage body fat among Colombian adults. Nutr. Hosp. 2015, 32, 55–60. [Google Scholar] [PubMed]
- González-Ruíz, K.; Correa-Bautista, J.E.; Ramírez-Vélez, R. Body adiposity and its relationship of metabolic syndrome components in Colombian adults. Nutr. Hosp. 2015, 32, 1468–1475. [Google Scholar] [PubMed]
- Marfell-Jones, M.; Olds, T.; Stewart, A.; Carter, L. International Standards for Anthropometric Assessment; International Society for the Advancement of Kinanthropometry (ISAK): Potchefstroom, South Africa, 2006. [Google Scholar]
- World Health Organization. Obesity: Preventing and Managing the Global Epidemic: Report of a WHO Consultation on Obesity; WHO: Geneva, Switzerland, 1997. [Google Scholar]
- Tanita BC420MA Body Composition Analyser. Available online: http://tanita.eu/media/wysiwyg/manuals/medical-approved-body-composition-monitors/bc-420ma-instruction-manual.pdf (accessed on 1 September 2016).
- Lin, L.I. A concordance correlation coefficient to evaluate reproducibility. Biometrics 1989, 45, 255–268. [Google Scholar] [CrossRef] [PubMed]
- Bland, J.M.; Altman, D.G. Statistical methods for assessing agreement between two methods of clinical measurement. Lancet 1986, 8476, 307–310. [Google Scholar] [CrossRef]
- López, A.A.; Cespedes, M.L.; Vicente, T.; Tomas, M.; Bennasar-Veny, M.; Aguilo, A. Body Adiposity Index Utilization in a Spanish Mediterranean Population: Comparison with the Body Mass Index. PLoS ONE 2012, 7, e35281. [Google Scholar] [CrossRef] [PubMed]
- Freedman, D.S.; Thornton, J.C.; Pi-Sunyer, F.X.; Heymsfield, S.B.; Wang, J.; Pierson, R.N., Jr.; Blanck, H.M.; Gallagher, D. The body adiposity index (hip circumference ÷ height (1.5)) is not a more accurate measure of adiposity than is BMI, waist circumference, or hip circumference. Obes. Silver Spring 2012, 20, 2438–2444. [Google Scholar] [CrossRef] [PubMed]
- Johnson, W.; Chumlea, W.C.; Czerwinski, S.A.; Demerath, E.W. Concordance of the recently published body adiposity index with measured body fat percent in European-American adults. Obes. Silver Spring 2012, 20, 900–903. [Google Scholar] [CrossRef] [PubMed]
- Vinknes, K.J.; Elshorbagy, A.K.; Drevon, C.A.; Gjesdal, C.G.; Tell, G.S.; Nygård, O.; Vollset, S.E.; Refsum, H. Evaluation of the body adiposity index in a Caucasian population: The Hordaland health study. Am. J. Epidemiol. 2013, 177, 586–592. [Google Scholar] [CrossRef] [PubMed]
- Lemacks, J.L.; Liu, P.Y.; Shin, H.; Ralston, P.A.; Ilich, J.Z. Validation of body adiposity index as a measure of obesity in overweight and obese postmenopausal white women and its comparison with body mass index. Menopause 2012, 19, 1277–1279. [Google Scholar] [CrossRef] [PubMed]
- Lohman, T.G. Advances in Body Composition Assessment; Human Kinetics Publisher: Champaign, IL, USA, 1992. [Google Scholar]
- Siervo, M.; Prado, C.M.; Stephan, B.C.; Lara, J.; Muscariello, E.; Nasti, G.; Colantuoni, A. Association of the body adiposity index (BAI) with metabolic risk factors in young and older overweight and obese women. Eat. Weight. Disord. 2014, 19, 397–402. [Google Scholar] [CrossRef] [PubMed] [Green Version]
- Bennasar-Veny, M.; Lopez-Gonzalez, A.A.; Tauler, P.; Cespedes, M.L.; Vicente-Herrero, T.; Yanez, A.; Tomas-Salva, M.; Aguilo, A. Body adiposity index and cardiovascular health risk factors in Caucasians: A comparison with the body mass index and others. PLoS ONE 2013, 8, e63999. [Google Scholar] [CrossRef] [PubMed]
- Dehghan, M.; Merchant, A.T. Is bioelectrical impedance accurate for use in large epidemiological studies? Nutr. J. 2008, 7, 26. [Google Scholar] [CrossRef] [PubMed]
- Kushner, R.F.; Gudivaka, R.; Schoeller, D.A. Clinical characteristics influencing bioelectrical impedance analysis measurements. Am. J. Clin. Nutr. 1996, 64, 4235–4275. [Google Scholar]
- Ramírez-Vélez, R.; Correa-Bautista, J.E.; González-Ruíz, K.; Vivas, A.; García-Hermoso, A.; Triana-Reina, H.R. Predictive validity of the body adiposity index in overweight and obese adults using dual-energy X-ray absorptiometry. Nutrients 2016, 8, 737. [Google Scholar] [CrossRef] [PubMed]


| Characteristics | Women (n = 469) | Men (n = 434) | Total (n = 903) | p |
|---|---|---|---|---|
| Age (years) | 21.5 (3.2) | 21.3 (3.4) | 21.4 (3.3) | 0.478 |
| Height (m) | 1.60 (0.10) | 1.72 (0.07) | 1.66 (0.11) | 0.001 |
| Weight (kg) | 58.9 (10.0) | 69.9 (12.5) | 64.2 (12.5) | 0.001 |
| Waist (cm) | 72.0 (8.1) | 79.1 (9.8) | 75.4 (9.6) | 0.001 |
| Hip (cm) | 97.0 (8.8) | 97.5 (9.5) | 97.2 (9.1) | 0.480 |
| WHtR | 0.45 (0.05) | 0.46 (0.06) | 0.45 (0.05) | 0.035 |
| BF%BIA | 26.8 (7.2) | 16.0 (6.7) | 21.6 (8.8) | 0.001 |
| BF%BAI | 30.0 (5.4) | 24.8 (5.5) | 27.5 (6.0) | 0.001 |
| BMI (kg/m2) | 23.0 (3.7) | 23.5 (3.7) | 23.2 (3.7) | 0.097 |
| BMI ≥ 30 (kg/m2) | 26 [5.5] | 23 [5.2] | 49 [5.4] * | 0.816 |
| Characteristics | Female | Male | ||||||||||
|---|---|---|---|---|---|---|---|---|---|---|---|---|
| n | BF%BAI | BF%BIA | p-Value | Difference between Measures (CI 95%) | R2 | n | BF%BAI | BF%BIA | p-Value | Difference between Measures (CI 95%) | R2 | |
| All | 469 | 30.0 (5.4) | 26.8 (7.2) | 0.001 | −3.1 (−3.7 to −2.6) | 0.280 | 434 | 24.8 (5.5) | 16.0 (6.7) | 0.001 | −8.7 (−9.3 to −8.1) | 0.212 |
| Level of adiposity (%) * | ||||||||||||
| ≤20 | 87 | 26.5 (2.9) | 16.2 (3.1) | 0.001 | −10.3 (−11.1 to −9.4) | 0.041 | 332 | 23.8 (3.9) | 13.1 (4.1) | 0.001 | −10.7 (−11.1 to −10.2) | 0.283 |
| 20–30 | 235 | 29.1 (5.7) | 25.6 (2.8) | 0.001 | −3.4 (−4.1 to −2.6) | 0.046 | 88 | 27.7 (6.4) | 24.0 (2.5) | 0.001 | −3.5 (−5.1 to −2.3) | 0.024 |
| 31–40 | 127 | 32.9 (3.5) | 33.8 (2.6) | 0.002 | 0.9 (0.3 to −1.4) | 0.241 | 14 | 27.5 (14.2) | 33.3 (2.4) | 0.196 | 5.7 (−3.3 to −14.9) | 0.081 |
| ≥40 | 20 | 36.7 (2.9) | 42.1 (1.6) | 0.001 | 5.4 (4.0 to 6.8) | 0.114 | – | – | – | – | – | – |
| Weight status | ||||||||||||
| BMI < 25 (kg/m2) | 348 | 28.5 (4.9) | 24.5 (5.1) | 0.001 | −4.0 (−4.6 to −3.3) | 0.051 | 307 | 23.4 (4.4) | 13.3 (4.4) | 0.001 | −10.0 (−10.6 to −9.4) | 0.087 |
| 25 ≤ BMI < 30 (kg/m2) | 94 | 34.0 (2.4) | 33.4 (3.7) | 0.001 | −5.5 (−1.5 to −0.4) | 0.014 | 104 | 27.4 (5.9) | 21.7 (4.1) | 0.001 | −5.6 (−7.1 to −4.1) | 0.018 |
| 30 ≤ BMI < 35 (kg/m2) | 27 | 37.9 (2.9) | 40.4 (3.2) | 0.001 | −2.4 (0.8 to 4.1) | 0.003 | 23 | 32.2 (4.3) | 29.1 (6.7) | 0.009 | −3.1 (−5.5 to −0.8) | 0.365 |
| Study | Sample | Age (Years) | Device | Agreement between Measurement Methods/Bias | Main Finding |
|---|---|---|---|---|---|
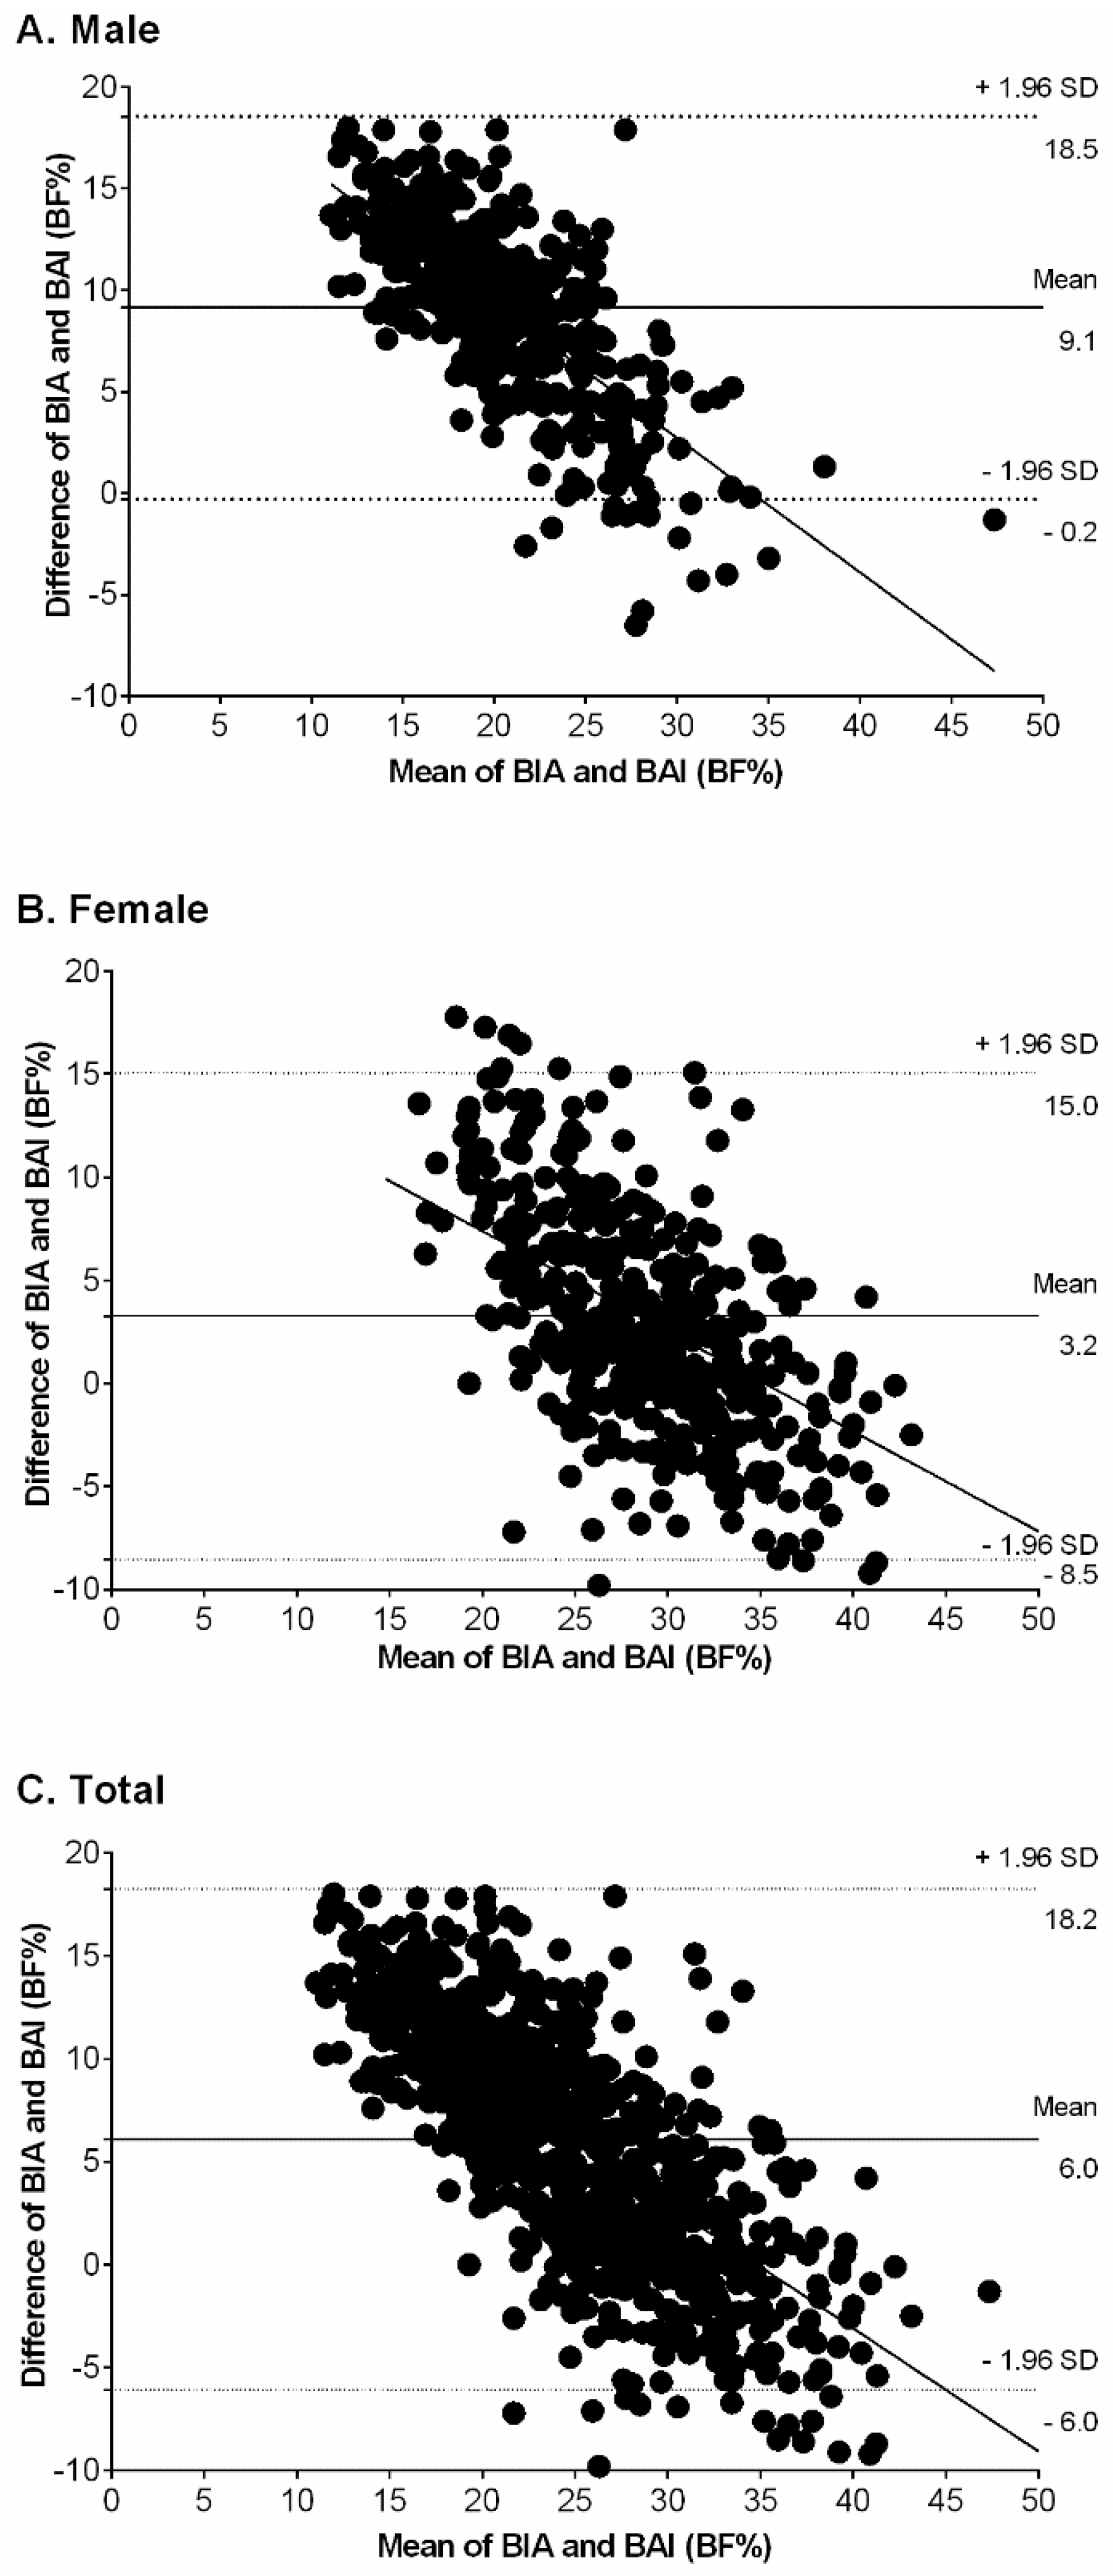
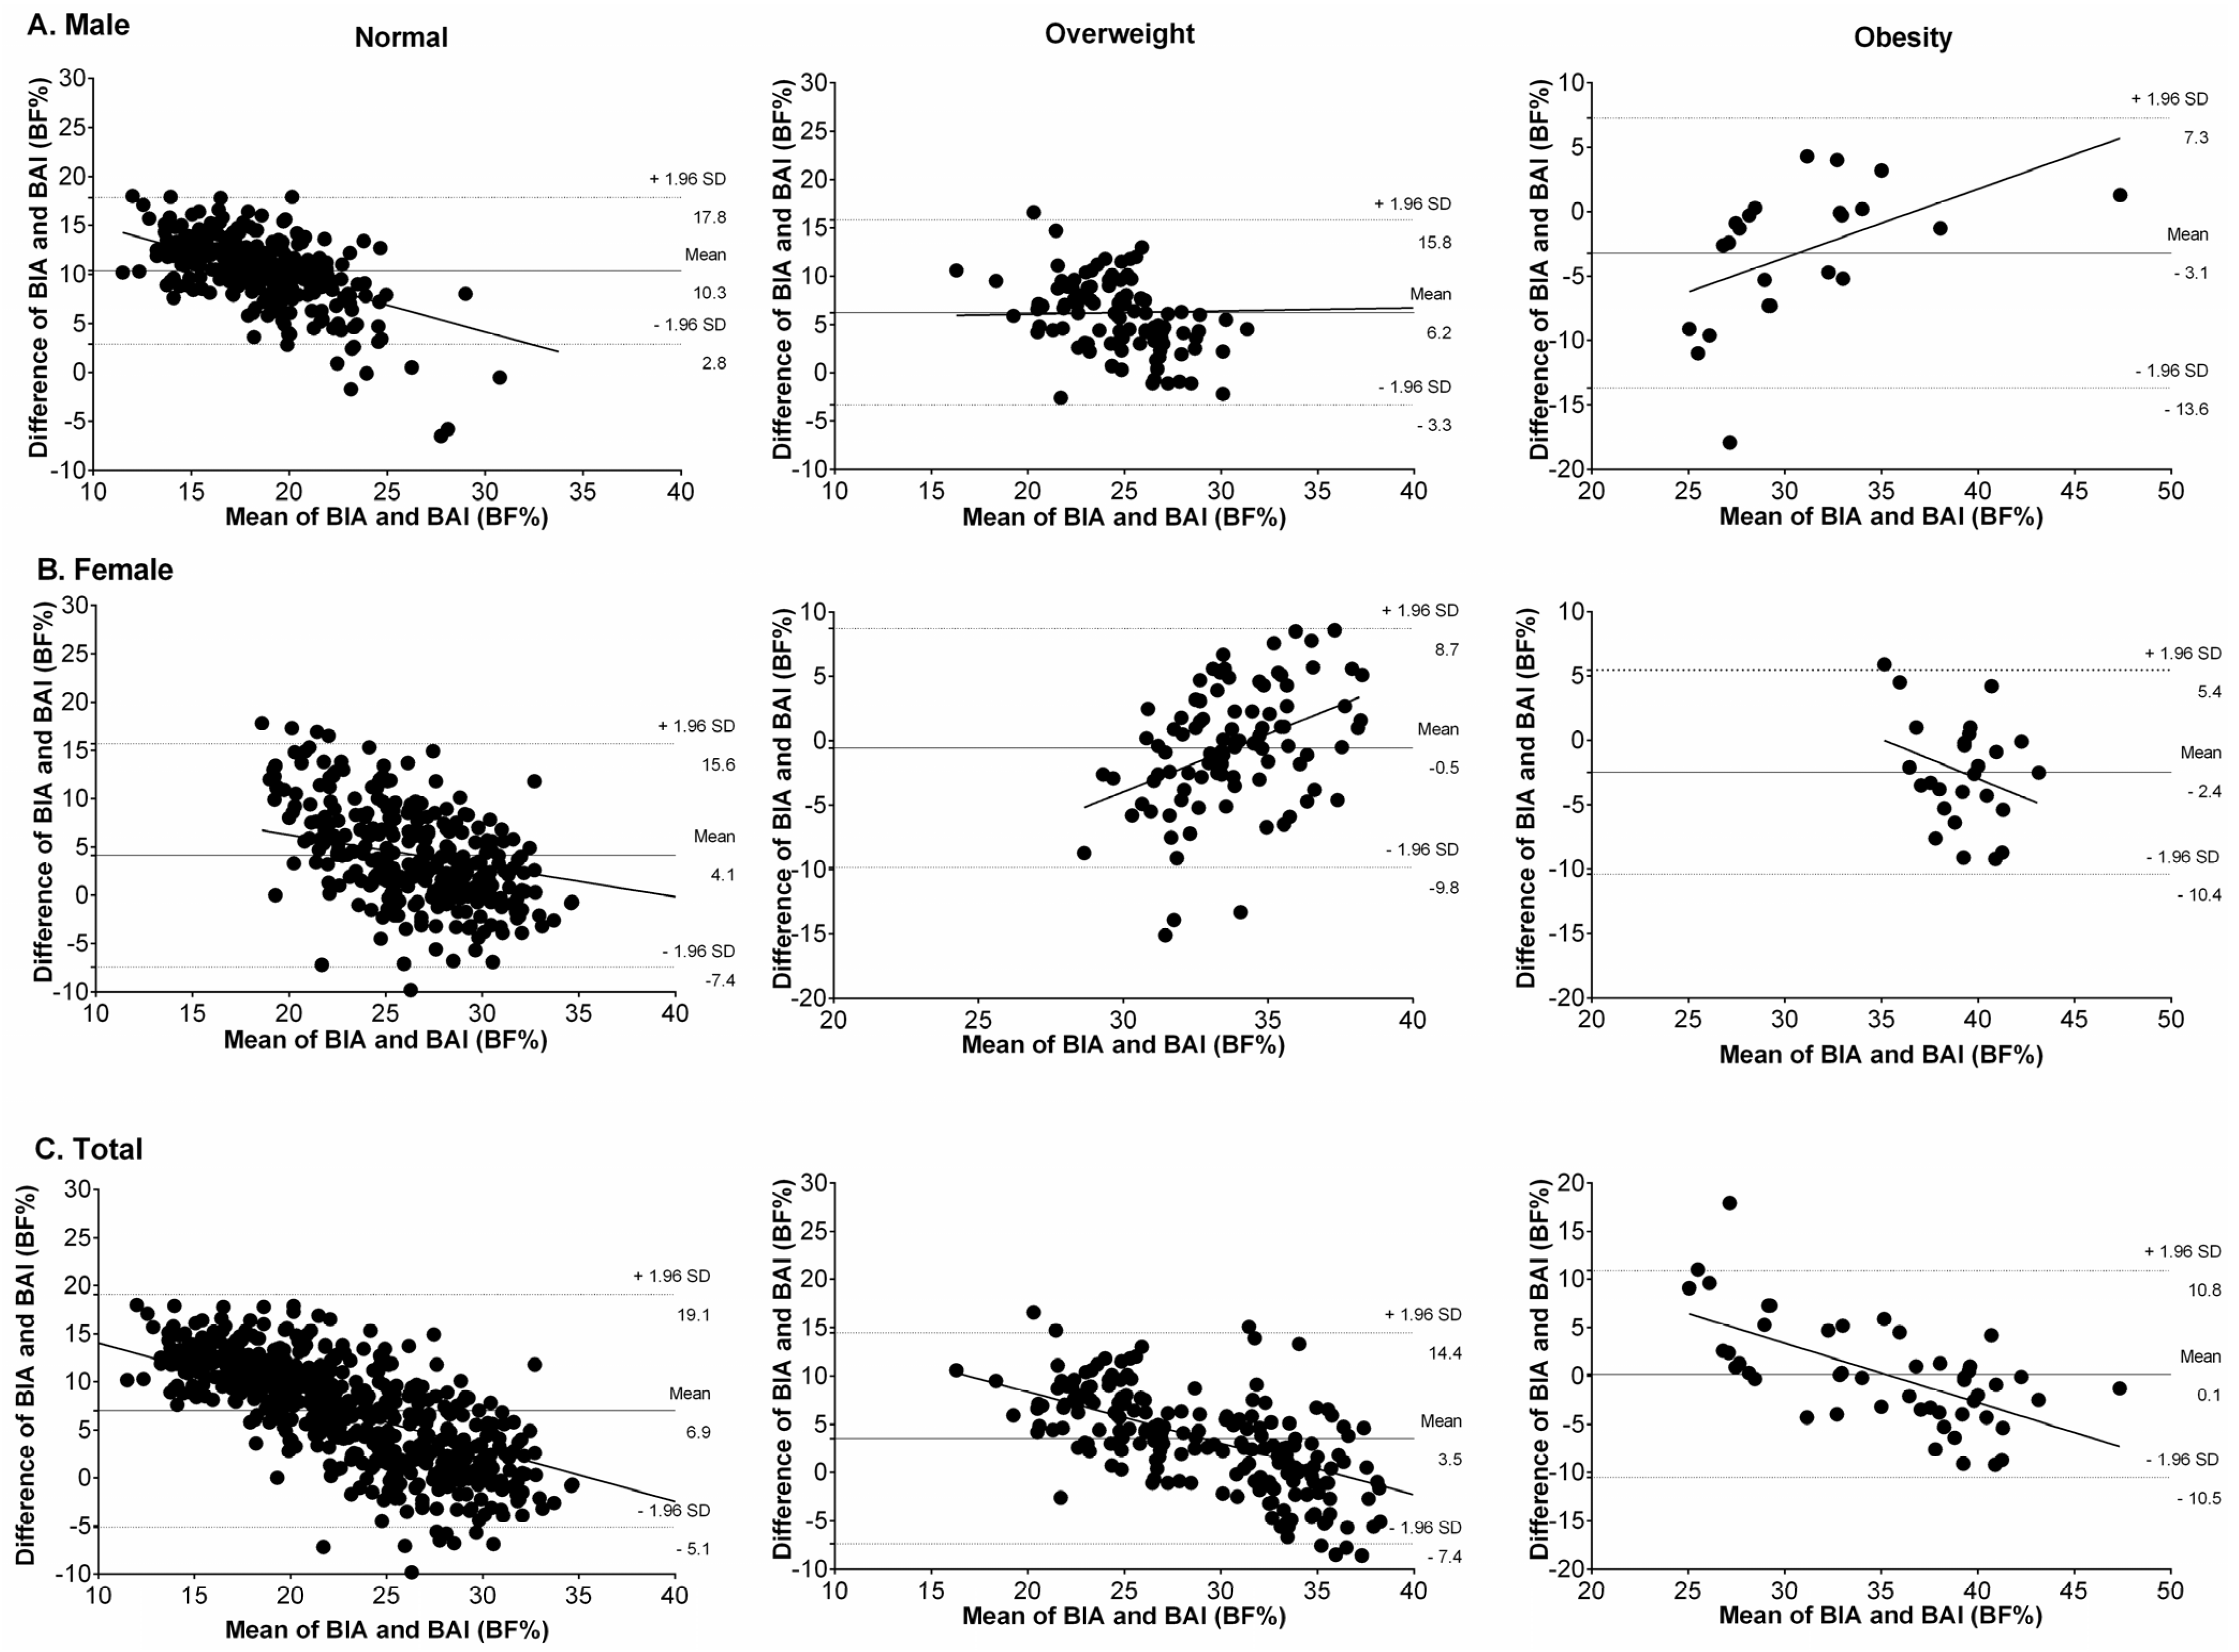
| Present study | 903 apparently healthy and sub-sample with overweight/obese | Mean age 21.4 ± 3.3 | Tetrapolar frequency | Bland–Altman plots Male bias 9.1%, Female bias 3.2%, Total bias 6.0% | Overall, BAI overestimating BF%, in overweight subjects the BAI overestimated BF%, and obese group the BAI underestimated BF% both genders. |
| Geliebter et al. [10] | 19 pre-bariatric surgery clinically severe obese, non-diabetic females | Mean age 32.6 ± 7.7 | Tetrapolar frequency | Bland–Altman plots Bias 2.2% | BAI underestimating BF% |
| Bernhard et al. [11] | 240 patients with severe obesity | Mean age 44.1 ± 11.1 | A single-frequency | Intraclass correlation 0.74; 95% confidence interval = 0.68–0.79 | The two methods were similar according to the intraclass correlation |
| Ezeukwu et al. [12] | 30 obese females | Mean age 22.8 ± 3.3 | A single-frequency | Bland–Altman plots Bias 15.0% | BAI underestimating BF% |
| Lemacks et al. [36] | 187 overweight/obese postmenopausal females | Mean age 55.8 ± 3.3 | Dual-energy X-ray | Concordance correlation coefficient ρc = 0.39 | Poor agreement strength between Dual-energy X-ray (DEXA) BF% and BAI overestimating BF% |
| Vinknes et al. [35] | 5193 middle-aged (47–49 years) and elderly (71–74 years) males and females | Mean range 47–72 | Dual-energy X-ray | Bland–Altman plots Bias in subjects with lower BF% 6.0%, Bias in subjects with higher BF% 1.9% | BAI overestimated adiposity in subjects with lower BF% (particularly in males) and underestimated it in overweight and obese subjects |
© 2017 by the authors; licensee MDPI, Basel, Switzerland. This article is an open access article distributed under the terms and conditions of the Creative Commons Attribution (CC-BY) license (http://creativecommons.org/licenses/by/4.0/).
Share and Cite
Ramírez-Vélez, R.; Correa-Bautista, J.E.; González-Ruíz, K.; Vivas, A.; Triana-Reina, H.R.; Martínez-Torres, J.; Prieto-Benavides, D.H.; Carrillo, H.A.; Ramos-Sepúlveda, J.A.; Villa-González, E.; et al. Body Adiposity Index Performance in Estimating Body Fat Percentage in Colombian College Students: Findings from the FUPRECOL—Adults Study. Nutrients 2017, 9, 40. https://0-doi-org.brum.beds.ac.uk/10.3390/nu9010040
Ramírez-Vélez R, Correa-Bautista JE, González-Ruíz K, Vivas A, Triana-Reina HR, Martínez-Torres J, Prieto-Benavides DH, Carrillo HA, Ramos-Sepúlveda JA, Villa-González E, et al. Body Adiposity Index Performance in Estimating Body Fat Percentage in Colombian College Students: Findings from the FUPRECOL—Adults Study. Nutrients. 2017; 9(1):40. https://0-doi-org.brum.beds.ac.uk/10.3390/nu9010040
Chicago/Turabian StyleRamírez-Vélez, Robinson, Jorge Enrique Correa-Bautista, Katherine González-Ruíz, Andrés Vivas, Héctor Reynaldo Triana-Reina, Javier Martínez-Torres, Daniel Humberto Prieto-Benavides, Hugo Alejandro Carrillo, Jeison Alexander Ramos-Sepúlveda, Emilio Villa-González, and et al. 2017. "Body Adiposity Index Performance in Estimating Body Fat Percentage in Colombian College Students: Findings from the FUPRECOL—Adults Study" Nutrients 9, no. 1: 40. https://0-doi-org.brum.beds.ac.uk/10.3390/nu9010040