Article

Very Low-Protein Diet (VLPD) Reduces Metabolic Acidosis in Subjects with Chronic Kidney Disease: The “Nutritional Light Signal” of the Renal Acid Load

by
Biagio Raffaele Di Iorio
1,*,
Lucia Di Micco
1,
Stefania Marzocco
2,
Emanuele De Simone
3,
Antonietta De Blasio
1,
Maria Luisa Sirico
1,
Luca Nardone
1 and
On behalf of UBI Study Group
1
UOC di Nefrologia, A. Landolfi Hospital, Via Melito SNC, I-83029 Solofra, Avellino, Italy
2
Department of Pharmacy, School of Pharmacy, University of Salerno, Via Giovanni Paolo II 132, I-84084 Fisciano, Salerno, Italy
3
UOC di Nefrologia, AORN San Giuseppe Moscati, I-83100 Avellino, Italy
*
Author to whom correspondence should be addressed.
Aucella Filippo Piemontese Matteo, Grifa Rachele, SC di Nefrologia e Dialisi, IRCCS Casa Sollievo Della Sofferenza, 71013 San Giovanni Rotondo, Foggia, Italy; Guastaferro Pasquale, Nefrologia, Ospedale di Sant’Angelo dei Lombardi (Avellino), Italy; Vitale Fabio, Romano Giuseppina, Cozza Vincenzo, Nefrologia, Ospedale di Ariano Irpino (Avellino), Italy; Santoro Domenico, Annamaria Bruzzese, Francesca Montuori, Department of Clinical and Experimental Medicine, University of Messina, Messina, Italy.
Submission received: 5 October 2016 / Revised: 4 January 2017 / Accepted: 9 January 2017 / Published: 17 January 2017
(This article belongs to the Special Issue Nutrition and Chronic Kidney Disease)

Abstract

:
Background: Metabolic acidosis is a common complication of chronic kidney disease; current guidelines recommend treatment with alkali if bicarbonate levels are lower than 22 mMol/L. In fact, recent studies have shown that an early administration of alkali reduces progression of CKD. The aim of the study is to evaluate the effect of fruit and vegetables to reduce the acid load in CKD. Methods: We conducted a case-control study in 146 patients who received sodium bicarbonate. Of these, 54 patients assumed very low-protein diet (VLPD) and 92 were controls (ratio 1:2). We calculated every three months the potential renal acid load (PRAL) and the net endogenous acid production (NEAP), inversely correlated with serum bicarbonate levels and representing the non-volatile acid load derived from nutrition. Un-paired T-test and Chi-square test were used to assess differences between study groups at baseline and study completion. Two-tailed probability values ≤0.05 were considered statistically significant. Results: At baseline, there were no statistical differences between the two groups regarding systolic blood pressure (SBP), diastolic blood pressure (DBP), protein and phosphate intake, urinary sodium, potassium, phosphate and urea nitrogen, NEAP, and PRAL. VLPD patients showed at 6 and 12 months a significant reduction of SBP (p < 0.0001), DBP (p < 0.001), plasma urea (p < 0.0001) protein intake (p < 0.0001), calcemia (p < 0.0001), phosphatemia (p < 0.0001), phosphate intake (p < 0.0001), urinary sodium (p < 0.0001), urinary potassium (p < 0.002), and urinary phosphate (p < 0.0001). NEAP and PRAL were significantly reduced in VLPD during follow-up. Conclusion: VLPD reduces intake of acids; nutritional therapy of CKD, that has always taken into consideration a lower protein, salt, and phosphate intake, should be adopted to correct metabolic acidosis, an important target in the treatment of CKD patients. We provide useful indications regarding acid load of food and drinks—the “acid load dietary traffic light”.

1. Introduction

Metabolic acidosis is a common complication of chronic kidney disease (CKD) when the glomerular filtration rate falls below 30–40 mL/min/1.73 m2 [1,2,3]. Current guidelines recommend treatment with alkali when bicarbonate levels are lower than 22 mMol/L [1] to prevent complications, such as insulin resistance [4,5], cardiovascular diseases and progression of CKD, among others [6,7].
A correction of metabolic acidosis can be achieved with pharmacological administration of oral alkali as sodium bicarbonate, but also with a diet rich of fruit and vegetables [8,9,10]. In addition, conservative therapy of CKD with low-protein content diets has been revised and reached the scientific rigor of nutritional therapy with the purpose of obtaining a reduction of sodium intake and hypertension [11,12], of phosphate intake and serum phosphate levels [13,14], of proteinuria [15,16], and a delay of dialysis initiation [17], through a reduced load of catabolites and a better metabolic control [17,18,19]. Hence, as fruit and plant proteins are able to reduce dietetic acid load [20,21,22], our aim is to evaluate whether a very low-protein diet (VLPD) reduces both the acid load in patients with CKD and the need of administrating oral sodium bicarbonate.

2. Materials and Methods

We conducted a case-control study in 146 patients participating in the UBI study—a multicentric, prospective, cohort, randomized, open-label and controlled study, registered in ClinicalTrials.gov (NCT01640119), in which patients were randomized to receive either oral sodium bicarbonate or placebo, in order to evaluate mortality and dialysis risk or doubling of creatinine levels [23]. All 146 patients were chosen from the experimental arm of the UBI study; therefore, they were all administered oral bicarbonate: 54 out of them assumed a VLPD and 92 case-controls assumed a control diet together with oral bicarbonate. The duration of follow-up was 12 months. We excluded diabetic subjects to avoid bias due to glycemic control complications. 
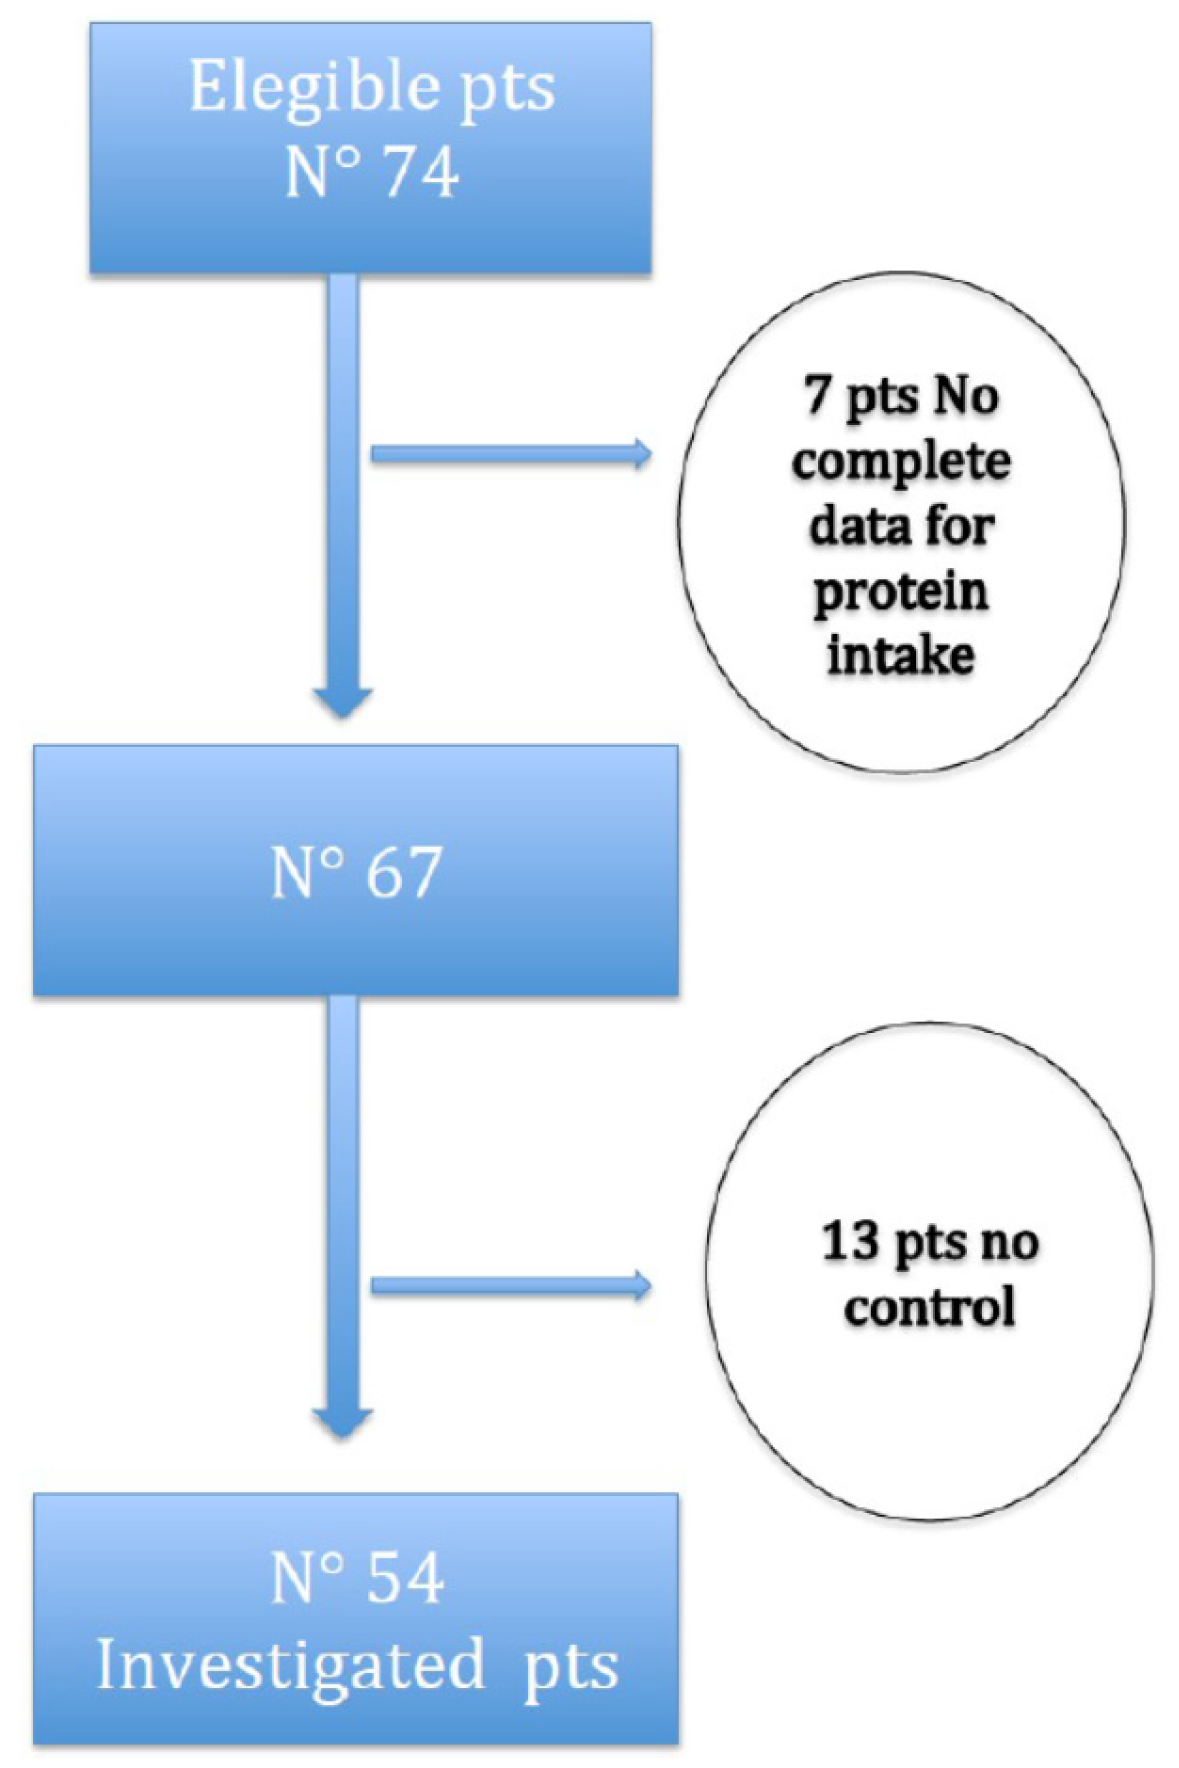
Figure 1 shows the study-flow diagram. Seventy-four subjects assuming VLPD encountered study criteria; 7 of them were excluded because of incompleteness of urinary data needed to calculate protein intake, and 13 because of lack of corresponding controls. Finally, among the included patients (54), only 38 of them had a case-control ratio of 1:2, while the other 16 subjects had a 1:1 ratio.
VLPD consisted of a vegetarian, high-energy diet, with a protein content of 0.3–0.4 g/Kg body weight (BW)/day supplemented with amino-acids and ketoacids in tablets (AlfaKappa® Fresenius Kabi, Verona, Italia). The main nutritional differences between VLPD and control group diet were plant and animal proteins amount, phosphate and salt content (see Table 1).
During the course of CKD several metabolic alterations appear (hyperazotemia, metabolic acidosis, hyperpotassiemia, hyperphosphatemia, increase of parathyroid hormone (PTH) levels, intestinal dysbiosis), that are all positively influenced by a nutritional therapy using a VLPD. This diet is characterized by low-protein content with supplements of essential amino-acids and ketoanalogues (proteins used are roughly 90% of plant type), low phosphate content (300–450 mg in VLPD versus 1000–1200 mg in an usual diet), low salt content (80–95 mmol/day in VLPD versus 140–180 mmol/day in a usual diet), and low organic acids and saturated fats amount. The effects of VLPD in terms of reduction or normalization of urea levels in CKD are excellent, but the effects on other biochemical parameters are also worthy of interest [25].
Every 6 months, study participants performed the common biochemical blood tests and urine parameters (24 h urine urea, creatinine, phosphate, potassium, natrium and protein levels). Particular attention was paid to a correct 24 h urine collection, and all patients were trained in detail how to perform a correct procedure.
Actual protein intake was evaluated according to the formula of Maroni et al.: daily protein intake (g/day) = (6.25 × urinary urea nitrogen mg/day) + (0.031 × body weight-kg) + urinary proteins g/day [26], using 24-h urinary urea and not dietetic interviews. Twenty-four hour urinary urea excretion together with urinary potassium and phosphate excretion were used to calculate the potential renal acid load (PRAL) and net endogenous acid production (NEAP) every 3 months. PRAL and NEAP, both inversely correlated with serum bicarbonate levels, represent the non-volatile acid load derived from nutrition, estimated by the production of non-volatile acids and bases produced during digestion based on known nutritional content [27]. PRAL was calculated by the following formula as described by Remer and Manz [28]: calculated PRAL (mEq/day) = (0.49 × protein intake, g/day) + (0.037 × phosphorus intake, mmol/day) − (0.021 × potassium intake, mmol/day) − ( 0.026 × magnesium, mmol/day) − (0.013 × calcium, mmol/day); NEAP was calculated by the formula described by Frassetto et al. [29]: NEAP (mEq/day) = (54.5 × protein intake (g/day)/potassium intake, (mmol/day)) − 10.2. Thus, protein intake contained in the two previous formulas was calculated with Maroni formula [26], and phosphorus and potassium intake were estimated from 24-h urinary phosphate and potassium excretion, representing the actual phosphate and potassium daily intake, in metabolic stable patients.
Finally, the amount of oral bicarbonate needed to maintain bicarbonate plasma levels between 24 and 28 mEq/L was evaluated every 3 months.

3. Statistical Analysis

Data were reported as mean ± SD or counts (percentage), when appropriate. Un-paired T-test and Chi-square test were used to assess differences between study groups at baseline and study completion. Two-tailed probability values ≤0.05 were considered statistically significant. Analyses were completed using R version 3.1.3 (9 March 2015) (The R Foundation for Statistical Computing).

4. Results

In VLPD group, the causes of renal disease were hypertensive-vascular nephropathies in 38% of patients, glomerulonephrites in 20%, tubule-interstitial nephropathies in 15%, unknown causes in 27% of patients; in control group the percentages were similar: 41%, 18%, 16%, and 24%, respectively. Moreover, the frequency of cardiovascular complications (angina, infarct, ictus) was 46% in VLPD group, and 42% in control group (p = NS).
Table 2 shows the differences between VLPD and control diet at baseline.
Age and percentage of male sex were not different between the two groups because of the case-control design of the study. On the other hand, VLPD patients had a lower body weight (71.6 ± 13.1 vs. 77.8 ± 14.2 kg; p < 0.0001). The other biochemical parameters were not different except for urinary creatinine (69.8 ± 29.1 in VLPD vs. 99 ± 32.7 µmol/day in control group; p < 0.0001), as consequence of different body weights and residual renal function in the two groups (26 ± 12 mL/min in VLPD group vs. 39 ± 14 mL/min in control group; p < 0.0001). There were no statistical differences between the two groups regarding systolic blood pressure (SBP), diastolic blood pressure (DBP), protein and phosphate intake, urinary natrium, potassium, phosphate and urea nitrogen, NEAP, and PRAL (Table 2).
Table 3 shows differences at 6 and 12 months of the same parameters seen in Table 2. VLPD patients showed at 6 and also 12 months a significant reduction of SBP (p < 0.0001), DBP (p < 0.001), plasma urea (p < 0.0001) protein intake (p < 0.0001), calcemia (p < 0.0001), phosphatemia (p < 0.0001), phosphate intake (p < 0.0001), urinary natrium (p < 0.0001), urinary potassium (p < 0.002), and urinary phosphate (p < 0.0001). At six months potassemia was higher in VLPD group than in controls (p < 0.001), but not at 12 months (patients were not administrated potassium binders, and the correction of hyperpotassemia at 12 months was mostly as a consequence of a physiological correction of metabolic acidosis).
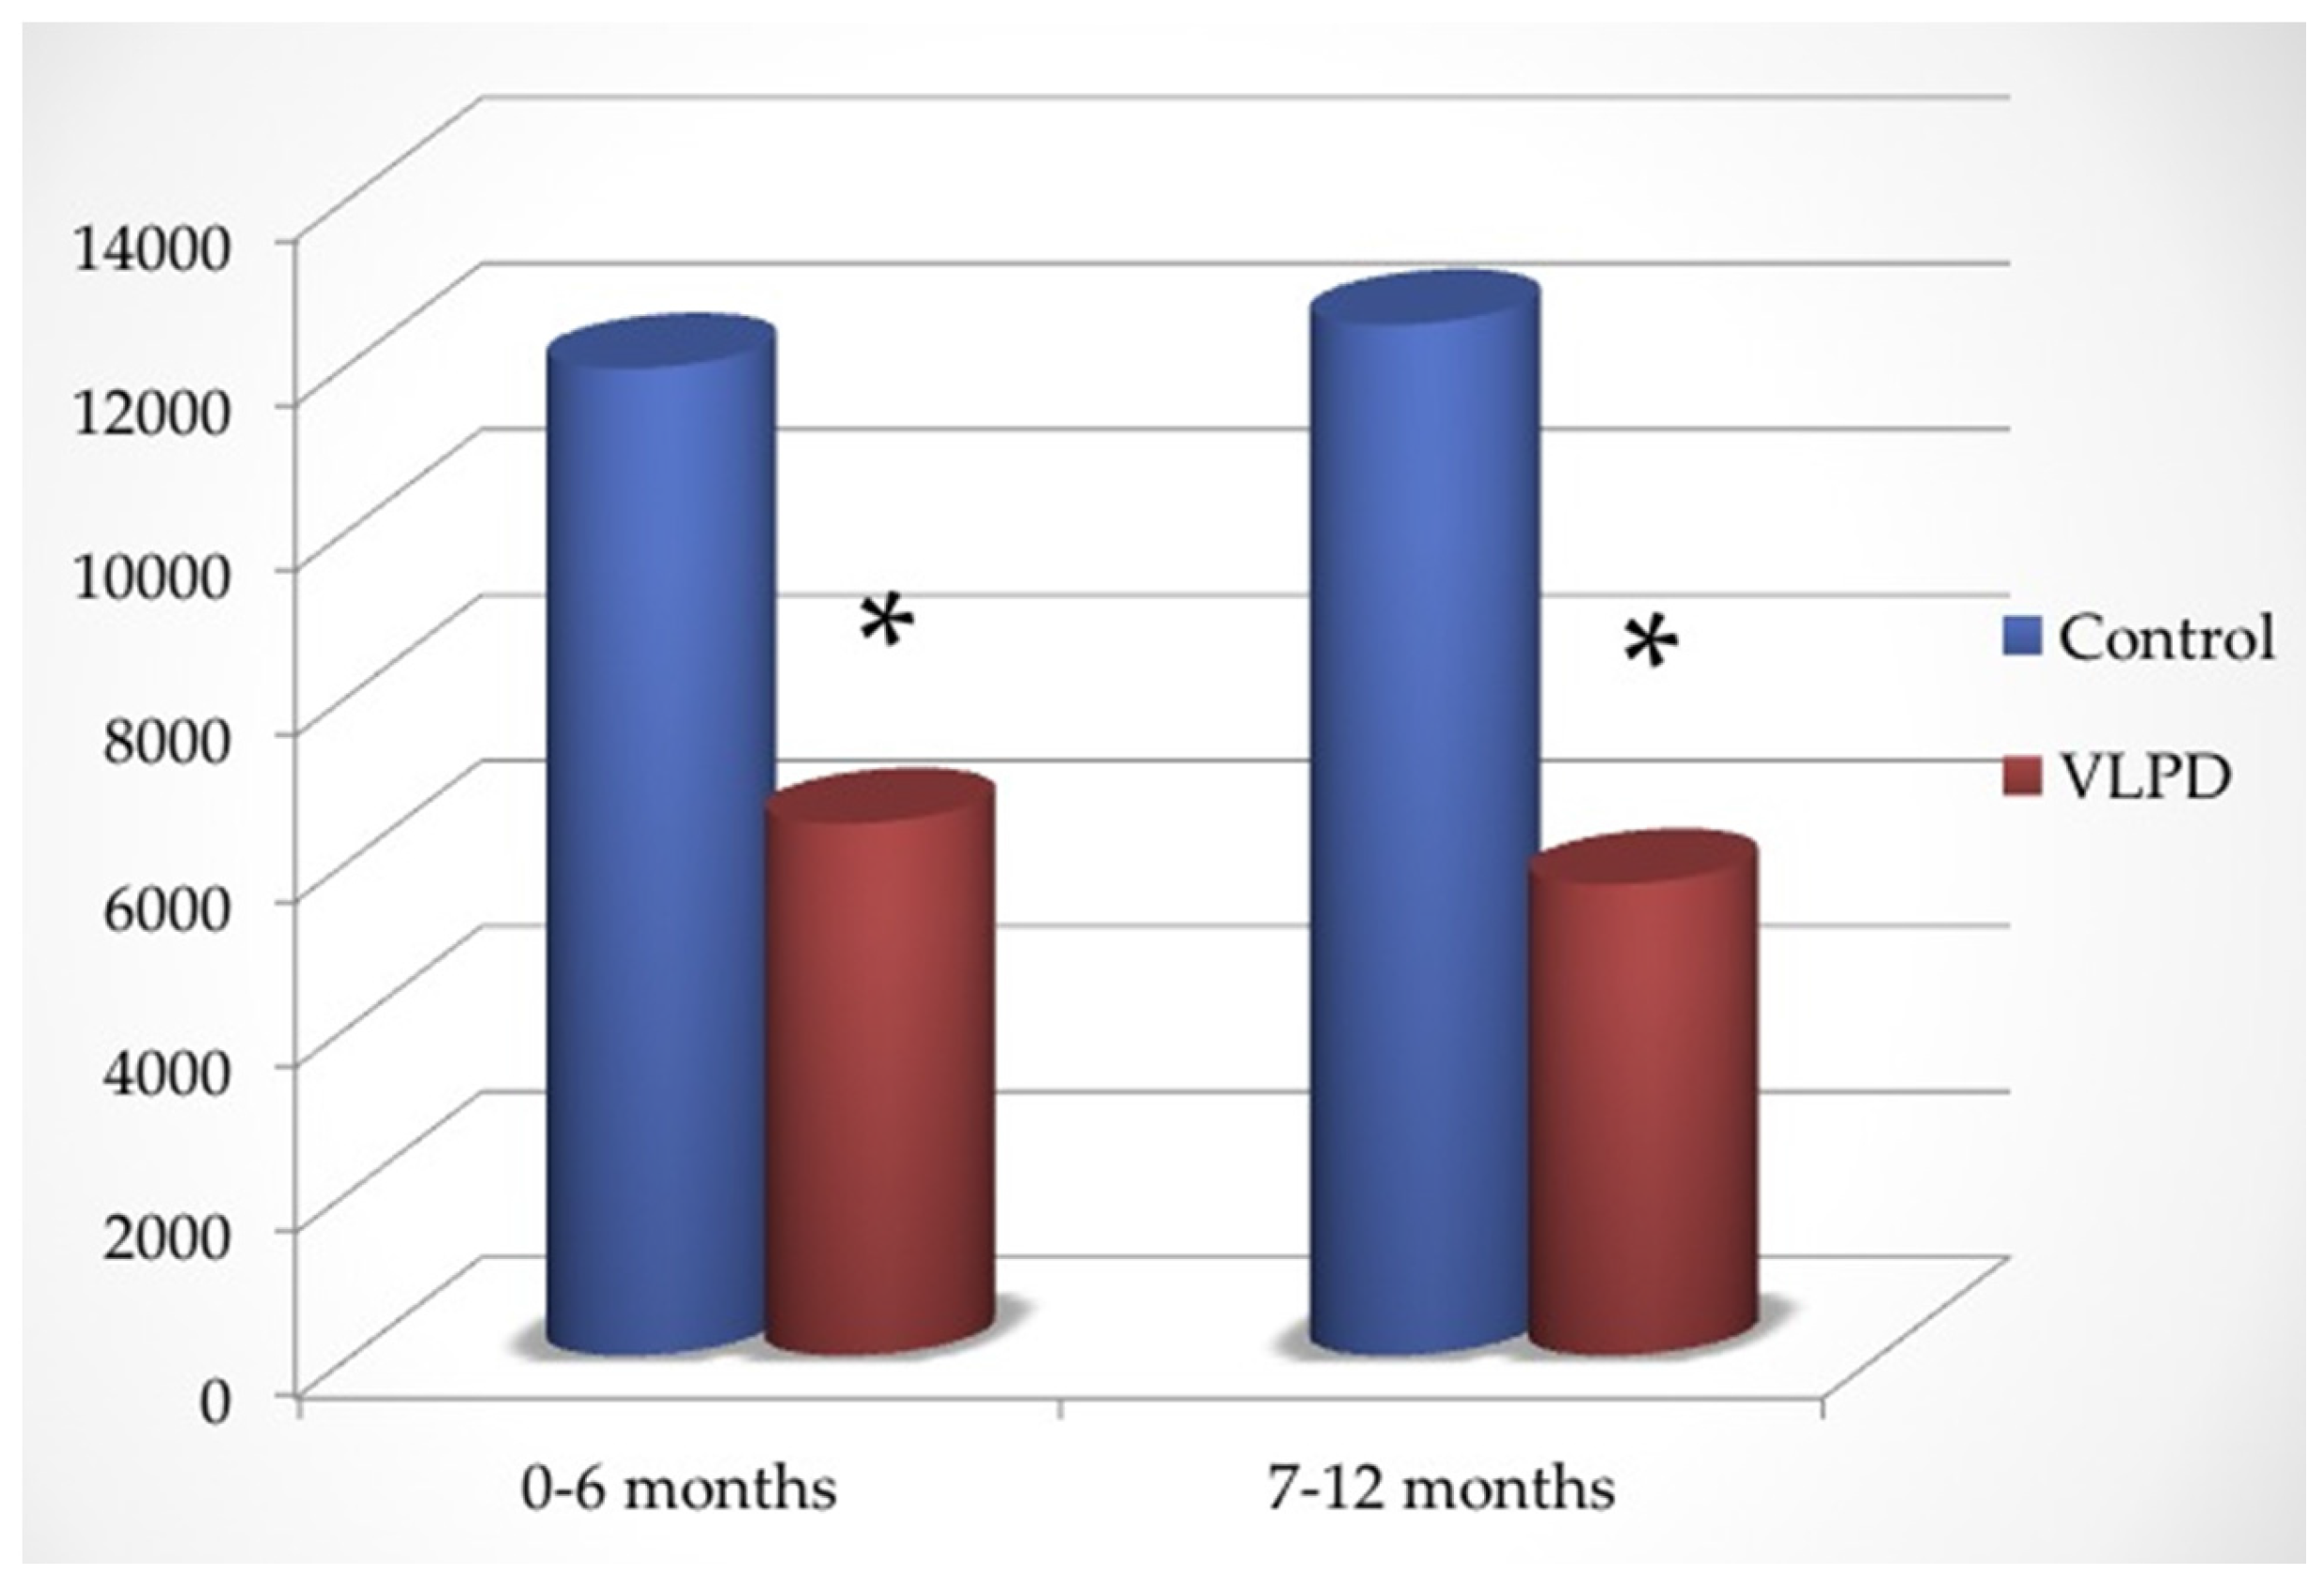
As shown in Figure 2, in the first six months the dose of oral bicarbonate administered was 0.86 ± 0.31 (controls) versus 0.51 ± 0.33 mmol/kg/day (VLPD group) (p < 0.0001), while in the second part of follow-up it was 0.91 ± 0.42 (controls) versus 0.48 ± 0.35 mmol/kg/day (VLPD group) (p < 0.0001).
Total oral bicarbonate administered in the first half of follow-up was 11,919 ± 297 mmol in controls and 6426 ± 224 mmol in VLPD patients, while in the second half of follow-up it was 12,448 ± 451 in controls and 5962 ± 374 mmol in VLPD patients (Figure 2).
Therefore, during the follow-up VLPD reduced the amount of oral bicarbonate of 30–37 mEq/day. (Table 3).
In VLPD group, NEAP dropped from 71 ± 37 mEq/day to 33 ± 16 mEq/day (after six months) and to 25 ± 11 mEq/day (after 12 months) (p < 0.001), while in control patients it remained unchanged (from 73 ± 35 mEq/day to 71 ± 39 mEq/day after six months and to 77 ± 41 mEq/day after 12 months (p = NS). Similarly, in VLPD patients PRAL reduced from 22 ± 9 mEq/day to −4.5 ± 4.1 mEq/day after six months and to −13 ± 6 mEq/day after 12 months (p < 0.001). It was unchanged in control patients (24 ± 13 mEq/day vs. 22 ± 9 mEq/day vs. 34 ± 11 mEq/day respectively; p = NS). Therefore, in VLPD patients NEAP diminished of 53% after six months (p < 0.0001) and of 67% after 12 months (p < 0.0001); PRAL decreased of 120% after six months (p < 0.0001) and of 138% after 12 months (p < 0.0001).

5. Discussion

Beneficial effects of a correction of metabolic acidosis has been described in several studies. In 2010, Menon showed in a post-hoc analysis of MDRD study that low plasma bicarbonate levels increased the risk of outcomes such as renal death and mortality [30]. Wesson et al. showed the paramount role of a diet rich in fruit and vegetables, not only from the nutritional point of view, but also in the nephrology field, because it ensures an amount of alkali that are needed in CKD [31,32,33,34,35,36,37,38,39,40,41].
The fact that the acid load linked to animal proteins is higher than that linked to plant proteins is already known in the scientific community [42,43,44]. Moe et al. showed that the use of only plant proteins, compared to animal proteins, was able to reduce daily serum and urinary phosphate levels in eight subjects, the load of sodium, calcium and phosphorus being equal [14]. Therefore, D’Alessandro et al.’s phosphorus pyramid seems useful as tool for dietary phosphate management [13]. Moreover, several studies showed that the use of animal proteins compared to fruit and plant proteins induced a worsening of hard outcomes such as mortality and CKD progression [39,44]; then, nutritional therapy has to be deeply analyzed, and nutritional prescription has to be focused not only on reduction of protein content but also on proteins’ quality [45].
Our study has some limitations: (1) it is a post-hoc analysis of a previous study, but with a case-control design that should reduce some bias; (2) the small number of patients (again, the case-control study has the property of amplifying the number of studied subjects); and (3) a follow-up of only 12 months.
A strength of our study is the direct measure of protein intake to calculate NEAP and PRAL with the Maroni formula based on 24-h urinary urea nitrogen instead of protein intake estimated by diary interviews, and direct measure of urinary phosphate and potassium. Our data showed that VLPD (containing high quantity of fruit and vegetables and with a very low-proteins amount supplemented with essential amino-acids and ketoanalogues of non-essential amino-acids) significantly reduced NEAP and PRAL. Essential amino-acids contained in VLPD respond to metabolic need ensuring a positive nitrogen balance, thus avoiding malnutrition, while ketoanalogues allow a significant reduction of serum urea levels using urea nitrogen to transform the ketoanalgous in the corresponding no-essential amino acid, as shown in our previous studies [46,47].
The importance of serum urea reduction in CKD patients, somewhat neglected in recent decades, has now also been reconsidered because of its role in the etiopathogenesis of cyanate increase [47] and of intestinal microbial flora alteration in CKD patients [48]. Finally, a higher intake of fruit and vegetables with diet has not to be considered alarming in relation to hyperpotassiemia as long as patients have a good urine output because alkali introduction (contained in fruit and vegetables) facilitates intracellular potassium shift. Moreover, there was no difference in nutritional status before and after the study in the two groups. In fact, BMI did not change in both groups: 28 ± 4 kg/m2 and 27 ± 4 kg/m2 in VLPD group, and 30 ± 5 kg/m2 and 29 ± 4 kg/m2 in controls, before and after the study, respectively. Similarly, serum albumin was also unchanged: 38 ± 7 g/L and 38 ± 3 g/L in VLPD group, and 40 ± 5 g/L and 38 ± 3 g/L in controls, respectively.
In previous studies, VLPD produced a significant decrease of proteinuria, reducing phosphate burden and renal disease progression in CKD patients, also in patients treated with angiotensin converting enzyme-inhibitors, who did not achieve a satisfying proteinuria reduction with the drug [15]. The same happened in our subjects, who showed a proteinuria reduction from 424 mg to 11 mg/day after 12 months of follow-up.
Furthermore, several studies showed that VLPD reduces oxidative stress in both experimental animals [49,50] and in humans [51].
We did not find any depressive symptoms in our patients nor in previous published studies.
It notable that the increase of creatinine clearance from 26 to 30 mL/min after 12 months (renal function gain of 4 mL/min in one year) together with an improvement of nutritional indexes in VLPD group compared to a reduction of creatinine clearance from 39 to 30 mL/min in one year in control group (renal function loss of 9 mL/min) is suggestive of the efficacy of VLPD as nutritional therapy.
In conclusion, nutritional therapy of CKD, which has always taken into consideration a lower protein, salt, and phosphate intake, should also be adopted to correct metabolic acidosis, an important target in the treatment of CKD patients. Correction of metabolic acidosis is not only the aim of VLPD, but also of a vegetarian diet [37,38,48,52,53].
We provide useful indications regarding acid load of food and drinks (see Table 4A–E) that may be used as an acid load dietary “traffic light” similar to the phosphorus pyramid of D’Alessandro et al. [13].
The green light indicates that food can be consumed every day, while the yellow light means a two or three times a week consumption, and the red light an occasional food consumption. Of course, when using the “traffic light” information, one must always consider that the phosphorus content in plant foods have a lower absorption than that contained in foods of animal origin [12,14]; thus, animal foods with low phosphate content can lead to a higher acid load than vegetables with higher phosphate content, because of its higher intestinal absorption. Similarly, fear of potassium in fruits and vegetables in CKD is overrated, especially in CKD patients-4 and CKD-5 with retained urine flow. In fact, in these patients, hyperkalemia can be often determined by the use of aldosterone antagonists (especially for high doses) or, to a lesser degree, of inhibitors of the renin angiotensin aldosterone system drugs, or a combination of both [32,33].
Finally, nutritional therapy of CKD should take into account not only a low-protein diet, but also a rational, complex and integrated control of sodium, phosphorus and acids intake with food [18,52,54]. This means that a reduced intake of proteins is not the only important determinant of nutritional therapy of CKD but also the quality of proteins assumed and the amount of calories (no less than 30–34 kilocalories/body weight/day) in order to maintain a good metabolic and nutritional status and avoid malnutrition [55,56,57].

Author Contributions

Biagio Di Iorio designed the study, followed patients, collected data, and wrote the manuscript; Lucia Di Micco followed patients, collected data, and wrote the manuscript; Stefania Marzocco made the statistical analysis and wrote the manuscript; Emanuele De Simone followed patients, collected data and wrote the manuscript; Antonella De Blasio followed patients and collected data; Maria Luisa Sirico followed patients and collected data; Luca Nardone followed patients and collected data.

Conflicts of Interest

The authors declare no conflict of interest.

References

  1. Kopple, J.D. National Kidney Foundation: K/DOQI clinical practice guidelines for nutrition in chronic renal failure. Am. J. Kidney Dis. 2000, 37, S66–S70. [Google Scholar] [CrossRef]
  2. Chen, W.; Abramowitz, M.K. Metabolic acidosis and the progression of chronic kidney disease. BMC Nephrol. 2014, 15, 55. [Google Scholar] [CrossRef] [PubMed]
  3. Huston, H.K.; Abramowitz, M.K.; Zhang, Y.; Greene, T.; Raphael, K.L. Net endogenous acid production and mortality in NHANES III. Nephrology (Carlton) 2014, 20, 209–215. [Google Scholar] [CrossRef] [PubMed]
  4. Kobayashi, S.; Maesato, K.; Moriya, H.; Ohtake, T.; Ikeda, T. Insulin resistance in patients with chronic kidney disease. Am. J. Kidney Dis. 2005, 45, 275–280. [Google Scholar] [CrossRef] [PubMed]
  5. Mak, R.H.K. Effect of metabolic acidosis on insulin action and secretion in uremia. Kidney Int. 1998, 54, 603–607. [Google Scholar] [CrossRef] [PubMed]
  6. Kurella, M.; Lo, J.C.; Chertow, G.M. Metabolic syndrome and the risk for chronic kidney disease among nondiabetic adults. J. Am. Soc. Nephrol. 2005, 16, 2134–2140. [Google Scholar] [CrossRef] [PubMed]
  7. De Brito-Ashurst, I.; Varagunam, M.; Raftery, M.J.; Yaqoob, M.M. Bicarbonate supplementation slows progression of CKD and improves nutritional status. J. Am. Soc. Nephrol. 2009, 20, 2075–2084. [Google Scholar] [CrossRef] [PubMed]
  8. Mahajan, A.; Simoni, J.; Sheather, S.J.; Broglio, K.R.; Rajab, M.H.; Wesson, D.E. Daily oral sodium bicarbonate preserves glomerular filtration rate by slowing its decline in early hypertensive nephropathy. Kidney Int. 2010, 78, 303–309. [Google Scholar] [CrossRef] [PubMed]
  9. Goraya, N.; Simoni, J.; Jo, C.H.; Wesson, D.E. Treatment of metabolic acidosis in patients with stage 3 chronic kidney disease with fruits and vegetables or oral bicarbonate reduces urine angiotensinogen and preserves glomerular filtration rate. Kidney Int. 2014, 86, 1031–1038. [Google Scholar] [CrossRef] [PubMed]
  10. Goraya, N.; Wesson, D.E. Is dietary acid a modifiable risk factor for nephropathy progression? Am. J. Nephrol. 2014, 39, 142–144. [Google Scholar] [CrossRef] [PubMed]
  11. Appel, L.J.; Moore, T.J.; Obarzanek, E.; Vollmer, W.M.; Svetkey, L.P.; Sacks, F.M.; Bray, G.A.; Vogt, T.M.; Cutler, J.A.; Windhauser, M.M.; et al. A clinical trial of the effects of dietary patterns on blood pressure. DASH Collaborative Research Group. N. Engl. J. Med. 1997, 336, 1117–1124. [Google Scholar] [CrossRef] [PubMed]
  12. Bellizzi, V.; Di Iorio, B.R.; De Nicola, L.; Minutolo, R.; Zamboli, P.; Trucillo, P.; Catapano, F.; Cristofano, C.; Scalfi, L.; Conte, G.; et al. Very low protein diet supplemented with ketoanalogs improves blood pressure control in chronic kidney disease. Kidney Int. 2007, 71, 245–251. [Google Scholar] [CrossRef] [PubMed]
  13. D’Alessandro, C.; Piccoli, G.B.; Cupisti, A. The “phosphorus pyramid”: A visual tool for dietary phosphate management in dialysis and CKD patients. BMC Nephrol. 2015, 16, 9. [Google Scholar] [CrossRef] [PubMed]
  14. Moe, S.M.; Zidehsarai, M.P.; Chambers, M.A.; Jackman, L.A.; Radcliffe, J.S.; Trevino, L.L.; Donahue, S.E.; Asplin, J.R. Vegetarian compared with meat dietary protein source and phosphorus homeostasis in chronic kidney disease. Clin. J. Am. Soc. Nephrol. 2011, 6, 257–264. [Google Scholar] [CrossRef] [PubMed]
  15. Di Iorio, B.R.; Bellizzi, V.; Bellasi, A.; Torraca, S.; D’Arrigo, G.; Tripepi, G.; Zoccali, C. Phosphate attenuates the anti-proteinuric effect of very low-protein diet in CKD patients. Nephrol. Dial. Transplant. 2013, 28, 632–640. [Google Scholar] [CrossRef] [PubMed]
  16. Zoccali, C.; Ruggenenti, P.; Perna, A.; Leonardis, D.; Tripepi, R.; Tripepi, G.; Mallamaci, F.; Remuzzi, G.; REIN Study Group. Phosphate may promote CKD progression and attenuate renoprotective effect of ACE inhibition. J. Am. Soc. Nephrol. 2011, 22, 1923–1930. [Google Scholar] [CrossRef] [PubMed]
  17. Brunori, G.; Viola, B.F.; Parrinello, G.; De Biase, V.; Como, G.; Franco, V.; Garibotto, G.; Zubani, R.; Cancarini, G.C. Efficacy and safety of a very-low-protein diet when postponing dialysis in the elderly: A prospective ran- domized multicenter controlled study. Am. J. Kidney Dis. 2007, 49, 569–580. [Google Scholar] [CrossRef] [PubMed]
  18. Fouque, D.; Mitch, W.E. Low-protein diets in chronic kidney disease: Are we finally reaching a consensus? Nephrol. Dial. Transplant. 2015, 30, 6–8. [Google Scholar] [CrossRef] [PubMed]
  19. Bellizzi, V.; Chiodini, P.; Cupisti, A.; Viola, B.F.; Pezzotta, M.; De Nicola, L.; Minutolo, R.; Barsotti, G.; Piccoli, G.B.; di Iorio, B. Very low-protein diwt plus ketoacids in CKD and risk of death during ESRD: A historical cohort controlled study. Nephrol. Dial. Transplant. 2015, 30, 71–77. [Google Scholar] [CrossRef] [PubMed]
  20. Chauveau, P.; Fouque, D.; Combe, C.; Aparicio, M. Evolution of the diet from the paleolithic to today: Progress or regress? Nephrol. Ther. 2013, 9, 202–208. [Google Scholar] [CrossRef] [PubMed]
  21. Adeva, M.M.; Souto, G. Diet-induced metabolic acidosis. Clin. Nutr. 2011, 30, 416–421. [Google Scholar] [CrossRef] [PubMed]
  22. Ikizler, H.O.; Zelnick, L.; Ruzinskin, J.; Curtin, L.; Utzschneider, K.M.; Kestenbaum, B.; Himmelfarb, J.; De Boer, I.H. Dietary acid load is associated with serum bicarbonate but not insulin sensivity in CKD. J. Ren. Nutr. 2016, 26, 93–102. [Google Scholar] [CrossRef] [PubMed]
  23. Di Iorio, B.; Aucella, F.; Conte, G.; Cupisti, A.; Santoro, D. A prospective, multicenter, randomized, controlled study: The correction of metabolic acidosis with Use of Bicarbonate in Chronic Renal Insufficiency (UBI) Study. J. Nephrol. 2012, 25, 437–440. [Google Scholar] [CrossRef] [PubMed]
  24. Aparicio, M.; Bellizzi, V.; Chauveau, P.; Cupisti, A.; Ecder, T.; Fouque, D.; Garneata, L.; Lin, S.; Mitch, W.E.; Teplan, V.; et al. Keto-acid therapy in predialysis chronic kidney disease patients: Final consensus. J. Ren. Nutr. 2012, 22 (Suppl. 2), S22–S24. [Google Scholar] [CrossRef] [PubMed]
  25. Di Iorio, B.; de Simone, E.; Quintaliani, P. Protein Intake with diet or nutritional therapy in ESRD. A different point of view for non specialists. G. Ital. Nefrol. 2016, 33, 2. (In Italian) [Google Scholar]
  26. Maroni, B.J.; Steinman, T.I.; Mitch, W.E. A method for estimating nitrogen intake of patients with chronic renal failure. Kidney Int. 1985, 27, 58–65. [Google Scholar] [CrossRef] [PubMed]
  27. Frassetto, L.A.; Lanham-New, S.A.; MacDonald, H.M.; Remer, T.; Sebastian, A.; Tucker, K.L.; Tylavsky, F.A. Standardizing terminology for estimating the diet-dependent net acid load to the metabolic system. J. Nutr. 2007, 137, 1491–1492. [Google Scholar] [PubMed]
  28. Remer, T.; Manz, F. Estimation of the renal net acid excretion by adults consuming diets containing variable amounts of protein. Am. J. Clin. Nutr. 1994, 59, 1356–1361. [Google Scholar] [PubMed]
  29. Frassetto, L.A.; Todd, K.M.; Morris, R.J.C.; Sebastian, A. Estimation of net endogenous noncarbonic acid production in humans from diet potassium and protein contents. Am. J. Clin. Nutr. 1998, 68, 576–583. [Google Scholar] [PubMed]
  30. Menon, V.; Tighiouart, H.; Vaughn, N.S.; Beck, G.J.; Kusek, J.W.; Collins, A.J.; Greene, T.; Sarnak, M.J. Serum bicarbonate and long-term outcomes in CKD. Am. J. Kidney Dis. 2010, 56, 907–914. [Google Scholar] [CrossRef] [PubMed]
  31. Phisitkul, S.; Khanna, A.; Simoni, J.; Broglio, K.; Sheather, S.; Rajab, M.H.; Wesson, D.E. Amelioration of metabolic acidosis in patients with low GFR reduced kidney endothelin production and kidney injury, and better preserved GFR. Kidney Int. 2010, 77, 617–623. [Google Scholar] [CrossRef] [PubMed]
  32. Wesson, D.E.; Jo, C.H.; Simoni, J. Angiotensin II-mediated GFR decline in subtotal nephrectomy is due to acid retention associated with reduced GFR. Nephrol. Dial. Transplant. 2015, 30, 762–770. [Google Scholar] [CrossRef] [PubMed]
  33. Wesson, D.E.; Simoni, J. Acid retention during kidney failure induces endothelin and aldosterone production which lead to progressive GFR decline, a situation ameliorated by alkali diet. Kidney Int. 2010, 78, 1128–1135. [Google Scholar] [CrossRef] [PubMed]
  34. Wesson, D.E.; Simoni, J.; Broglio, K.; Sheather, S. Acid retention accompanies reduced GFR in humans and increases plasma levels of endothelin and aldosterone. Am. J. Physiol. Ren. Physiol. 2011, 300, F830–F837. [Google Scholar] [CrossRef] [PubMed]
  35. Goraya, N.; Wesson, D.E. Does correction of metabolic acidosis slow chronic kidney disease progression? Curr. Opin. Nephrol. Hypertens. 2013, 22, 193–197. [Google Scholar] [CrossRef] [PubMed]
  36. Goraya, N.; Wesson, D.E. Acid-base status and progression of chronic kidney disease. Curr. Opin. Nephrol. Hypertens. 2012, 21, 552–556. [Google Scholar] [CrossRef] [PubMed]
  37. Wesson, D.E.; Jo, C.H.; Simoni, J. Angiotensin II receptors mediate increased distal nephron acidification caused by acid retention. Kidney Int. 2012, 82, 1184–1194. [Google Scholar] [CrossRef] [PubMed]
  38. Goraya, N.; Wesson, D.E. Dietary interventions to improve outcomes in chronic kidney disease. Curr. Opin. Nephrol. Hypertens. 2015, 24, 505–510. [Google Scholar] [CrossRef] [PubMed]
  39. Goraya, N.; Simoni, J.; Jo, C.H.; Wesson, D.E. A comparison of treating metabolic acidosis in CKD stage 4 hypertensive kidney disease with fruits and vegetables or sodium bicarbonate. Clin. J. Am. Soc. Nephrol. 2013, 8, 371–381. [Google Scholar] [CrossRef] [PubMed]
  40. Goraya, N.; Wesson, D.E. Dietary Protein as Kidney Protection: Quality or Quantity? J. Am. Soc. Nephrol. 2016, 27, 1877–1879. [Google Scholar] [CrossRef] [PubMed]
  41. Phisitkul, S.; Hacker, C.; Simoni, J.; Tran, R.M.; Wesson, D.E. Dietary protein causes a decline in the glomerular filtration rate of the remnant kidney mediated by metabolic acidosis and endothelin receptors. Kidney Int. 2008, 73, 192–199. [Google Scholar] [CrossRef] [PubMed]
  42. Banerjee, T.; Crews, D.C.; Wesson, D.E.; Tilea, A.M.; Saran, R.; Ríos-Burrows, N.; Williams, D.E.; Powe, N.R.; Centers for Disease Control and Prevention Chronic Kidney Disease Surveillance Team. High Dietary Acid Load Predicts ESRD among Adults with CKD. J. Am. Soc. Nephrol. 2015, 26, 1693–1700. [Google Scholar] [CrossRef] [PubMed]
  43. Wesson, D.E.; Nathan, T.; Rose, T.; Simoni, J.; Tran, R.M. Dietary protein induces endothelin-mediated kidney injury through enhanced intrinsic acid production. Kidney Int. 2007, 71, 210–217. [Google Scholar] [CrossRef] [PubMed]
  44. Gutiérrez, O.M.; Muntner, P.; Rizk, D.V.; McClellan, W.M.; Warnock, D.G.; Newby, P.K.; Judd, S.E. Dietary patterns and risk of death and progression to ESRD in individuals with CKD: A cohort study. Am. J. Kidney Dis. 2014, 64, 204–213. [Google Scholar] [CrossRef] [PubMed]
  45. Di Iorio, B.R.; Minutolo, R.; De Nicola, L.; Bellizzi, V.; Catapano, F.; Iodice, C.; Rubino, R.; Conte, G. Supplemented very low protein diet ameliorates responsiveness to erythropoietin in chronic renal failure. Kidney Int. 2003, 64, 1822–1828. [Google Scholar] [CrossRef] [PubMed]
  46. Bellizzi, V.; Cupisti, A.; Locatelli, F.; Bolasco, P.; Brunori, G.; Cancarini, G.; Caria, S.; De Nicola, L.; Di Iorio, B.R.; Di Micco, L.; et al. Low-protein diets for chronic kidney disease patients: The Italian experience. BMC Nephrol. 2016, 17, 77. [Google Scholar] [CrossRef] [PubMed]
  47. El-Gamal, D.; Rao, S.P.; Holzer, M.; Hallström, S.; Haybaeck, J.; Gauster, M.; Wadsack, C.; Kozina, A.; Frank, S.; Schicho, R.; et al. The urea decomposition product cyanate promotes endothelial dysfunction. Kidney Int. 2014, 86, 923–931. [Google Scholar] [CrossRef] [PubMed]
  48. Vaziri, N.D.; Wong, J.; Pahl, M.; Piceno, Y.M.; Yuan, J.; DeSantis, T.Z.; Ni, Z.; Nguyen, T.H.; Andersen, G.L. Chronic kidney disease alters intestinal microbial flora. Kidney Int. 2013, 83, 308–315. [Google Scholar] [CrossRef] [PubMed]
  49. Gao, X.; Wu, J.; Dong, Z.; Hua, C.; Hu, H.; Mei, C. A low-protein diet supplemented with ketoacids plays a more protective role against oxidative stress of rat kidney tissue with 5/6 nephrectomy than a low-protein diet alone. Br. J. Nutr. 2010, 103, 608–616. [Google Scholar] [CrossRef] [PubMed]
  50. Gao, X.; Huang, L.; Grosjean, F.; Esposito, V.; Wu, J.; Fu, L.; Hu, H.; Tan, J.; He, C.; Gray, S.; Jain, M.K.; et al. Low-protein diet supplemented with ketoacids reduces the severity of renal disease in 5/6 nephrectomized rats: A role for KLF15. Kidney Int. 2011, 79, 987–996. [Google Scholar] [CrossRef] [PubMed]
  51. Di Iorio, B.R.; Cucciniello, E.; Martino, R.; Frallicciardi, A.; Tortoriello, R.; Struzziero, G. Acute and persistent antiproteinuric effect of a low-protein diet in chronic kidney disease. G Ital. Nefrol. 2009, 26, 608–615. [Google Scholar] [PubMed]
  52. Garneata, L.; Stancu, A.; Dragomir, D.; Stefan, G.; Mircescu, G. Ketoanalogue-Supplemented Vegetarian Very Low-Protein Diet and CKD Progression. J. Am. Soc. Nephrol. 2016, 27, 2164–2176. [Google Scholar] [CrossRef] [PubMed]
  53. Chauveau, P.; Combe, C.; Fouque, D.; Aparicio, M. Vegetarianism: Advantages and drawbacks in patients with chronic kidney diseases. J. Ren. Nutr. 2013, 23, 399–405. [Google Scholar] [CrossRef] [PubMed]
  54. Piccoli, G.B.; Ferraresi, M.; Deagostini, M.C.; Vigotti, F.N.; Consiglio, V.; Scognamiglio, S.; Moro, I.; Clari, R.; Fassio, F.; Biolcati, M.; et al. Vegetarian low-protein diets supplemented with keto analogues: A niche for the few or an option for many? Nephrol. Dial. Transplant. 2013, 28, 2295–2305. [Google Scholar] [CrossRef] [PubMed]
  55. Fouque, D.; Chen, J.; Chen, W.; Garneata, L.; Hwang, S.J.; Kalantar-Zadeh, K.; Kopple, J.D.; Mitch, W.E.; Piccoli, G.; Teplan, V.; et al. Adherence to ketoacids/essential amino acids-suppleented low protein diets and new indications for patients with chronic kidney disease. BMC Nephrol. 2016, 17, 63. [Google Scholar] [CrossRef] [PubMed]
  56. Aparicio, M.; Bellizzi, V.; Chauveau, P.; Cupisti, A.; Ecder, T.; Fouque, D.; Garneata, L.; Lin, S.; Mitch, W.; Teplan, V.; et al. Do ketoanalogues still have a role in delaying dialysis initiation in CKD predialysis patients? Semin. Dial. 2013, 26, 714–719. [Google Scholar] [CrossRef] [PubMed]
  57. Mitch, W.E.; Remuzzi, G. Diets for patients with chronic kidney disease, should we reconsider? BMC Nephrol. 2016, 17, 80. [Google Scholar] [CrossRef] [PubMed]
Figure 1. Flow chart of the study.
Nutrients 09 00069 g001
Figure 2. Dose of oral bicarbonate administered in control and VLPD (mmol).
Nutrients 09 00069 g002
Table 1. Diet’s composition of the two groups.
ControlVLPD
Total Kilocalories2320 ± 2072110 ± 225
Total protein (g/kg/day)0.6–10.3–0.4
Animal protein (%)7510
Vegetal protein (%)2590
Sodium range (mmol)140–18080–95
Potassium range (mmol)40–6030–50
Calcium range (mg)1000–1200500–750
Phosphorus range (mg)700–900300–450
Magnesium range (mg)300–400300–400
VLPD is a nutritional therapy used in advanced stages of CKD (from stage 3B to more severe stages) [24].
Table 2. Patients’ baseline data.
AllControlVLPDp
Number1469254
Males, %585858NS
Age, years73.6 ± 11.273.7 ± 11.973.5 ± 10.0NS
Height, cm161 ± 8162 ± 7159 ± 8NS
BW, kg75.5 ± 14.177.8 ± 14.271.6 ± 13.10.0001
SBP, mm Hg122 ± 20125 ± 17117 ± 23NS
DBP, mm Hg73 ± 974 ± 871 ± 10NS
Creatinine, µmol/L187.41 ± 68.01180.34 ± 65.42198.02 ± 72.49NS
Azotemia, mmol/L31.1 ± 11.431.4 ± 11.130.3 ± 12.1NS
Glycaemia, mmol/L5.6 ± 0.95.9 ± 0.95.3 ± 1.0NS
Uric Acid, µmol/L339.0 ± 71.4410.4 ± 77.3392.6 ± 59.5NS
Natrium, mmol/L139 ± 3140 ± 4139 ± 3NS
Potassium, mmol/L4.8 ± 1.14.9 ± 0.74.7 ± 1.3NS
Calcium, mmol/L2.3 ± 0.22.3 ± 0.72.2 ± 2.0NS
Phosphorus, mmol/L1.21 ± 0.221.22 ± 0.231.19 ± 0.20NS
Bicarbonates, mmol/L20.81 ± 1.7220.77 ± 1.7720.85 ± 1.61NS
Cholesterol, mmol/L3.99 ± 0.914.04 ± 0.853.94 ± 0.93NS
Triglycerides, mmol/L1.51 ± 0.651.54 ± 0.71.48 ± 0.58NS
PTH, pmol/L12.94 ± 8.8111.88 ± 7.4314.43 ± 10.29NS
Haemoglobin, g/L123 ± 17124 ± 17121 ± 18NS
Albumin, g/L39 ± 440 ± 538 ± 7NS
CRP, mg/L11 ± 2810 ± 1413 ± 35NS
Urinary natrium, mmol/day144 ± 78162 ± 77135 ± 99NS
Urinary potassium, mmol/day46 ± 2452 ± 2238 ± 19NS
Urinary phosphate, mmol/day197.7 ± 86.9201.2 ± 84.3194.4 ± 73NS
UUN, mmol/day7.5 ± 2.57.1 ± 1.87.8 ± 2.1NS
Urinary proteins, g/day0.525 ± 0.8290.593 ± 10.424 ± 0.475NS
Urinary creatinine, µmol/day87.5 ± 34.599 ± 32.769.8 ± 29.10.0001
Creatinine clearance, mL/min33 ± 1539 ± 1426 ± 120.0001
Protein intake, g/day78 ± 1080 ± 1275 ± 14NS
Phosphorus intake, mmol/day329.5 ± 144.7335.3 ± 140.5324 ± 121.8NS
NEAP72 ± 3673 ± 3571 ± 37NS
PRAL23 ± 1124 ± 1322 ± 9NS
BW: body weight; SBP: Systolic blood pressure; DBP: diastolic blood pressure; PTH: parathyroid hormone; CRP: C-reactive protein; UUN: urinary urea nitrogen; NEAP: net endogenous acid production; PRAL: potential renal acid load; NS: not significant.
Table 3. Data at 6 and 12 months in control group and VLPD group.
Control 6 MonthsVLPD 6 MonthspControl 12 MonthsVLPD 12 Monthsp
BW, kg77.3 ± 13.770.2 ± 14.10.00376.0 ± 13.069.1 ± 14.50.0001
SBP, mmHg124 ± 17115 ± 140.0001128 ± 17110 ± 160.0001
DBP, mmHg76 ± 771 ± 80.000176 ± 970 ± 80.0001
Creatinine, µmol/L192.71 ± 66.3194.48 ± 74.26NS196.25 ± 62.76195.36 ± 71.6NS
Azotemia, mmol/L31.06 ± 11.7816.8 ± 8.60.000132.1 ± 11.114.6 ± 7.80.0001
Glycaemia, mmol/L6.5 ± 1.46.0 ± 1NS6.3 ± 1.26.2 ± 0.9NS
Uric acid, µmol/L327.1 ± 118.9315.2 ± 107.1NS285.5 ± 95.2291.4 ± 29.7NS
Natrium, mmol/L139 ± 4139 ± 3NS140 ± 3137 ± 3NS
Potassium, mmol/L4.7 ± 0.55.3 ± 0.50.00014.8 ± 0.64.9 ± 0.5NS
Calcium, mmol/L2.3 ± 0.12.1 ± 0.30.00012.3 ± 0.12.2 ± 0.20.0001
Phosphate, mmol/L1.4 ± 0.41.2 ± 0.20.00011.5 ± 0.41.1 ± 0.20.0001
Bicarbonates, mmol/L25.85 ± 1.9026.81 ± 1.80NS25.71 ± 1.5226.13 ± 1.66NS
Cholesterol, mmol/L4.1 ± 0.83.9 ± 1NS4.4 ± 0.83.8 ± 0.8NS
Triglycerides, mmol/L1.6 ± 0.81.5 ± 0.7NS1.4 ± 0.61.2 ± 0.5NS
PTH, pmol/L14.7 ± 15.912.2 ± 8.4NS22.4 ± 9.613.1 ± 8.70.0001
Hb, g/L123 ± 15116 ± 20NS123 ± 15124 ± 10NS
Albumin, g/L38 ± 438 ± 5NS38 ± 438 ± 3NS
CRP, mg/L7 ± 106 ± 15NS6 ± 85 ± 10NS
Urinary natrium, mmol/day142 ± 6199 ± 360.0001142 ± 5895 ± 360.0001
Urinary potassium, mmol/day46 ± 1831 ± 210.00239 ± 1347 ± 200.004
Urinary phosphate, mmol/day191.2 ± 76.9112.7 ± 51.70.000176.9 ± 90.497.9 ± 61.40.0001
UUN, mmol/day6.1 ± 1.82.9 ± 0.7NS6.4 ± 2.52.9 ± 1.10.0001
Urinary proteins, g/day0.429 ± 0.450.382 ± 0.42NS0.452 ± 0.6610.211 ± 0.1610.009
Urinary creatinine, µmol/day86.6 ± 3081.3 ± 27.4NS88.4 ± 3.580.4 ± 25.6NS
Creatinine Clearance, mL/min37 ± 1528 ± 140.000135 ± 1430 ± 17NS
Protein intake, g/day77 ± 1425 ± 70.000181 ± 1630 ± 170.0011
Phosphorus intake, mmol/day318.8 ± 128.2155.7 ± 86.20.0001238.4 ± 93.7117.5 ± 78.20.0001
NEAP71 ± 3933 ± 160.000177 ± 4125 ± 110.0001
PRAL22 ± 9−4.5 ± 4.10.000134 ± 11−13 ± 60.0001
BW: body weight; SBP: Systolic blood pressure; DBP: diastolic blood pressure; PTH: parathyroid hormone; CRP: C-reactive protein; UUN: urinary urea nitrogen. NS: not significant.
Table 4. (A) PRAL (Potential Renal Acid Load) from −5 to −2.0 mEq/100 g; (B) PRAL (Potential Renal Acid Load) from −2.0 to 0 mEq/100 g; (C) PRAL (Potential Renal Acid Load) from 0 to 4.0 mEq/100 g; (D) PRAL (Potential Renal Acid Load) from 4.1 to 10 mEq/100 g; (E) PRAL (Potential Renal Acid Load) > 10 mEq/100 g.
(A) 
(A) 
PRALKP
BEVERAGES
Apple juice−2.21015
Beetroot juice−3.9
Carrot juice−4.829242
Espresso−2.31153
Lemon juice−2.514010
Orange juice−2.920017
Red wine−2.412723
Tomato juice−2.818819
Vegetable−3.619317
Apple vinegar−2.38
VEGETABLE
Huzelnuts−2.8466322
Apples−2.213212
Apricots−4.832016
Bananas−5.535028
Black currants−6.537043
Cherries−3.622918
Figs, dried−18.11010111
Grapes−3.91924
Kiwi−4.140034
Lemon−2.614011
Mango−3.325014
Orange−2.720022
Peache−2.426020
Pear−2.912711
Pineapple−2.72508
Raisins−2127529
Strawberries−2.216028
Watermelon−1.928025
Broussel sprouts−4.545050
Carrots−4.922037
Cauliflower−4.035069
Celery−5.228045
Chicory−2.018031
Eggplant−3.418433
Fennel−7.939439
Kale−7.824329
Kohlrabi−5.519129
Lamb’s Lettuce−5.045930
Lettuce−2.524031
Potatoes−4.057054
Radish, red−3.724075
Ruccola−7.546852
Sauerkraut−3.017020
Soy beans−3.4485142
Spinach−14.053062
Tomato−3.129726
Zucchini−4.626465
Brans, green−3.1566734
Parsley−12.067075
Basil−7.330056
Chives−5.329648
(B) 
(B) 
PRALKP
BEVERAGES
Mineral water−0.1
Beer, draft−0.22714
Beer, stout−0.12714
White wine−1.27174
Cocoa, made with semi-skimmed milk−0.4169105
Coffee, infusion−1.4303
Fruit tea, infusion−0.31936
Grape juice−1.0884
Green tea, infusion−0.320
Herb tea−0.2210
Tea, Indian, infusion−0.3
Wine vinegar−1.6398
FAT and OIL
Margarine−0.5185
Olive oil0.010
Sunflower seed oil0.000
VEGETABLES
Asparagus−0.417265
Broccoli, green−1.231666
Cucumber−0.814017
Garlic−1.7401153
Gherkin, pickled−1.6
Leeks−1.818035
Lettuce, iceberg−1.614120
Mushrooms−1.631886
Onions−1.514629
Peppers, Capsicum, green−1.41260158
Soy milk−0.8143
Tofu−0.815152
Whey−1.614378
SWEATS
Honey−0.3526
Ice cream, fruit, mixed−0.6188100
Marmalade−1.57719
Nougat hazelnut cream−1.4407152
Sugar, brown−1.21334
Sugar, white0.02
(C) 
(C) 
PRALKP
BEVERAGES
Coca cola0.42024.8
FAT and OIL
Butter0.61516
VEGETABLE
Lentils, green and brown, whole, dried3.5980347
Peas1.2990320
Buttermilk0.514593
Cream, fresh, sour1.211966
Curd cheese0.9118180
Egg, white1.116315
Milk, whole, evaporated1.139023.5
Milk, whole, pasteurized and sterilized0.713284
Skimmed milk0.715684
Yogurt, whole milk, fruit1.2177109
Yogurt, whole milk, plain1.515595
CEREALS, FLOUR and PASTA
Rice, white, boiled1.75655
Bread, wheat flour, whole meal1.8110103
Chocolate, bitter0.4300147
Chocolate, milk2.4420208
Ice cream, dairy vanilla0.6199105
(D) 
(D) 
PRALKP
VEGETABLES
Peanuts, plain8.3680290
Pistachio8.51025490
Sweet almond4.3780484
Walnuts6.8441346
ANIMAL FOOD
Carp7.9333415
Cod, fillets7.1235281
Haddock6.8286227
Halibut7.8435236
Herring7.0419303
Rose-fish10.0269200
Salmon9.4505371
Salted matie (herring)8.0447325
Shrimps7.689282
Sole7.4160252
Zander7.1269200
Beaf, lean only7.8349211
Cervelat sausage8.9260190
Chicken8.7229194
Duck4.1230269
Lamb, lean only7.6318191
Pork sausage7.0260192
Rump steak, lean and fat8.8221356
Turkey, meat only9.9275186
Veal, fillet9.0325212
Cottage cheese, plain8.7
Egg, chicken, whole8.2138198
Full-fat soft cheese4.3
CEREALS, FLOUR and PASTA
Amaranth7.5508557
Barely (whole meal)5.07540
Bread, rye flour4.1166125
Bread, white wheat3.7110103
Buckwheat (whole grain)3.7460330
Coarse whole meal bread5.3
Cornflakes6.07349
Crisp bread, rye3.3183138
Macaroni6.12032
Noodles6.42220
Pumpernickel4.2208178
Rice, white4.67596
Rusk5.9224430
Rye, flour4.4510332
Spaetzle (German sort)9.438
Spaghetti6.54458
Spaghetti, whole meal7.34489
Wheat flour, whole meal8.2337300
Whole meal bread7.2248202
(E) 
(E) 
PRALKP
ANIMAL FOOD
Eel, smoked11,0349277
Mussels15.3268236
Prawn15.589282
Sardines in oil13.5397490
Tiger Prawn18.2170306
Trout, steamed10.8361220
Corned beef, canned13.2402125
Goose, lean only13.0388309
Liver (veal)14.2308350
Luncheon meat, canned15.4564109
Ox liver fegato bue15.4320350
Pig’s liver15.7273362
Rabbit, lean only19.0383180
Salami11.6452225
Camembert14.6100347
Cheddar-type, reduced fat26.4120545
Edam cheese full fat19.4188536
Egg, yolk23.490586
Emmental cheese full fat21.1107700
Fresh cheese (Quark)11.1150650
Gouda18.6121443
Hard cheese19.255675
Parmesan34.2102800
Processed cheese, plain28.7943
Rich cream full fat cheese13.2284
CEREALS, FLOUR and PASTA
Oat flakes10.7429523
Rice, brown12.5223333
The green light indicates that food can be consumed every day, while the yellow light means a two or three times a week consumption, and the red light an occasional food consumption

