Association between Dietary Carotenoid Intake and Bone Mineral Density in Korean Adults Aged 30–75 Years Using Data from the Fourth and Fifth Korean National Health and Nutrition Examination Surveys (2008–2011)

Abstract
:1. Introduction
2. Methods
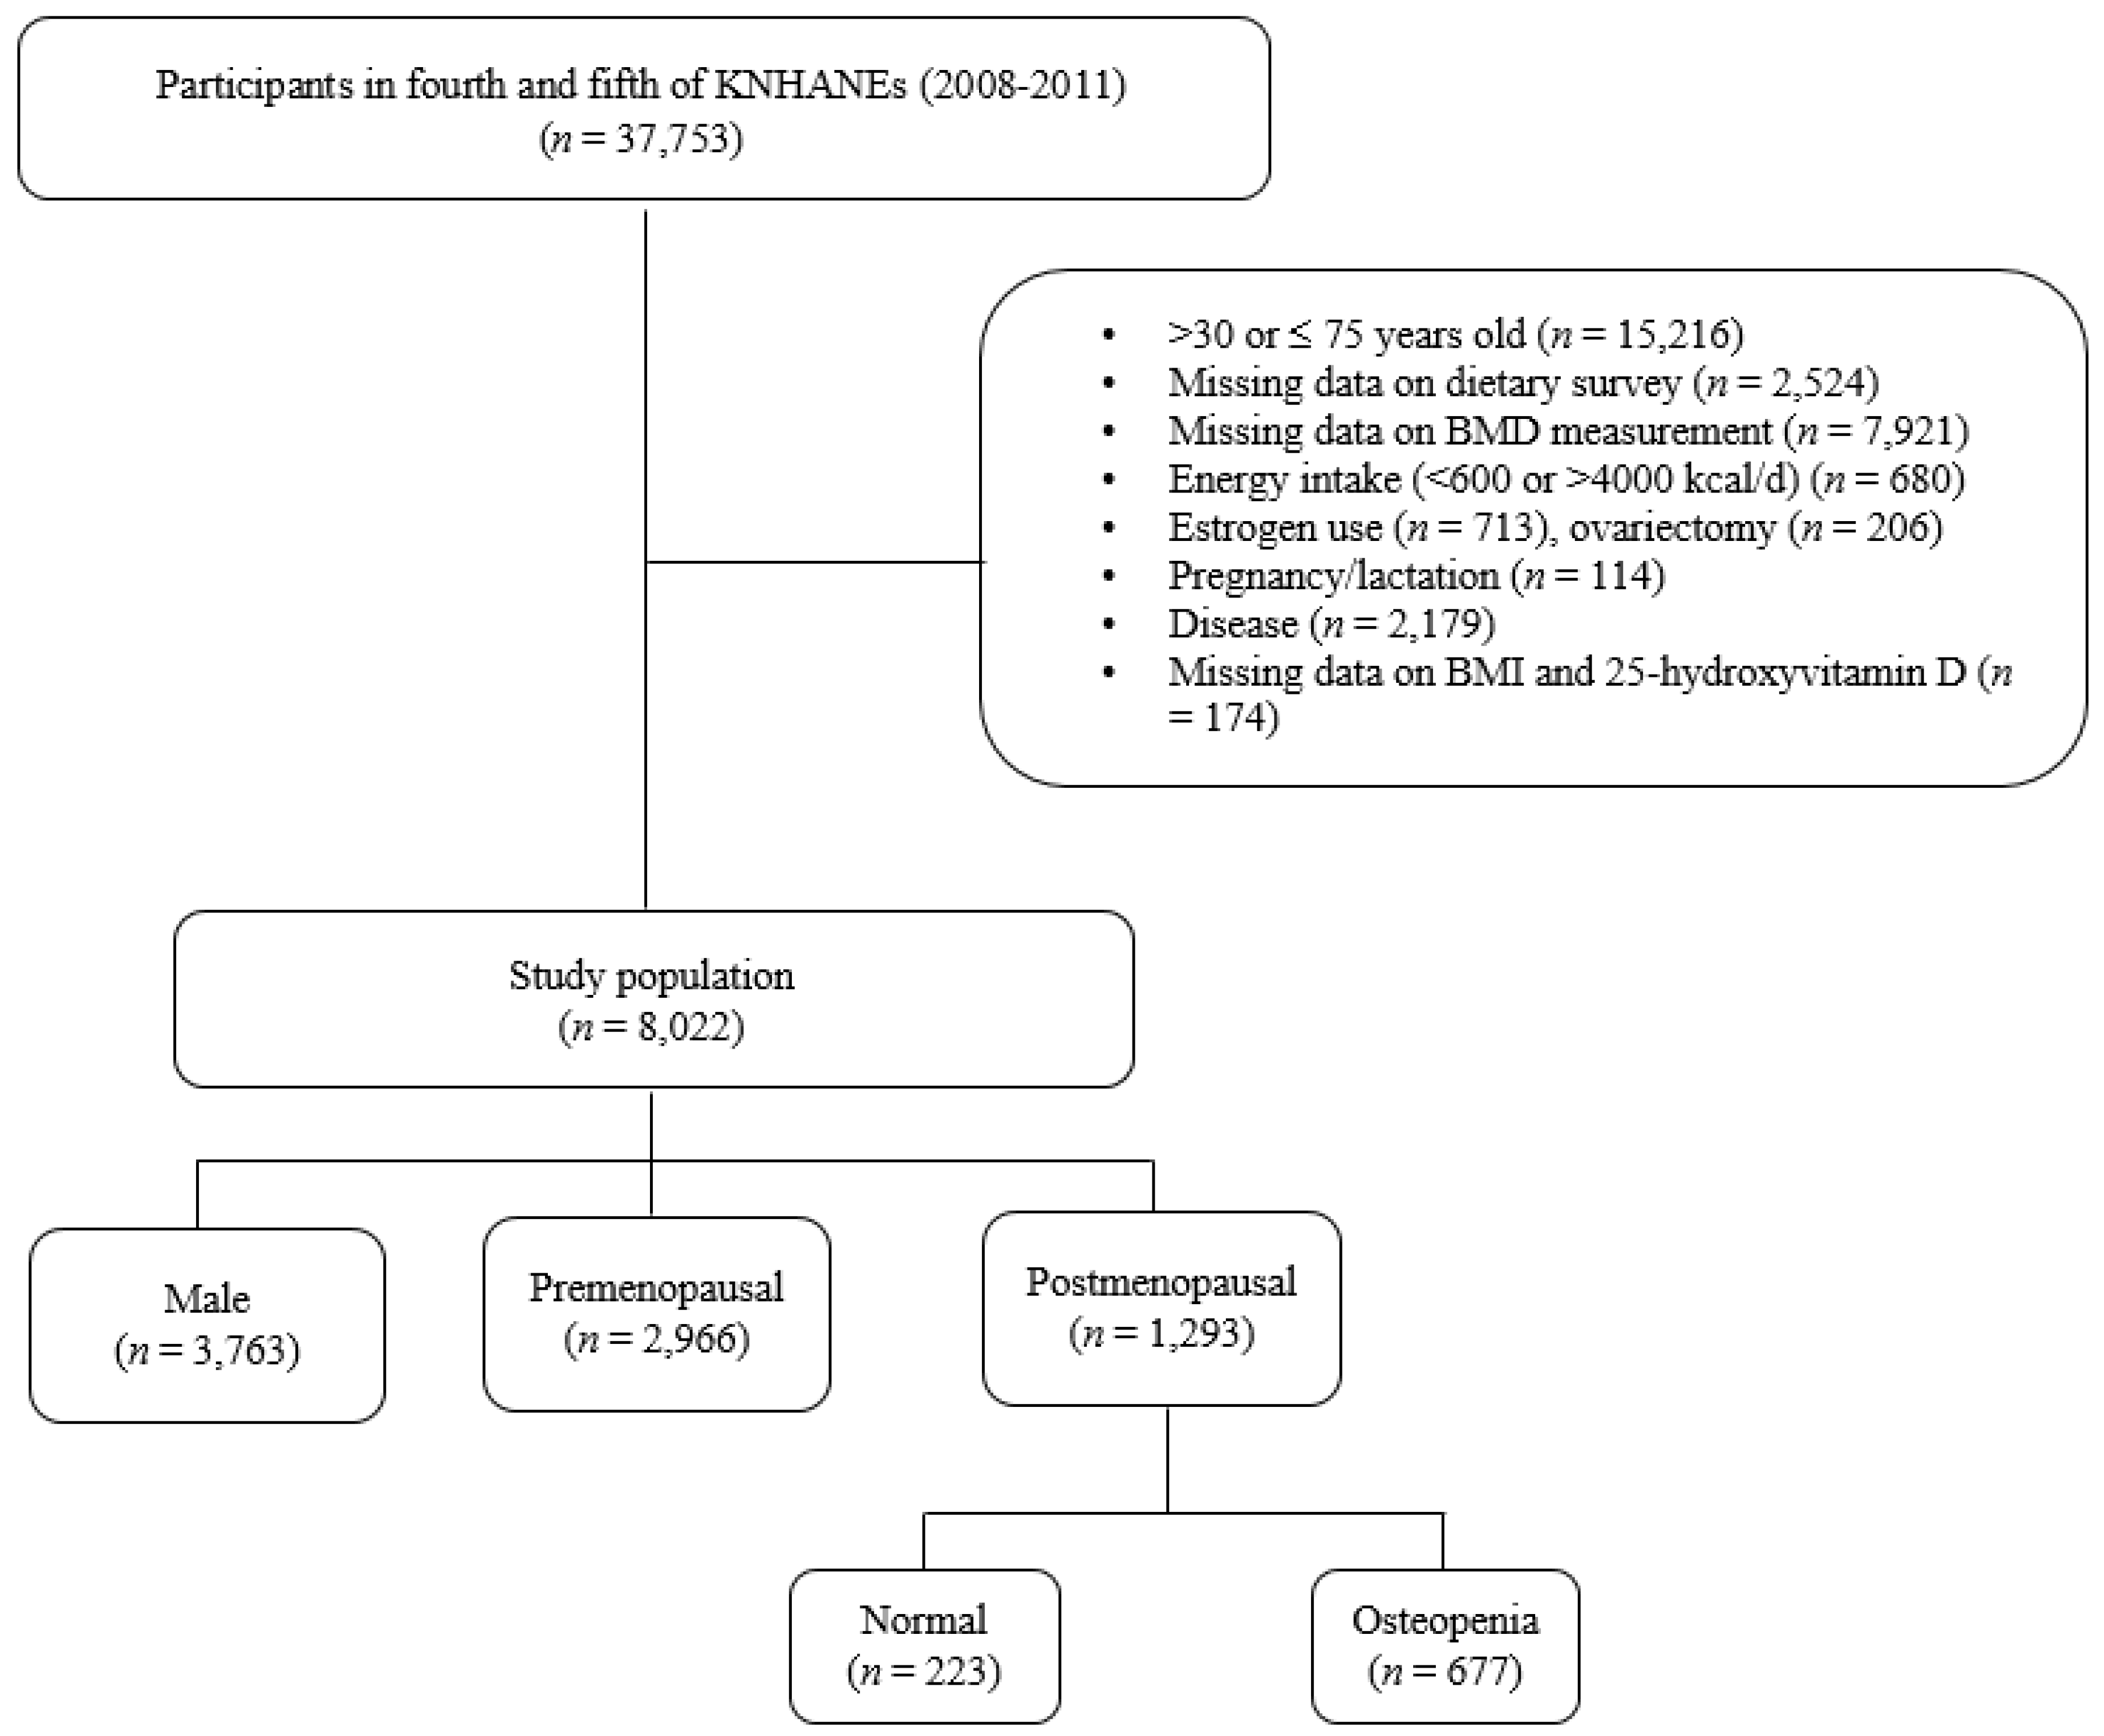
2.1. Study Design and Participants
2.2. Measurements of Anthropometric Parameters and BMD
2.3. Lifestyle Questionnaires
2.4. Dietary Assessment and Carotenoids Database
2.5. Statistical Analysis
3. Results
3.1. Characteristics of the Study Population
3.2. Association of Carotenoid Intake with BMD
3.3. Relation between Carotenoids Intake and Risk of Osteopenia in Postmenopausal Women
4. Discussion
5. Conclusions
Acknowledgments
Author Contributions
Conflicts of Interest
References
- Kruger, M.C.; Wolber, F.M. Osteoporosis: Modern paradigms for last century’s bones. Nutrients 2016, 8, 376. [Google Scholar] [CrossRef] [PubMed]
- Bliuc, D.; Nguyen, N.D.; Alarkawi, D.; Nguyen, T.V.; Eisman, J.A.; Center, J.R. Accelerated bone loss and increased post-fracture mortality in elderly women and men. Osteoporos. Int. 2015, 26, 1331–1339. [Google Scholar] [CrossRef] [PubMed]
- Gullberg, B.; Johnell, O.; Kanis, J.A. World-wide projections for hip fracture. Osteoporos. Int. 1997, 7, 407–413. [Google Scholar] [CrossRef] [PubMed]
- Woo, E.K.; Han, C.; Jo, S.A.; Park, M.K.; Kim, S.; Kim, E.; Park, M.H.; Lee, J.; Jo, I. Morbidity and related factors among elderly people in south Korea: Results from the Ansan Geriatric (AGE) cohort study. BMC Public Health 2007, 7, 10. [Google Scholar] [CrossRef] [PubMed]
- Park, E.J.; Joo, I.W.; Jang, M.J.; Kim, Y.T.; Oh, K.; Oh, H.J. Prevalence of osteoporosis in the Korean population based on Korea National Health and Nutrition Examination Ssurvey (KNHANES), 2008–2011. Yonsei Med. J. 2014, 55, 1049–1057. [Google Scholar] [CrossRef] [PubMed]
- Choi, Y.J.; Oh, H.J.; Kim, D.J.; Lee, Y.; Chung, Y.S. The prevalence of osteoporosis in Korean adults aged 50 years or older and the higher diagnosis rates in women who were beneficiaries of a national screening program: The Korea National Health and Nutrition Examination Survey 2008–2009. J. Bone Miner. Res. 2012, 27, 1879–1886. [Google Scholar] [CrossRef] [PubMed]
- Wong, P.K.; Christie, J.J.; Wark, J.D. The effects of smoking on bone health. Clin. Sci. 2007, 113, 233–241. [Google Scholar] [CrossRef] [PubMed]
- Kemmler, W.; Engelke, K.; von Stengel, S. Long-term exercise and bone mineral density changes in postmenopausal women—Are there periods of reduced effectiveness? J. Bone Miner. Res. 2016, 31, 215–222. [Google Scholar] [CrossRef] [PubMed]
- Joo, N.S.; Dawson-Hughes, B.; Kim, Y.S.; Oh, K.; Yeum, K.J. Impact of calcium and vitamin D insufficiencies on serum parathyroid hormone and bone mineral density: Analysis of the fourth and fifth Korea National Health and Nutrition Examination Survey (KNHANES IV-3, 2009 and KNHANES V-1, 2010). J. Bone Miner. Res. 2013, 28, 764–770. [Google Scholar] [CrossRef] [PubMed]
- Kong, S.H.; Kim, J.H.; Hong, A.R.; Lee, J.H.; Kim, S.W.; Shin, C.S. Dietary potassium intake is beneficial to bone health in a low calcium intake population: The Korean National Health and Nutrition Examination Survey (KNHANES) (2008–2011). Osteoporos. Int. 2017, 28, 1577–1585. [Google Scholar] [CrossRef]
- Yamaguchi, M.; Kishi, S. Inhibitory effect of zinc-chelating dipeptide on parathyroid hormone-stimulated osteoclast-like cell formation in mouse marrow cultures: Involvement of calcium signaling. Peptides 1995, 16, 629–633. [Google Scholar] [CrossRef]
- Sahni, S.; Hannan, M.T.; Gagnon, D.; Blumberg, J.; Cupples, L.A.; Kiel, D.P.; Tucker, K.L. Protective effect of total and supplemental vitamin C intake on the risk of hip fracture—A 17-year follow-up from the Framingham osteoporosis study. Osteoporos Int. 2009, 20, 1853–1861. [Google Scholar] [CrossRef] [PubMed]
- Hamidi, M.S.; Corey, P.N.; Cheung, A.M. Effects of vitamin E on bone turnover markers among US postmenopausal women. J. Bone Miner. Res. 2012, 27, 1368–1380. [Google Scholar] [CrossRef] [PubMed]
- Welch, A.; MacGregor, A.; Jennings, A.; Fairweather-Tait, S.; Spector, T.; Cassidy, A. Habitual flavonoid intakes are positively associated with bone mineral density in women. J. Bone Miner. Res. 2012, 27, 1872–1878. [Google Scholar] [CrossRef] [PubMed]
- Okubo, H.; Sasaki, S.; Horiguchi, H.; Oguma, E.; Miyamoto, K.; Hosoi, Y.; Kim, M.K.; Kayama, F. Dietary patterns associated with bone mineral density in premenopausal Japanese farmwomen. Am. J. Clin. Nutr. 2006, 83, 1185–1192. [Google Scholar] [PubMed]
- Park, S.-J.; Joo, S.-E.; Min, H.; Park, J.K.; Kim, Y.; Kim, S.S.; Ahn, Y. Dietary patterns and osteoporosis risk in postmenopausal Korean women. Osong Public Health Res. Perspect. 2012, 3, 199–205. [Google Scholar] [CrossRef] [PubMed]
- Shin, S.; Joung, H. A dairy and fruit dietary pattern is associated with a reduced likelihood of osteoporosis in Korean postmenopausal women. Br. J. Nutr. 2013, 110, 1926–1933. [Google Scholar] [CrossRef] [PubMed]
- De Jonge, E.A.; Kiefte-de Jong, J.C.; Hofman, A.; Uitterlinden, A.G.; Kieboom, B.C.; Voortman, T.; Franco, O.H.; Rivadeneira, F. Dietary patterns explaining differences in bone mineral density and hip structure in the elderly: The Rotterdam study. Am. J. Clin. Nutr. 2017, 105, 203–211. [Google Scholar] [CrossRef] [PubMed]
- Sugiura, M.; Nakamura, M.; Ogawa, K.; Ikoma, Y.; Ando, F.; Yano, M. Bone mineral density in post-menopausal female subjects is associated with serum antioxidant carotenoids. Osteoporos. Int. 2008, 19, 211–219. [Google Scholar] [CrossRef] [PubMed]
- Sugiura, M.; Nakamura, M.; Ogawa, K.; Ikoma, Y.; Yano, M. High serum carotenoids associated with lower risk for bone loss and osteoporosis in post-menopausal Japanese female subjects: Prospective cohort study. PLoS ONE 2012, 7, e52643. [Google Scholar] [CrossRef] [PubMed]
- Sahni, S.; Hannan, M.T.; Blumberg, J.; Cupples, L.A.; Kiel, D.P.; Tucker, K.L. Inverse association of carotenoid intakes with 4-y change in bone mineral density in elderly men and women: The Framingham osteoporosis study. Am. J. Clin. Nutr. 2009, 89, 416–424. [Google Scholar] [CrossRef] [PubMed]
- Dai, Z.; Wang, R.; Ang, L.W.; Low, Y.L.; Yuan, J.M.; Koh, W.P. Protective effects of dietary carotenoids on risk of hip fracture in men: The Singapore Chinese health study. J. Bone Miner. Res. 2014, 29, 408–417. [Google Scholar] [CrossRef] [PubMed]
- Yamaguchi, M. Role of carotenoid beta-cryptoxanthin in bone homeostasis. J. Biomed. Sci. 2012, 19, 36. [Google Scholar] [CrossRef] [PubMed]
- Uchiyama, S.; Yamaguchi, M. Inhibitory effect of β-cryptoxanthin on osteoclast-like cell formation in mouse marrow cultures. Biochem. Pharmacol. 2004, 67, 1297–1305. [Google Scholar] [CrossRef] [PubMed]
- Wang, F.; Wang, N.; Gao, Y.; Zhou, Z.; Liu, W.; Pan, C.; Yin, P.; Yu, X.; Tang, M. Beta-carotene suppresses osteoclastogenesis and bone resorption by suppressing NF-kappaB signaling pathway. Life Sci. 2017, 174, 15–20. [Google Scholar] [CrossRef] [PubMed]
- Ikeda, N.; Sugiyama, T.; Suzuki, T.; Mukai, K.; Kusuhara, S. Effects of beta-cryptoxanthin on bone metabolism in a rat model of osteoporosis. J. Anim. Vet. Adv. 2012, 11, 30–35. [Google Scholar] [CrossRef]
- Wattanapenpaiboon, N.; Lukito, W.; Wahlqvist, M.L.; Strauss, B.J. Dietary carotenoid intake as a predictor of bone mineral density. Asia Pac. J. Clin. Nutr. 2003, 12, 467–473. [Google Scholar] [PubMed]
- Sugiura, M.; Nakamura, M.; Ogawa, K.; Ikoma, Y.; Ando, F.; Shimokata, H.; Yano, M. Dietary patterns of antioxidant vitamin and carotenoid intake associated with bone mineral density: Findings from post-menopausal Japanese female subjects. Osteoporos. Int. 2011, 22, 143–152. [Google Scholar] [CrossRef] [PubMed]
- Kim, D.E.; Cho, S.H.; Park, H.M.; Chang, Y.K. Relationship between bone mineral density and dietary intake of beta-carotene, vitamin C, zinc and vegetables in postmenopausal Korean women: A cross-sectional study. J. Int. Med. Res. 2016. [Google Scholar] [CrossRef] [PubMed]
- Chung, H.K.; Cho, Y.; Choi, S.; Shin, M.J. The association between serum 25-hydroxyvitamin D concentrations and depressive symptoms in Korean adults: Findings from the fifth Korea National Health and Nutrition Examination Survey 2010. PLoS ONE 2014, 9, e99185. [Google Scholar] [CrossRef] [PubMed]
- USDA Food Composition Database. Available online: https://ndb.nal.usda.gov/ndb/nutrients/index (accessed on 9 June 2017).
- Willett, W.C.; Howe, G.R.; Kushi, L.H. Adjustment for total energy intake in epidemiologic studies. Am. J. Clin. Nutr. 1997, 65, 1220S–1228S. [Google Scholar] [PubMed]
- Yamaguchi, M.; Igarashi, A.; Uchiyama, S.; Sugawara, K.; Sumida, T.; Morita, S.; Ogawa, H.; Nishitani, M.; Kajimoto, Y. Effect of beta-cryptoxanthin on circulating bone metabolic markers: Intake of juice (Citrus unshiu) supplemented with beta-cryptoxanthin has an effect in menopausal women. J. Health Sci. 2006, 52, 758–768. [Google Scholar] [CrossRef]
- Zhang, J.; Munger, R.G.; West, N.A.; Cutler, D.R.; Wengreen, H.J.; Corcoran, C.D. Antioxidant intake and risk of osteoporotic hip fracture in Utah: An effect modified by smoking status. Am. J. Epidemiol. 2006, 163, 9–17. [Google Scholar] [CrossRef] [PubMed]
- Yang, Z.; Zhang, Z.; Penniston, K.L.; Binkley, N.; Tanumihardjo, S.A. Serum carotenoid concentrations in postmenopausal women from the United States with and without osteoporosis. Int. J. Vitam. Nutr. Res. 2008, 78, 105–111. [Google Scholar] [CrossRef] [PubMed]
- Iino, M.; Kozai, Y.; Kawamata, R.; Wakao, H.; Sakurai, T.; Kashima, I. Effects of β-cryptoxanthin on bone-formation parameters in the distal femoral epiphysis of ovariectomized mice. Oral Radiol. 2014, 30, 1–8. [Google Scholar] [CrossRef]
- Ozaki, K.; Okamoto, M.; Fukasawa, K.; Iezaki, T.; Onishi, Y.; Yoneda, Y.; Sugiura, M.; Hinoi, E. Daily intake of β-cryptoxanthin prevents bone loss by preferential disturbance of osteoclastic activation in ovariectomized mice. J. Pharmacol. Sci. 2015, 129, 72–77. [Google Scholar] [CrossRef] [PubMed]
- Yamaguchi, M.; Uchiyama, S. Beta-cryptoxanthin stimulates bone formation and inhibits bone resorption in tissue culture in vitro. Mol. Cell Biochem. 2004, 258, 137–144. [Google Scholar] [CrossRef] [PubMed]
- Uchiyama, S.; Yamaguchi, M. Anabolic effect of β-cryptoxanthin in osteoblastic MC3T3-E1 cells is enhanced with 17β-estradiol, genistein, or zinc sulfate in vitro: The unique effect with zinc on runx2 and α1(i) collagen mRNA expressions. Mol. Cell Biochem. 2008, 307, 209–219. [Google Scholar] [CrossRef] [PubMed]
- Yamaguchi, M.; Uchiyama, S. Effect of carotenoid on calcium content and alkaline phosphatase activity in rat femoral tissues in vitro: The unique anabolic effect of beta-cryptoxanthin. Biol. Pharm. Bull. 2003, 26, 1188–1191. [Google Scholar] [CrossRef] [PubMed]
- Resch, H.; Pietschmann, P.; Kudlacek, S.; Woloszczuk, W.; Krexner, E.; Bernecker, P.; Willvonseder, R. Influence of sex and age on biochemical bone metabolism parameters. Miner. Electrol. Metab. 1994, 20, 117–121. [Google Scholar]
- Yoon, E.-H.; Noh, H.; Lee, H.-M.; Hwang, H.-S.; Park, H.-K.; Park, Y.-S. Bone mineral density and food-frequency in Korean adults: The 2008 and 2009 Korean National Health and Nutrition Examination Survey. Korean J. Fam. Med. 2012, 33, 287–295. [Google Scholar] [CrossRef] [PubMed]
- Margetts, B.M.; Jackson, A.A. The determinants of plasma beta-carotene: Interaction between smoking and other lifestyle factors. Eur. J. Clin. Nutr. 1996, 50, 236–238. [Google Scholar] [PubMed]
- Sugiura, M.; Nakamura, M.; Ogawa, K.; Ikoma, Y.; Matsumoto, H.; Ando, F.; Shimokata, H.; Yano, M. Synergistic interaction of cigarette smoking and alcohol drinking with serum carotenoid concentrations: Findings from a middle-aged Japanese population. Br. J. Nutr. 2009, 102, 1211–1219. [Google Scholar] [CrossRef] [PubMed]
- Cervellati, C.; Bonaccorsi, G.; Cremonini, E.; Romani, A.; Fila, E.; Castaldini, M.C.; Ferrazzini, S.; Giganti, M.; Massari, L. Oxidative stress and bone resorption interplay as a possible trigger for postmenopausal osteoporosis. Biomed. Res. Int. 2014. [Google Scholar] [CrossRef] [PubMed]
- Manzi, F.; Flood, V.; Webb, K.; Mitchell, P. The intake of carotenoids in an older Australian population: The Blue Mountains eye study. Public Health Nutr. 2002, 5, 347–352. [Google Scholar] [CrossRef] [PubMed]
- Cocate, P.G.; Natali, A.J.; Alfenas, R.C.; de Oliveira, A.; dos Santos, E.C.; Hermsdorff, H.H. Carotenoid consumption is related to lower lipid oxidation and DNA damage in middle-aged men. Br. J. Nutr. 2015, 114, 257–264. [Google Scholar] [CrossRef] [PubMed]


| Male | Female | p-Value | ||
|---|---|---|---|---|
| Pre-Menopausal | Post-Menopausal | |||
| n | 3763 | 2966 | 1293 | |
| Age (years) | 45.9 ± 0.2 | 40.0 ± 0.1 | 58.2 ± 0.3 | 0.339 |
| 30–39 | 992 (26.4) | 1507 (50.8) | 5 (0.4) | |
| 40–49 | 980 (26.0) | 1266 (42.7) | 88 (6.8) | |
| 50–59 | 858 (22.8) | 193 (9.5) | 576 (44.6) | |
| 60–69 | 691 (18.4) | 458 (35.4) | ||
| 70–75 | 242 (6.4) | 166 (12.8) | ||
| Height (cm) | 170.2 ± 0.1 | 158.7 ± 0.1 | 154.4 ± 0.2 | <0.0001 |
| Weight (kg) | 70.2 ± 0.2 | 57.7 ± 0.2 | 56.8 ± 0.2 | <0.0001 |
| BMI (kg/cm2) | 24.2 ± 0.1 | 22.9 ± 0.1 | 23.8 ± 0.1 | <0.0001 |
| Waist circumference (cm) | 84.6 ± 0.2 | 76.1 ± 0.2 | 81.0 ± 0.3 | <0.0001 |
| Education | <0.0001 | |||
| Elementary or lower | 515 (11.9) | 126 (5.2) | 655 (53.8) | |
| Middle school | 431 (11.6) | 203 (8.3) | 173 (17.7) | |
| High school | 1154 (36.8) | 1318 (49.6) | 223 (22.6) | |
| College or higher | 1192 (39.6) | 995 (37.0) | 61 (5.9) | |
| Current smoker | 1631 (47.0) | 150 (5.6) | 51 (4.6) | <0.0001 |
| Current drinker | 2854 (77.6) | 1457 (49.2) | 353 (30.0) | <0.0001 |
| Regular exercise | 2019 (53.0) | 1464 (50.0) | 709 (55.3) | 0.008 |
| Supplement use | 1310 (34.0) | 1348 (44.7) | 612 (48.2) | |
| Nutrient intake | ||||
| Total energy (kcal/day) | 2289 ± 13.9 | 1705 ± 12.9 | 1607.9 ± 20.8 | <0.0001 |
| Fiber (g/day) | 7.1 ± 0.1 | 7.4 ± 0.1 | 8.1 ± 0.2 | <0.0001 |
| Vitamin C (mg/day) | 95.5 ± 1.4 | 110.9 ± 1.8 | 111.9 ± 2.8 | <0.0001 |
| Calcium (mg/day) | 478.3 ± 4.7 | 499.7 ± 5.8 | 476.0 ± 8.4 | 0.028 |
| Sodium (mg/day) | 4958.5 ± 45.9 | 4839.7 ± 54.2 | 4641.3 ± 93.1 | 0.005 |
| Total carotenoids (mg/day) | 6.7150 ± 0.15 | 9.6691 ± 0.27 | 10.5751 ± 0.45 | <0.0001 |
| α-Carotene (mg/day) | 0.6163 ± 0.03 | 0.8571 ± 0.04 | 1.0455 ± 0.08 | <0.0001 |
| β-Carotene (mg/day) | 3.0809 ± 0.08 | 4.5939 ± 0.16 | 5.0969 ± 0.23 | <0.0001 |
| β-Cryptoxanthin (mg/day) | 0.2536 ± 0.02 | 0.5454 ± 0.04 | 0.6136 ± 0.06 | <0.0001 |
| Lutein + zeaxanthin (mg/day) | 1.7416 ± 0.07 | 2.1661 ± 0.08 | 2.5890 ± 0.16 | <0.0001 |
| Lycopene (mg/day) | 0.8190 ± 0.07 | 2.2920 ± 0.24 | 1.9692 ± 0.36 | <0.0001 |
| Bone mineral density | ||||
| Femur neck BMD (g/cm2) | 0.8135 ± 0.02 | 0.7593 ± 0.03 | 0.6486 ± 0.03 | <0.0001 |
| Total hip BMD (g/cm2) | 0.9733 ± 0.02 | 0.9025 ± 0.03 | 0.8033 ± 0.04 | <0.0001 |
| Lumbar spine BMD (g/cm2) | 0.9693 ± 0.03 | 0.9957 ± 0.03 | 0.8192 ± 0.05 | <0.0001 |
| Whole body BMD (g/cm2) | 1.1887 ± 0.04 | 1.1477 ± 0.03 | 1.0210 ± 0.04 | <0.0001 |
| Serum 25(OH)D (ng/mL) | 19.2 ± 0.2 | 16.2 ± 0.2 | 18.1 ± 0.3 | <0.0001 |
| Variable | Male | Pre-Menopausal Female | Post-Menopausal Female | |||||||||
|---|---|---|---|---|---|---|---|---|---|---|---|---|
| Model 1 | Model 2 | Model 1 | Model 2 | Model 1 | Model 2 | |||||||
| β | P | β | P | β | P | β | P | β | P | β | P | |
| Femur neck BMD (g/cm2) | ||||||||||||
| α-Carotene (mg/day) | 0.0020 | 0.335 | −0.0029 | 0.157 | 0.0003 | 0.902 | −0.0018 | 0.412 | −0.0018 | 0.097 | −0.0017 | 0.119 |
| β-Carotene (mg/day) | 0.0006 | 0.350 | −0.0001 | 0.880 | 0.0008 | 0.081 | 0.0005 | 0.255 | 0.0014 | 0.002 | 0.0012 | 0.035 |
| β-Cryptoxanthin (mg/day) | 0.0002 | 0.936 | −0.0023 | 0.407 | 0.0031 | 0.022 | 0.0022 | 0.116 | −0.0011 | 0.575 | 0.0001 | 0.950 |
| Lutein + zeaxanthin (mg/day) | 0.0010 | 0.209 | 0.0013 | 0.080 | −0.0001 | 0.828 | 0.0001 | 0.988 | 0.0008 | 0.364 | 0.0004 | 0.656 |
| Lycopene (mg/day) | 0.0005 | 0.317 | −0.0004 | 0.432 | 0.0003 | 0.241 | 0.0001 | 0.858 | 0.0005 | 0.180 | 0.0001 | 0.704 |
| Total hip BMD (g/cm2) | ||||||||||||
| α-Carotene (mg/day) | 0.0027 | 0.197 | −0.0020 | 0.350 | 0.0002 | 0.933 | −0.0018 | 0.399 | −0.0017 | 0.174 | −0.0017 | 0.162 |
| β-Carotene (mg/day) | 0.0004 | 0.586 | −0.0005 | 0.447 | 0.0008 | 0.131 | 0.0004 | 0.348 | 0.0015 | 0.003 | 0.0012 | 0.036 |
| β-Cryptoxanthin (mg/day) | 0.0029 | 0.327 | 0.0008 | 0.789 | 0.0044 | 0.001 | 0.0032 | 0.026 | 0.0002 | 0.922 | 0.0015 | 0.486 |
| Lutein + zeaxanthin (mg/day) | 0.0009 | 0.249 | 0.0015 | 0.032 | 0.0002 | 0.784 | 0.0001 | 0.816 | 0.0008 | 0.341 | 0.0006 | 0.492 |
| Lycopene (mg/day) | 0.0006 | 0.232 | −0.0003 | 0.502 | 0.0002 | 0.295 | −0.0003 | 0.233 | 0.0006 | 0.140 | 0.0001 | 0.746 |
| Lumbar spine BMD (g/cm2) | ||||||||||||
| α-Carotene (mg/day) | 0.0015 | 0.554 | −0.0026 | 0.298 | 0.0010 | 0.704 | −0.0012 | 0.587 | −0.0027 | 0.090 | −0.0019 | 0.199 |
| β-Carotene (mg/day) | 0.0008 | 0.234 | −0.0002 | 0.781 | 0.0007 | 0.207 | 0.0001 | 0.927 | 0.0019 | 0.006 | 0.0009 | 0.211 |
| β-Cryptoxanthin (mg/day) | 0.0015 | 0.691 | −0.0009 | 0.823 | 0.0002 | 0.924 | 0.0001 | 0.962 | −0.0007 | 0.832 | 0.0010 | 0.720 |
| Lutein + zeaxanthin (mg/day) | 0.0009 | 0.261 | 0.0011 | 0.203 | 0.0005 | 0.575 | 0.0005 | 0.504 | 0.0015 | 0.130 | 0.0007 | 0.486 |
| Lycopene (mg/day) | 0.0002 | 0.746 | −0.0007 | 0.283 | 0.0008 | 0.022 | 0.0001 | 0.942 | 0.0001 | 0.964 | −0.0006 | 0.249 |
| Whole body BMD (g/cm2) | ||||||||||||
| α-Carotene (mg/day) | 0.0057 | 0.015 | 0.0006 | 0.777 | 0.0020 | 0.455 | −0.0005 | 0.828 | −0.0016 | 0.346 | −0.0016 | 0.322 |
| β-Carotene (mg/day) | 0.0009 | 0.222 | 0.0001 | 0.998 | 0.0005 | 0.271 | −0.0002 | 0.671 | 0.0027 | <0.0001 | 0.0021 | 0.027 |
| β-Cryptoxanthin (mg/day) | −0.0015 | 0.651 | −0.0028 | 0.390 | −0.0008 | 0.688 | −0.0017 | 0.362 | −0.0035 | 0.274 | −0.0008 | 0.796 |
| Lutein + zeaxanthin (mg/day) | 0.0004 | 0.657 | 0.0006 | 0.534 | 0.0007 | 0.469 | 0.0006 | 0.508 | 0.0008 | 0.394 | 0.0001 | 0.895 |
| Lycopene (mg/day) | 0.0006 | 0.373 | −0.0002 | 0.739 | 0.0006 | 0.047 | −0.0003 | 0.285 | 0.0003 | 0.685 | −0.0002 | 0.560 |
| Range of Carotenoid Intake | Femur Neck Osteopenia | Total Hip Osteopenia | Lumbar Spine Osteopenia | Osteopenia | |||||
|---|---|---|---|---|---|---|---|---|---|
| Model 1 | Model 2 | Model 1 | Model 2 | Model 1 | Model 2 | Model 1 | Model 2 | ||
| α-Carotene (mg/day) | |||||||||
| Continuous (1 mg/day intake increment) | 1.01 (0.93, 1.09) | 0.99 (0.90, 1.08) | 1.02 (0.95, 1.11) | 1.04 (0.95, 1.14) | 1.04 (0.95, 1.15) | 1.04 (0.93, 1.16) | 1.06 (0.96, 1.16) | 1.05 (0.94, 1.17) | |
| Q1 | (0.0001, 0.01) | 1 (ref) | 1 (ref) | 1 (ref) | 1 (ref) | 1 (ref) | 1 (ref) | 1 (ref) | 1 (ref) |
| Q2 | (0.01, 0.06) | 1.22 (0.61, 2.43) | 1.49 (0.68, 3.27) | 1.08 (0.45, 2.59) | 1.49 (0.50, 4.48) | 1.57 (0.87, 2.83) | 1.82 (0.89, 3.72) | 1.25 (0.64, 2.44) | 1.71 (0.78, 3.73) |
| Q3 | (0.06, 0.30) | 1.02 (0.51, 2.03) | 1.29 (0.61, 2.74) | 0.79 (0.33, 1.90) | 1.01 (0.37, 2.78) | 1.38 (0.74, 2.57) | 1.58 (0.77, 3.24) | 1.11 (0.56, 2.21) | 1.38 (0.64, 2.99) |
| Q4 | (0.31, 1.24) | 1.43 (0.73, 2.79) | 1.98 (0.97, 4.02) | 1.05 (0.33, 3.34) | 2.27 (0.61, 8.44) | 2.25 (1.19, 4.26) | 3.03 (1.44, 6.38) | 1.68 (0.87, 3.24) | 2.20 (1.06, 4.56) |
| Q5 | (1.24, 23.15) | 1.15 (0.55, 2.39) | 1.23 (0.56, 2.67) | 1.12 (0.34, 3.67) | 1.86 (0.49, 7.09) | 1.53 (0.79, 2.98) | 1.75 (0.80, 3.81) | 1.38 (0.64,2.97) | 1.54 (0.68, 3.47) |
| P trend | 0.752 | 0.317 | 0.925 | 0.644 | 0.133 | 0.049 | 0.532 | 0.262 | |
| β-Carotene (mg/day) | |||||||||
| Continuous (1 mg/day intake increment) | 1.00 (0.98, 1.02) | 1.01 (0.98, 1.03) | 1.01 (0.98, 1.04) | 0.99 (0.96, 1.03) | 1.00 (0.98, 1.02) | 0.99 (0.96, 1.02) | 0.98 (0.96, 1.00) | 0.98 (0.95, 1.01) | |
| Q1 | (0.0009, 0.70) | 1 (ref) | 1 (ref) | 1 (ref) | 1 (ref) | 1 (ref) | 1 (ref) | 1 (ref) | 1 (ref) |
| Q2 | (0.71, 1.88) | 0.79 (0.39, 1.60) | 0.64 (0.30, 1.38) | 1.40 (0.54, 3.65) | 1.43 (0.49, 4.12) | 0.34 (0.18, 0.63) | 0.36 (0.18, 0.73) | 0.41 (0.21, 0.83) | 0.30 (0.15, 0.63) |
| Q3 | (1.90, 3.50) | 1.11 (0.53, 2.31) | 1.27 (0.55, 2.92) | 0.91 (0.27, 3.02) | 0.81 (0.22, 2.97) | 0.29 (0.15, 0.58) | 0.29 (0.14, 0.64) | 0.62 (0.29, 1.36) | 0.50 (0.21, 1.19) |
| Q4 | (3.50, 7.19) | 0.54 (0.26, 1.10) | 0.59 (0.27, 1.30) | 0.84 (0.27, 2.58) | 0.71 (0.21, 2.40) | 0.38 (0.18, 0.80) | 0.47 (0.20, 1.12) | 0.39 (0.17, 0.86) | 0.39 (0.16, 0.98) |
| Q5 | (7.20, 87.12) | 0.84 (0.42, 1.70) | 0.91 (0.40, 2.06) | 0.91 (0.27, 3.02) | 0.60 (0.16, 2.33) | 0.36 (0.18, 0.70) | 0.35 (0.16, 0.79) | 0.41 (0.19, 0.90) | 0.37 (0.15, 0.93) |
| P trend | 0.086 | 0.079 | 0.740 | 0.547 | 0.003 | 0.009 | 0.068 | 0.025 | |
| β-Cryptoxanthin (mg/day) | |||||||||
| Continuous (1 mg/day intake increment) | 0.97 (0.87, 1.08) | 0.94 (0.83, 1.07) | 0.75 (0.55, 1.03) | 0.76 (0.59, 0.97) | 0.88 (0.80, 0.96) | 0.79 (0.70, 0.89) | 0.92 (0.82, 1.02) | 0.88 (0.78, 0.99) | |
| Q1 | (0.0003, 0.01) | 1 (ref) | 1 (ref) | 1 (ref) | 1 (ref) | 1 (ref) | 1 (ref) | 1 (ref) | 1 (ref) |
| Q2 | (0.01, 0.04) | 1.19 (0.62, 2.29) | 1.21 (0.59, 2.48) | 1.14 (0.50, 2.58) | 1.37 (0.57, 3.28) | 1.13 (0.65, 1.97) | 1.05 (0.57, 1.92) | 0.78 (0.40, 1.54) | 0.82 (0.39, 1.74) |
| Q3 | (0.04, 0.10) | 1.30 (0.62, 2.72) | 1.41 (0.62, 3.23) | 1.24 (0.51, 3.06) | 1.85 (0.68, 5.01) | 1.00 (0.51, 1.95) | 1.16 (0.55, 2.46) | 1.14 (0.54, 2.43) | 1.21 (0.52, 2.83) |
| Q4 | (0.10, 0.59) | 1.10 (0.53, 2.30) | 1.12 (0.49, 2.57) | 0.91 (0.36, 2.33) | 1.02 (0.35, 2.98) | 1.05 (0.54, 2.04) | 1.17 (0.57, 2.44) | 0.97 (0.48, 1.98) | 0.98 (0.45, 2.13) |
| Q5 | (0.60, 18.53) | 1.11 (0.54, 2.27) | 1.04 (0.45, 2.44) | 0.53 (0.19, 1.48) | 0.61 (0.22, 1.71) | 0.68 (0.36, 1.29) | 0.54 (0.25, 1.17) | 0.71 (0.35, 1.42) | 0.64 (0.29, 1.46) |
| P trend | 0.960 | 0.895 | 0.628 | 0.385 | 0.525 | 0.215 | 0.512 | 0.483 | |
| Lutein + zeaxanthin (mg/day) | |||||||||
| Continuous (1mg/day intake increment) | 0.99 (0.95, 1.02) | 0.99 (0.95, 1.03) | 1.01 (0.96, 1.05) | 1.00 (0.95, 1.05) | 0.99 (0.96, 1.03) | 0.98 (0.94, 1.02) | 0.98 (0.95, 1.02) | 0.98 (0.94, 1.03) | |
| Q1 | (0.0001, 0.22) | 1 (ref) | 1 (ref) | 1 (ref) | 1 (ref) | 1 (ref) | 1 (ref) | 1 (ref) | 1 (ref) |
| Q2 | (0.22, 0.63) | 0.96 (0.45, 2.05) | 0.95 (0.41, 2.20) | 0.70 (0.24, 2.06) | 0.64 (0.20, 2.06) | 1.28 (0.69, 2.39) | 1.15 (0.57, 2.31) | 1.05 (0.53, 2.10) | 1.22 (0.53, 2.80) |
| Q3 | (0.63, 1.32) | 1.29 (0.61, 2.74) | 1.14 (0.48, 2.71) | 0.81 (0.24, 2.77) | 0.78 (0.19, 3.24) | 1.56 (0.80, 3.02) | 1.55 (0.73, 3.29) | 1.27 (0.59, 2.75) | 1.46 (0.61, 3.49) |
| Q4 | (1.32, 3.20) | 1.68 (0.80, 3.50) | 1.54 (0.66, 3.58) | 1.67 (0.62, 4.48) | 1.34 (0.37, 4.86) | 2.58 (1.27, 5.23) | 1.94 (0.91, 4.13) | 1.79 (0.80, 3.97) | 1.61 (0.66, 3.95) |
| Q5 | (3.20, 64.16) | 0.92 (0.42, 2.01) | 0.92 (0.37, 2.32) | 1.21 (0.33, 4.38) | 1.01 (0.20, 5.11) | 1.45 (0.71, 2.98) | 1.11 (0.49, 2.48) | 1.14 (0.51, 2.51) | 1.23 (0.47, 3.21) |
| P trend | 0.234 | 0.513 | 0.288 | 0.577 | 0.100 | 0.338 | 0.557 | 0.824 | |
| Lycopene (mg/day) | |||||||||
| Continuous (1mg/day intake increment) | 0.99 (0.96, 1.01) | 1.00 (0.97, 1.03) | 0.98 (0.95, 1.01) | 1.00 (0.96, 1.03) | 0.98 (0.97, 1.00) | 0.98 (0.97, 1.00) | 0.99 (0.98, 1.01) | 1.00 (0.98, 1.02) | |
| Q1 | (0.0009, 0.001) | 1 (ref) | 1 (ref) | 1 (ref) | 1 (ref) | 1 (ref) | 1 (ref) | 1 (ref) | 1 (ref) |
| Q2 | (0.001, 0.003) | 0.79 (0.45, 1.37) | 0.75 (0.40, 1.39) | 0.90 (0.38, 2.10) | 0.66 (0.26, 1.65) | 0.96 (0.55, 1.70) | 0.98 (0.53, 1.82) | 0.95 (0.50, 1.81) | 0.81 (0.39, 1.68) |
| Q3 | (0.003, 0.006) | 0.86 (0.45, 1.61) | 0.96 (0.47, 1.94) | 1.35 (0.54, 3.38) | 0.87 (0.34, 2.23) | 0.66 (0.36, 1.19) | 0.68 (0.32, 1.42) | 1.09 (0.54, 2.20) | 0.93 (0.42, 2.07) |
| Q4 | (0.006, 0.29) | 0.79 (0.45, 1.40) | 0.88 (0.45, 1.72) | 1.85 (0.66, 5.15) | 1.37 (0.48, 3.91) | 0.83 (0.46, 1.51) | 1.02 (0.50, 2.09) | 1.00 (0.52, 1.94) | 0.99 (0.45, 2.15) |
| Q5 | (0.30, 124.49) | 0.53 (0.29, 0.96) | 0.71 (0.37, 1.37) | 1.12 (0.38, 3.33) | 1.08 (0.35, 3.31) | 0.63 (0.36, 1.10) | 0.80 (0.44, 1.44) | 0.66 (0.35, 1.25) | 0.87 (0.42, 1.78) |
| P trend | 0.330 | 0.789 | 0.455 | 0.690 | 0.333 | 0.665 | 0.443 | 0.972 | |
© 2017 by the authors. Licensee MDPI, Basel, Switzerland. This article is an open access article distributed under the terms and conditions of the Creative Commons Attribution (CC BY) license (http://creativecommons.org/licenses/by/4.0/).
Share and Cite
Regu, G.M.; Kim, H.; Kim, Y.J.; Paek, J.E.; Lee, G.; Chang, N.; Kwon, O. Association between Dietary Carotenoid Intake and Bone Mineral Density in Korean Adults Aged 30–75 Years Using Data from the Fourth and Fifth Korean National Health and Nutrition Examination Surveys (2008–2011). Nutrients 2017, 9, 1025. https://0-doi-org.brum.beds.ac.uk/10.3390/nu9091025
Regu GM, Kim H, Kim YJ, Paek JE, Lee G, Chang N, Kwon O. Association between Dietary Carotenoid Intake and Bone Mineral Density in Korean Adults Aged 30–75 Years Using Data from the Fourth and Fifth Korean National Health and Nutrition Examination Surveys (2008–2011). Nutrients. 2017; 9(9):1025. https://0-doi-org.brum.beds.ac.uk/10.3390/nu9091025
Chicago/Turabian StyleRegu, Gebereamanuel Meron, Hyesook Kim, You Jin Kim, Ju Eun Paek, Gunjeong Lee, Namsoo Chang, and Oran Kwon. 2017. "Association between Dietary Carotenoid Intake and Bone Mineral Density in Korean Adults Aged 30–75 Years Using Data from the Fourth and Fifth Korean National Health and Nutrition Examination Surveys (2008–2011)" Nutrients 9, no. 9: 1025. https://0-doi-org.brum.beds.ac.uk/10.3390/nu9091025