Association between Protein-Bound Uremic Toxins and Asymptomatic Cardiac Dysfunction in Patients with Chronic Kidney Disease

 ,
,
Abstract
:1. Introduction
2. Results
2.1. Patient Characteristics
2.2. Association between PBUTs and Peak Cardiac Performance
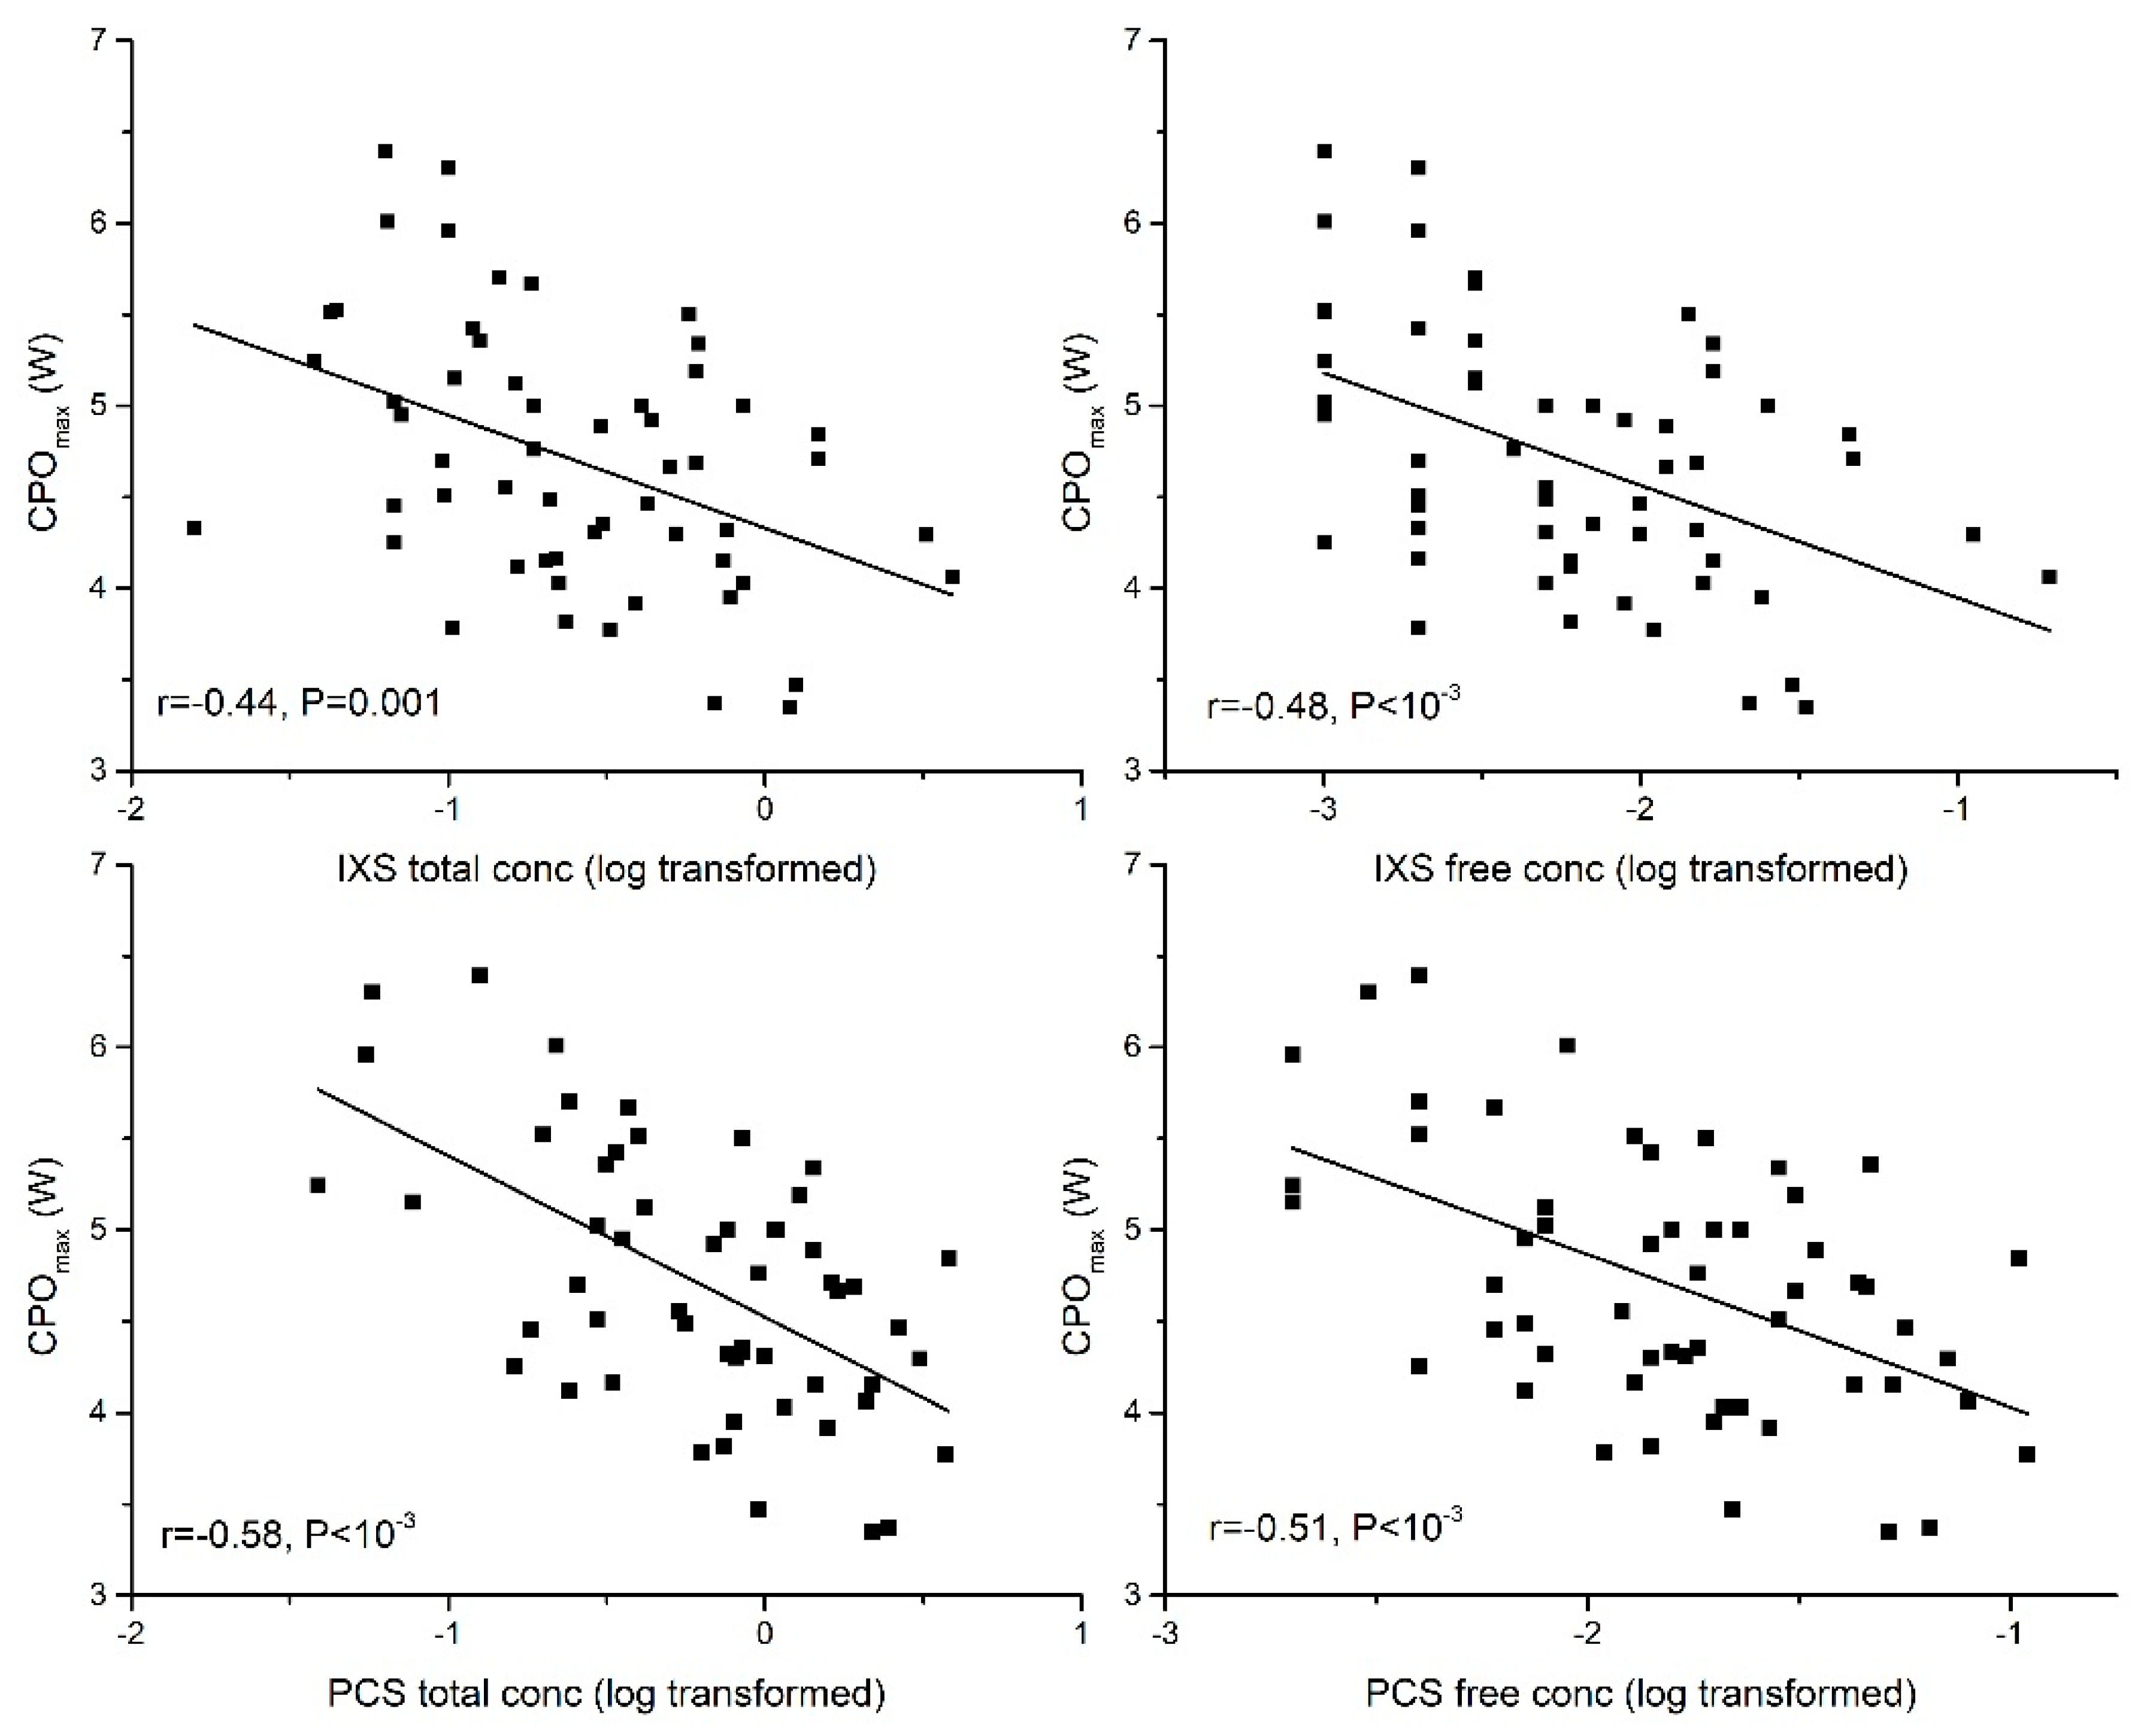
2.2.1. Peak Cardiac Power Output (CPOmax)
2.2.2. Peak Cardiac Output (Peak Qt)
2.2.3. Peak Mean Arterial Pressure (Peak MAP)
2.2.4. Peak Heart Rate (Peak HR)
2.3. Association between PBUTs and Aerobic Exercise Capacity
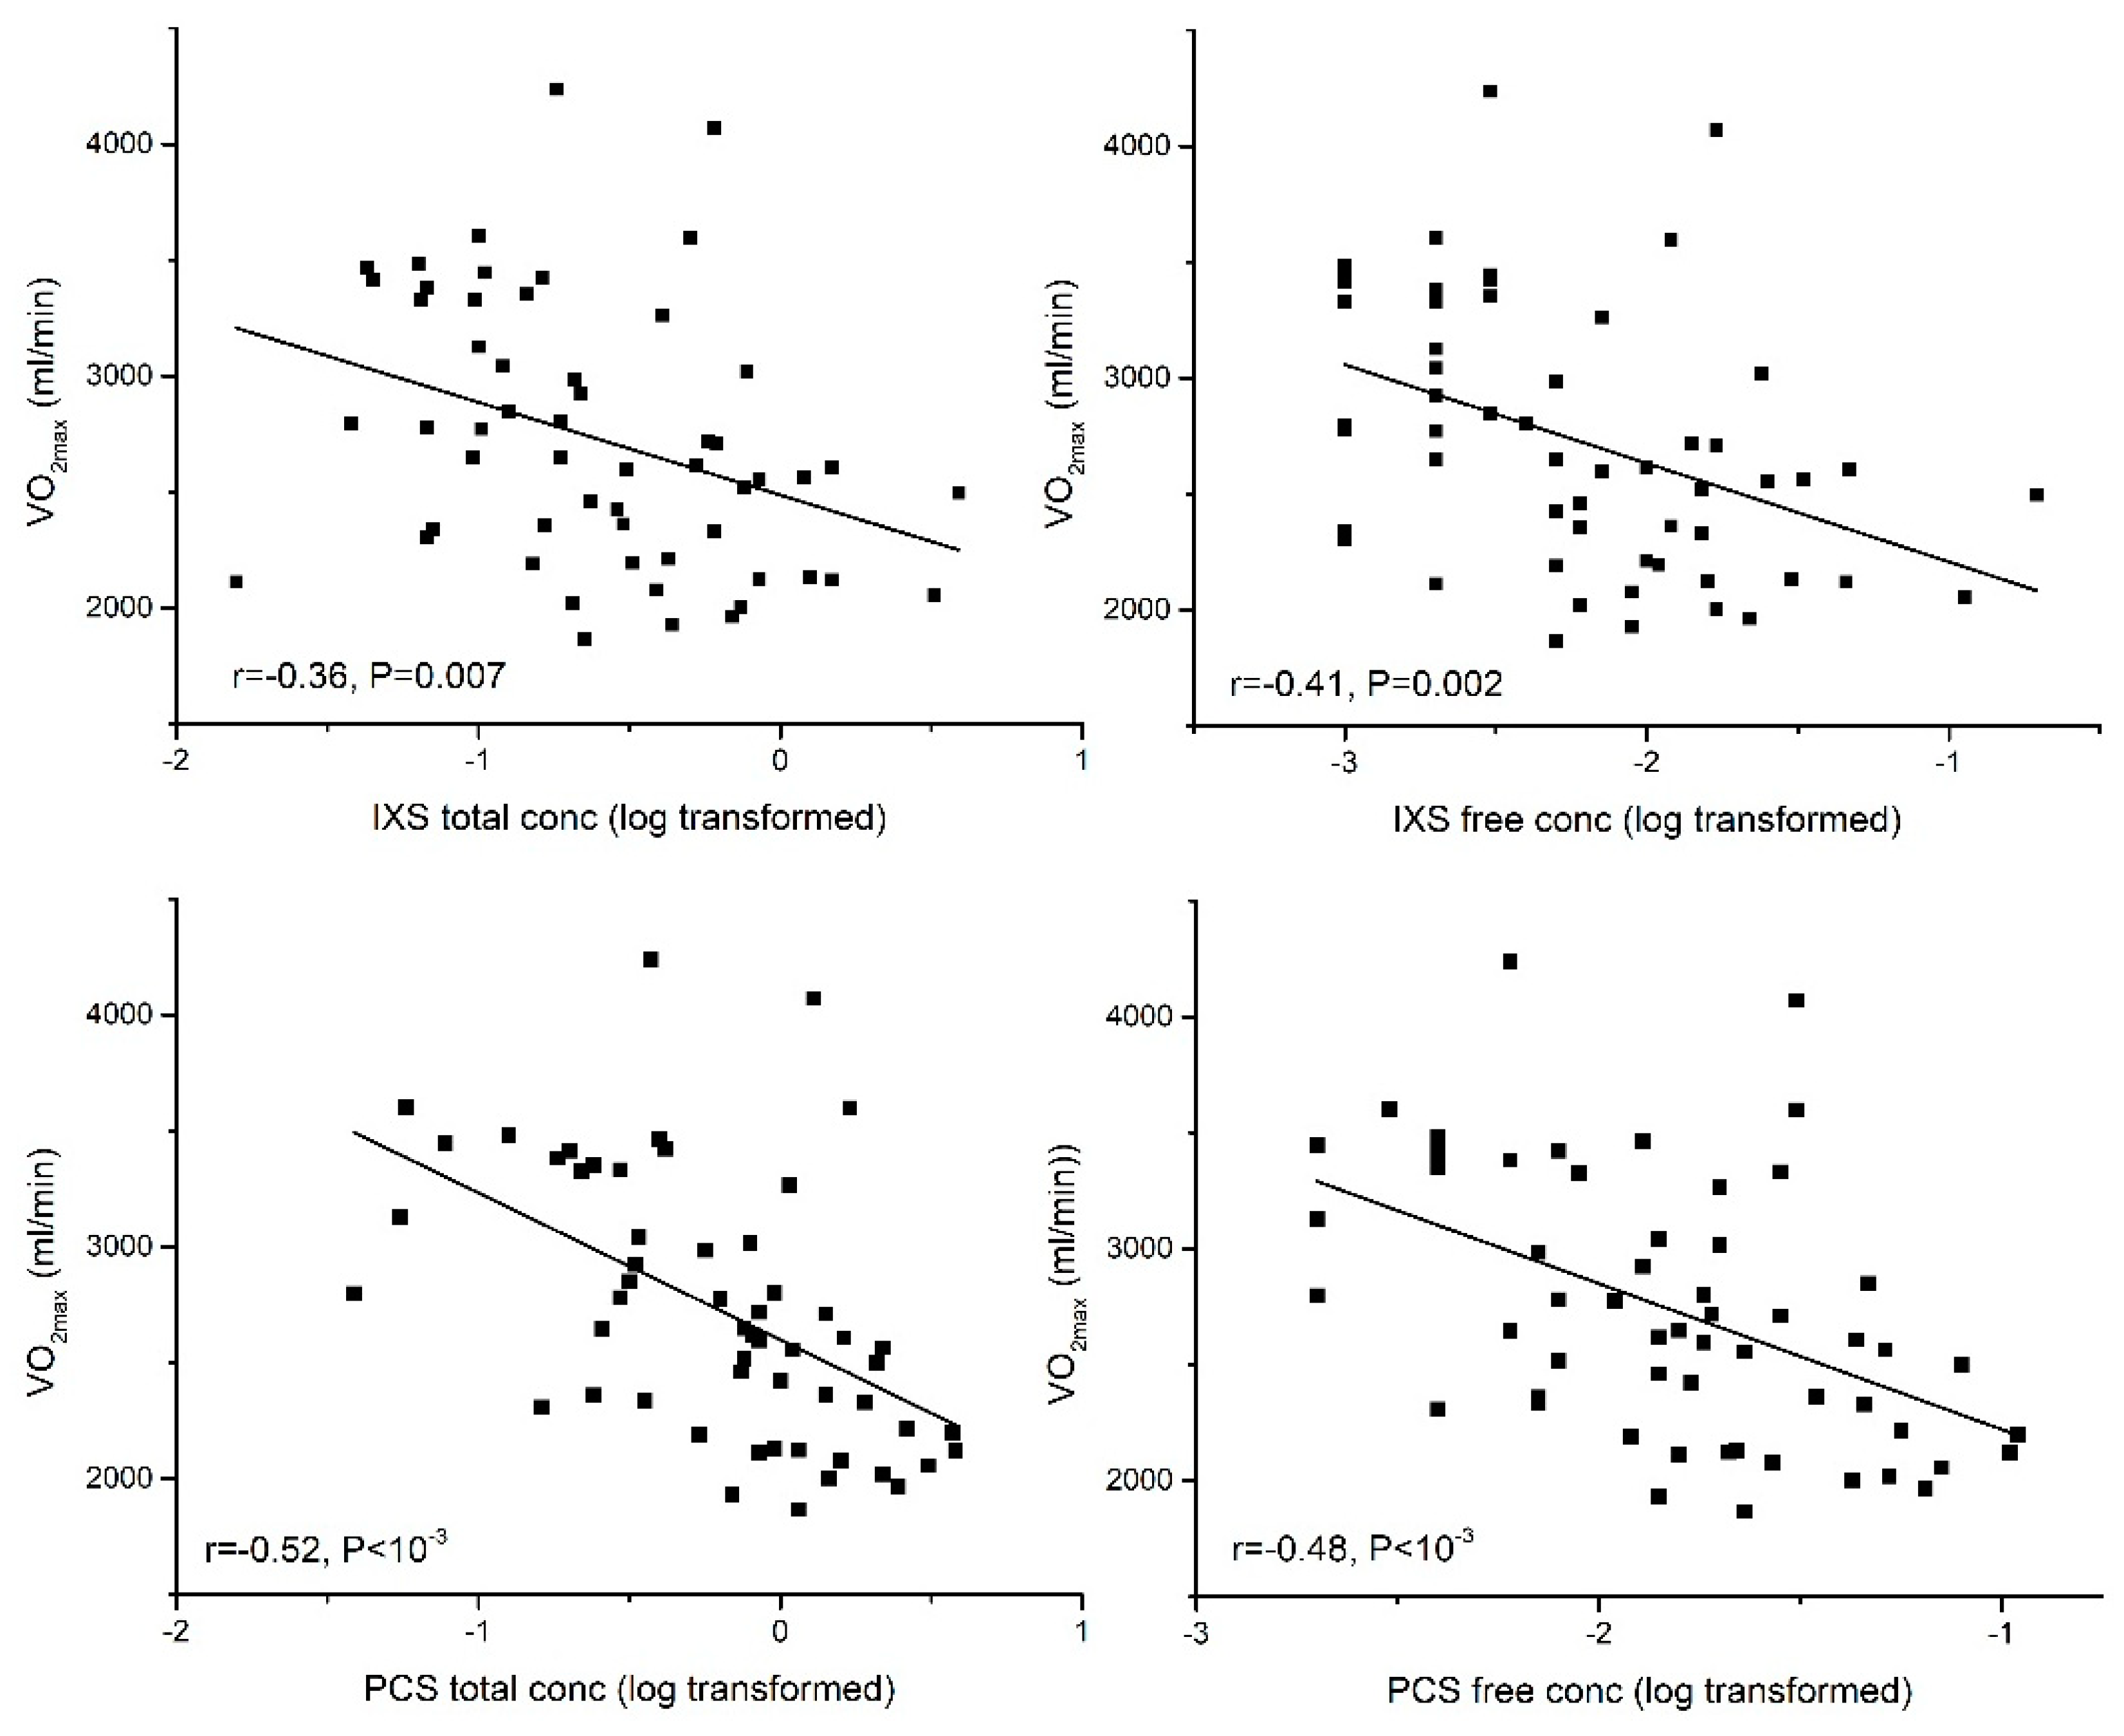
2.3.1. Aerobic Exercise Capacity (VO2max)
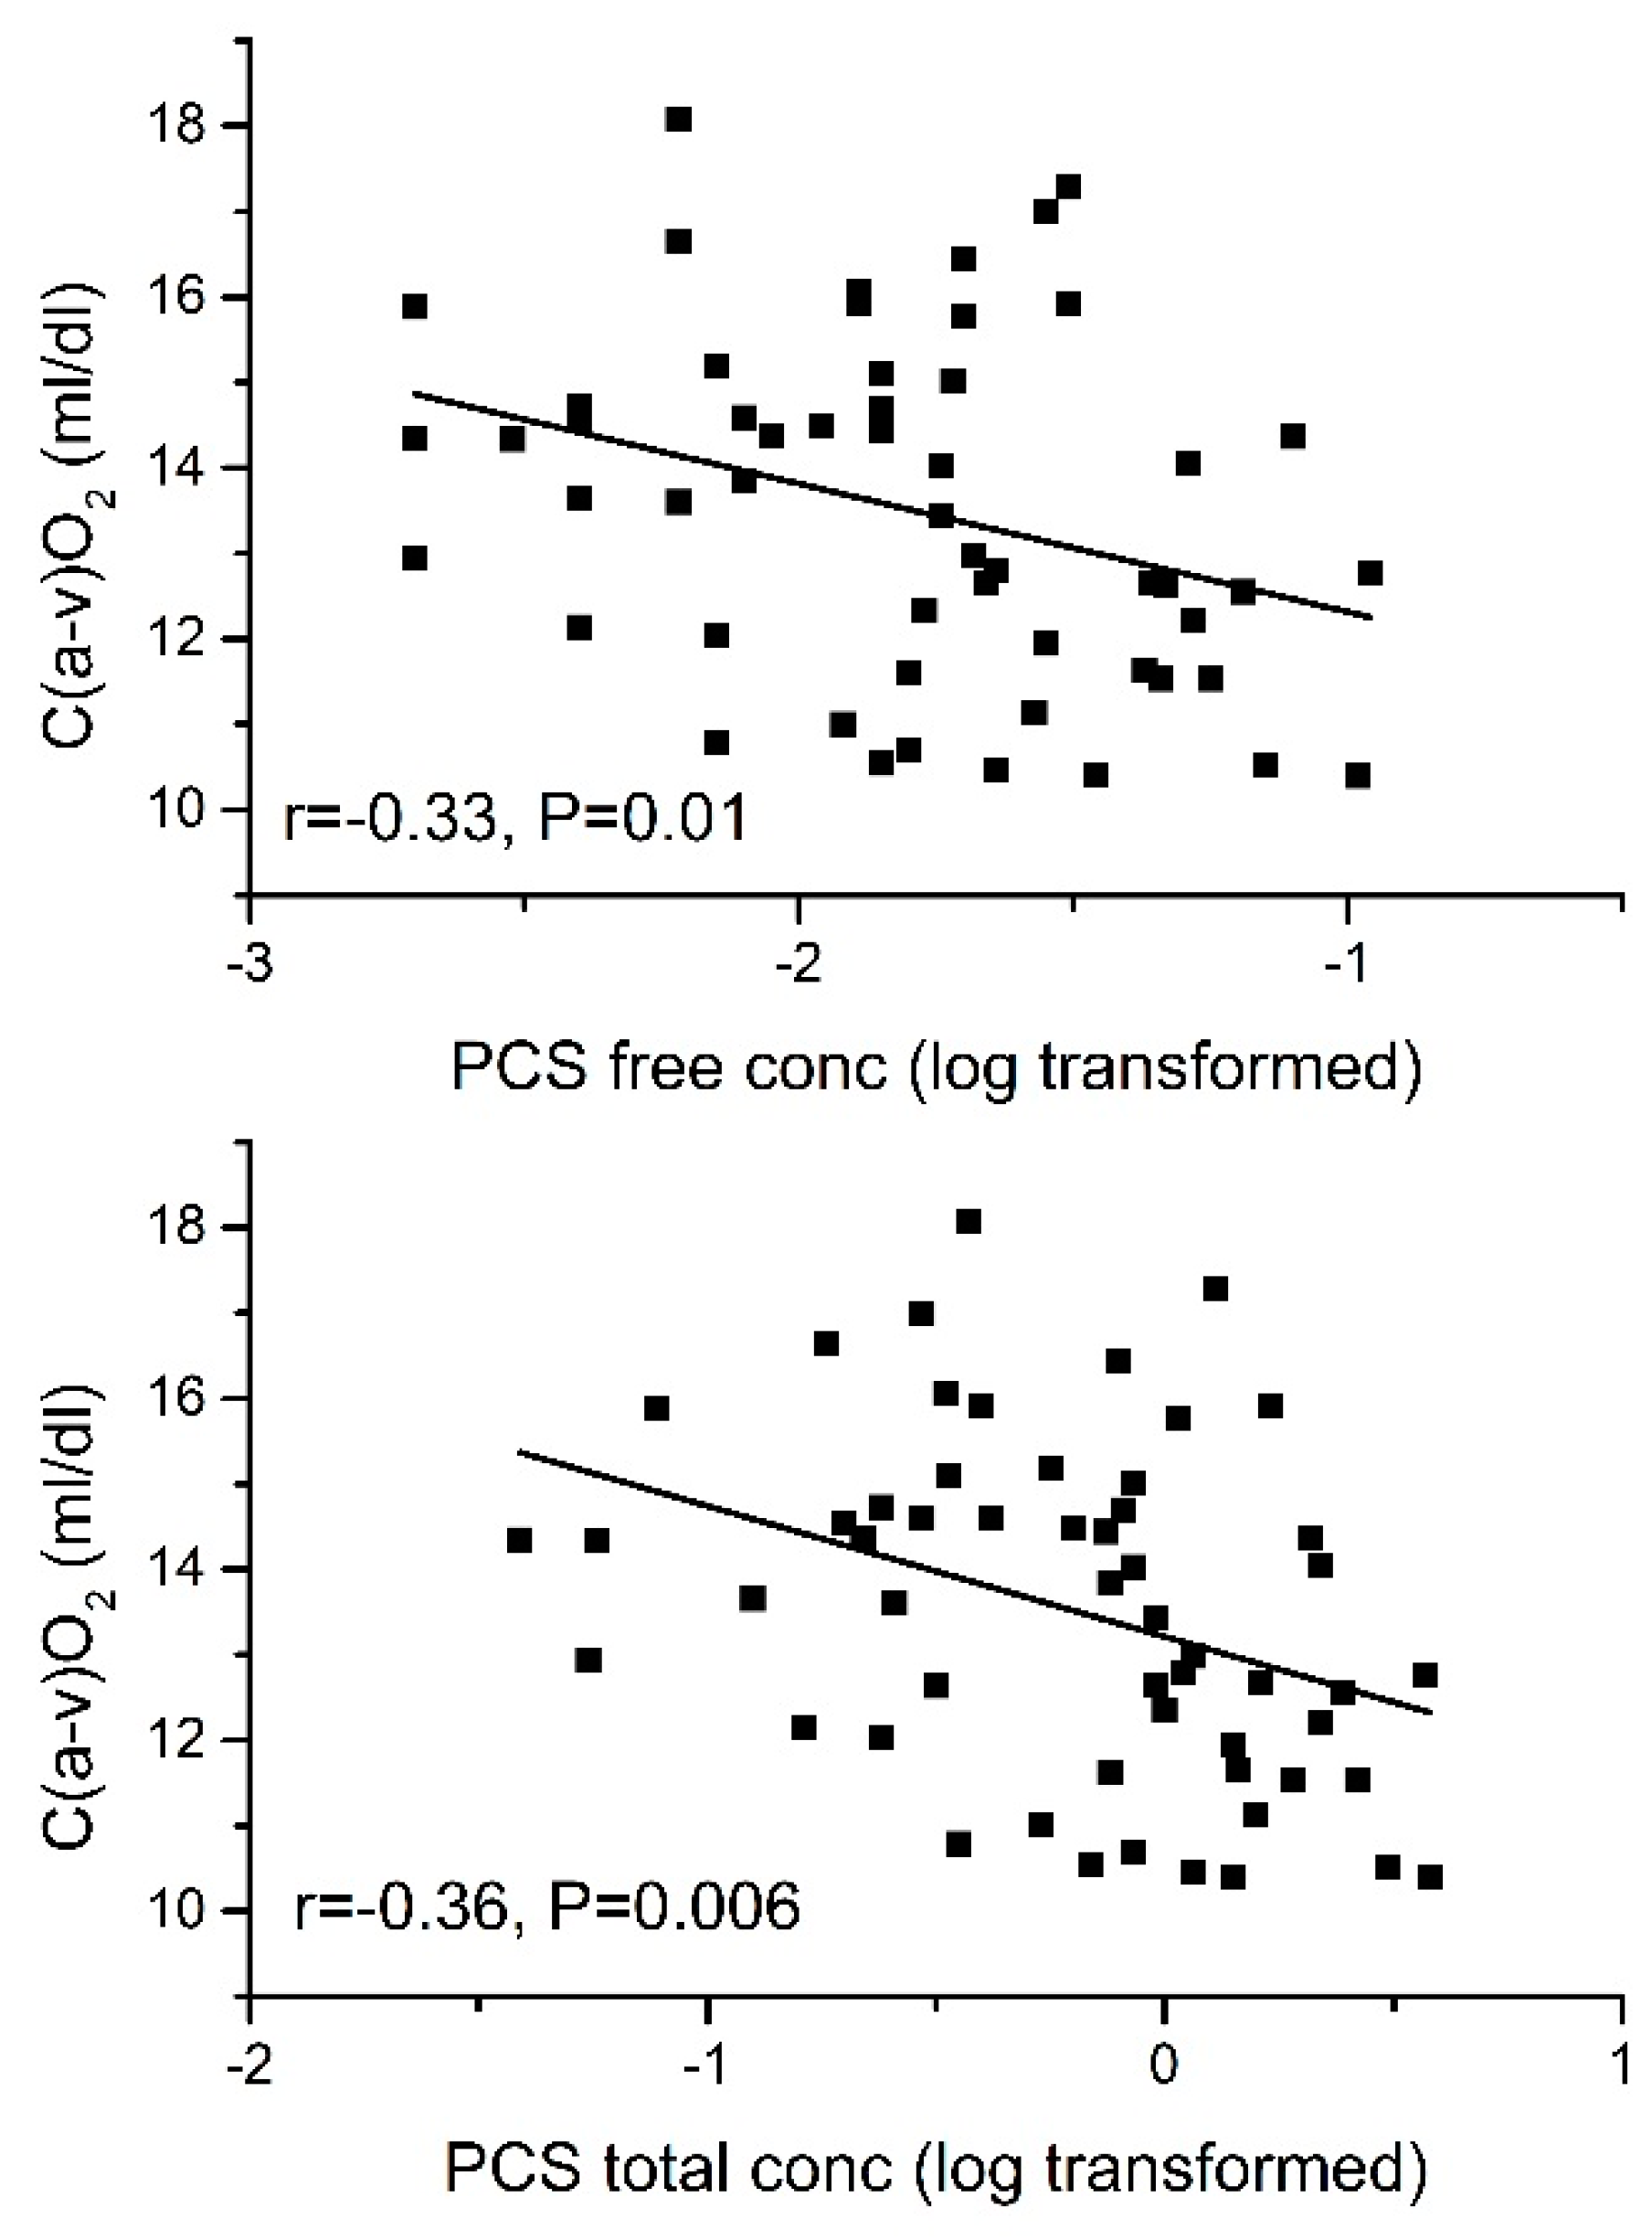
2.3.2. Arteriovenous O2 Difference [C(a-v)O2]
2.4. Independent Association of PBUTs with CPOmax and VO2max
2.5. Association between Non-Protein-Bound Uremic Toxin and Peak Cardiac Performance and Aerobic Exercise Capacity
2.6. Association between PBUTs and Cardiac Dimensions
2.7. Effect of Beta Blockers
3. Discussion
4. Limitations
5. Conclusions
6. Materials and Methods
6.1. Study Subjects
6.2. Assessment of Peak Cardiac Performance
Cardiopulmonary Exercise Test
6.3. Echocardiogram
6.4. Protein-Bound Uremic Toxin Assays
6.5. Statistical Analysis
Author Contributions
Funding
Acknowledgments
Conflicts of Interest
References
- Vanholder, R.; Glorieux, G.; De Smet, R.; Lameire, N. New insights in uremic toxins. Kidney Int. Suppl. 2003, 63, S6–S10. [Google Scholar] [CrossRef]
- Vanholder, R.; Schepers, E.; Pletinck, A.; Nagler, E.V.; Glorieux, G. The uremic toxicity of indoxyl sulfate and p-cresyl sulfate: A systematic review. J. Am. Soc. Nephrol. 2014, 25, 1897–1907. [Google Scholar] [CrossRef]
- Dou, L.; Jourde-Chiche, N.; Faure, V.; Cerini, C.; Berland, Y.; Dignat-George, F.; Brunet, P. The uremic solute indoxyl sulfate induces oxidative stress in endothelial cells. J. Thromb. Haemost. 2007, 5, 1302–1308. [Google Scholar] [CrossRef] [Green Version]
- Adijiang, A.; Goto, S.; Uramoto, S.; Nishijima, F.; Niwa, T. Indoxyl sulphate promotes aortic calcification with expression of osteoblast-specific proteins in hypertensive rats. Nephrol. Dial. Transplant. 2008, 23, 1892–1901. [Google Scholar] [CrossRef] [PubMed] [Green Version]
- Barreto, F.C.; Barreto, D.V.; Liabeuf, S.; Meert, N.; Glorieux, G.; Temmar, M.; Choukroun, G.; Vanholder, R.; Massy, Z.A.; European Uremic Toxin Work Group (EUTox). Serum indoxyl sulfate is associated with vascular disease and mortality in chronic kidney disease patients. Clin. J. Am. Soc. Nephrol. 2009, 4, 1551–1558. [Google Scholar] [CrossRef] [PubMed]
- Jourde-Chiche, N.; Dou, L.; Cerini, C.; Dignat-George, F.; Brunet, P. Vascular incompetence in dialysis patients-protein-bound uremic toxins and endothelial dysfunction. Semin. Dial. 2011, 24, 327–337. [Google Scholar] [CrossRef] [PubMed]
- Jourde-Chiche, N.; Dou, L.; Cerini, C.; Dignat-George, F.; Vanholder, R.; Brunet, P. Protein-bound toxins—Update 2009. Semin. Dial. 2009, 22, 334–339. [Google Scholar] [CrossRef]
- Liabeuf, S.; Barreto, D.V.; Barreto, F.C.; Meert, N.; Glorieux, G.; Schepers, E.; Temmar, M.; Choukroun, G.; Vanholder, R.; Massy, Z.A. Free p-cresylsulphate is a predictor of mortality in patients at different stages of chronic kidney disease. Nephrol. Dial. Transplant. 2009, 25, 1183–1191. [Google Scholar] [CrossRef] [Green Version]
- Chinnappa, S.; White, E.; Lewis, N.; Baldo, O.; Tu, Y.K.; Glorieux, G.; Vanholder, R.; El Nahas, M.; Mooney, A. Early and asymptomatic cardiac dysfunction in chronic kidney disease. Nephrol. Dial. Transplant. 2017, 33, 450–458. [Google Scholar] [CrossRef] [Green Version]
- Cao, X.S.; Chen, J.; Zou, J.Z.; Zhong, Y.H.; Teng, J.; Ji, J.; Chen, Z.W.; Liu, Z.H.; Shen, B.; Nie, Y.X.; et al. Association of indoxyl sulfate with heart failure among patients on hemodialysis. Clin. J. Am. Soc. Nephrol. 2015, 10, 111–119. [Google Scholar] [CrossRef]
- Shimazu, S.; Hirashiki, A.; Okumura, T.; Yamada, T.; Okamoto, R.; Shinoda, N.; Takeshita, K.; Kondo, T.; Niwa, T.; Murohara, T. Association between indoxyl sulfate and cardiac dysfunction and prognosis in patients with dilated cardiomyopathy. Circ. J. 2013, 77, 390–396. [Google Scholar] [CrossRef] [PubMed]
- Cotter, G.; Williams, S.G.; Vered, Z.; Tan, L.B. Role of cardiac power in heart failure. Curr. Opin. Cardiol. 2003, 18, 215–222. [Google Scholar] [CrossRef]
- Sato, E.; Mori, T.; Mishima, E.; Suzuki, A.; Sugawara, S.; Kurasawa, N.; Saigusa, D.; Miura, D.; Morikawa-Ichinose, T.; Saito, R.; et al. Metabolic alterations by indoxyl sulfate in skeletal muscle induce uremic sarcopenia in chronic kidney disease. Sci. Rep. 2016, 6, 36618. [Google Scholar] [CrossRef] [PubMed] [Green Version]
- Lekawanvijit, S. Cardiotoxicity of uremic toxins: A driver of cardiorenal syndrome. Toxins 2018, 10, 352. [Google Scholar] [CrossRef] [PubMed]
- Lekawanvijit, S.; Adrahtas, A.; Kelly, D.J.; Kompa, A.R.; Wang, B.H.; Krum, H. Does indoxyl sulfate, a uraemic toxin, have direct effects on cardiac fibroblasts and myocytes? Eur. Heart J. 2010, 31, 1771–1779. [Google Scholar] [CrossRef] [PubMed] [Green Version]
- Yang, K.; Xu, X.; Nie, L.; Xiao, T.; Guan, X.; He, T.; Yu, Y.; Liu, L.; Huang, Y.; Zhang, J.; et al. Indoxyl sulfate induces oxidative stress and hypertrophy in cardiomyocytes by inhibiting the AMPK/UCP2 signaling pathway. Toxicol. Lett. 2015, 234, 110–119. [Google Scholar] [CrossRef]
- Lekawanvijit, S.; Kompa, A.R.; Manabe, M.; Wang, B.H.; Langham, R.G.; Nishijima, F.; Kelly, D.J.; Krum, H. Chronic kidney disease-induced cardiac fibrosis is ameliorated by reducing circulating levels of a non-dialysable uremic toxin, indoxyl sulfate. PLoS ONE 2012, 7, e41281. [Google Scholar] [CrossRef] [PubMed]
- Fujii, H.; Nishijima, F.; Goto, S.; Sugano, M.; Yamato, H.; Kitazawa, R.; Kitazawa, S.; Fukagawa, M. Oral charcoal adsorbent (AST-120) prevents progression of cardiac damage in chronic kidney disease through suppression of oxidative stress. Nephrol. Dial. Transplant. 2009, 24, 2089–2095. [Google Scholar] [CrossRef] [PubMed] [Green Version]
- Han, H.; Zhu, J.; Zhu, Z.; Ni, J.; Du, R.; Dai, Y.; Chen, Y.; Wu, Z.; Lu, L.; Zhang, R. p-cresyl sulfate aggravates cardiac dysfunction associated with chronic kidney disease by enhancing apoptosis of cardiomyocytes. J. Am. Heart Assoc. 2015, 4, e001852. [Google Scholar] [CrossRef] [PubMed]
- Nakamura, M.; Sadoshima, J. Mechanisms of physiological and pathological cardiac hypertrophy. Nat. Rev. Cardiol. 2018, 15, 387–407. [Google Scholar] [CrossRef] [PubMed]
- Braunwald, E.; Bristow, M.R. Congestive heart failure: Fifty years of progress. Circulation 2000, 102, IV14–IV23. [Google Scholar] [CrossRef] [PubMed]
- Goldspink, D.F.; George, K.P.; Chantler, P.D.; Clements, R.E.; Sharp, L.; Hodges, G.; Stephenson, C.; Reilly, T.P.; Patwala, A.; Szakmany, T.; et al. A study of presbycardia, with gender differences favoring ageing women. Int. J. Cardiol. 2009, 137, 236–245. [Google Scholar] [CrossRef] [PubMed]
- Hothi, S.S.; Tan, D.K.; Partridge, G.; Tan, L.B. Scaling considerations in the cardiovascular pathophysiology of obese patients. Int. J. Cardiol. 2015, 191, 312–313. [Google Scholar] [CrossRef] [PubMed]
- Savonen, K.; Krachler, B.; Hassinen, M.; Komulainen, P.; Kiviniemi, V.; Lakka, T.A.; Rauramaa, R. The current standard measure of cardiorespiratory fitness introduces confounding by body mass: The DR’s EXTRA study. Int. J. Obes. 2012, 36, 1135–1140. [Google Scholar] [CrossRef] [PubMed]
- Levey, A.S.; Bosch, J.P.; Lewis, J.B.; Greene, T.; Rogers, N.; Roth, D. A more accurate method to estimate glomerular filtration rate from serum creatinine: A new prediction equation. Modification of diet in renal disease study group. Ann. Intern. Med. 1999, 130, 461–470. [Google Scholar] [CrossRef] [PubMed]
- Cooke, G.A.; Marshall, P.; Al-Timman, J.K.; Wright, D.J.; Riley, R.; Hainsworth, R.; Tan, L.B. Physiological cardiac reserve: Development of a non-invasive method and first estimates in man. Heart 1998, 79, 289–294. [Google Scholar] [CrossRef]
- Williams, S.G.; Cooke, G.A.; Wright, D.J.; Parsons, W.J.; Riley, R.L.; Marshall, P.; Tan, L.B. Peak exercise cardiac power output; a direct indicator of cardiac function strongly predictive of prognosis in chronic heart failure. Eur. Heart J. 2001, 22, 1496–1503. [Google Scholar] [CrossRef] [Green Version]
- Collier, C.R. Determination of mixed venous CO2 tensions by rebreathing. J. Appl. Physiol. 1956, 9, 25–29. [Google Scholar] [CrossRef]
- Vanhees, L.; Defoor, J.; Schepers, D.; Brusselle, S.; Reybrouck, T.; Fagard, R. Comparison of cardiac output measured by two automated methods of CO2 rebreathing. Med. Sci. Sports Exerc. 2000, 32, 1028–1034. [Google Scholar] [CrossRef]
- Beaver, W.L.; Wasserman, K.; Whipp, B.J. A new method for detecting anaerobic threshold by gas exchange. J. Appl. Physiol. 1986, 60, 2020–2027. [Google Scholar] [CrossRef]
- Defares, J.G. Determination of PvCO2 from the exponential CO2 rise during rebreathing. J. Appl. Physiol. 1958, 13, 159–164. [Google Scholar] [CrossRef] [PubMed]
- Otterstad, J.E.; Froeland, G.; St John Sutton, M.; Holme, I. Accuracy and reproducibility of biplane two-dimensional echocardiographic measurements of left ventricular dimensions and function. Eur. Heart J. 1997, 18, 507–513. [Google Scholar] [CrossRef] [PubMed] [Green Version]
- Devereux, R.B.; Alonso, D.R.; Lutas, E.M.; Gottlieb, G.J.; Campo, E.; Sachs, I.; Reichek, N. Echocardiographic assessment of left ventricular hypertrophy: Comparison to necropsy findings. Am. J. Cardiol. 1986, 57, 450–458. [Google Scholar] [CrossRef]
- Cortigiani, L.; Sorbo, S.; Miccoli, M.; Scali, M.C.; Simioniuc, A.; Morrone, D.; Bovenzi, F.; Marzilli, M.; Dini, F.L. Prognostic value of cardiac power output to left ventricular mass in patients with left ventricular dysfunction and dobutamine stress echo negative by wall motion criteria. Eur. Heart J. Cardiovasc. Imaging 2017, 18, 153–158. [Google Scholar] [CrossRef] [PubMed]
- Fagugli, R.M.; De Smet, R.; Buoncristiani, U.; Lameire, N.; Vanholder, R. Behavior of non-protein-bound and protein-bound uremic solutes during daily hemodialysis. Am. J. Kidney Dis. 2002, 40, 339–347. [Google Scholar] [CrossRef] [PubMed]
- Meert, N.; Schepers, E.; Glorieux, G.; Van Landschoot, M.; Goeman, J.L.; Waterloos, M.A.; Dhondt, A.; Van der Eycken, J.; Vanholder, R. Novel method for simultaneous determination of p-cresylsulphate and p-cresylglucuronide: Clinical data and pathophysiological implications. Nephrol. Dial. Transplant 2012, 27, 2388–2396. [Google Scholar] [CrossRef] [PubMed]


| Patient Characteristics | CKD 2 (n = 14) | CKD 3 (n = 15) | CKD 4 (n = 16) | CKD 5 (n = 11) | ANOVA (p) |
|---|---|---|---|---|---|
| Age (years) | 38.1 ± 8.8 | 52.2 ± 9.1 | 48.6 ± 12.7 | 47.9 ± 15.4 | 0.01 * |
| BMI (kg/m2) | 26.6 ± 3.6 | 28.6 ± 4.1 | 26.6 ± 4.2 | 29.5 ± 4.1 | 0.16 |
| Biochemistry | |||||
| eGFR (mL/min) | 73.5 ± 7.9 | 43.2 ± 7.9 | 21.5 ± 4.3 | 11.9 ± 2.4 | <10−3 * |
| Creatinine (μmoL/L) | 104.6 ± 10.9 | 158.1 ± 2.6 | 294.8 ± 56.7 | 550.1 ± 227.4 | <10−3 * |
| Urea (mmoL/L) | 7.3 ± 1.8 | 11.5 ± 2.4 | 20.1 ± 3.6 | 27.0 ± 8.7 | <10−3 * |
| Calcium (mmoL/L) | 2.4 ± 0.1 | 2.4 ± 0.1 | 2.3 ± 0.1 | 2.3 ± 0.2 | 0.54 |
| Phosphate (mmoL/L) | 1.1 ± 0.2 | 1.1 ± 0.1 | 1.2 ± 0.1 | 1.6 ± 0.7 | 0.001 * |
| Bicarbonate (mmoL/L) | 28 ± 2.5 | 25.9 ± 2.5 | 22.9 ± 3.3 | 21.0 ± 3.5 | <10−3 * |
| Uric acid (mg/dL) | 8.6 ± 2.0 | 10.9 ± 2.3 | 9.7 ± 2.2 | 10.4 ± 2.2 | 0.05 |
| PTH (pmoL/L) | 6.1 ± 4.8 | 16.9 ± 25.7 | 25.4 ± 17.4 | 47.6 ± 38.9 | 0.005 * |
| Haemoglobin (g/dL) | 15.1 ± 1.2 | 14 ± 1.4 | 13.2 ± 1.6 | 12.1 ± 1.3 | <10−3 * |
| CPX parameters | |||||
| Peak Qt (L/min) | 22.1 ± 2.1 | 20.1 ± 2.1 | 19.1 ± 2.2 | 19.1 ± 1.9 | 0.001 * |
| Peak MAP (mmHg) | 106.4 ± 8.9 | 107.6 ± 7.9 | 104.2 ± 10.0 | 101.0 ± 8.9 | 0.32 |
| Peak HR (beats/min) | 169.7 ± 18.1 | 151.8 ± 12.8 | 149.3 ± 23.7 | 145.1 ± 18.5 | 0.007 * |
| CPOmax (W) | 5.23 ± 0.76 | 4.79 ± 0.61 | 4.44 ± 0.55 | 4.29 ± 0.63 | 0.002 * |
| VO2max (L/min) | 3.13 ± 0.57 | 2.70 ± 0.47 | 2.61 ± 0.63 | 2.43 ± 0.30 | 0.009 * |
| Peak C(a-v)O2 (dL/min) | 14.2 ± 2.1 | 13.4 ± 2.0 | 13.5 ± 2.04 | 12.8 ± 1.7 | 0.40 |
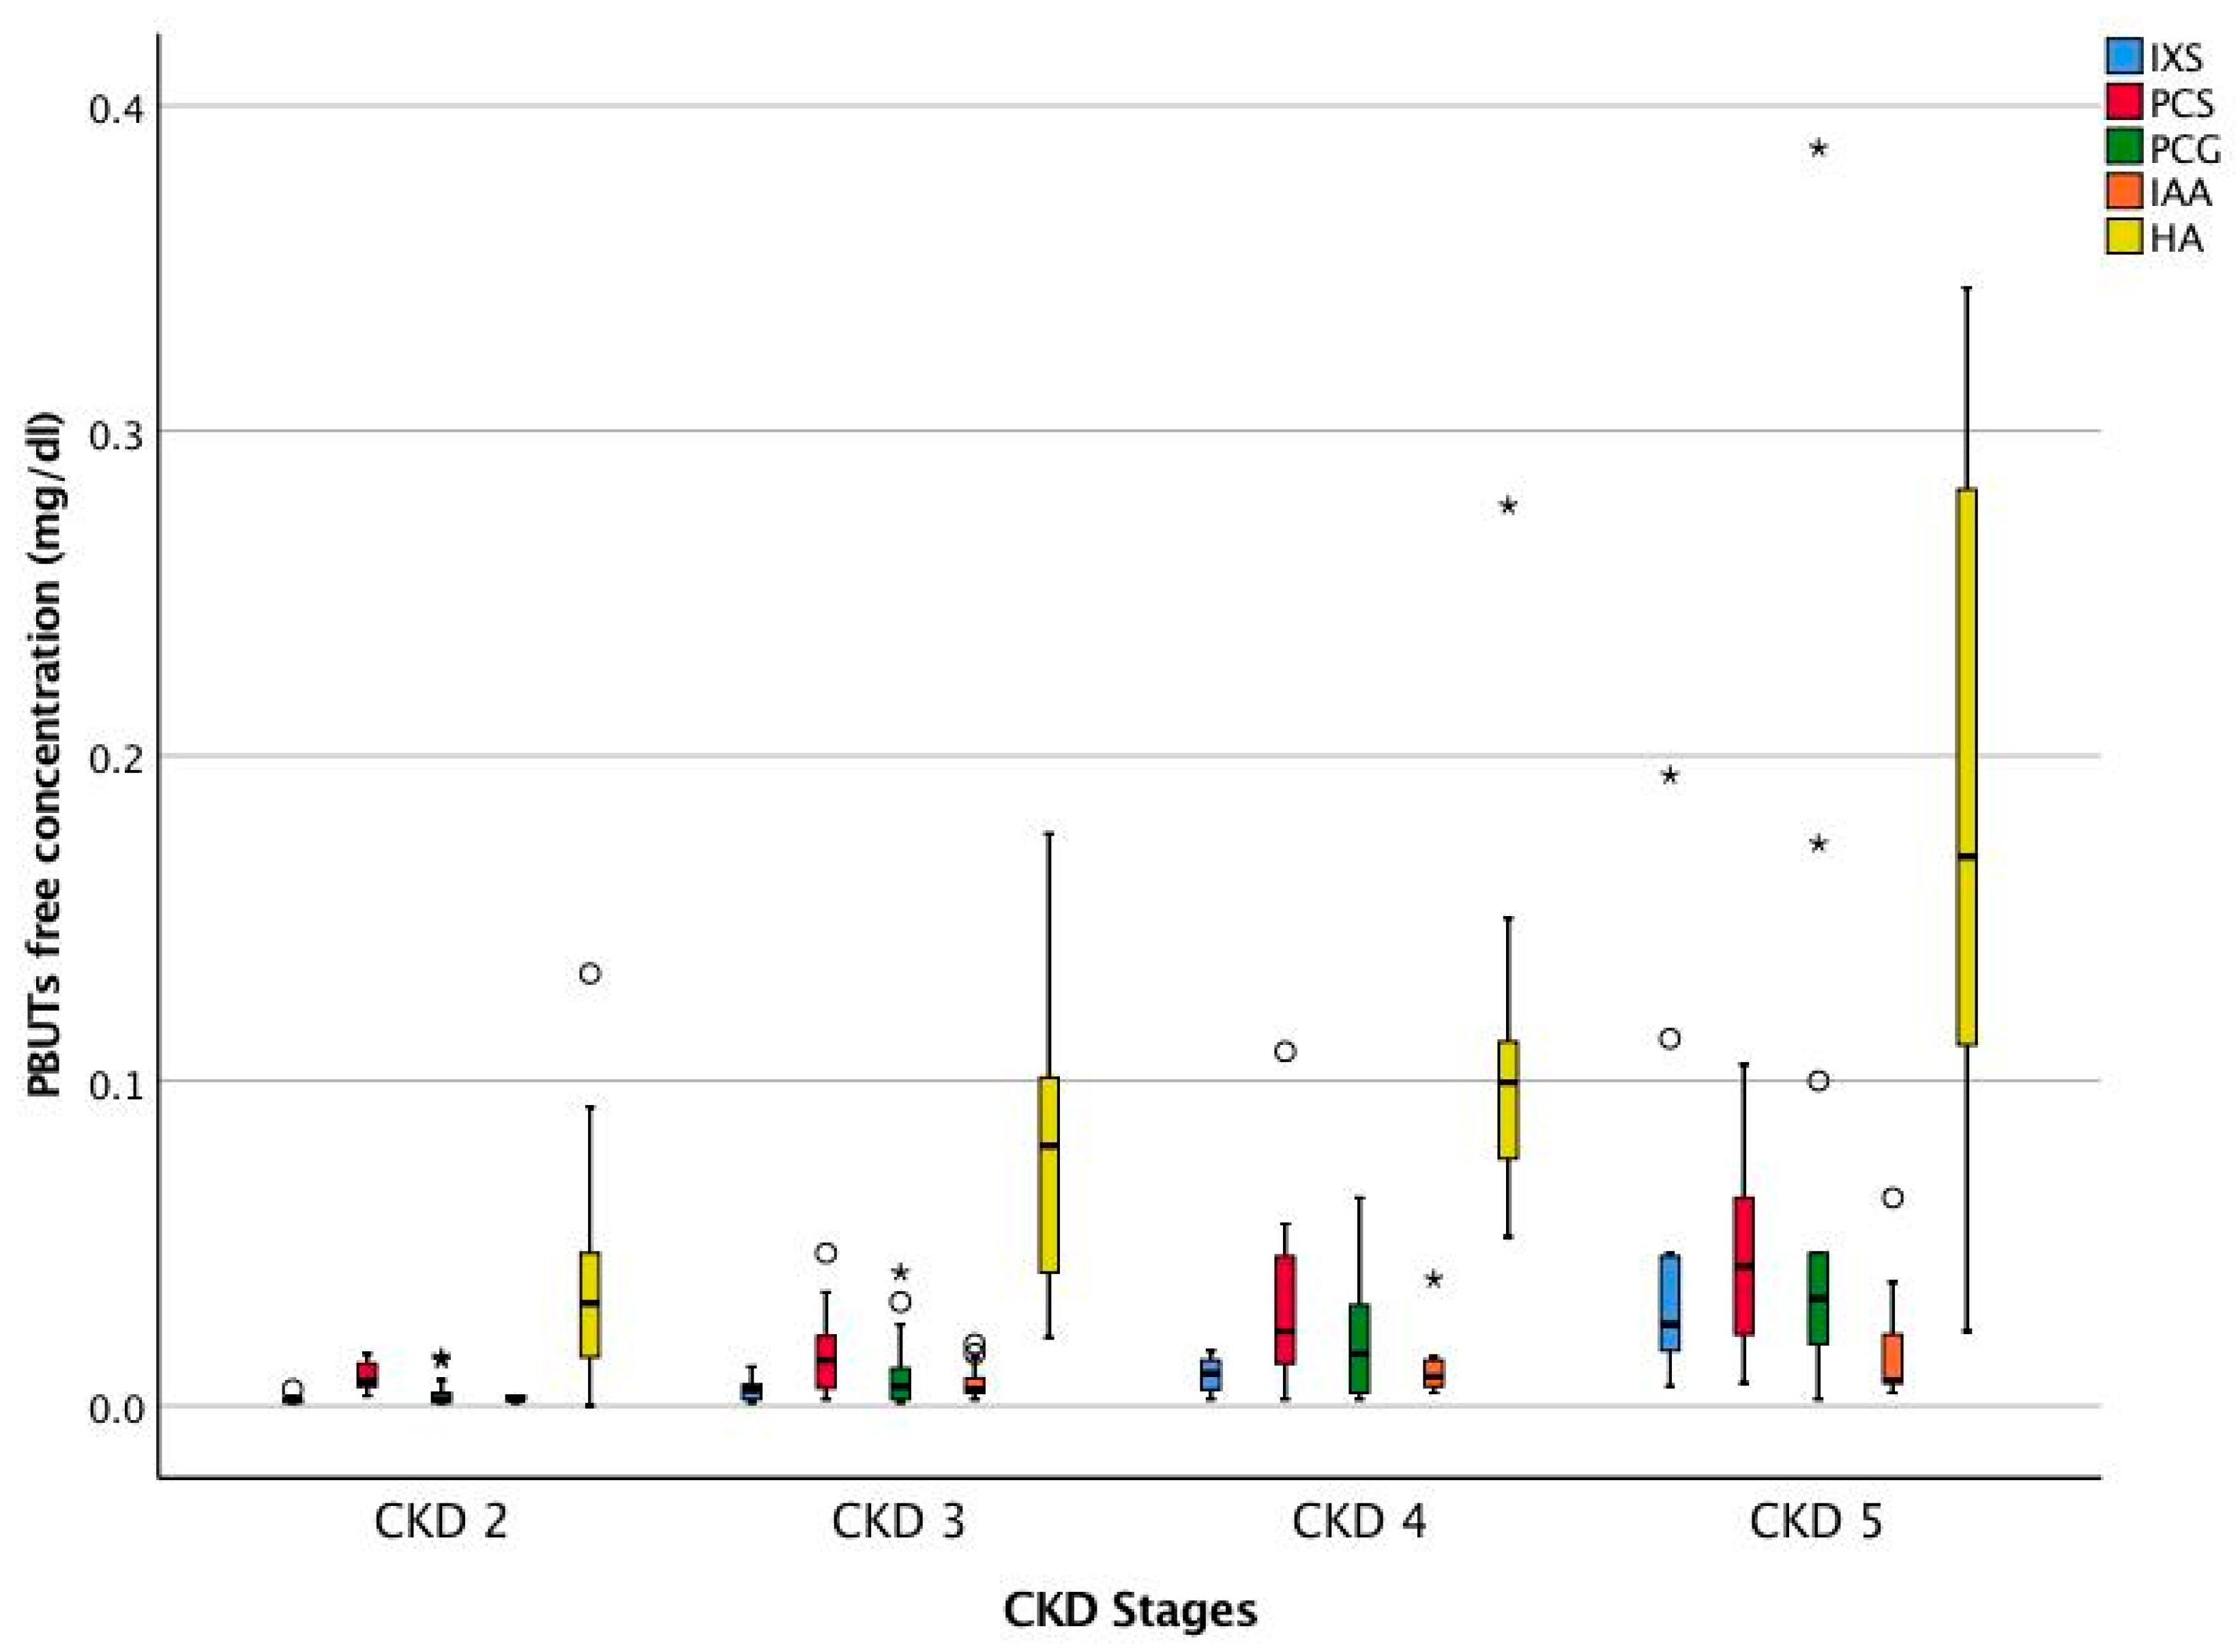
| Uremic Toxins | Serum Concentration Median (25th pct, 75th pct) (n = 56) | |
|---|---|---|
| IXS (mg/dL) | Total | 0.222 (0.101, 0.598) |
| Free | 0.006 (0.002, 0.015) | |
| PCS (mg/dL) | Total | 0.782 (0.303, 1.418) |
| Free | 0.017 (0.007, 0.031) | |
| PCG (mg/dL) | Total | 0.013 (0.004, 0.035) |
| Free | 0.011 (0.002, 0.029) | |
| IAA (mg/dL) | Total | 0.057 (0.040, 0.101) |
| Free | 0.005 (0.003, 0.011) | |
| HA (mg/dL) | Total | 0.255 (0.119, 0.379) |
| Free | 0.084 (0.038, 0.137) | |
| CMPF (mg/dL) | Total | 0.071 (0.035, 0.156) |
| Study Parameters | IXS | PCS | PCG | IAA | CMPF | HA |
|---|---|---|---|---|---|---|
| CPOmax | −0.44 ** | −0.58 ** | −0.52 ** | −0.33 * | −0.35 ** | |
| Peak Qt | −0.41 ** | −0.48 ** | −0.45 ** | −0.27 * | −0.42 ** | |
| Peak MAP | −0.35 ** | −0.30 * | ||||
| Peak HR | −0.41 ** | −0.27 * | −0.30 * | |||
| VO2max | −0.36 ** | −0.53 ** | −0.43 ** | −0.37 ** | −0.30 * | |
| Peak C(a-v)O2 | −0.36 ** | −0.26 * | −0.31 * | |||
| LVMI | ||||||
| IVSd | 0.30 * |
 and positive correlations in
  . Blank spaces represent no significant correlation. ** p < 0.01 and * p < 0.05 on Pearson correlation. Log-transformed values of serum concentrations of uremic toxins were used for analysis. CPOmax: peak cardiac power; peak Qt: peak cardiac output; MAP: mean arterial pressure; peak HR: peak heart rate; VO2max: aerobic exercise capacity; C(a-v)O2: arteriovenous O2 difference; LVMI: left ventricular mass index; IVSd: interventricular septal thickness at end diastole. Indoxyl sulfate (IXS), p-cresyl sulfate (PCS), p-cresyl glucuronide (PCG), indole acetic acid (IAA), hippuric acid, and 3-carboxy-4-methyl-5-propyl-2-furanpropionic acid (CMPF).
| Study Parameters | IXS | PCS | PCG | IAA | HA |
|---|---|---|---|---|---|
| CPOmax | −0.48 ** | −0.51 ** | −0.52 ** | −0.40 ** | −0.29 * |
| Peak Qt | −0.41 ** | −0.44 ** | −0.45 ** | −0.33 * | −0.40 ** |
| Peak MAP | −0.29 * | −0.29 * | |||
| Peak HR | −0.41 ** | −0.31 * | |||
| VO2max | −0.41 ** | −0.48 ** | −0.42 ** | −0.41 ** | −0.38 ** |
| Peak C(a-v)O2 | −0.332 * | −0.31 * | |||
| LVMI | |||||
| IVSd | 0.33 * | 0.32 * |
and positive correlations in . Blank spaces represent no significant correlation. ** p < 0.01 and * p < 0.05 on Pearson correlation. Log-transformed values of serum concentrations of uremic toxins were used for analysis. CPOmax: peak cardiac power; peak Qt: peak cardiac output; MAP: mean arterial pressure; peak HR: peak heart rate; VO2max: aerobic exercise capacity; C(a-v)O2: arteriovenous O2 difference; LVMI: left ventricular mass index; IVSd: interventricular septal thickness at end diastole. Indoxyl sulfate (IXS), p-cresyl sulfate (PCS), p-cresyl glucuronide (PCG), indole acetic acid (IAA), and hippuric acid (HA).© 2018 by the authors. Licensee MDPI, Basel, Switzerland. This article is an open access article distributed under the terms and conditions of the Creative Commons Attribution (CC BY) license (http://creativecommons.org/licenses/by/4.0/).
Share and Cite
Chinnappa, S.; Tu, Y.-K.; Yeh, Y.C.; Glorieux, G.; Vanholder, R.; Mooney, A. Association between Protein-Bound Uremic Toxins and Asymptomatic Cardiac Dysfunction in Patients with Chronic Kidney Disease. Toxins 2018, 10, 520. https://0-doi-org.brum.beds.ac.uk/10.3390/toxins10120520
Chinnappa S, Tu Y-K, Yeh YC, Glorieux G, Vanholder R, Mooney A. Association between Protein-Bound Uremic Toxins and Asymptomatic Cardiac Dysfunction in Patients with Chronic Kidney Disease. Toxins. 2018; 10(12):520. https://0-doi-org.brum.beds.ac.uk/10.3390/toxins10120520
Chicago/Turabian StyleChinnappa, Shanmugakumar, Yu-Kang Tu, Yi Chun Yeh, Griet Glorieux, Raymond Vanholder, and Andrew Mooney. 2018. "Association between Protein-Bound Uremic Toxins and Asymptomatic Cardiac Dysfunction in Patients with Chronic Kidney Disease" Toxins 10, no. 12: 520. https://0-doi-org.brum.beds.ac.uk/10.3390/toxins10120520