Aspergillus flavus NRRL 3251 Growth, Oxidative Status, and Aflatoxins Production Ability In Vitro under Different Illumination Regimes

 , , ,
, , ,  , , and
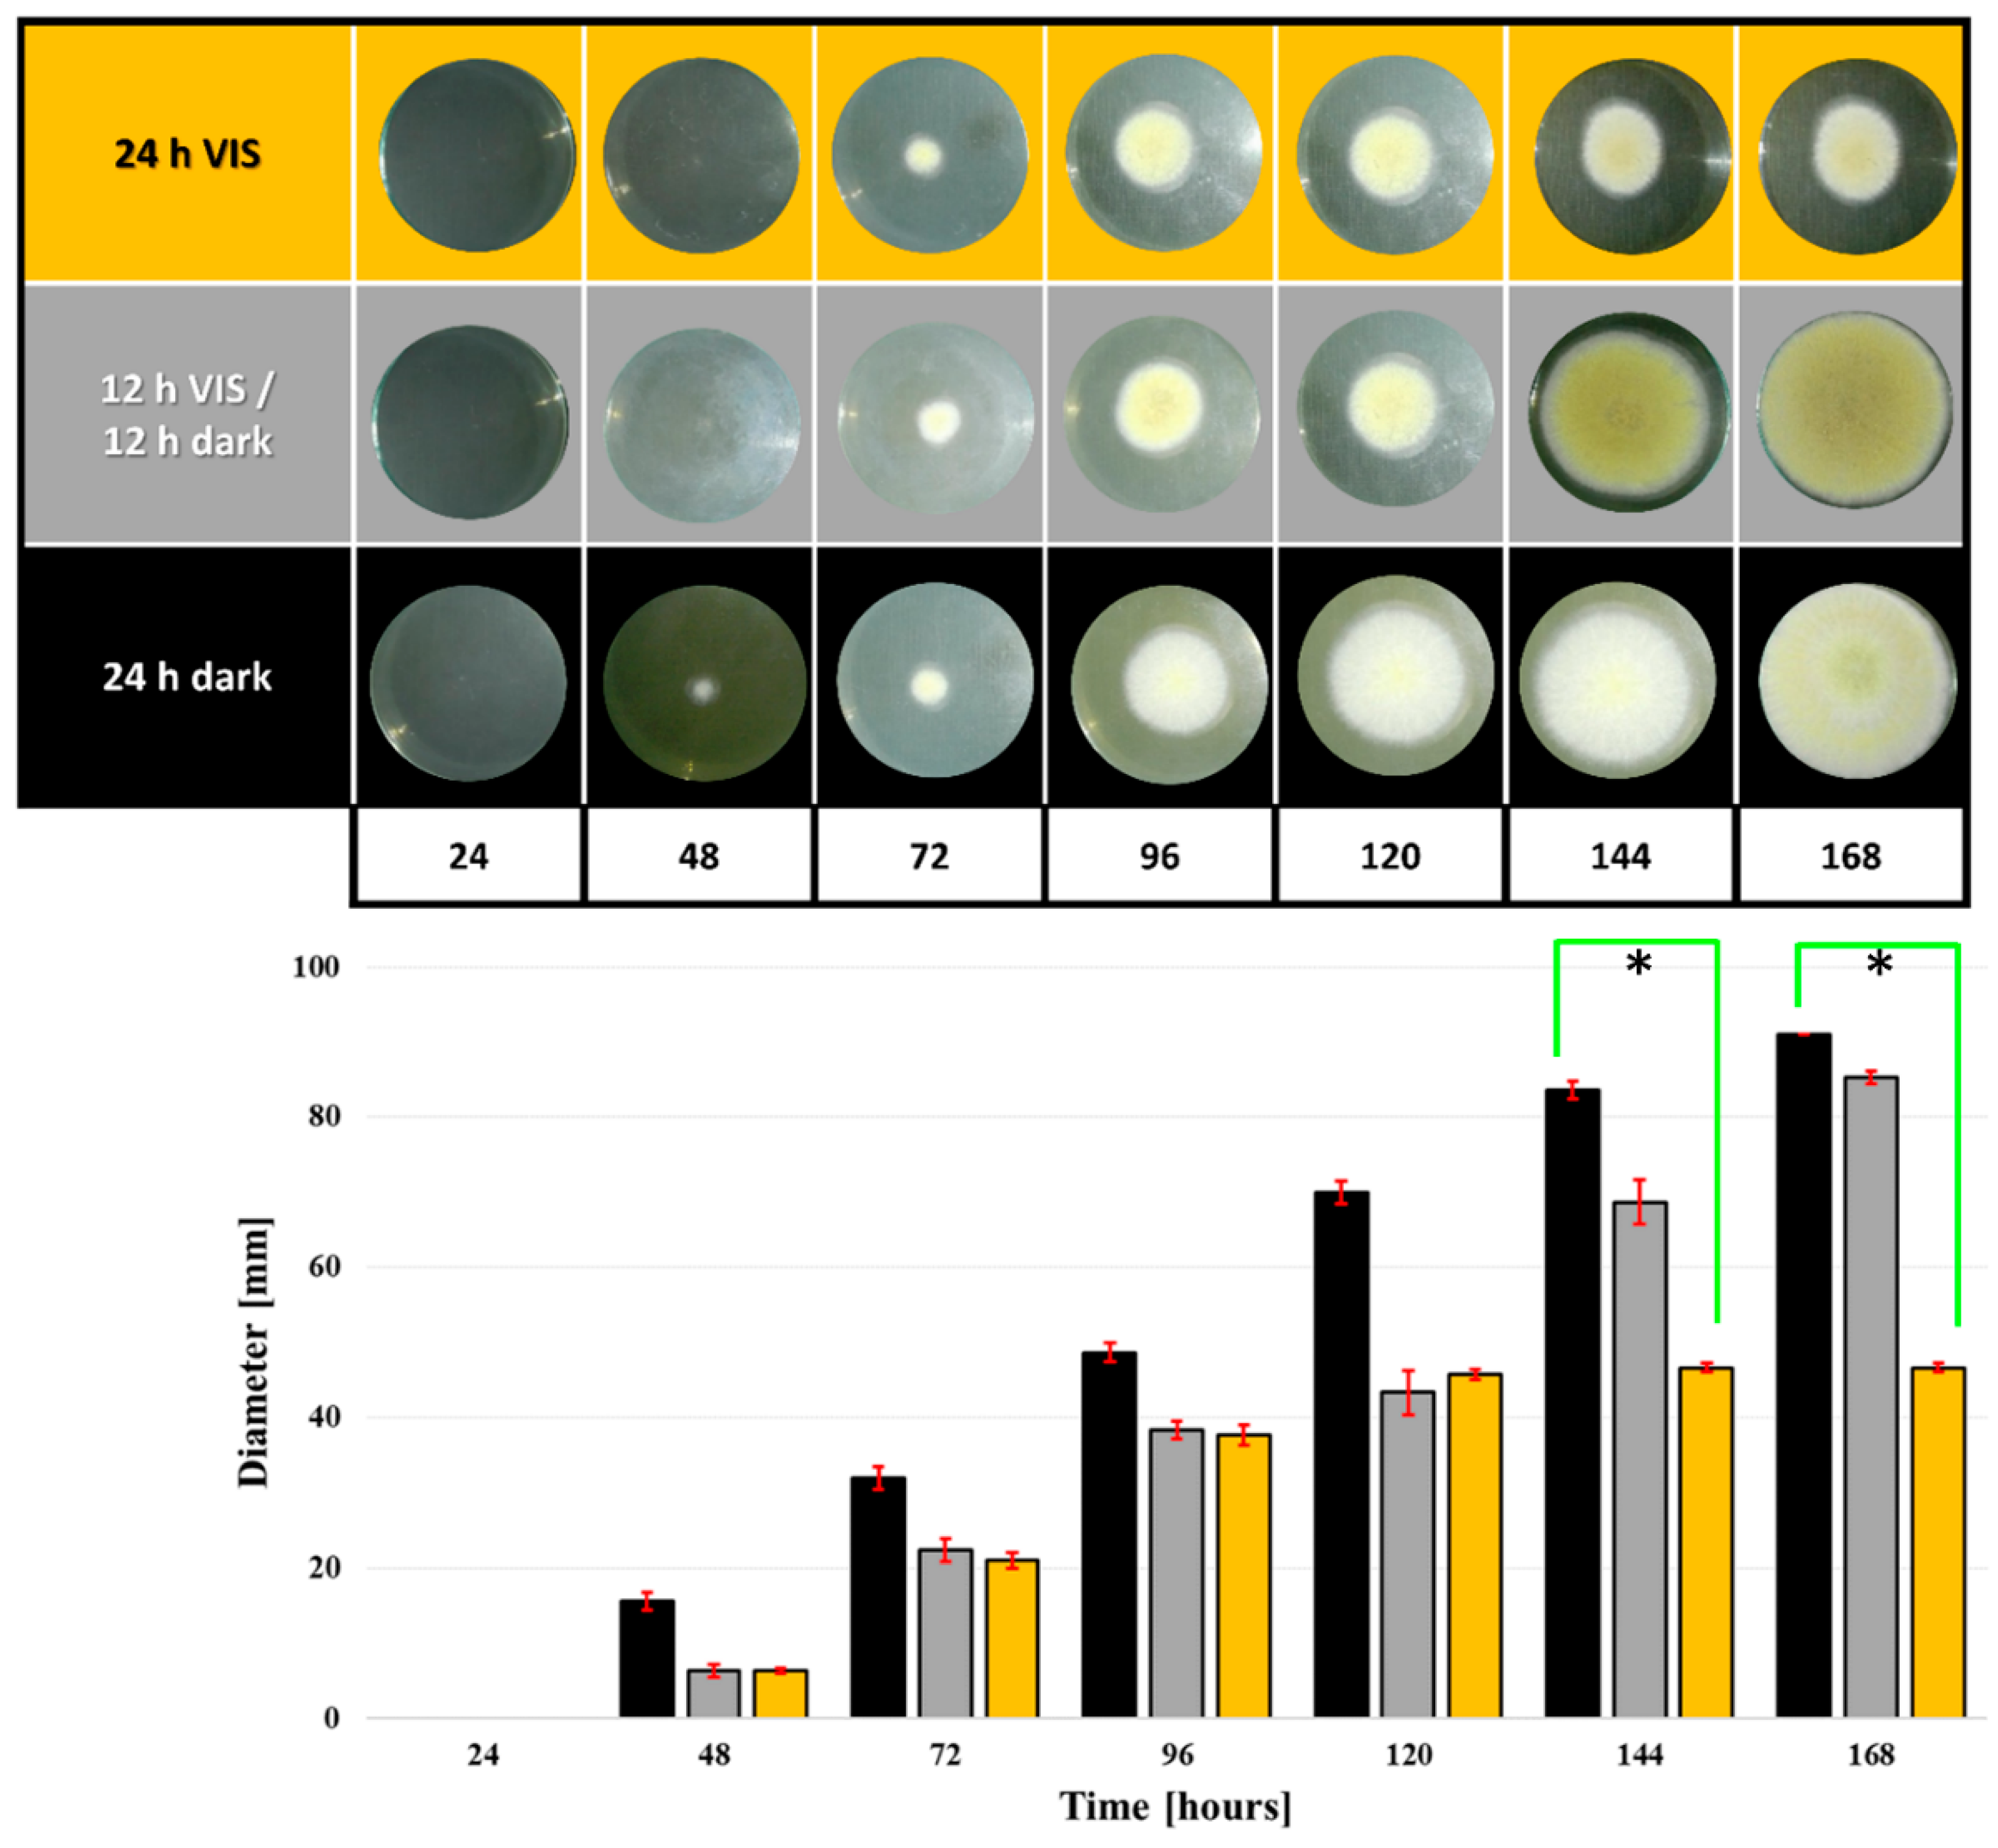
Abstract
:1. Introduction
2. Results
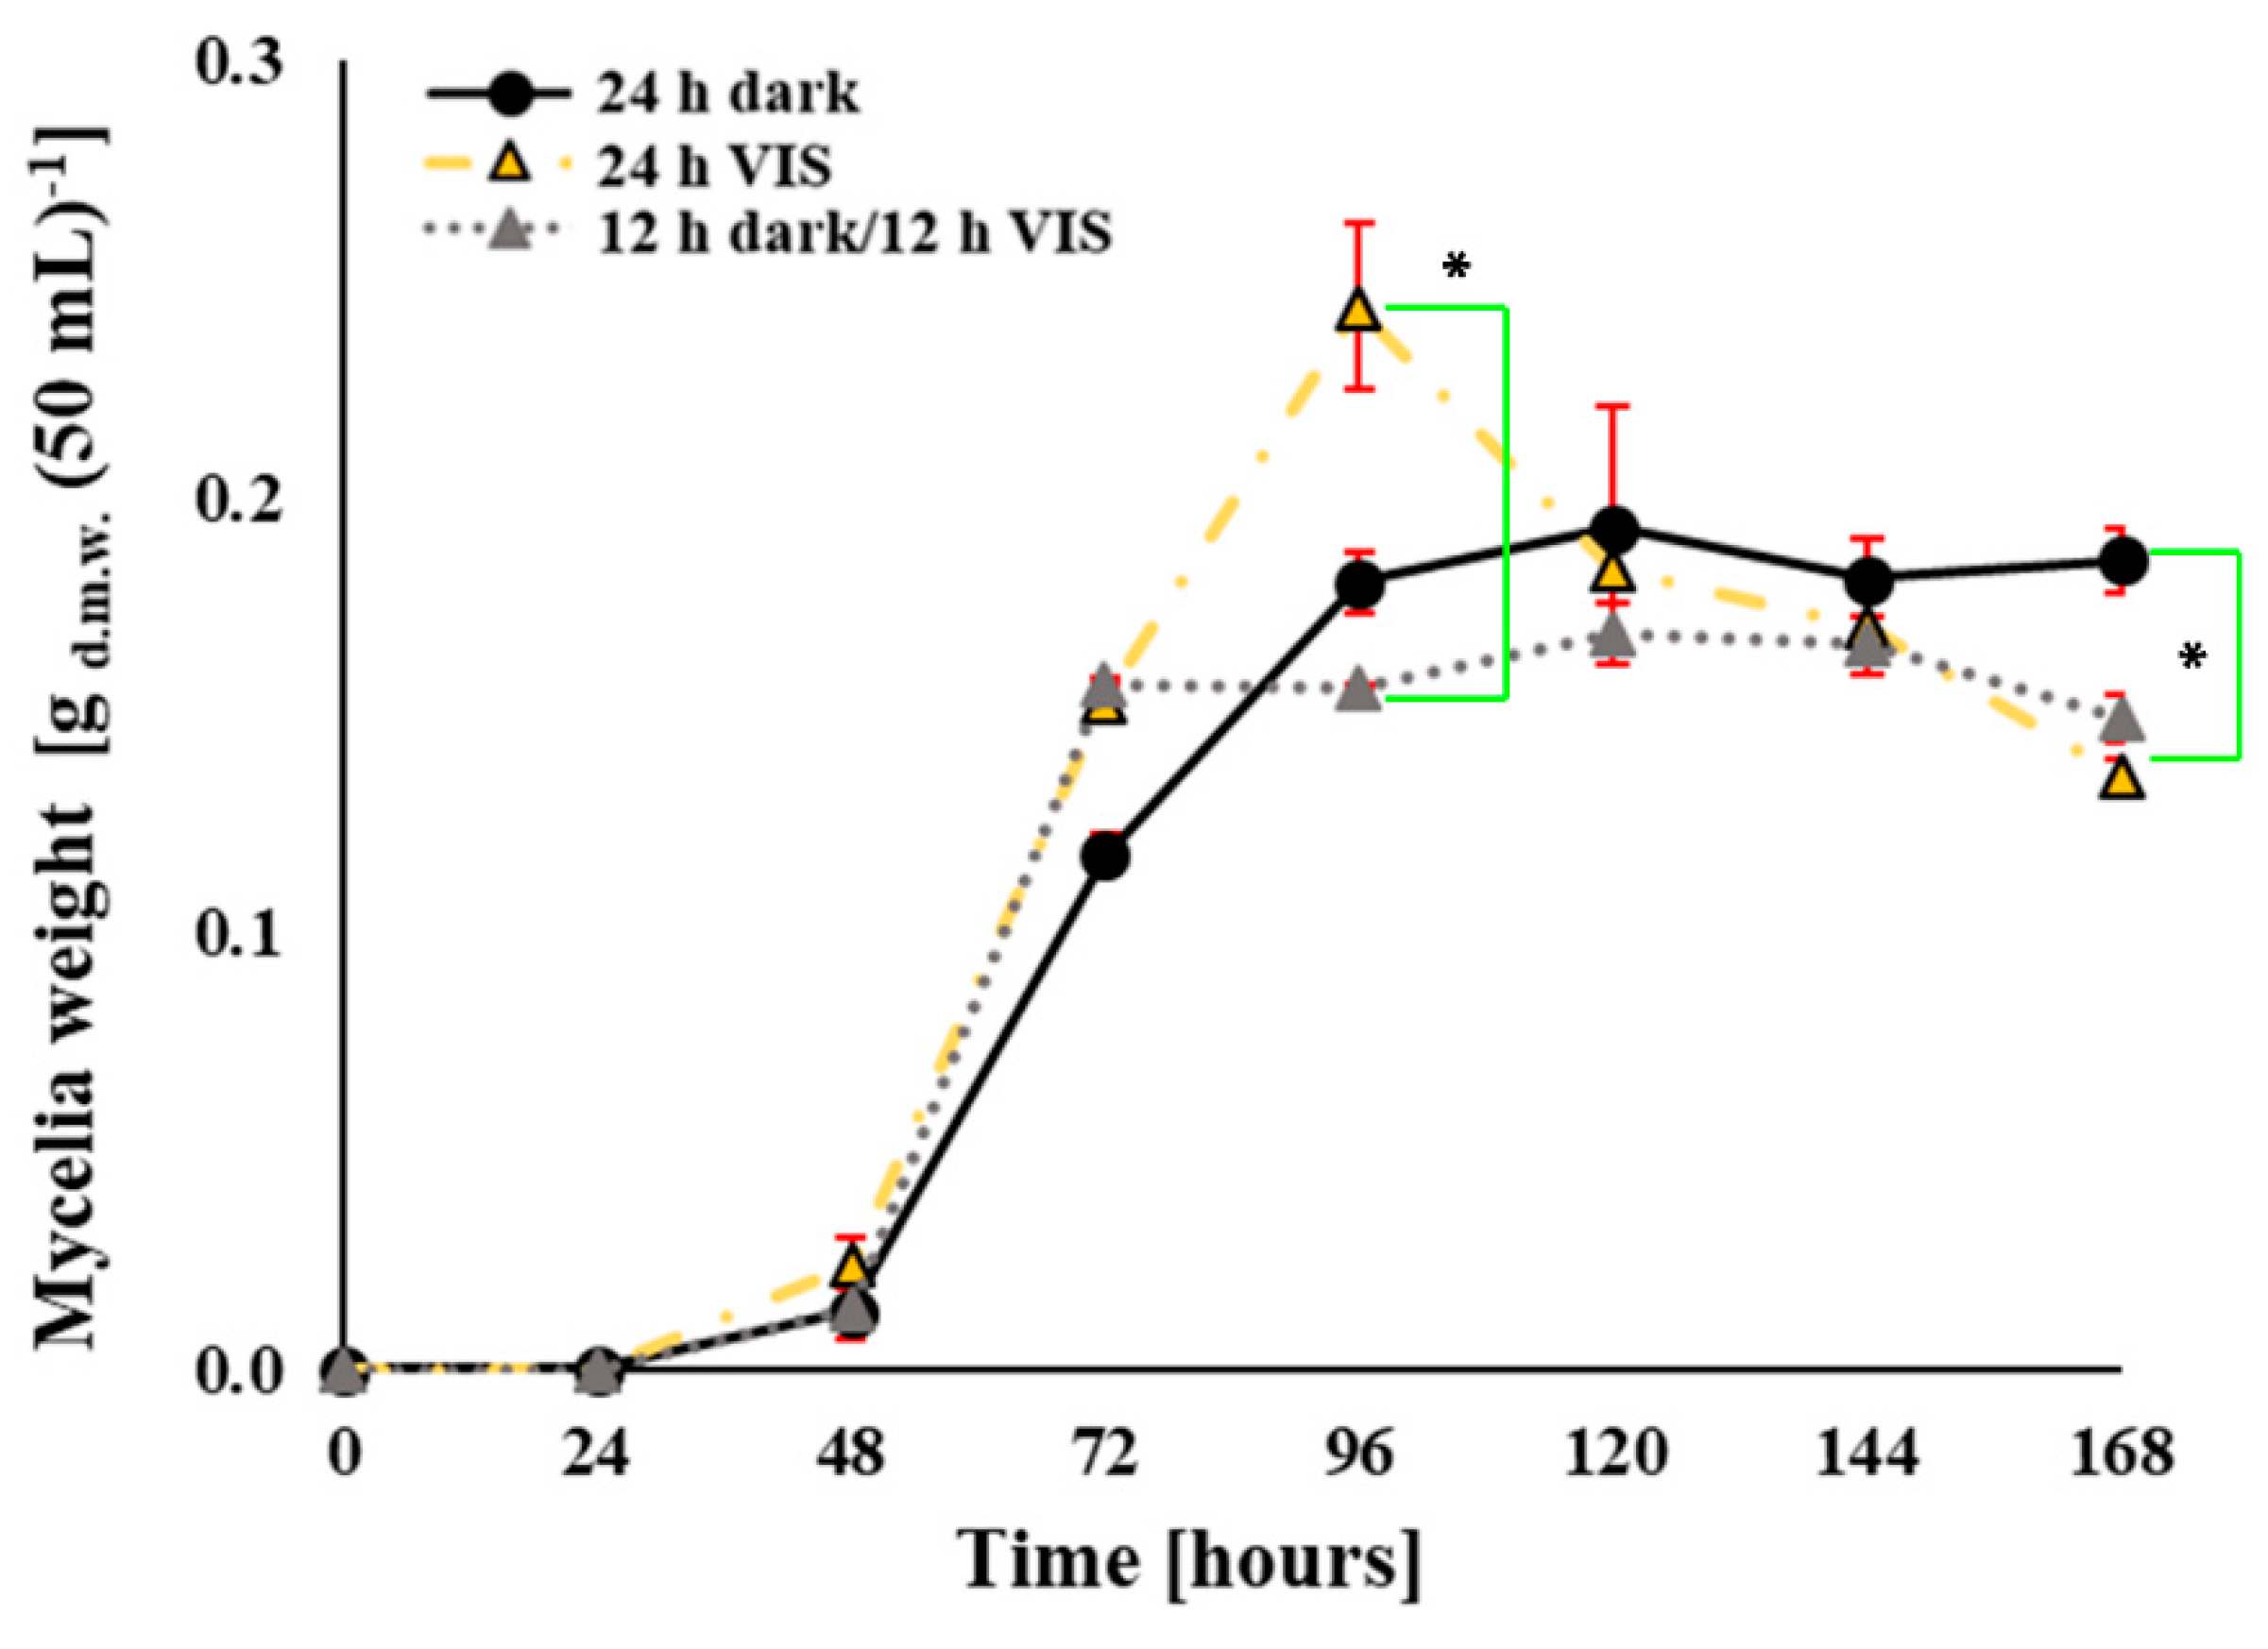
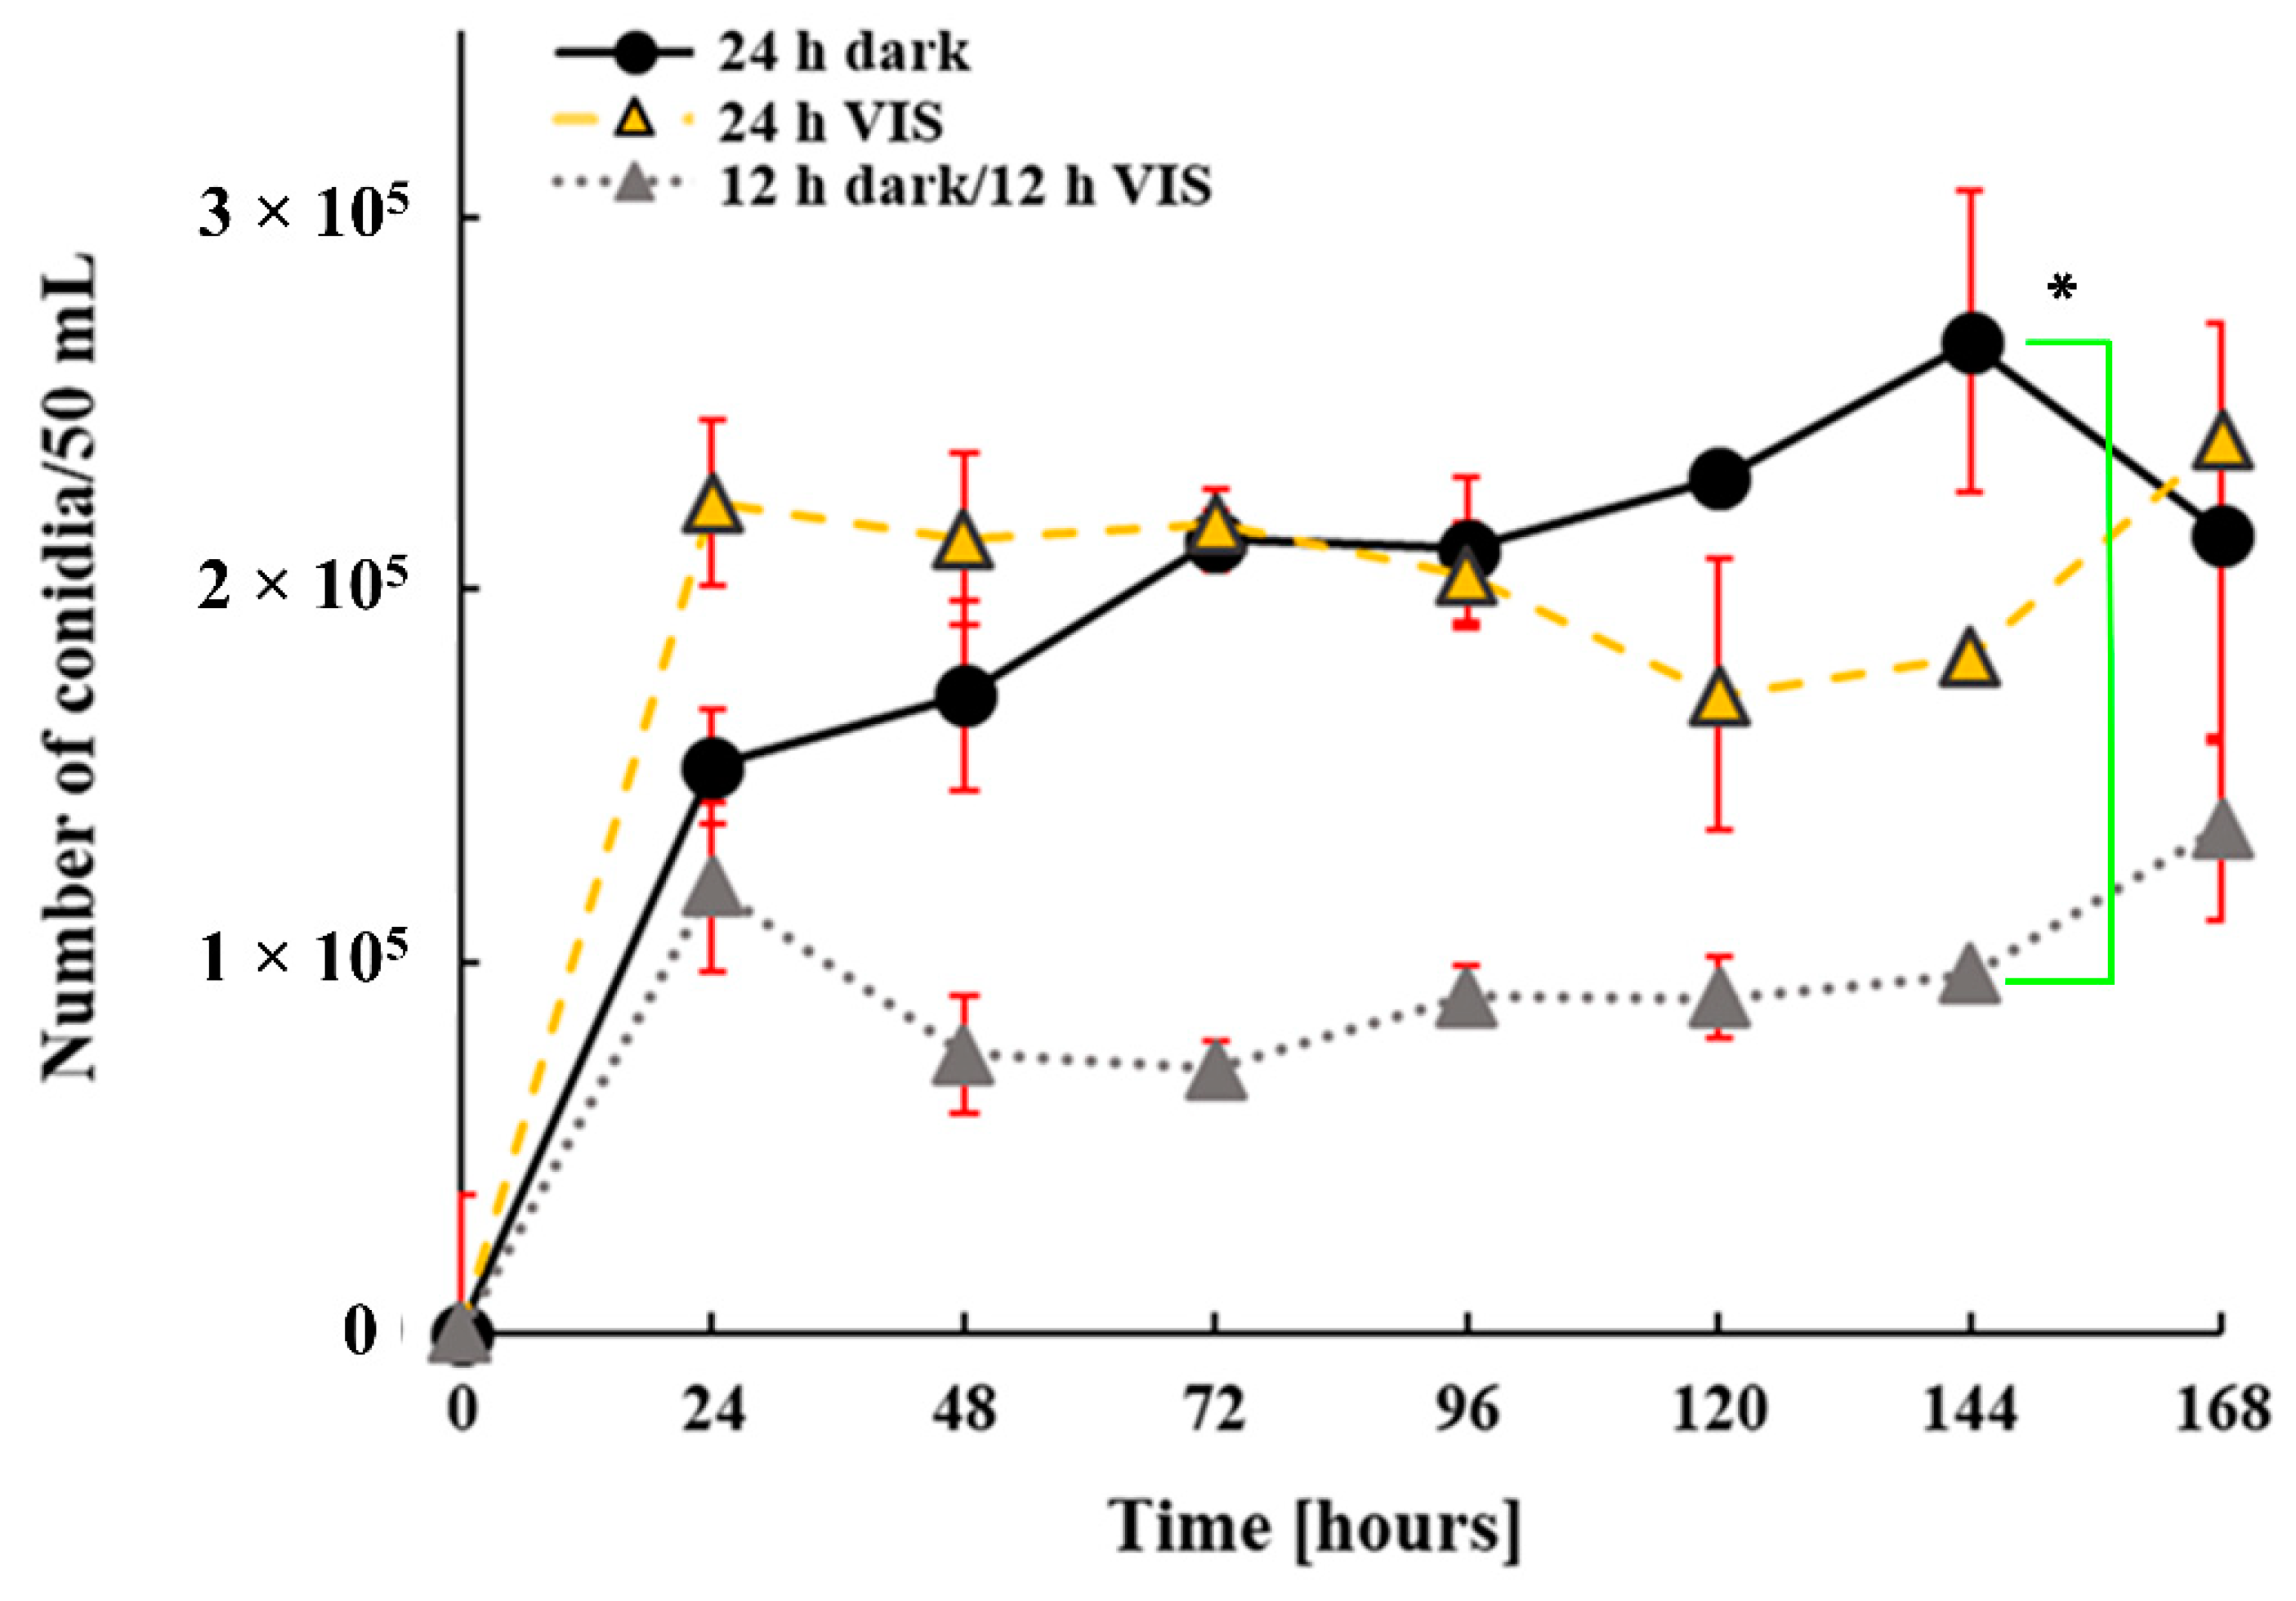
2.1. VIS Light Illumination Period Affects A. flavus Growth and Conidiation
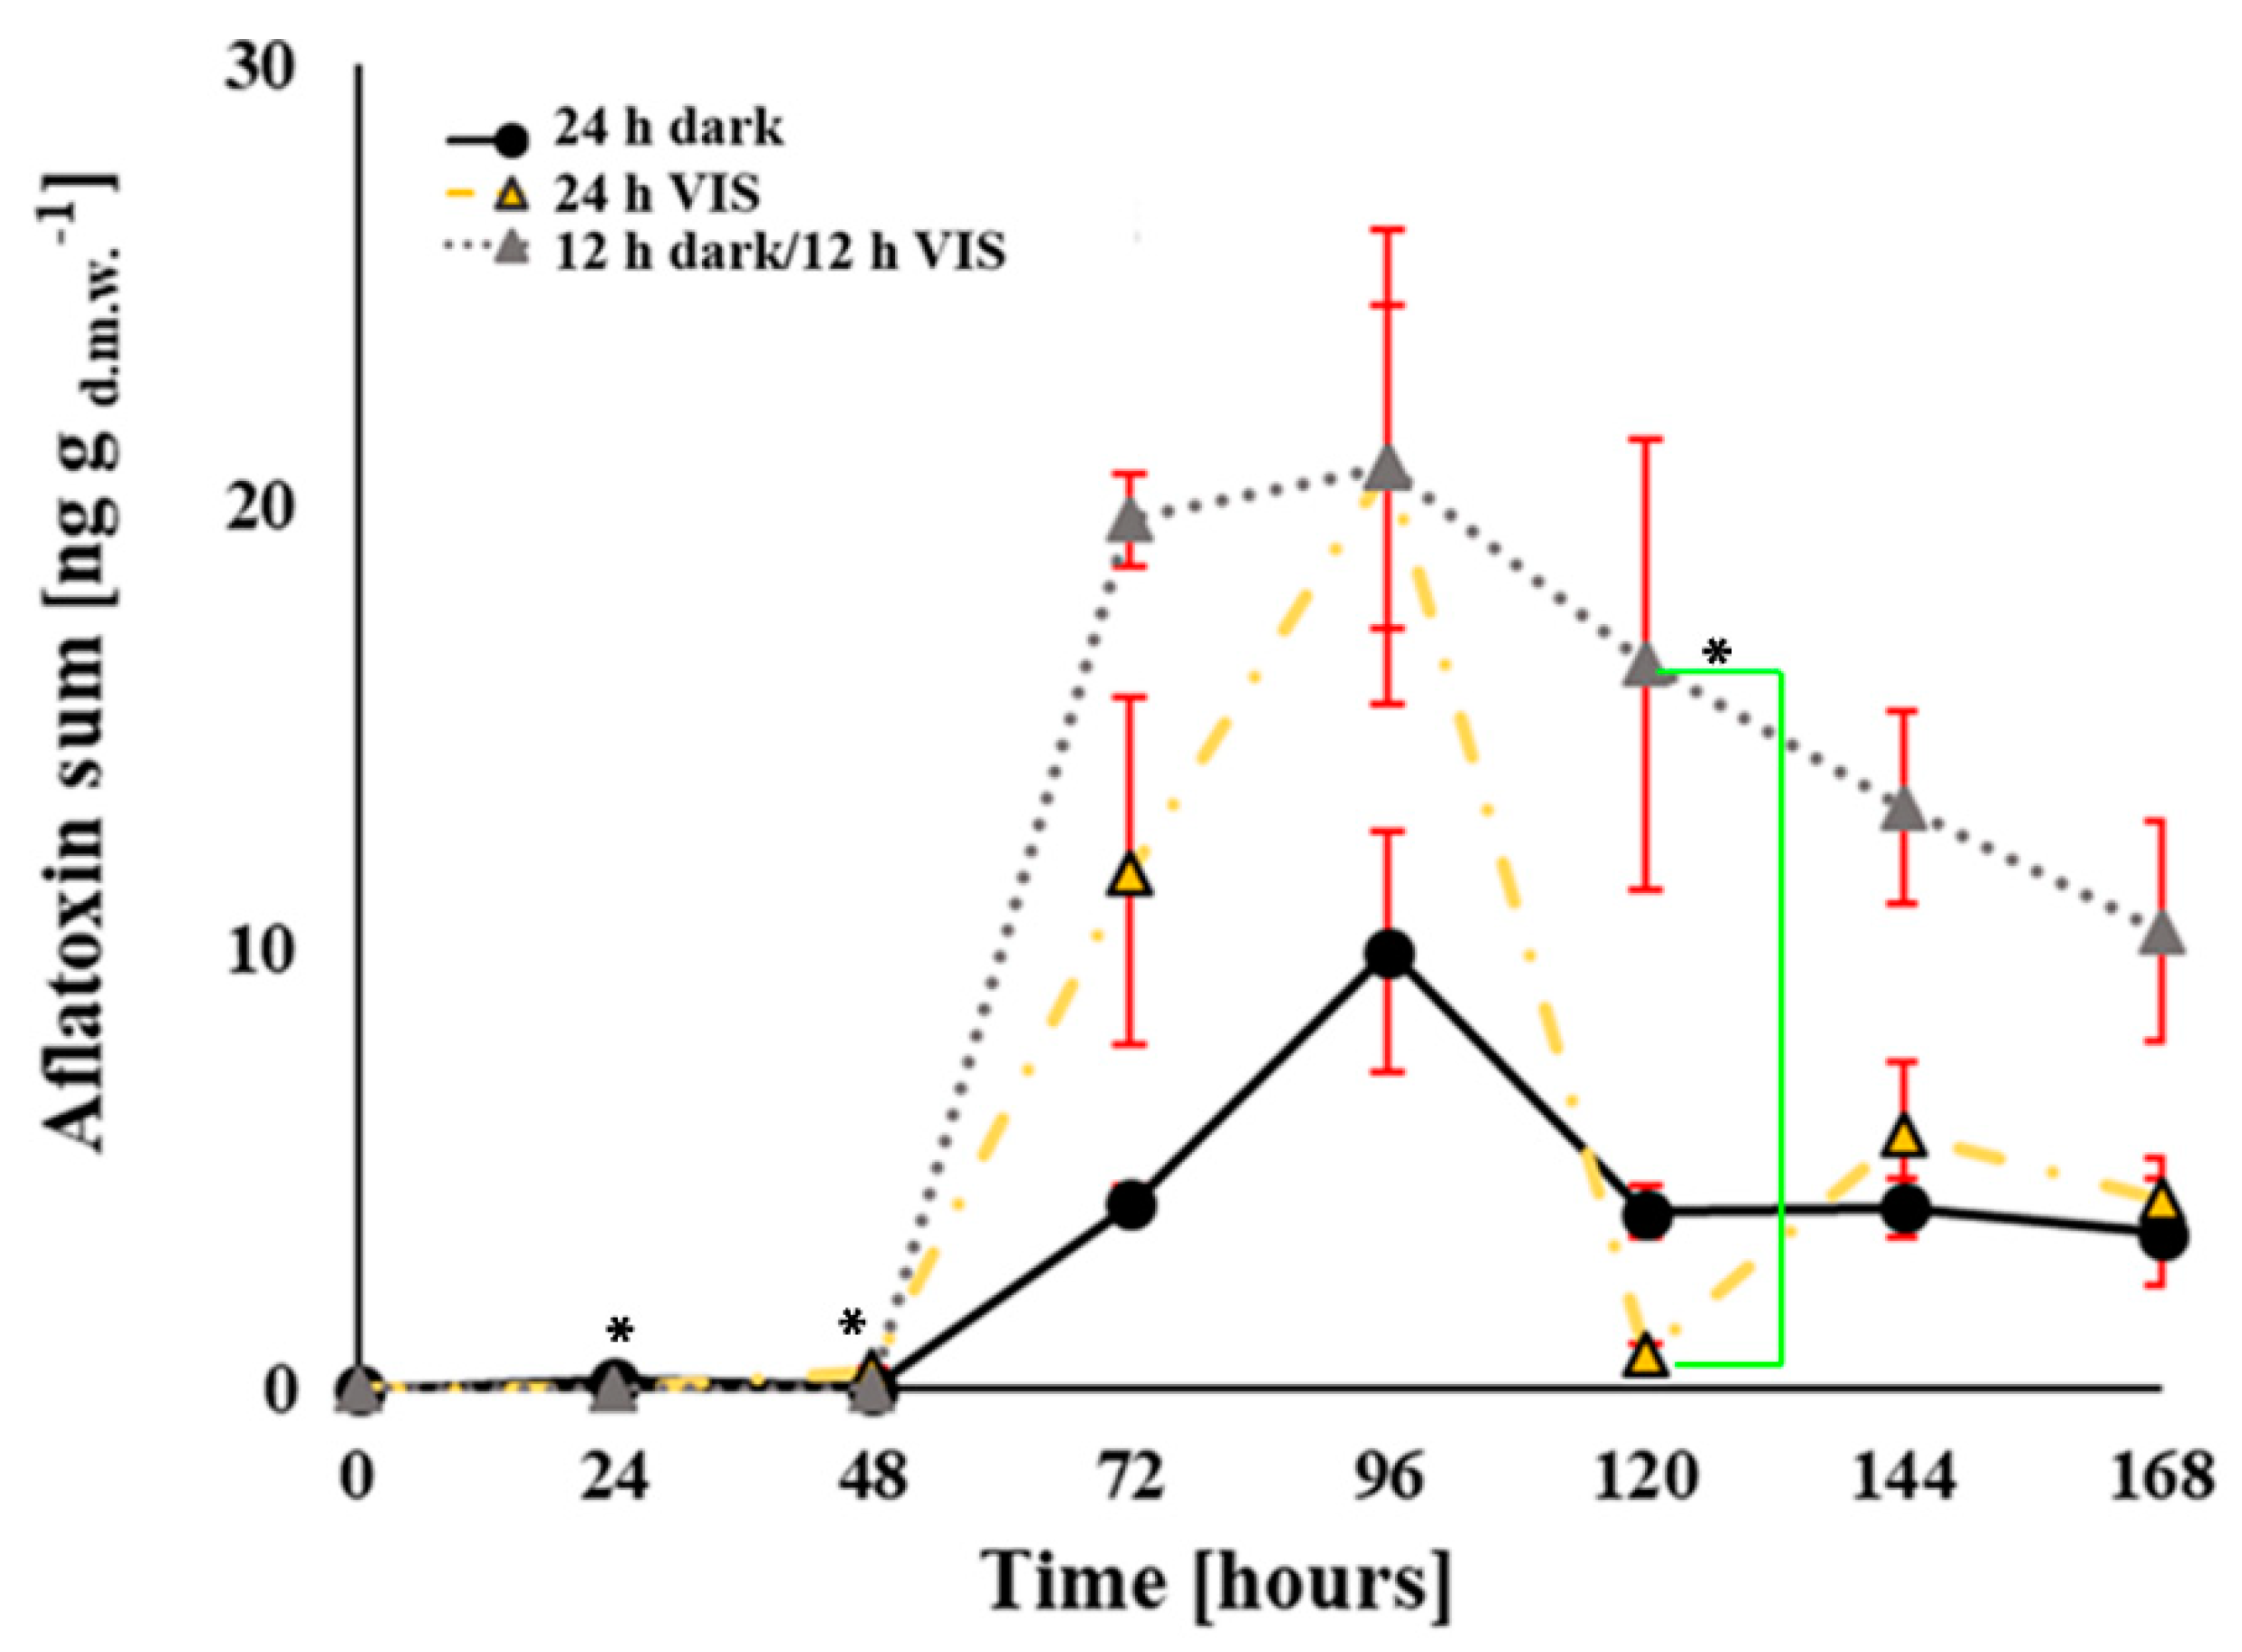
2.2. VIS Light Illumination Period Affects Aflatoxins Production Ability of A. flavus
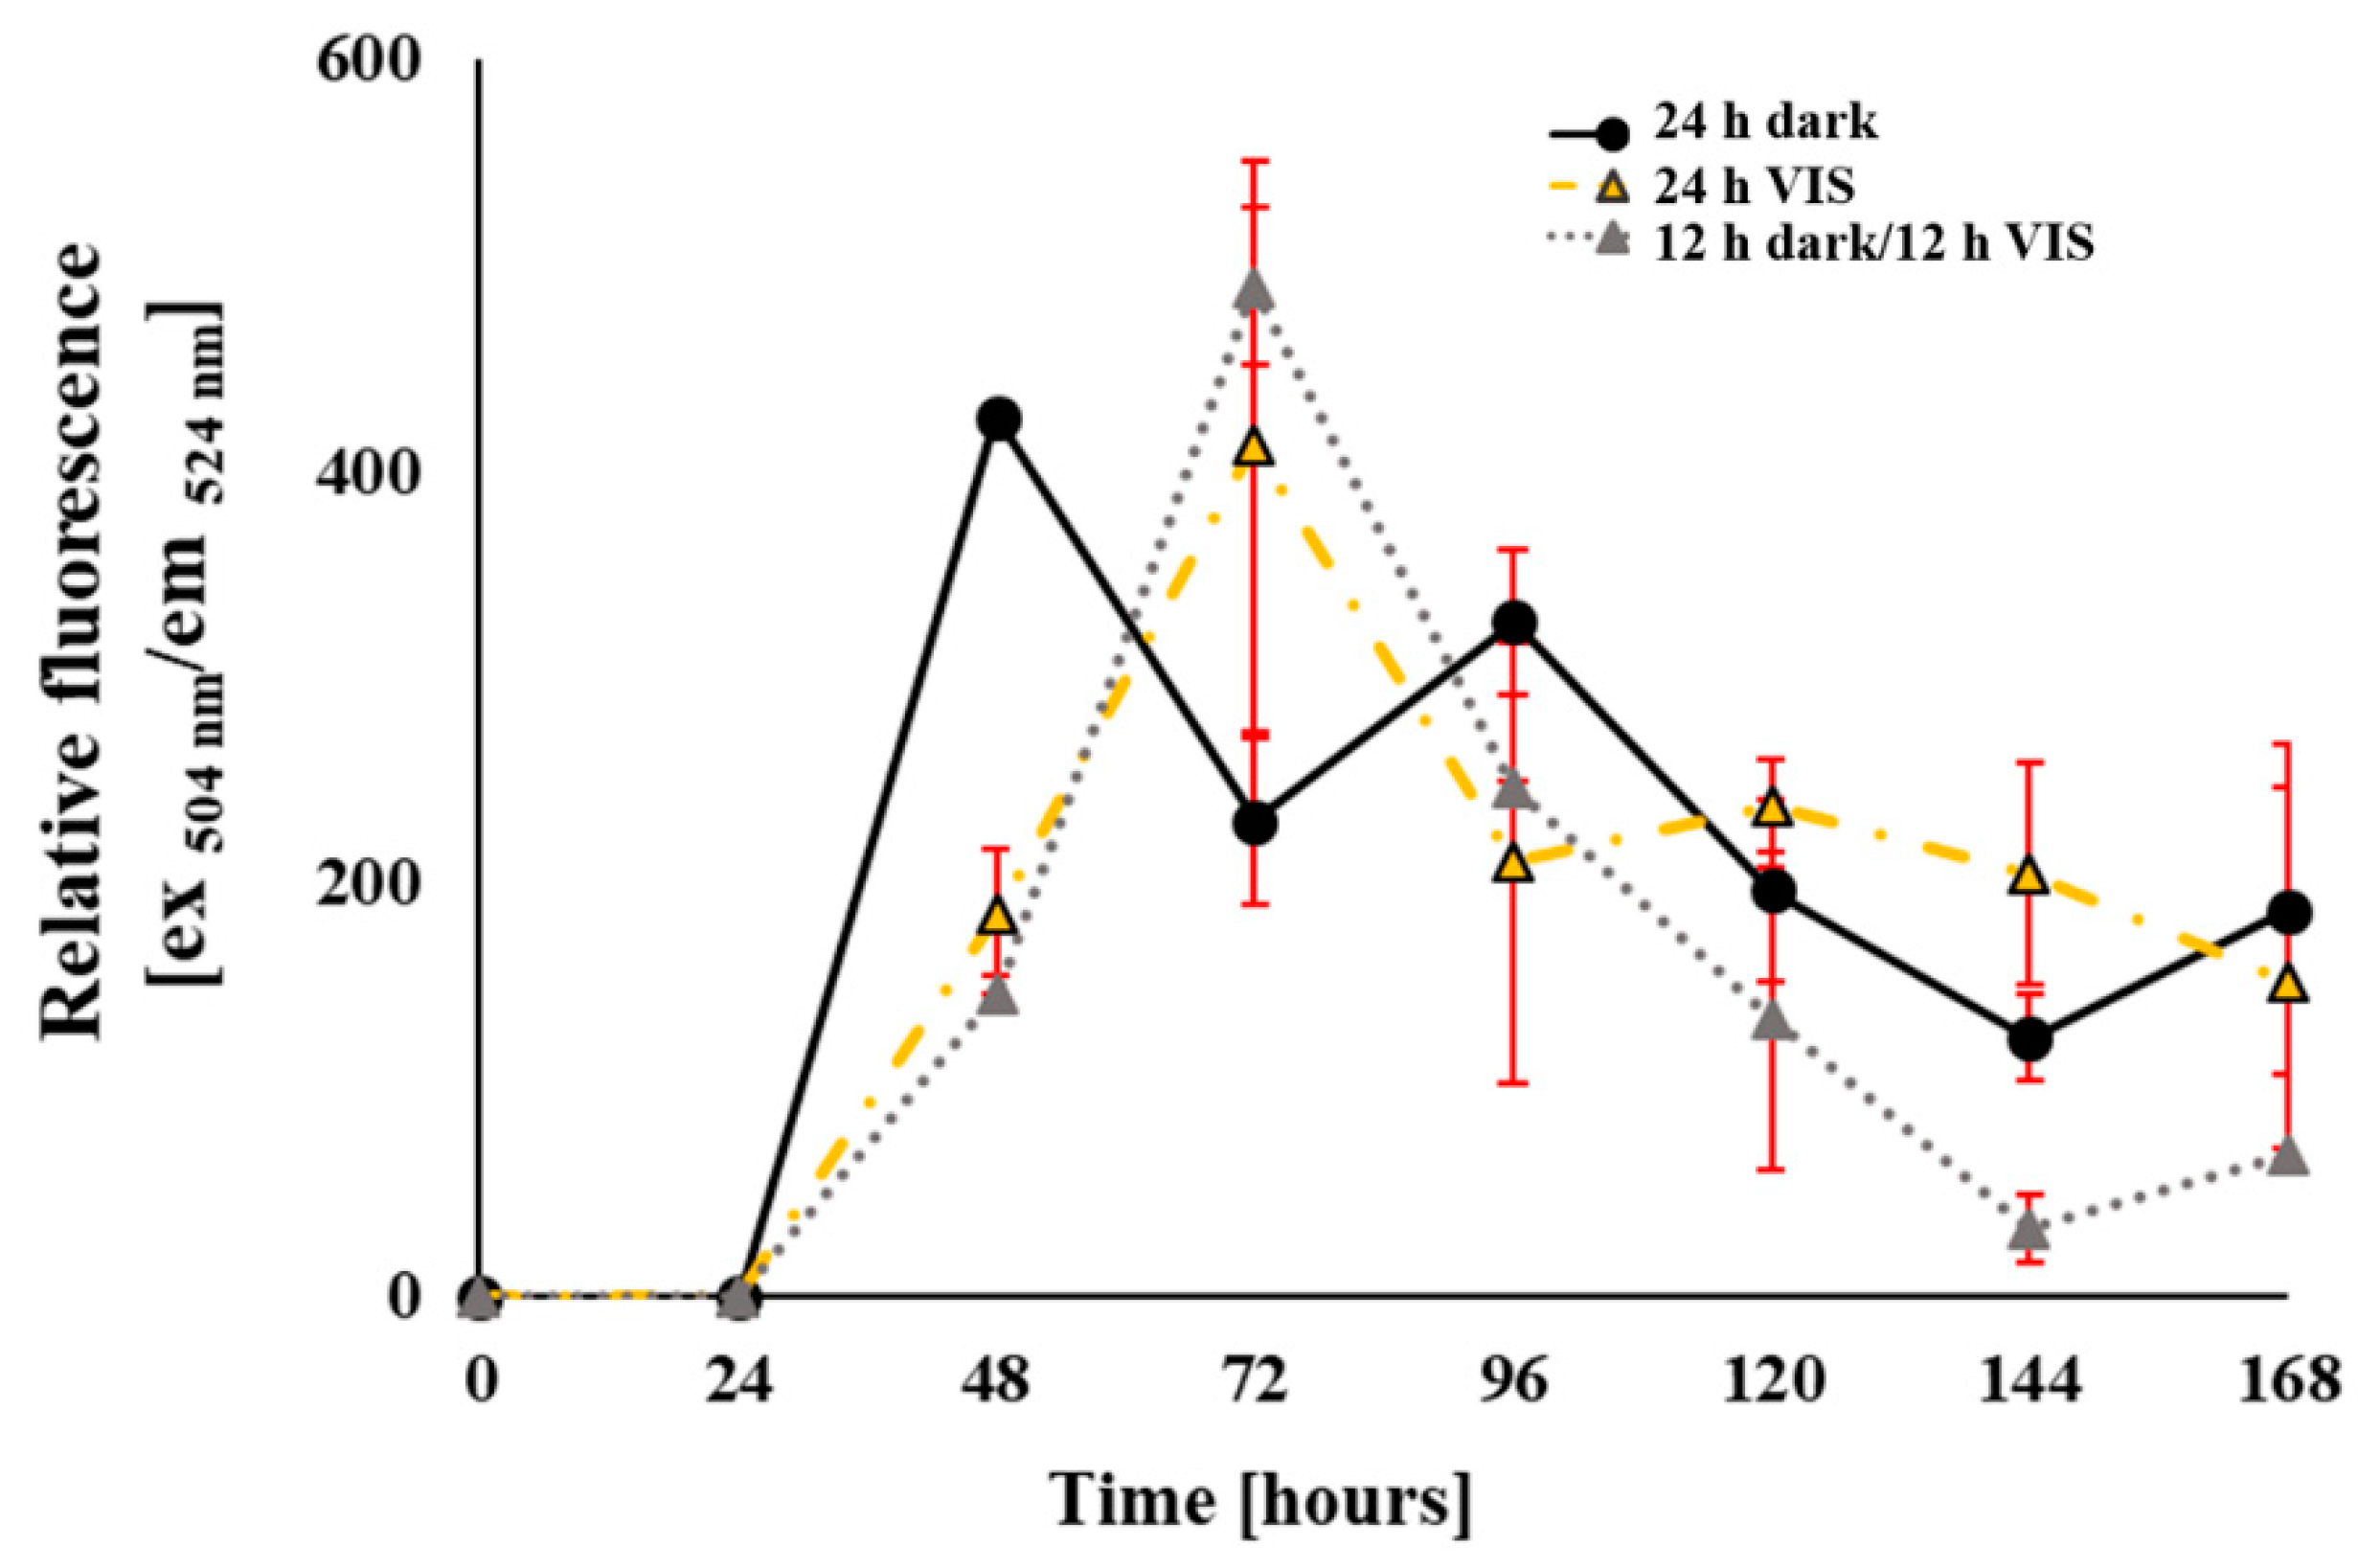
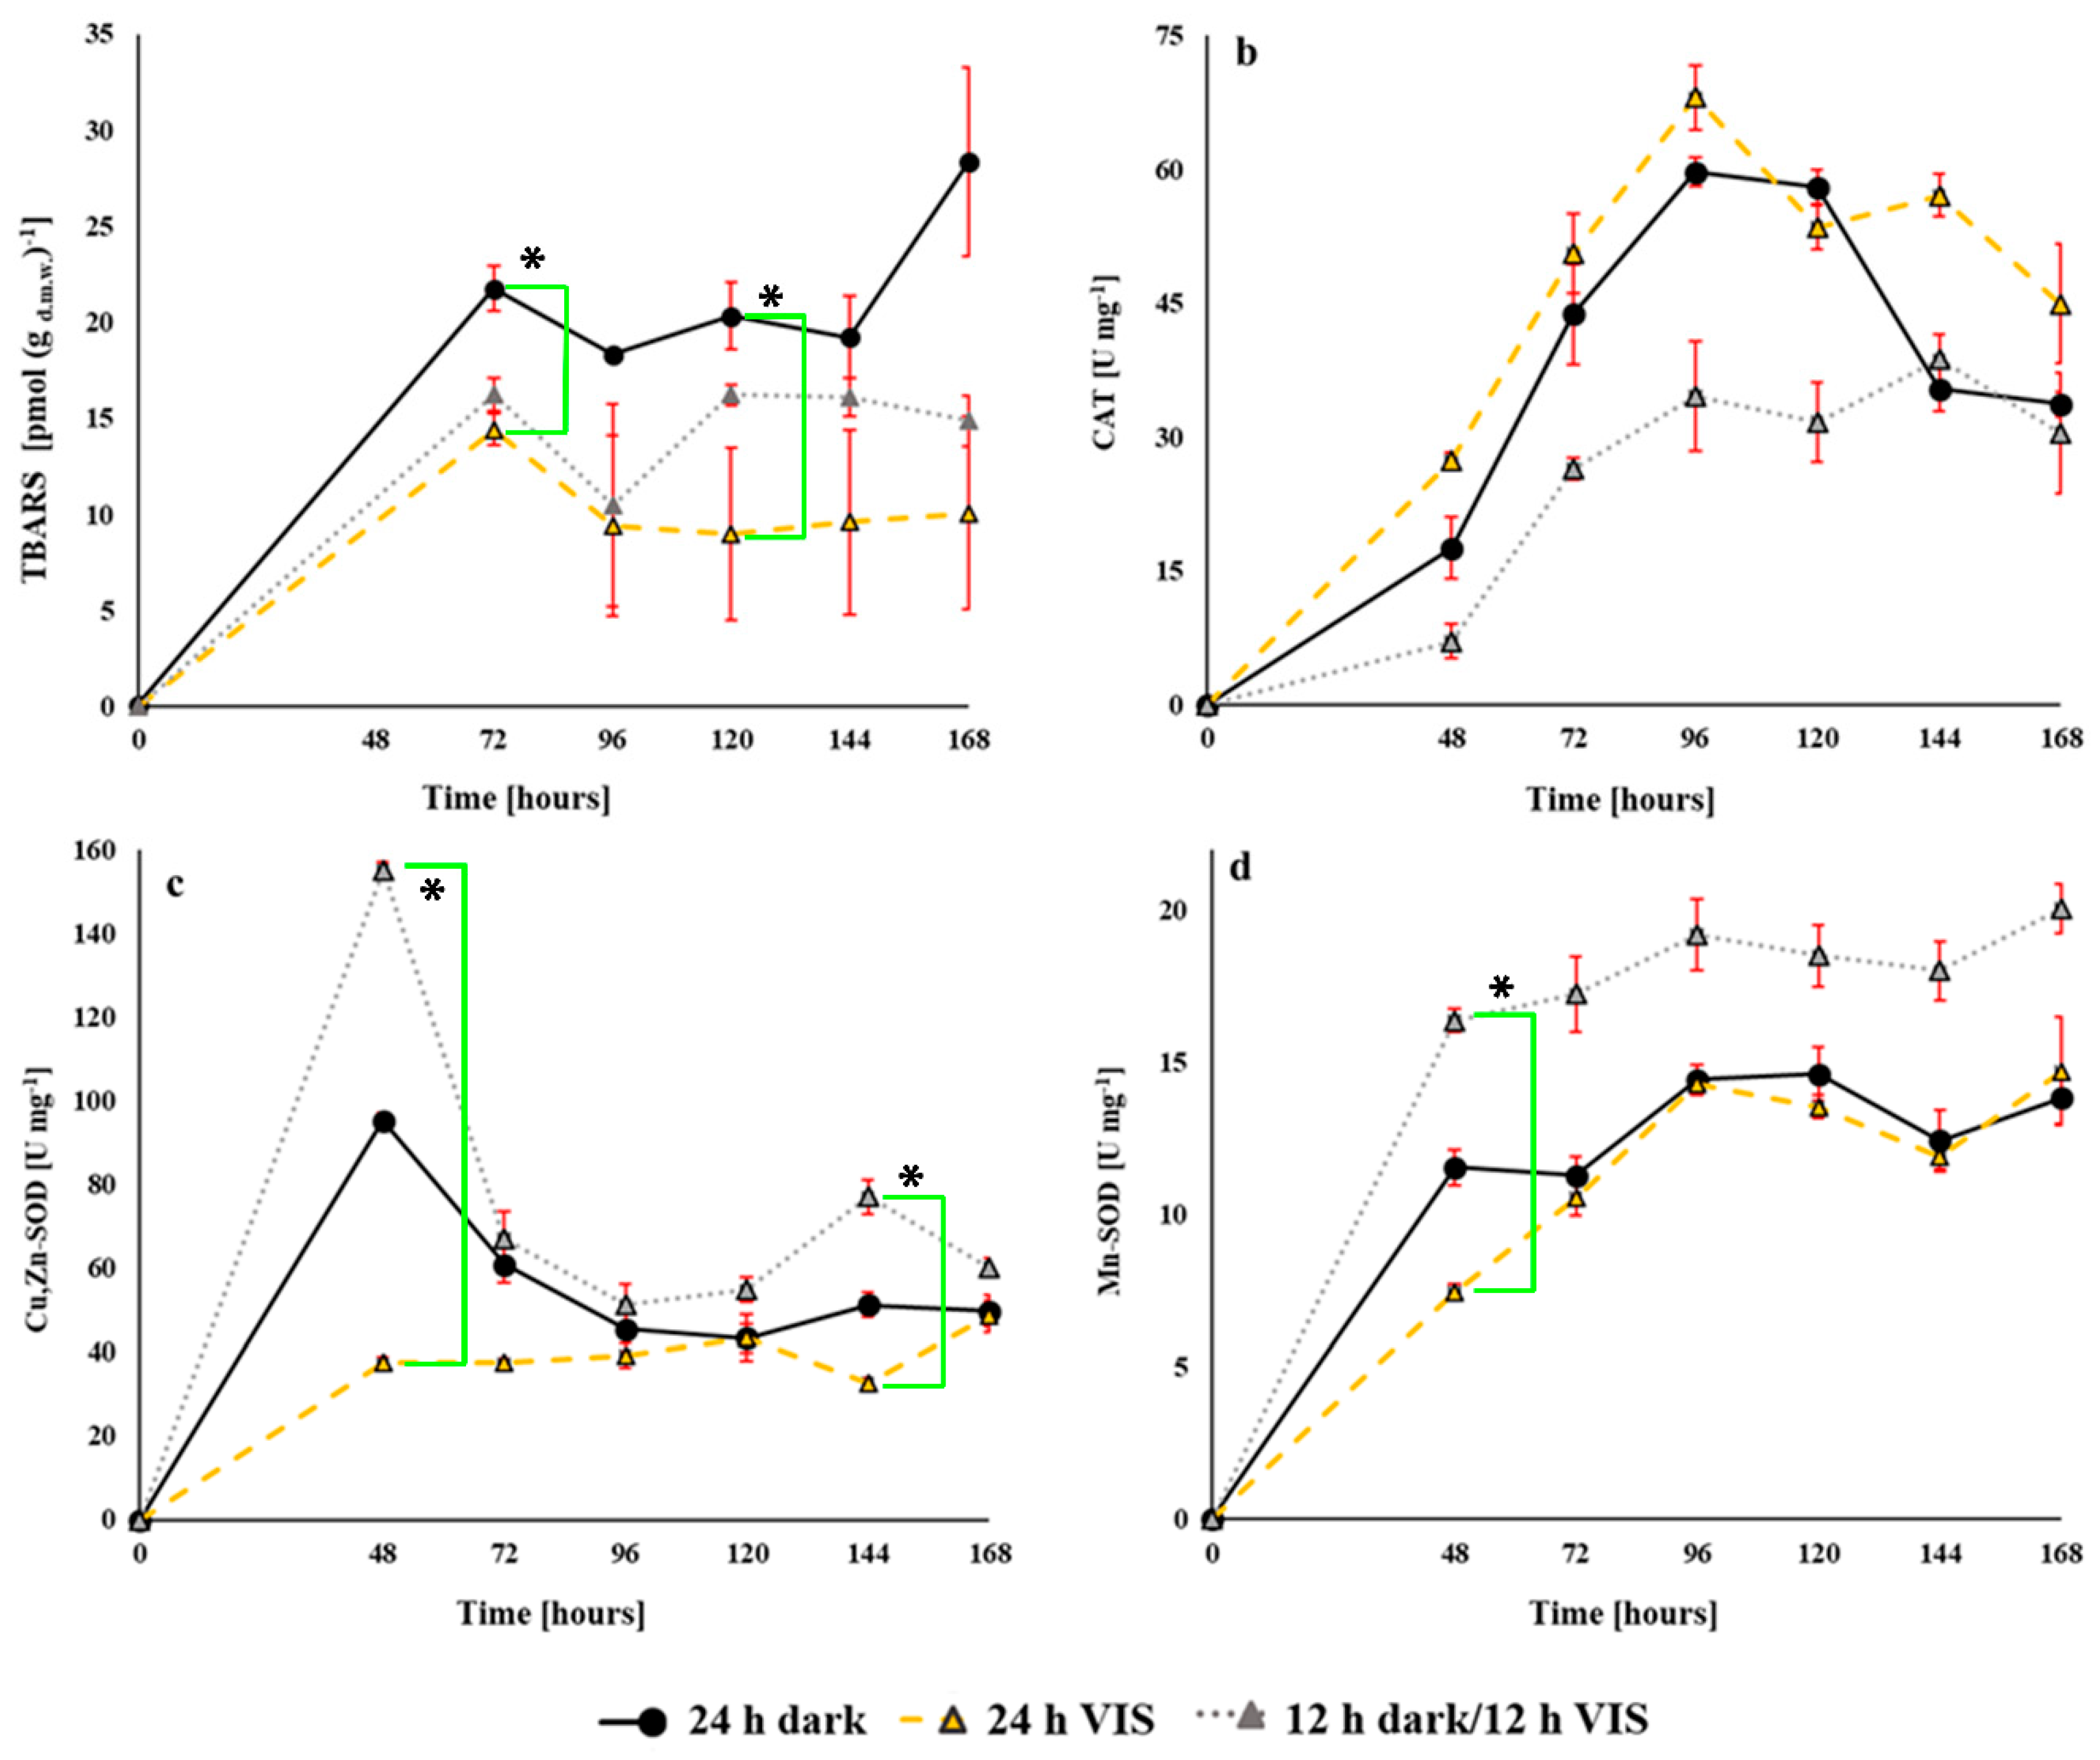
2.3. Modulation of A. flavus Oxidative Status by VIS Light Illumination Period
3. Discussion
4. Materials and Methods
4.1. Chemicals
4.2. Cultivation of A. flavus on Mycological Media and Conidia Count Determination
4.3. Quantitative Analysis of Aflatoxin Concentrations in Culture Filtrates
4.4. Analysis of A. flavus Cell Oxidative Status
4.5. Statistical Analysis
Author Contributions
Funding
Conflicts of Interest
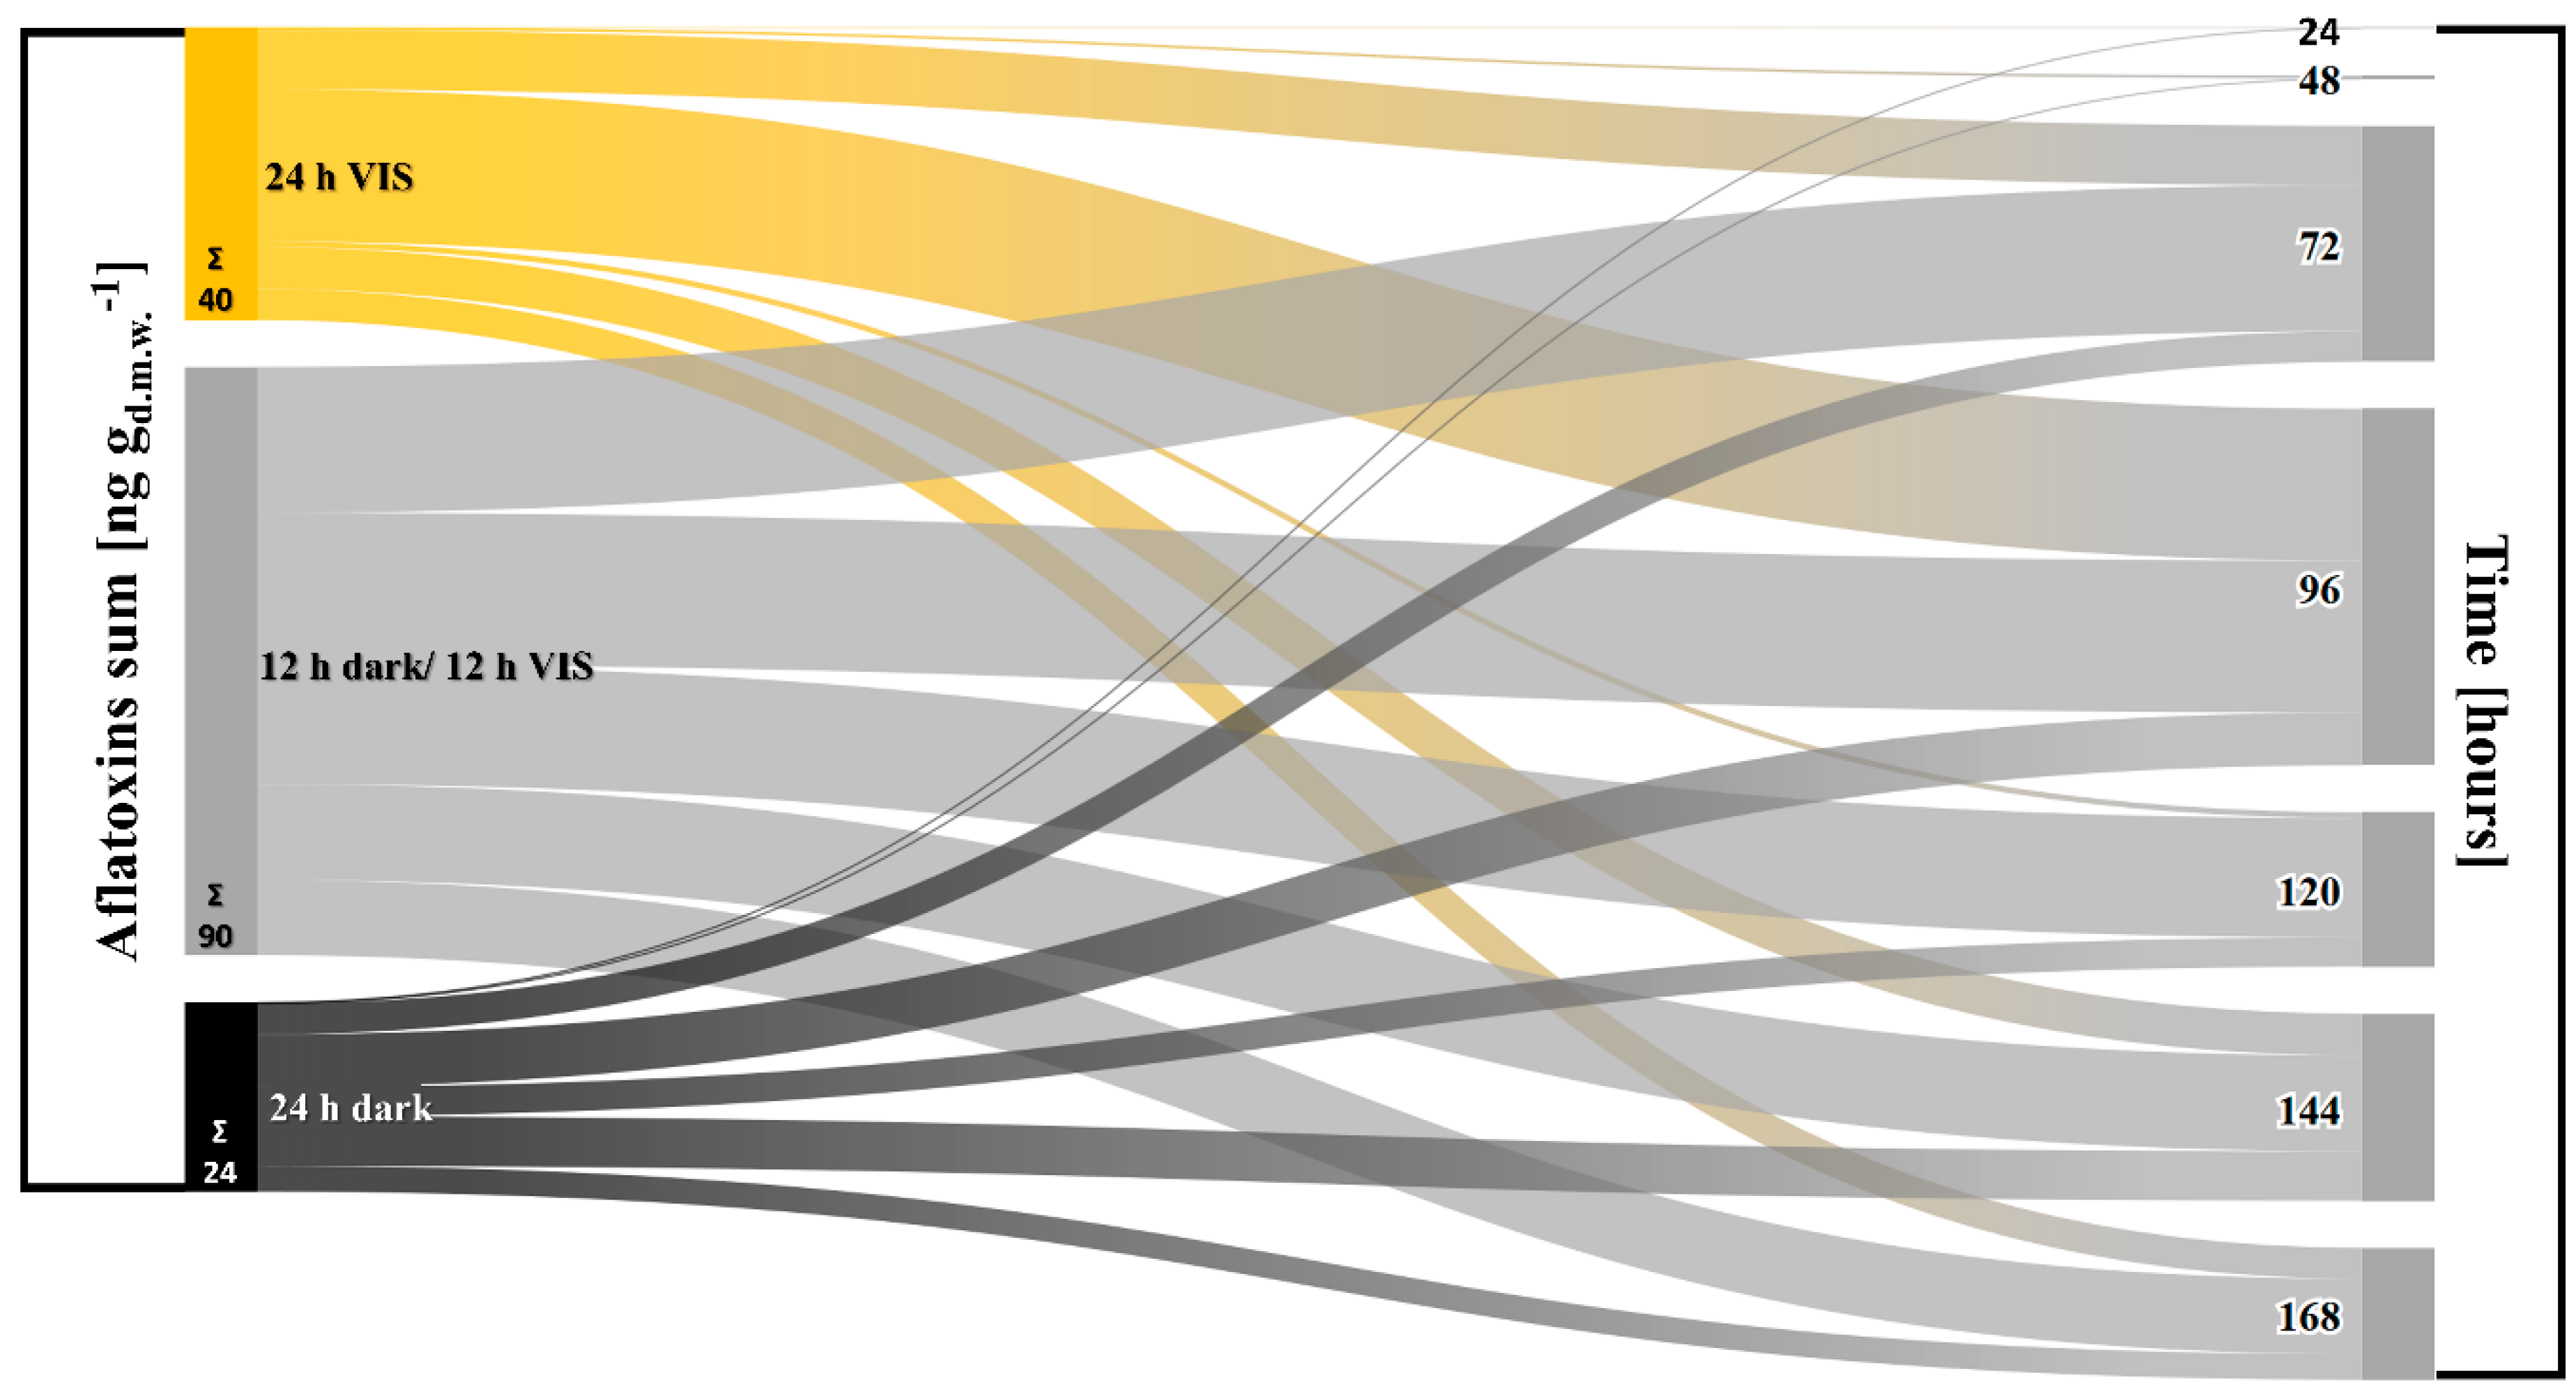
Appendix A. Influence of VIS Illumination Period on Aflatoxins Production by A. flavus
 —12 h dark/12 h VIS,
  —24 h VIS; Σ—sum of produced concentrations of aflatoxin B1 and B2.
—12 h dark/12 h VIS, —24 h VIS; Σ—sum of produced concentrations of aflatoxin B1 and B2.
—24 h VIS; Σ—sum of produced concentrations of aflatoxin B1 and B2.
—12 h dark/12 h VIS, —24 h VIS; Σ—sum of produced concentrations of aflatoxin B1 and B2.
References
- Pinotti, L.; Ottoboni, M.; Giromini, C.; Dell’Orto, V.; Cheli, F. Mycotoxin contamination in the EU feed supply chain: A focus on Cereal Byproducts. Toxins 2016, 8, 45. [Google Scholar] [CrossRef] [PubMed]
- Medina, A.; Akbar, A.; Baazeem, A.; Rodriguez, A.; Magan, N. Climate change, food security and mycotoxins: Do we know enough? Fungal Biol. Rev. 2017, 31, 143–154. [Google Scholar] [CrossRef]
- Bebber, D.P.; Ramotowski, M.A.T.; Gurr, S.J. Crop pests and pathogens move polewards in a warming world. Nat. Clim. Chang. 2013, 3, 985–988. [Google Scholar] [CrossRef]
- Helfer, S. Rust fungi and global change. New Phytol. 2014, 201, 770–780. [Google Scholar] [CrossRef] [PubMed]
- Magan, N.; Aldred, D. Post-harvest control strategies: Minimizing mycotoxins in the food chain. Int. J. Food Microbiol. 2007, 119, 131–139. [Google Scholar] [CrossRef] [PubMed] [Green Version]
- Miraglia, M.; Marvin, H.J.P.; Kleter, G.A.; Battilani, P.; Brera, C.; Coni, E.; Cubadda, F.; Croci, L.; De Santis, B.; Dekkers, S.; et al. Climate change and food safety: An emerging issue with special focus on Europe. Food Chem. Toxicol. 2009, 47, 1009–1021. [Google Scholar] [CrossRef] [PubMed]
- Trnka, M.; Rötter, R.P.; Ruiz-Ramos, M.; Kersebaum, K.C.; Olesen, J.E.; Žalud, Z.; Semenov, M.A. Adverse weather conditions for European wheat production will become more frequent with climate change. Nat. Clim. Chang. 2014, 4, 637–643. [Google Scholar] [CrossRef]
- Righetti, L.; Paglia, G.; Galaverna, G.; Dall’Asta, C. Recent Advances and Future Challenges in Modified Mycotoxin Analysis: Why HRMS Has Become a Key Instrument in Food Contaminant Research. Toxins 2016, 8, 361. [Google Scholar] [CrossRef]
- IARC. IARC Working Group on the Evaluation of Carcinogenic Risks to Humans Chemical agents and related occupations. IARC Monogr. Eval. Carcinog. Risks Hum. 2012, 100, 9–562. [Google Scholar]
- Medina, A.; Gilbert, M.K.; Mack, B.M.; OBrian, G.R.; Rodríguez, A.; Bhatnagar, D.; Payne, G.; Magan, N. Interactions between water activity and temperature on the Aspergillus flavus transcriptome and aflatoxin B 1 production. Int. J. Food Microbiol. 2017, 256, 36–44. [Google Scholar] [CrossRef]
- Medina, A.; Rodriguez, A.; Magan, N. Effect of climate change on Aspergillus flavus and aflatoxin B1 production. Front. Microbiol. 2014, 5, 1–7. [Google Scholar] [CrossRef] [PubMed]
- Medina, Á.; Rodríguez, A.; Magan, N. Climate change and mycotoxigenic fungi: Impacts on mycotoxin production. Curr. Opin. Food Sci. 2015, 5, 99–104. [Google Scholar] [CrossRef]
- Jayashree, T.; Subramanyam, C. Oxidative stress a prerequisite for aflatoxin production by Aspergillus parasiticus. Free Radic. Biol. Med. 2000, 29, 981–985. [Google Scholar] [CrossRef]
- Reverberi, M.; Ricelli, A.; Zjalic, S.; Fabbri, A.A.; Fanelli, C. Natural functions of mycotoxins and control of their biosynthesis in fungi. Appl. Microbiol. Biotechnol. 2010, 87, 899–911. [Google Scholar] [CrossRef] [PubMed]
- Miskei, M.; Karányi, Z.; Pöcsi, I. Annotation of stress-response proteins in the aspergilli. Fungal Genet. Biol. 2009, 46 (Suppl. 1), S105–S120. [Google Scholar] [CrossRef]
- Reverberi, M.; Punelli, M.; Smith, C.A.; Zjalic, S.; Scarpari, M.; Scala, V.; Cardinali, G.; Aspite, N.; Pinzari, F.; Payne, G.A.; et al. How Peroxisomes Affect Aflatoxin Biosynthesis in Aspergillus Flavus. PLoS ONE 2012, 7, 1–15. [Google Scholar] [CrossRef] [PubMed]
- Hong, S.-Y.; Roze, L.; Linz, J. Oxidative Stress-Related Transcription Factors in the Regulation of Secondary Metabolism. Toxins 2013, 5, 683–702. [Google Scholar] [CrossRef] [PubMed] [Green Version]
- Narasaiah, K.V.; Sashidhar, R.B.; Subramanyam, C. Biochemical analysis of oxidative stress in the production of aflatoxin and its precursor intermediates. Mycopathologia 2006, 162, 179–189. [Google Scholar] [CrossRef] [PubMed]
- Battilani, P.; Toscano, P.; Van Der Fels-Klerx, H.J.; Moretti, A.; Leggieri, M.C.; Brera, C. Aflatoxin B 1 contamination in maize in Europe increases due to climate change. Sci. Rep. 2016, 6, 24328. [Google Scholar] [CrossRef]
- RASFF 2017 Report. The Rapid Alert System for Food and Feed. Annual Report 2014; European Commission: Luxembourg, 2017; ISBN 978-92-79-80317-8.
- Bandyopadhyay, R.; Ortega-Beltran, A.; Akande, A.; Mutegi, C.; Atehnkeng, J.; Kaptoge, L.; Senghor, A.L.; Adhikari, B.N.; Cotty, P.J. Biological control of aflatoxins in Africa: Current status and potential challenges in the face of climate change. World Mycotoxin J. 2016, 9, 771–789. [Google Scholar] [CrossRef]
- Hricovíni, M.; Mazúr, M.; Sîrbu, A.; Palamarciuc, O.; Arion, V.B.; Brezová, V. Copper(II) thiosemicarbazone complexes and their proligands upon uva irradiation: An epr and spectrophotometric steady-state study. Molecules 2018, 23, 721. [Google Scholar] [CrossRef] [PubMed]
- Cary, J.W.; Harris-Coward, P.; Scharfenstein, L.; Mack, B.M.; Chang, P.K.; Wei, Q.; Lebar, M.; Carter-Wientjes, C.; Majumdar, R.; Mitra, C.; et al. The Aspergillus flavus homeobox gene, hbx1, is required for development and aflatoxin production. Toxins 2017, 9, 315. [Google Scholar] [CrossRef] [PubMed]
- Calvo, A.M.; Cary, J.W. Association of fungal secondary metabolism and sclerotial biology. Front. Microbiol. 2015, 6, 1–16. [Google Scholar] [CrossRef] [PubMed]
- Suzuki, T. Light-irradiation wavelength and intensity changes influence aflatoxin synthesis in fungi. Toxins 2018, 10, 31. [Google Scholar] [CrossRef] [PubMed]
- Samarajeewa, U.; Sen, A.C.; Cohen, M.D.; Wei, C.I. Detoxification of Aflatoxins in Foods and Feeds by Physical and Chemical Methods 1. J. Food Prot. 1990, 53, 489–501. [Google Scholar] [CrossRef]
- Reverberi, M.; Fabbri, A.A.; Zjalic, S.; Ricelli, A.; Punelli, F.; Fanelli, C. Antioxidant enzymes stimulation in Aspergillus parasiticus by Lentinula edodes inhibits aflatoxin production. Appl. Microbiol. Biotechnol. 2005, 69, 207–215. [Google Scholar] [CrossRef] [PubMed]
- Reverberi, M.; Zjalic, S.; Ricelli, A.; Punelli, F.; Camera, E.; Fabbri, C.; Picardo, M.; Fanelli, C.; Fabbri, A.A. Modulation of Antioxidant Defense in Aspergillus parasiticus Is Involved in Aflatoxin Biosynthesis: A Role for the ApyapA Gene. Eukaryot. Cell 2008, 7, 988–1000. [Google Scholar] [CrossRef] [PubMed]
- Hedayati, M.T.; Pasqualotto, A.C.; Warn, P.A.; Bowyer, P.; Denning, D.W. Aspergillus flavus: Human pathogen, allergen and mycotoxin producer. Microbiology 2007, 153, 1677–1692. [Google Scholar] [CrossRef]
- Klich, M.A. Aspergillus Flavus: The major producer of aflatoxin. Mol. Plant Pathol. 2007, 8, 713–722. [Google Scholar] [CrossRef]
- Amaike, S.; Keller, N.P. Aspergillus flavus. Annu. Rev. Phytopathol. 2011, 49, 107–133. [Google Scholar] [CrossRef]
- Yu, J. Current understanding on aflatoxin biosynthesis and future perspective in reducing aflatoxin contamination. Toxins 2012, 4, 1024–1057. [Google Scholar] [CrossRef] [PubMed]
- Ostry, V.; Toman, J.; Grosse, Y.; Malir, F. Cyclopiazonic acid: 50th anniversary of its discovery. World Mycotoxin J. 2018, 11, 1–14. [Google Scholar] [CrossRef]
- Frisvad, J.C.; Hubka, V.; Ezekiel, C.N.; Hong, S.B.; Nováková, A.; Chen, A.J.; Arzanlou, M.; Larsen, T.O.; Sklenář, F.; Mahakarnchanakul, W.; et al. Taxonomy of Aspergillus section Flavi and their production of aflatoxins, ochratoxins and other mycotoxins. Stud. Mycol. 2019, 93, 1–63. [Google Scholar] [CrossRef]
- Bok, J.W.; Keller, N.P. LaeA, a Regulator of Secondary Metabolism in Aspergillus spp. Eukaryot. Cell 2004, 3, 527–535. [Google Scholar] [CrossRef] [PubMed]
- Lind, A.L.; Smith, T.D.; Saterlee, T.; Calvo, A.M.; Rokas, A. Regulation of Secondary Metabolism by the Velvet Complex is Temperature-Responsive in Aspergillus. Genes Genomes Genet. 2016, 6, 4023–4033. [Google Scholar] [CrossRef] [PubMed]
- Yin, W.; Keller, N.P. Transcriptional Regulatory Elements in Fungal Secondary Metabolism. J. Microbiol. 2011, 49, 329–339. [Google Scholar] [CrossRef] [PubMed]
- Bayram, Ö.; Braus, G.H. Coordination of secondary metabolism and development in fungi: The velvet family of regulatory proteins. FEMS Microbiol. Rev. 2012, 36, 1–24. [Google Scholar] [CrossRef]
- Joffe, A.Z.; Lisker, N. Effects of Light, Temperature, and pH Value Aflatoxin Production in vitro. Appl. Microbiol. 1969, 18, 517–519. [Google Scholar]
- Aziz, N.H.; Moussa, L.A. Influence of white light, near-UV irradiation and other environmental conditions on production of aflatoxin B1 by Aspergillus flavus and ochratoxin A by Aspergillus ochraceus. Nahrung 1997, 41, 150–154. [Google Scholar] [CrossRef]
- Roze, L.V.; Chanda, A.; Linz, J.E. Compartmentalization and molecular traffic in secondary metabolism: A new understanding of established cellular processes. Fungal Genet. Biol. 2011, 48, 35–48. [Google Scholar] [CrossRef] [Green Version]
- Eom, T.J.; Moon, H.; Yu, J.H.; Park, H.S. Characterization of the velvet regulators in Aspergillus flavus. Mol. Microbiol. 2018, 56, 1–9. [Google Scholar] [CrossRef] [PubMed]
- Baidya, S.; Duran, R.M.; Lohmar, J.M.; Harris-Coward, P.Y.; Cary, J.W.; Hong, S.Y.; Roze, L.V.; Linz, J.E.; Calvo, A.M. VeA is associated with the response to oxidative stress in the aflatoxin producer Aspergillus flavus. Eukaryot. Cell 2014, 13, 1095–1103. [Google Scholar] [CrossRef] [PubMed]
- Chang, P.K.; Scharfenstein, L.L.; Mack, B.; Ehrlich, K.C. Deletion of the Aspergillus flavus orthologue of A. Nidulans fluG reduces conidiation and promotes production of sclerotia but does not abolish aflatoxin biosynthesis. Appl. Environ. Microbiol. 2012, 78, 7557–7563. [Google Scholar] [CrossRef] [PubMed]
- Kovač, T.; Kovač, M.; Strelec, I.; Nevistić, A.; Molnar, M. Antifungal and antiaflatoxigenic activities of coumarinyl thiosemicarbazides against Aspergillus flavus NRRL 3251. Arch. Ind. Hyg. Toksikol. 2017, 68, 9–15. [Google Scholar] [CrossRef] [PubMed]
- Kovač, T.; Šarkanj, B.; Klapec, T.; Borišev, I.; Kovač, M.; Nevistić, A.; Strelec, I. Fullerol C60(OH)24 nanoparticles and mycotoxigenic fungi: A preliminary investigation into modulation of mycotoxin production. Environ. Sci. Pollut. Res. 2017, 24, 16673–16681. [Google Scholar] [CrossRef] [PubMed]
- Kovač, T.; Šarkanj, B.; Klapec, T.; Borišev, I.; Kovač, M.; Nevistić, A.; Strelec, I. Antiaflatoxigenic effect of fullerene C60 nanoparticles at environmentally plausible concentrations. AMB Express 2018, 8. [Google Scholar] [CrossRef] [PubMed]
- Kovač, T.; Borišev, I.; Crevar, B.; Čačić Kenjerić, F.; Kovač, M.; Strelec, I.; Ezekiel, C.N.; Sulyok, M.; Krska, R.; Šarkanj, B. Fullerol C60(OH)24 nanoparticles modulate aflatoxin B1 biosynthesis in Aspergillus flavus. Sci. Rep. 2018, 8, 12855. [Google Scholar] [CrossRef] [PubMed]
- Chang, P.K.; Scharfenstein, L.L.; Li, P.; Ehrlich, K.C. Aspergillus flavus VelB acts distinctly from VeA in conidiation and may coordinate with FluG to modulate sclerotial production. Fungal Genet. Biol. 2013, 58–59, 71–79. [Google Scholar] [CrossRef] [PubMed]
- Davidson, J.F.; Whyte, B.; Bissinger, P.H.; Schiestl, R.H. Oxidative stress is involved in heat-induced cell death in Saccharomyces cerevisiae. Proc. Natl. Acad. Sci. USA 1996, 93, 5116–5121. [Google Scholar] [CrossRef] [PubMed]
- Lushchak, V.I.; Gospodaryov, D.V. Catalases protect cellular proteins from oxidative modification in Saccharomyces cerevisiae. Cell Biol. Int. 2005, 29, 187–192. [Google Scholar] [CrossRef] [PubMed]
- Angelova, M.B.; Pashova, S.B.; Spasova, B.K.; Vassilev, S.V.; Slokoska, L.S. Oxidative stress response of filamentous fungi induced by hydrogen peroxide and paraquat. Mycol. Res. 2005, 109, 150–158. [Google Scholar] [CrossRef] [PubMed]
- Bradford, M.M. A rapid and sensitive method for the quantitation of microgram quantities of protein utilizing the principle of protein-dye binding. Anal. Biochem. 1976, 72, 248–254. [Google Scholar] [CrossRef]


© 2018 by the authors. Licensee MDPI, Basel, Switzerland. This article is an open access article distributed under the terms and conditions of the Creative Commons Attribution (CC BY) license (http://creativecommons.org/licenses/by/4.0/).
Share and Cite
Kovač, T.; Šarkanj, B.; Crevar, B.; Kovač, M.; Lončarić, A.; Strelec, I.; Ezekiel, C.N.; Sulyok, M.; Krska, R. Aspergillus flavus NRRL 3251 Growth, Oxidative Status, and Aflatoxins Production Ability In Vitro under Different Illumination Regimes. Toxins 2018, 10, 528. https://0-doi-org.brum.beds.ac.uk/10.3390/toxins10120528
Kovač T, Šarkanj B, Crevar B, Kovač M, Lončarić A, Strelec I, Ezekiel CN, Sulyok M, Krska R. Aspergillus flavus NRRL 3251 Growth, Oxidative Status, and Aflatoxins Production Ability In Vitro under Different Illumination Regimes. Toxins. 2018; 10(12):528. https://0-doi-org.brum.beds.ac.uk/10.3390/toxins10120528
Chicago/Turabian StyleKovač, Tihomir, Bojan Šarkanj, Biljana Crevar, Marija Kovač, Ante Lončarić, Ivica Strelec, Chibundu N. Ezekiel, Michael Sulyok, and Rudolf Krska. 2018. "Aspergillus flavus NRRL 3251 Growth, Oxidative Status, and Aflatoxins Production Ability In Vitro under Different Illumination Regimes" Toxins 10, no. 12: 528. https://0-doi-org.brum.beds.ac.uk/10.3390/toxins10120528