Occurrence and Levels of Aflatoxins in Fish Feeds and Their Potential Effects on Fish in Nyeri, Kenya

 , ,
, ,
Abstract
:
1. Introduction
2. Results
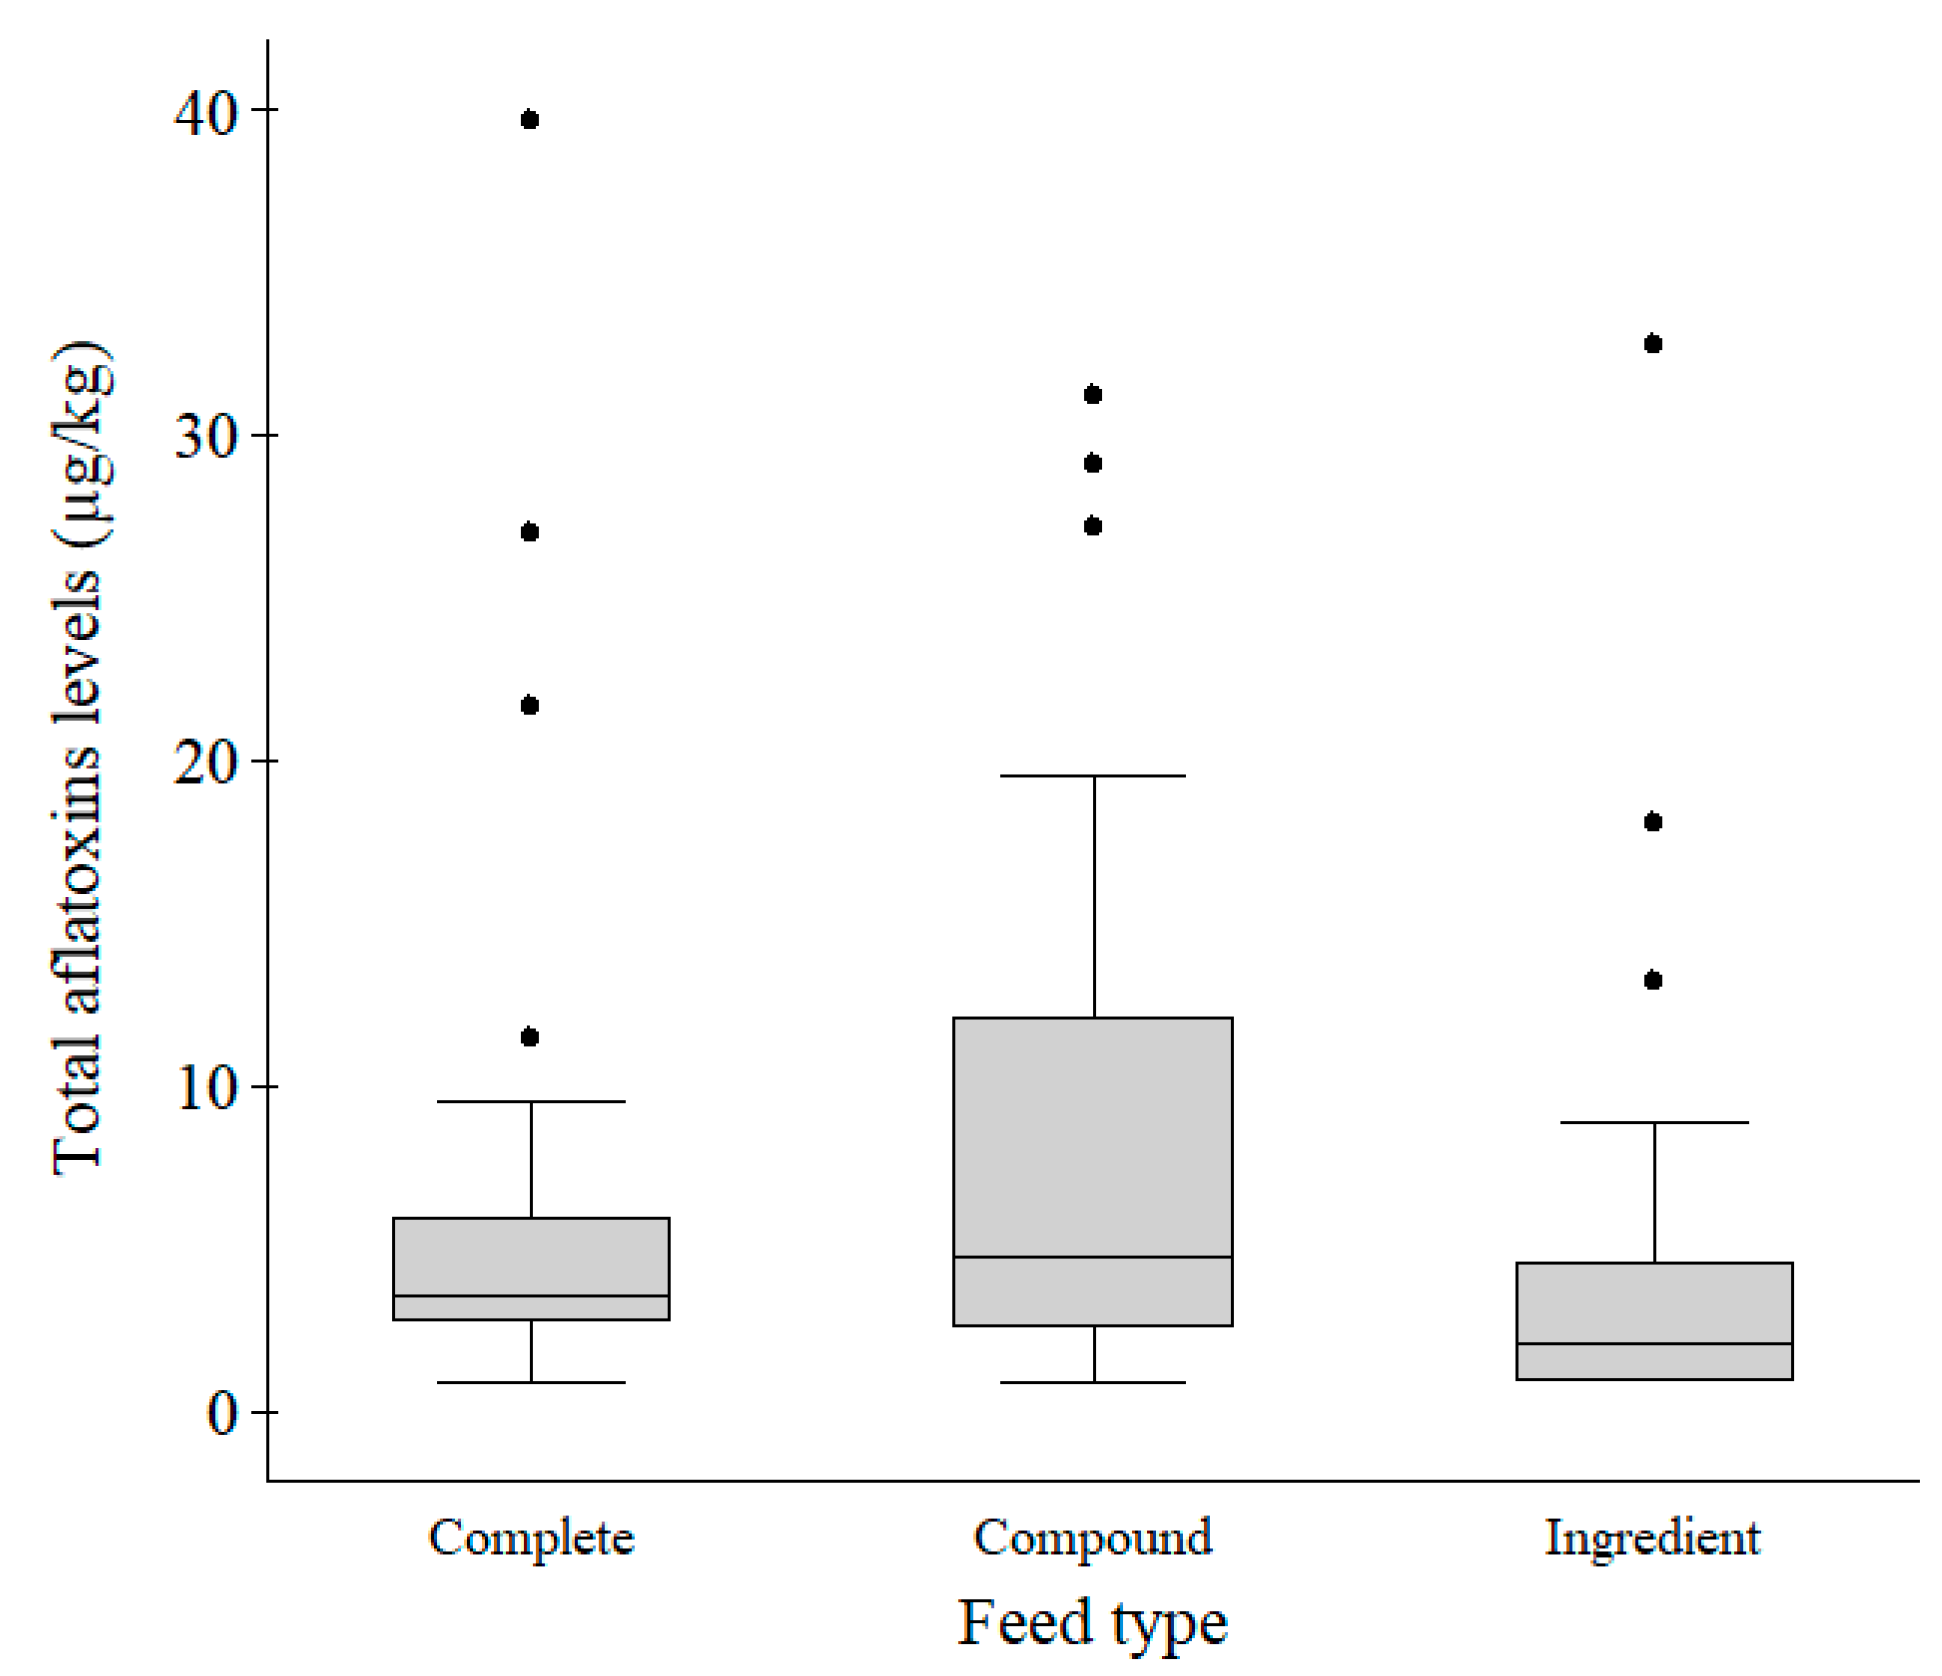
2.1. Fish Feed Analysis
2.2. Fish Health Problems Reported
2.3. Fish Examination
3. Discussion
4. Conclusions
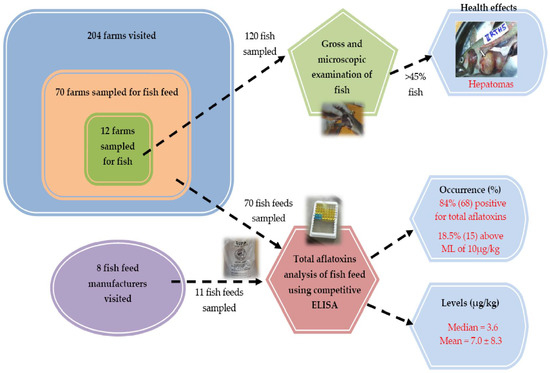
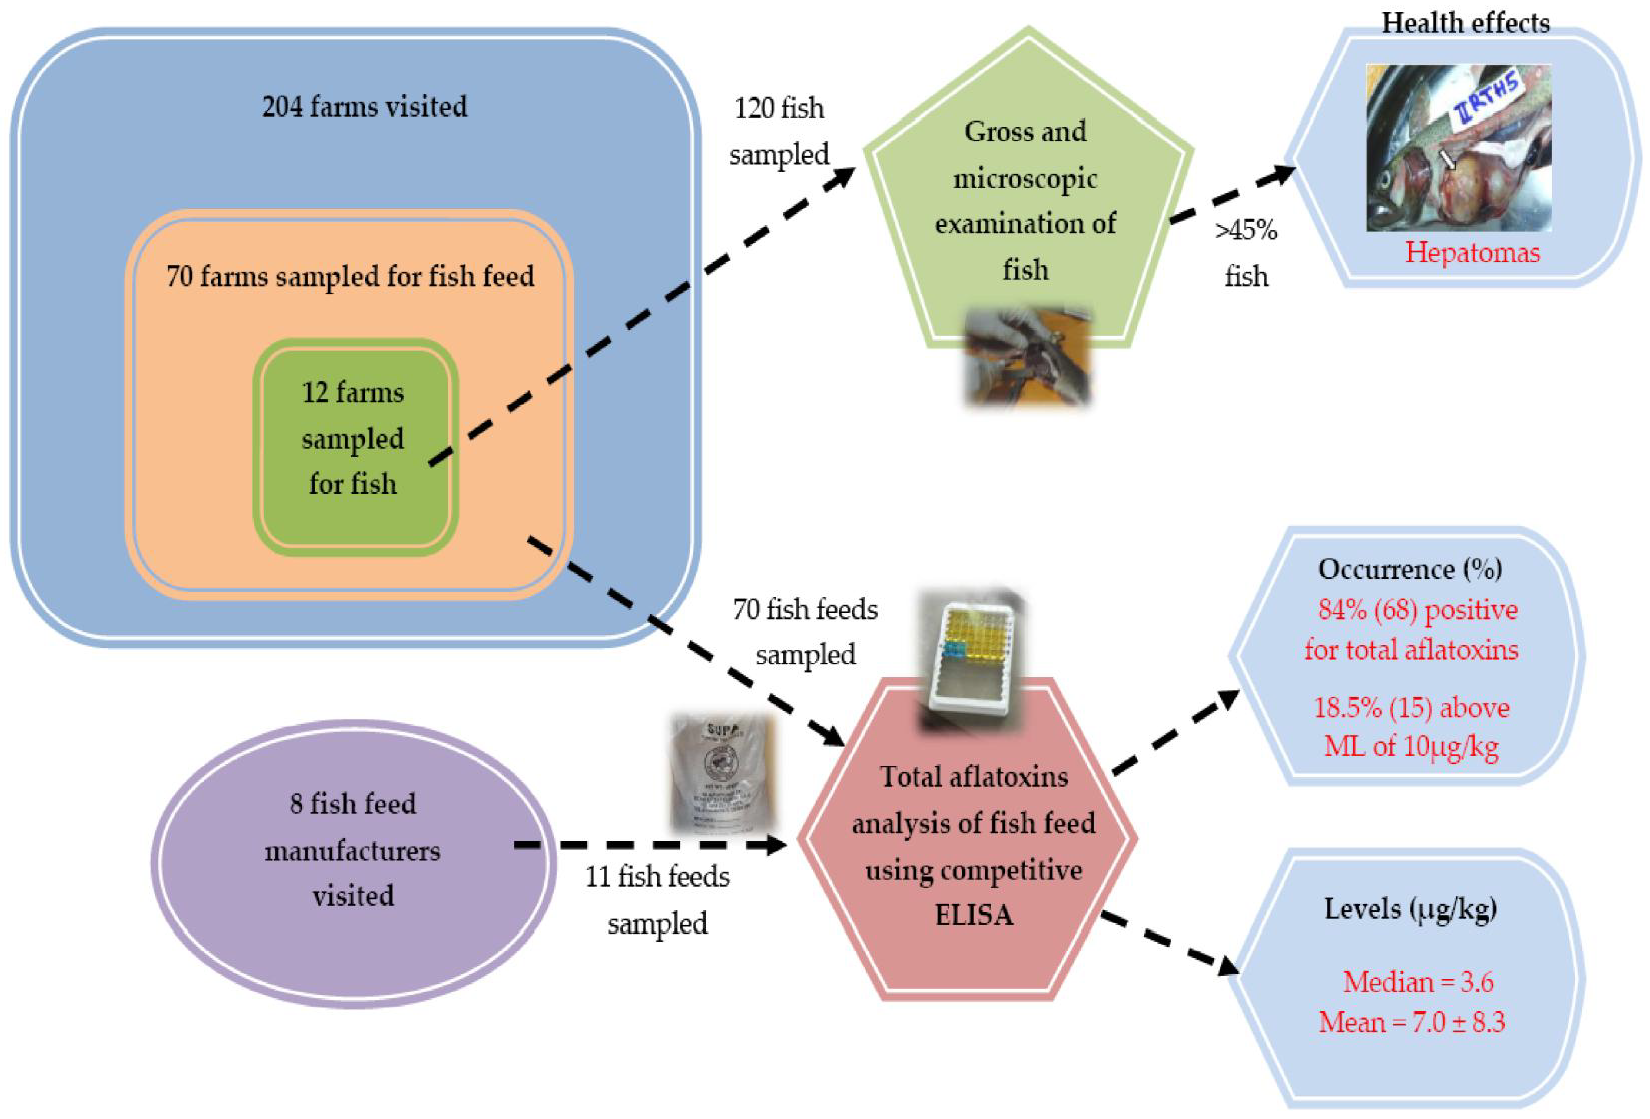
5. Materials and Methods
5.1. Study Area
5.2. Feed Sample Collection
5.3. Feed Sample Preparation and Testing
5.4. Fish Sample Collection and Examination
5.5. Data Analysis
Author Contributions
Funding
Acknowledgments
Conflicts of Interest
References
- Mwamuye, M.K.; Cherutich, B.K.; Nyamu, H.M. Performance of commercial aquaculture under the economic stimulus program in Kenya. Int. J. Bus. Commer. 2012, 2, 1–20. [Google Scholar]
- Maina, A.W.; Wagacha, J.M.; Mwaura, F.B.; Muthomi, J.W.; Woloshuk, C.P. Postharvest practices of maize farmers in Kaiti district, Kenya and the impact of hermetic storage on populations of Aspergillus spp. and aflatoxin contamination. J. Food Res. 2016, 5, 53. [Google Scholar] [CrossRef]
- Munguti, J.M.; Kim, J.; Ogello, E.O. An Overview of Kenyan Aquaculture: Current Status, Challenges, and Opportunities for Future Development. Fish. Aquat. Sci. 2014, 17, 1–11. [Google Scholar] [CrossRef]
- Breuli, C.; Grima, D. Kenya’s Baseline Report for SmartFish Program of the Indian Ocean Commision; Food and Agriculture Organization: Ebene, Mauritius, 2014. [Google Scholar]
- Food and Agriculture Organization National Aquaculture Sector Overview—Kenya. Available online: http://www.fao.org/fishery/countrysector/naso_kenya/en#tcN700B0 (accessed on 26 September 2017).
- Nyandat, B. Analysis of Feeds and Fertilizers for Sustainable Aquaculture Development in Kenya. In Study and Analysis of Feeds and Fertilizers for Sustainable Aquaculture Development; Hasan, M.R., Hecht, T., Silva, S.S., De Tacon, A.G.J., Eds.; Food and Agriculture Organization: Rome, Italy, 2007; pp. 423–436. ISBN 9789251058626. [Google Scholar]
- Wong, M.H.; Mo, W.Y.; Choi, W.M.; Cheng, Z.; Man, Y.B. Recycle food wastes into high quality fish feeds for safe and quality fish production. Environ. Pollut. 2016, 219, 631–638. [Google Scholar] [CrossRef] [PubMed]
- Tangendjaja, B. Quality control of feed ingredients for aquaculture. In Feed and Feeding Practices in Aquaculture; Elsevier: Amsterdam, The Netherlands, 2015; pp. 141–169. ISBN 9780081005064. [Google Scholar]
- Cagauan, A.G.; Tayaban, R.H.; Somga, J.R.; Bartolome, R.M. Effect of aflatoxin-contaminated feeds in Nile tilapia (Oreochromis niloticus L.). In Proceedings of the Sixth International Symposium on Tilapia in Aquaculture, Manila, Philippines, 12–16 September 2004; pp. 172–178. [Google Scholar]
- Khlangwiset, P.; Shephard, G.S.; Wu, F. Aflatoxins and growth impairment: A review. Crit. Rev. Toxicol. 2011, 41, 740–755. [Google Scholar] [CrossRef]
- Rajarajan, P.N.; Rajasekaran, K.M.; Asha Devi, N.K. Aflatoxin contamination in agricultural commodities. Indian J. Pharm. Biol. Res. 2013, 1, 148–151. [Google Scholar] [CrossRef]
- Bennett, J.W.; Klich, M. Mycotoxins. Clin. Microbiol. Rev. 2003, 16, 497–516. [Google Scholar] [CrossRef] [PubMed] [Green Version]
- Williams, J.H.; Phillips, T.D.; Jolly, P.E.; Stiles, J.K.; Jolly, C.M.; Aggarwal, D. Human aflatoxin in developing countries: A review of toxicology, exposure, potential health consequences, and interventions. Am. J. Clin. Nutr. 2004, 80, 1106–1122. [Google Scholar] [CrossRef]
- Thompson, C.; Henke, S.E. Effect of climate and type of storage container on aflatoxin production in corn and its associated risks to wildlife species. J. Wildl. Dis. 2000, 36, 172–179. [Google Scholar] [CrossRef]
- Mahfouz, M.E.; Sherif, A.H. A multiparameter investigation into adverse effects of aflatoxin on Oreochromis niloticus health status. J. Basic Appl. Zool. 2015, 71, 48–59. [Google Scholar] [CrossRef]
- Agag, B.I. Mycotoxins in foods and feeds: 1. Aflatoxins. Assiut Univ. Bull. Environ. Res. 2004, 7, 173–206. [Google Scholar]
- Fallah, A.A.; Pirali-Kheirabadi, E.; Rahnama, M.; Saei-Dehkordi, S.S.; Pirali-Kheirabadi, K. Mycoflora, aflatoxigenic strains of Aspergillus section Flavi and aflatoxins in fish feed. Qual. Assur. Saf. Crop. Foods 2014, 6, 419–424. [Google Scholar] [CrossRef]
- Barbosa, T.S.; Pereyra, C.M.; Soleiro, C.A.; Dias, E.O.; Oliveira, A.A.; Keller, K.M.; Silva, P.P.O.; Cavaglieri, L.R.; Rosa, C.A.R. Mycobiota and mycotoxins present in finished fish feeds from farms in the Rio de Janeiro State, Brazil. Int. Aquat. Res. 2013, 5, 3. [Google Scholar] [CrossRef] [Green Version]
- Rodríguez-Cervantes, C.H.; Ramos, A.J.; Robledo-Marenco, M.L.; Sanchis, V.; Marín, S.; Girón-Pérez, M.I. Determination of aflatoxin and fumonisin levels through ELISA and HPLC, on tilapia feed in Nayarit, Mexico. Food Agric. Immunol. 2013, 24, 269–278. [Google Scholar] [CrossRef]
- Dutta, T.K.; Das, P. Isolation of aflatoxigenic strains of Aspergillus and detection of aflatoxin B1 from feeds in India. Mycopathologia 2001, 151, 29–33. [Google Scholar] [CrossRef] [PubMed]
- Marijani, E.; Wainaina, J.M.; Charo-Karisa, H.; Nzayisenga, L.; Munguti, J.; Gnonlonfin, G.J.B.; Kigadye, E.; Okoth, S. Mycoflora and mycotoxins in finished fish feed and feed ingredients from smallholder farms in East Africa. Egypt. J. Aquat. Res. 2017, 43, 169–176. [Google Scholar] [CrossRef]
- European Commission. European Commission Directive 2002/32/EC of the European parliament and of the council of 7th May 2002 on undesirable substances in animal feed. Off. J. Eur. Communities 2002, L0032, 1–15. [Google Scholar]
- Kenya Bureau of Standards. KS 2289-1:2016 Standard on Compounded Tilapia Feeds—Specification. Part 1: Complete Feeds, 1st ed.; Kenya Bureau of Standards (KEBS): Nairobi, Kenya, 2015. [Google Scholar]
- Diao, E.; Dong, H.; Hou, H.; Zhang, Z.; Ji, N.; Ma, W. Factors Influencing Aflatoxin Contamination in Before and After Harvest Peanuts: A Review. J. Food Res. 2014, 4, 148. [Google Scholar] [CrossRef]
- UK-FSA Undesirable Substances in Animal Feed|Food Standards Agency. Available online: https://www.food.gov.uk/business-industry/farmingfood/animalfeed/animalfeedlegislation/feedundesirables (accessed on 20 April 2018).
- El-Sayed, Y.S.; Khalil, R.H. Toxicity, biochemical effects and residue of aflatoxin B1 in marine water-reared sea bass (Dicentrarchus labrax L.). Food Chem. Toxicol. 2009, 47, 1606–1609. [Google Scholar] [CrossRef]
- Michelin, E.C.; Massocco, M.M.; Godoy, S.H.S.; Baldin, J.C.; Yasui, G.S.; Lima, C.G.; Rottinghaus, G.E.; Sousa, R.L.M.; Fernandes, A.M. Carryover of aflatoxins from feed to lambari fish (Astyanax altiparanae) tissues. Food Addit. Contam. Part A 2017, 34, 265–272. [Google Scholar] [CrossRef]
- Bbosa, G.S.; Kitya, D.; Lubega, A.; Ogwal-Okeng, J.; Anokbonggo, W.W.; Kyegombe, D.B. Review of the Biological and Health Effects of Aflatoxins on Body Organs and Body Systems. In Review of the Biological and Health Effects of Aflatoxins on Body Organs and Body Systems; InTech: Vienna, Austria, 2013; pp. 239–265. ISBN 9789537619992. [Google Scholar]
- Sotolu, A.O.; Sule, S.O.; Oshinowo, J.A.; Ogara, I.M. Implication of aflatoxin in fish feeds and management strategies for sustainable aquaculture. PAT June 2014, 10, 38–52. [Google Scholar]
- Zychowski, K.E.; Hoffmann, A.R.; Ly, H.J.; Pohlenz, C.; Buentello, A.; Romoser, A.; Gatlin, D.M.; Phillips, T.D. The Effect of Aflatoxin-B1 on Red Drum (Sciaenops ocellatus) and Assessment of Dietary Supplementation of NovaSil for the Prevention of Aflatoxicosis. Toxins (Basel) 2013, 5, 1555–1573. [Google Scholar] [CrossRef] [PubMed]
- Williams, D.E. The rainbow trout liver cancer model: Response to environmental chemicals and studies on promotion and chemoprevention. Comp. Biochem. Physiol. Part C Toxicol. Pharmacol. 2012, 155, 121–127. [Google Scholar] [CrossRef] [PubMed] [Green Version]
- Anh-Tuan, N.; Grizzle, J.M.; Lovell, R.T.; Manning, B.B.; Rottinghaus, G.E. Growth and hepatic lesions of Nile tilapia (Oreochromis niloticus) fed diets containing aflatoxin B1. Aquaculture 2002, 212, 311–319. [Google Scholar] [CrossRef]
- Roberts, R.J. Fish Pathology, 4th ed.; Roberts, R.J., Ed.; Wiley-Blackwell: Ames, IA, USA, 2012; ISBN 9781444332827. [Google Scholar]
- Ashley, L.M. Animal model of human disease. Liver cell carcinoma, hepatocellular carcinoma, hepatoma. Am. J. Pathol. 1973, 72, 345–348. [Google Scholar] [PubMed]
- Deng, S.-X.; Tian, L.-X.; Liu, F.-J.; Jin, S.-J.; Liang, G.-Y.; Yang, H.-J.; Du, Z.-Y.; Liu, Y.-J. Toxic effects and residue of aflatoxin B1 in tilapia (Oreochromis niloticus × O. aureus) during long-term dietary exposure. Aquaculture 2010, 307, 233–240. [Google Scholar] [CrossRef]
- Bailey, G.S.; Williams, D.E.; Wilcox, J.; Loveland, P.M.; Coulombe, R.A.; Hendricks, J.D. Aflatoxin B1 carcinogenesis and its relation to DNA adduction formation and adduct persistence in sensitive and resistant Salmonid fish. Carcinogenesis 1988, 9, 1919–1926. [Google Scholar] [CrossRef]
- Santacroce, M.P.; Conversano, M.C.; Casalino, E.; Lai, O.; Zizzadoro, C.; Centoducati, G.; Crescenzo, G. Aflatoxins in aquatic species: Metabolism, toxicity and perspectives. Rev. Fish Biol. Fish. 2008, 18, 99–130. [Google Scholar] [CrossRef]
- Gillam, E.M.J.; Hunter, D.J.B. Chemical defense and exploitation. Biotransformation of xenobiotics by cytochrome P450 enzymes. In Metal Ions in Life Sciences; Sigel, A., Sigel, H., Sigel, R.K.O., Eds.; John Wiley & Sons Ltd.: West Sussex, UK, 2007; Volume 3, pp. 477–560. ISBN 978-0-470-01672-5. [Google Scholar]
- Bailey, G.S.; Williams, D.E.; Hendricks, J.D. Fish models for environmental carcinogenesis: The rainbow trout. Environ. Health Perspect. 1996, 104, 5–12. [Google Scholar] [CrossRef]
- Rajeev-Raghavan, P.; Zhu, X.; Lei, W.; Han, D.; Yang, Y.; Xie, S. Low levels of Aflatoxin B1, could cause mortalities in juvenile hybrid sturgeon, Acipenser ruthenus ♂× A. baeri ♀. Aquac. Nutr. 2011, 17, 39–47. [Google Scholar] [CrossRef]
- Arana, S.; Alves, V.A.F.; Sabino, M.; Tabata, Y.A.; Nonogaki, S.; Zaidan-Dagli, M.-L.; Hernandez-Blazquez, F.J. Immunohistochemical Evidence for Myofibroblast- like Cells Associated with Liver Injury Induced by Aflatoxin B1 in Rainbow Trout (Oncorhynchus mykiss). J. Comp. Pathol. 2014, 150, 258–265. [Google Scholar] [CrossRef] [PubMed]
- Shahafve, S.; Banaee, M.; Haghi, B.N.; Mohiseni, M. Histopathological study of common carp (Cyprinus carpio) fed aflatoxin- contaminated diets. Int. J. Aquat. Biol. 2017, 5, 63–70. [Google Scholar]
- Dhanasekaran, D.; Shanmugapriya, S.; Thajuddin, N.; Panneerselvam, A. Aflatoxins and Aflatoxicosis in Human and Animals. In Aflatoxins—Biochemistry and Molecular Biology; Guevara-Gonzalez, R.G., Ed.; InTech Europe: Rijeka, Croatia, 2011; pp. 221–254. ISBN 978-953-307-395-8. [Google Scholar]
- CAST. Council for Agricultural Science and Technology—Task Force Report; Council for Agricultural Science and Technology: Ames, IA, USA, 2003; ISBN 1887383220. [Google Scholar]
- Probst, C.; Njapau, H.; Cotty, P.J. Outbreak of an acute aflatoxicosis in Kenya in 2004: Identification of the causal agent. Appl. Environ. Microbiol. 2007, 73, 2762–2764. [Google Scholar] [CrossRef] [PubMed]
- Mwihia, J.T.; Straetmans, M.; Ibrahim, A.; Njau, J.; Muhenje, O.; Guracha, A.; Gikundi, S. Aflatoxin levels in locally grown maize from Makueni district, Kenya. East Afr. Med. J. 2008, 85, 311–317. [Google Scholar] [CrossRef] [PubMed]
- Mutiga, S.K.; Were, V.; Hoffmann, V.; Harvey, J.W.; Milgroom, M.G.; Nelson, R.J. Extent and drivers of mycotoxin contamination: Inferences from a survey of Kenyan maize mills. Am. Phytopathol. Soc. 2014, 104, 1221–1231. [Google Scholar] [CrossRef] [PubMed]
- Mutiga, S.K.; Hoffmann, V.; Harvey, J.; Milgroom, M.G.; Nelson, R. Assessment of aflatoxin and fumonisin contamination of maize in western Kenya. Phytopathology 2015, 105, 1250–1261. [Google Scholar] [CrossRef]
- Alinezhad, S.; Tolouee, M.; Kamalzadeh, A.; Motalebi, A.A.; Nazeri, M.; Yasemi, M.; Shams-Ghahfarokhi, M.; Tolouei, R.; Razzaghi-Abyaneh, M. Mycobiota and aflatoxin B1 contamination of rainbow trout (Oncorhinchus mykiss) feed with emphasis to Aspergillus section flavi. Iran. J. Fish. 2011, 10, 363–374. [Google Scholar]
- Muturi, P.M. A review of Nyeri county—Kenya strategic plan 2013–2017. Int. J. Econ. Commer. Manag. UK 2015, 3, 1364–1405. [Google Scholar]
- Mavuti, S.K.; Waruiru, R.M.; Mbuthia, P.G.; Maina, J.G.; Mbaria, J.M. Evaluation of fish farmer management practices in Nyeri County, Kenya. Int. J. Fish. Aquat. Stud. 2017, 5, 165–170. [Google Scholar]
- Anonymous. Nyeri County Intergrated Development Plan 2018–2022; Nyeri County Government: Nyeri, Kenya, 2018.
- Kenya Bureau of Standards. KS ISO 6497:2002 Standard on Animal Feeding Stuffs—Sampling; Kenya Bureau of Standards (KEBS): Nairobi, Kenya, 2009; pp. 1–19. [Google Scholar]
- R-Biopharm AG. RIDASCREEN® Aflatoxin Total, Enzyme Immunoassay for the Quantitative Analysis of Aflatoxins, Art. No.: R4701; R-Biopharm AG: Darmstadt, Germany, 2016; pp. 1–16. [Google Scholar]
- Brar, R.S.; Sandhu, H.S.; Singh, A. Veterinary Clinical Diagnosis by Laboratory Methods, 1st ed.; Kalyani Publishers: New Delhi, India, 2003. [Google Scholar]


| Feed Type | Occurrence | ≥ML | Range | Median | Median 95% CI | Mean ± SD | Mean 95% CI |
|---|---|---|---|---|---|---|---|
| (n = 81) | % (n) | % (n) | µg/kg | µg/kg | µg/kg | µg/kg | µg/kg |
| Complete | 45.7 (37) | 13.5 (5) | <1.8–39.7 | 3.6 | 2.9–4.7 | 6.7 ± 7.7 | 3.6–8.9 |
| Compound | 32.1 (26) | 34.6 (9) | <1.8–31.2 | 4.8 | 2.8–12.0 | 8.9 ± 9.2 | 5.3–12.4 |
| Ingredient | 22.2 (18) | 5.6 (1) | <1.8–32.8 | 2.1 | 0.9–4.4 | 5.6 ± 8.3 | 1.7–9.5 |
| Sub-County (n = 81) | Occurrence % (n) | ≥ML % (n) | Range µg/kg | Median µg/kg | Median 95% CI µg/kg | Mean ± SD µg/kg | Mean 95% CI µg/kg |
|---|---|---|---|---|---|---|---|
| Tetu | 37.0 (30) | 23.3 (7) | <1.8–31.2 | 4.1 * | 3.0–6.9 | 8.3 ± 8.6 | 5.1–11.4 |
| Kieni East | 29.6 (24) | 0.0 (0) | <1.8–5.5 | 2.8 | 2.4–3.6 | 2.9 ± 1.3 | 2.3–3.4 |
| Nyeri Central | 13.6 (11) | 11.1 (1) | <1.8–32.8 | 3.2 | 0.9–7.5 | 5.9 ± 9.3 | 0.3–11.5 |
| Kieni West | 11.1 (9) | 33.3 (3) | 1.76–39.7 | 7.8 * | 2.0–26.5 | 12.9 ± 13.4 | 4.0–21.8 |
| Othaya | 8.6 (7) | 57.1 (4) | <1.8–18.2 | 11.4 * | 2.0–16.2 | 9.9 ± 5.6 | 5.5–13.9 |
| Characteristics | Occurrence | ≥ML | Range | Median | Median 95% CI | Mean ± SD | Mean 95% CI | |
|---|---|---|---|---|---|---|---|---|
| % (n) | % (n) | µg/kg | µg/kg | µg/kg | µg/kg | µg/kg | ||
| Source of fish feed (n = 81) | ||||||||
| Fish farmers | 86.4 (70) | 18.6 (13) | <1.8–39.7 | 3.8 | 3.1–4.7 | 7.2 ± 8.1 | 5.1–9.3 | |
| Manufacturer | 13.6 (11) | 18.2 (2) | 2.34–18.2 | 2.8 | 2.4–10.0 | 5.6 ± 5.2 | 2.5–8.7 | |
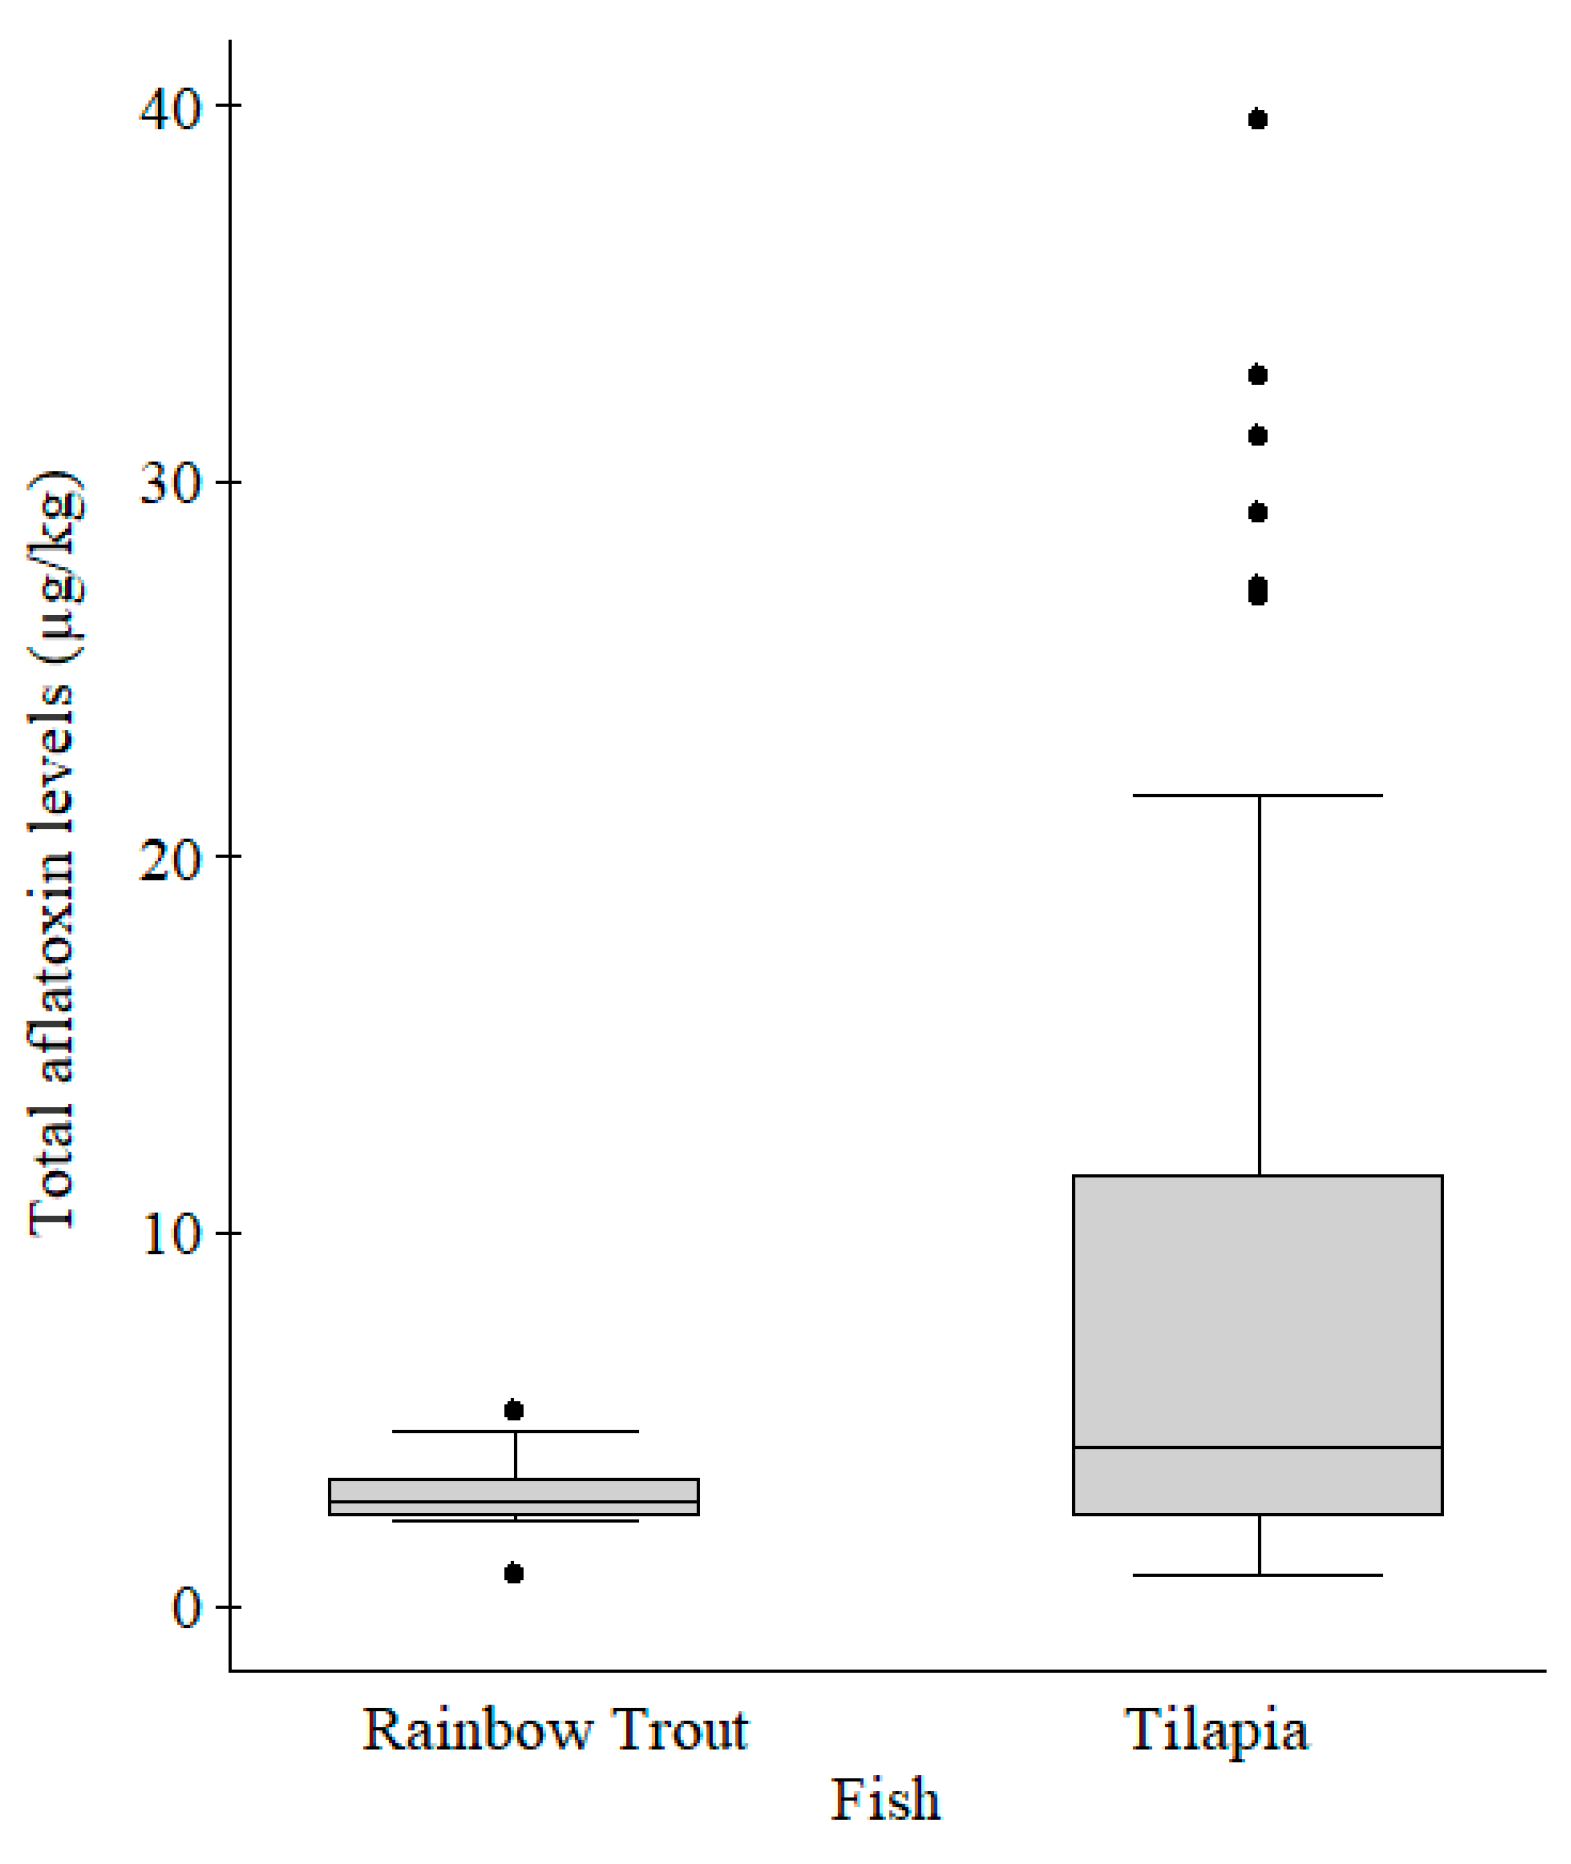
| Type of fish fed (n = 81) | ||||||||
| Rainbow trout | 21.0 (17) | 0.0 (0) | <1.8–5.2 | 2.8 | 2.4–3.4 | 3.0 ± 1.0 | 2.5–3.4 | |
| Tilapia | 79.0 (64) | 23.4 (15) | <1.8–39.7 | 4.0 a | 3.2–6.0 | 8.1 ± 9.1 | 5.8–10.3 | |
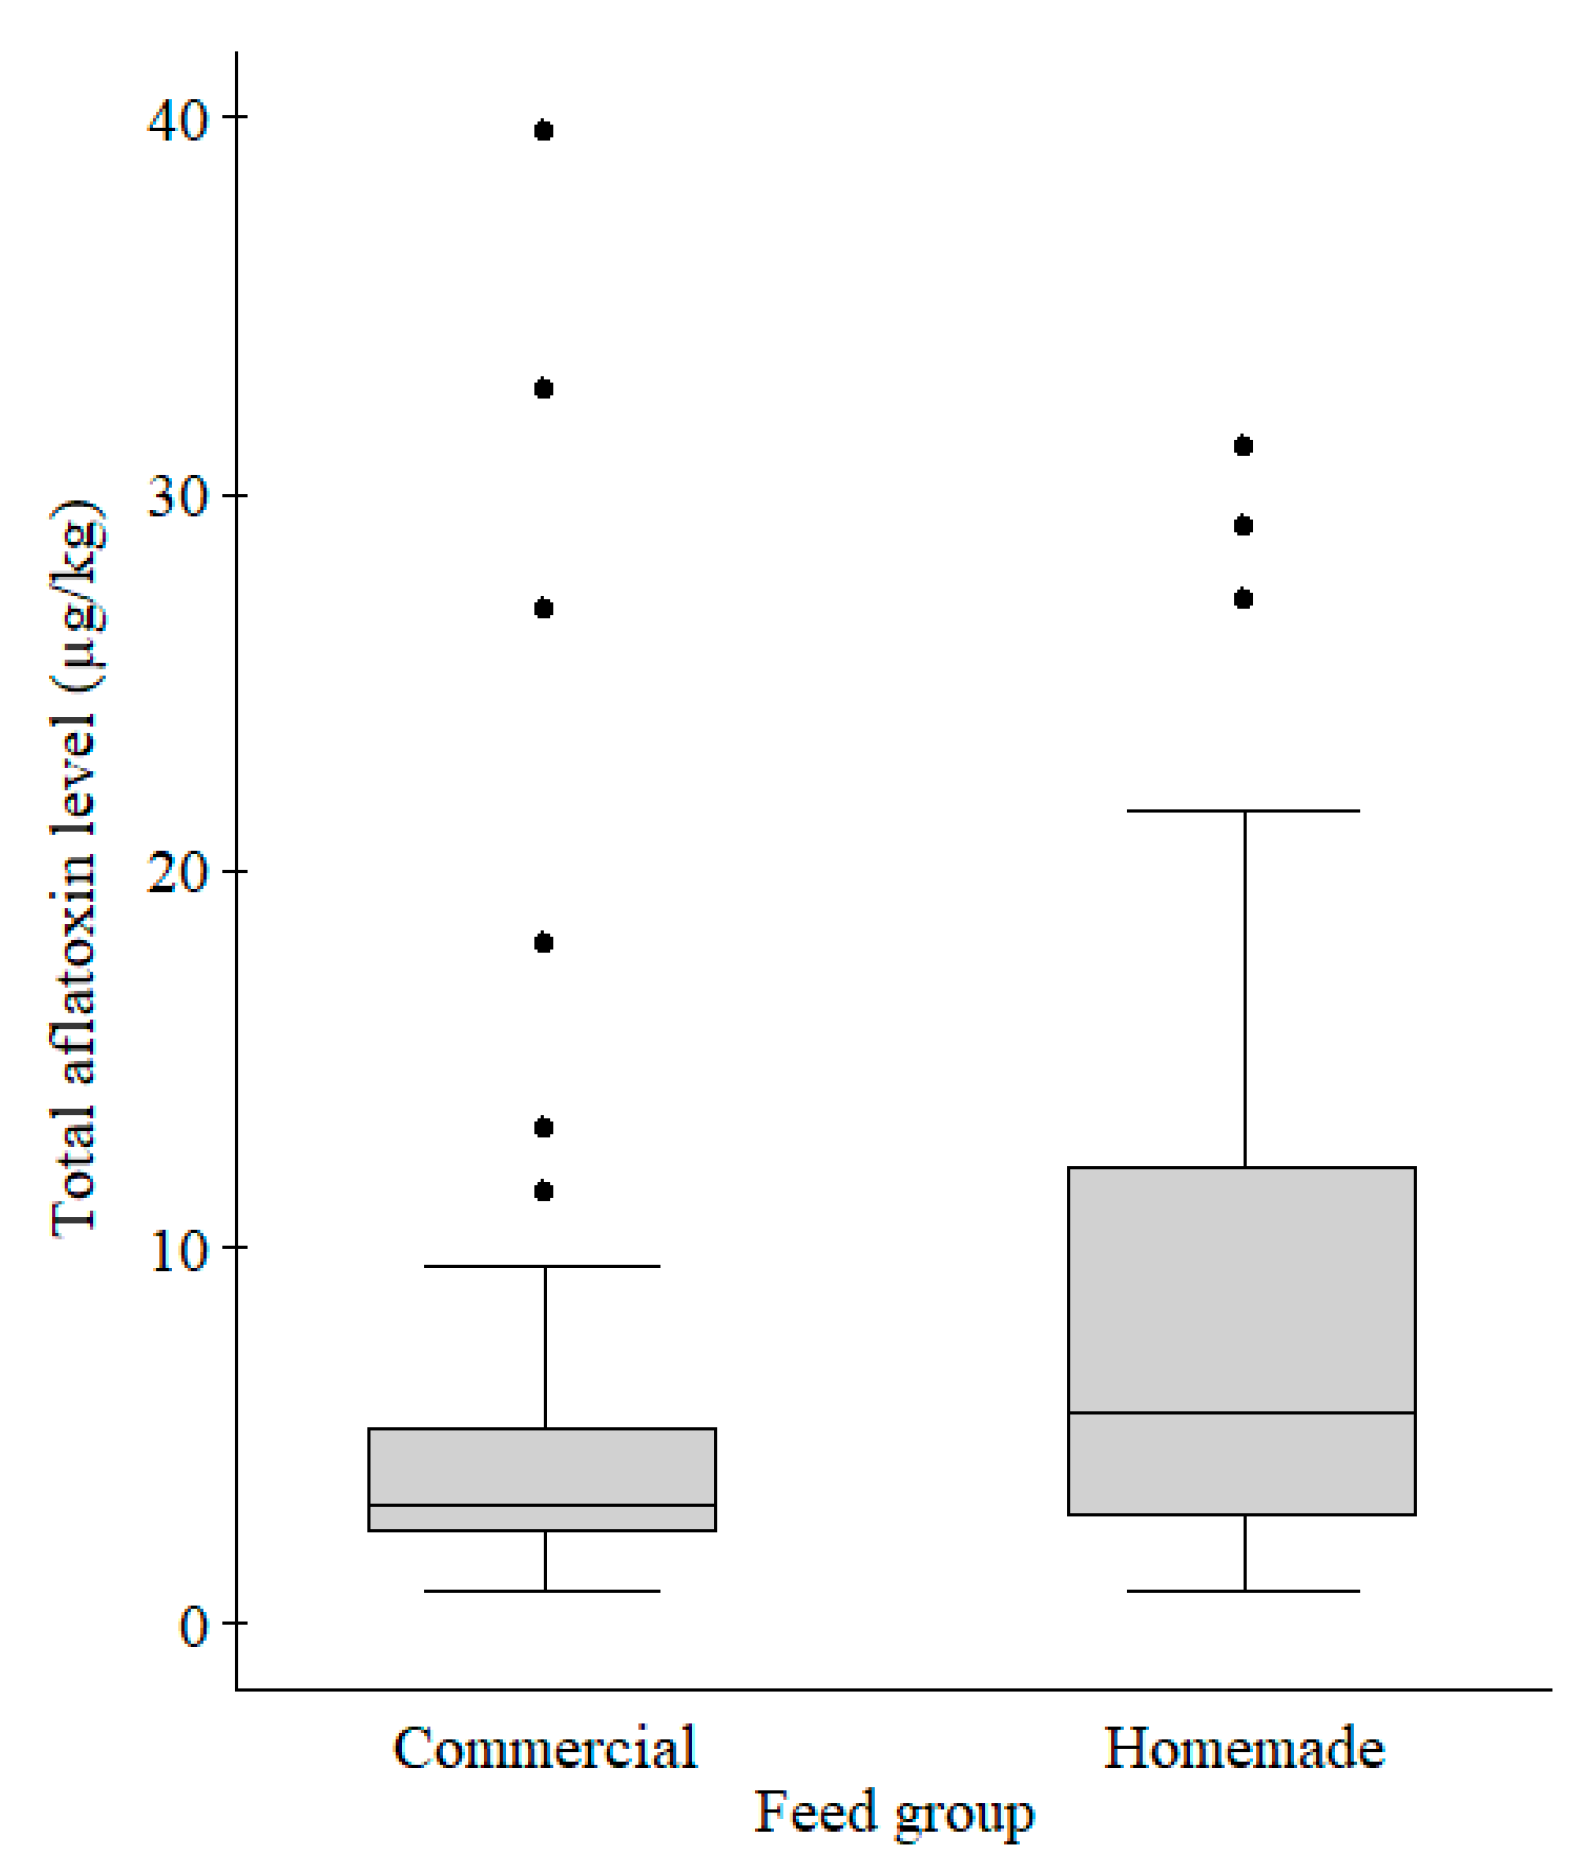
| Feed group (n = 81) | ||||||||
| Commercial | 63.0 (51) | 7.8 (4) | <1.8–39.7 | 3.2 | 2.8–4.0 | 5.7 ± 7.8 | 3.6–7.9 | |
| Homemade | 37.0 (30) | 36.7 (11) | <1.8–31.2 | 5.6 b | 3.2–11.8 | 9.2 ± 8.9 | 5.9–12.4 | |
| Form of feed (n = 81) | ||||||||
| Pellets | 37.0 (30) | 10.0 (3) | <1.8–39.7 | 3.2 | 2.8–4.6 | 5.9 ± 7.9 | 3.0–8.8 | |
| Crumble | 4.9 (4) | 0.0 (0) | <1.8–5.2 | 3 | 0.9–5.3 | 3.0 ± 2.0 | 1.1–5.0 | |
| Mash | 49.4 (40) | 30.0 (12) | <1.8–32.8 | 4.3 | 3.2–10.7 | 8.9 ± 9.2 | 6.1–11.8 | |
| Fine/Flour | 6.2 (5) | 0.0 (0) | <1.8–7.8 | 0.9 | 0.9–7.8 | 2.9 ± 3.1 | 0.1–5.6 | |
| Cake | 2.5 (2) | 0.0 (0) | <1.8–3.2 | 2 | 0.9–3.2 | 2.0 ± 1.6 | −4.6 | |
| Ingredient Group | Occurrence | ≥ML | Range | Median | Median 95% CI | Mean ± SD | Mean 95% CI |
|---|---|---|---|---|---|---|---|
| (n = 55) | % (n) | % (n) | µg/kg | µg/kg | µg/kg | µg/kg | µg/kg |
| Cereal milling by-products | 83.6 (46) | 21.7 (10) | <1.8–32.8 | 3.5 | 2.8–5.6 | 7.6 ± 8.7 | 5.0–10.1 |
| Animal proteins | 41.8 (23) | 21.7 (5) | <1.8–29.1 | 4.0 | 3.2–8.8 | 7.8 ± 7.4 | 4.7–11.0 |
| Oilseed cakes or meal | 18.2 (10) | 40.0 (4) | <1.8–29.1 | 9.2 | 2.1–20.5 | 10.8 ± 9.4 | 4.8–16.8 |
| Cereal grains | 12.7 (7) | 28.6 (2) | 2.2–13.4 | 3.2 | 2.3–13.0 | 6.4 ± 4.9 | 2.6–10.1 |
| Ingredient | Occurrence | ≥ML | Range | Median | Median 95% CI | Mean ± SD | Mean 95% CI |
|---|---|---|---|---|---|---|---|
| (n = 55) | % (n) | % (n) | µg/kg | µg/kg | µg/kg | µg/kg | µg/kg |
| Oilseed cake or meal | |||||||
| Cotton seed cake | 12.7 (7) | 28.6 (2) | <1.8–29.1 | 8.9 | 1.2–23.6 | 9.4 ± 9.6 | 2.1–16.6 |
| Sunflower seed cake | 9.1 (5) | 60.0 (3) | 2.7–21.6 | 11.5 | 2.7–21.6 | 12.7 ± 7.4 | 6.0–19.3 |
| Canola cake | 1.8 (1) | 100.0 (1) | 18.2 | 18.2 | - | 18.2 | - |
| Soya bean meal | 5.5 (3) | 66.7 (2) | 9.48–21.6 | 3.3 | 11.5–9.5 | 14.2 ± 6.5 | 6.7–21.7 |
| Cereal milling by-products | |||||||
| Wheat bran | 52.7 (29) | 17.2 (5) | <1.8–32.8 | 3.7 | 2.8–6.0 | 7.8 ± 9.0 | 4.5–11.2 |
| Maize bran | 45.5 (25) | 32.0 (8) | <1.8–33.2 | 5.6 * | 2.9–12.1 | 9.7 ± 9.2 | 6.1–13.4 |
| Pollard | 25.5 (14) | 0.0 (0) | <1.8–8.9 | 2.8 | 0.9–3.8 | 3.2 ± 2.5 | 1.9–4.5 |
| Rice bran | 5.5 (3) | 0.0 (0) | <1.8–4.5 | 4.0 | 0.9–4.5 | 3.1 ± 2.0 | 0.8–5.4 |
| Maize germ | 1.8 (1) | 0.0 (0) | 4.0 | 4.0 | - | 4.0 | - |
| Animal proteins | |||||||
| Dried silver cyprinid fish | 16.4 (9) | 11.1 (1) | 2.34–13.4 | 3.4 | 2.8–4.7 | 4.4 ± 3.4 | 2.1–6.7 |
| Fish meal | 16.4 (9) | 33.3 (3) | 3.18–29.1 | 7.0 * | 3.6–21.3 | 12.4 ± 9.5 | 6.1–18.7 |
| Fresh water shrimp | 3.6 (2) | 0.0 (0) | <1.8–2.7 | 1.8 | 0.9–2.7 | 1.8 ± 1.3 | −0.1–3.7 |
| Bone meal | 3.6 (2) | 50.0 (1) | 9.5–21.6 | 3.8 | 2.9–5.4 | 10.5 ± 1.4 | 8.5–12.5 |
| Blood meal | 1.8 (1) | 0.0 (0) | 4.0 | 4.0 | - | 4.0 | - |
| Cereal grains | |||||||
| Wheat | 9.1 (5) | 40.0 (2) | 2.19–13.4 | 2.6 | 2.2–13.4 | 6.5 ± 5.7 | 1.4–11.6 |
| Maize | 1.8 (1) | 0.0 (0) | 3.2 | 3.2 | - | 3.2 | - |
| Rice | 1.8 (1) | 0.0 (0) | 8.9 | 8.9 | - | 8.9 | - |
| Others | |||||||
| Greens | 11.0 (6) | 16.7 (1) | <1.8–13.4 | 2.5 | 0.9–12.3 | 3.8 ± 4.8 | −0.1–7.7 |
| Multivitamin | 10.3 (6) | 16.7 (1) | 2.40–13.4 | 3.8 | 2.5–12.4 | 5.1 ± 4.1 | 1.7–8.4 |
| Dairy meal | 5.5 (3) | 0.0 (0) | <1.8–4.0 | 2.2 | 0.9–4.0 | 2.3 ± 1.6 | 0.6–4.1 |
| Poultry manure | 5.5 (3) | 0.0 (0) | <1.8–2.0 | 0.9 | 0.9–2.0 | 1.2 ± 0.6 | 0.5–2.0 |
| Reported Health Problems | Rainbow Trout (n = 8) % (n) | Tilapia (n = 14) % (n) | Total (n = 22) % (n) | p Value |
|---|---|---|---|---|
| No mortalities | 75.0 (6) | 64.3 (9) | 68.2 (15) | 1.000 |
| Mortalities | 25.0 (2) | 35.7 (5) | 31.8 (7) | |
| Normal appetite | 87.5 (7) | 92.9 (13) | 90.9 (20) | 1.000 |
| Poor appetite | 12.5 (1) | 7.1 (1) | 9.1 (2) | |
| Normal growth rates | 75.0 (6) | 42.9 (6) | 54.5 (12) | 0.204 |
| Poor growth rates | 25.0 (2) | 57.1 (8) | 45.5 (10) | |
| No tumor-like lesions | 12.5 (1) | 92.9 (13) | 63.6 (14) | <0.001 * |
| Tumor-like lesions | 87.5 (7) | 7.1 (1) | 36.4 (8) |
| Pathological Lesions Observed | Rainbow Trout | Tilapia | Total | ||||
|---|---|---|---|---|---|---|---|
| Farms (n = 8) | Fish (n = 80) | Farms (n = 4) | Fish (n = 40) | Farms (n = 12) | Fish (n = 120) | ||
| % (n) | % (n) | % (n) | % (n) | % (n) | % (n) | ||
| Gross lesions | |||||||
| Swollen abdomen | 62.5 (5) | 46.3 (37) | 50.0 (2) | 12.5 (5) | 58.3 (7) | 35.0 (42) | |
| Enlarged liver | 62.5 (5) | 60.0 (48) | 0.0 (0) | 0.0 (0) | 41.7 (5) | 40.0 (48) | |
| Nodules or cystic swellings in liver | 62.5 (5) | 50.0 (40) | 0.0 (0) | 0.0 (0) | 41.7 (5) | 33.3 (40) | |
| Liver hemorrhages | 100.0 (8) | 91.3 (73) | 25.0 (1) | 17.5 (7) | 75.0 (9) | 66.7 (80) | |
| Muscular hemorrhages | 50.0 (4) | 30.0 (24) | 0.0 (0) | 0.0 (0) | 33.3 (4) | 20.0 (24) | |
| Enlarged heart | 62.5 (5) | 40.0 (32) | 0.0 (0) | 0.0 (0) | 41.7 (5) | 26.7 (32) | |
| Enlarged kidneys | 62.5 (5) | 56.3 (45) | 0.0 (0) | 0.0 (0) | 41.7 (5) | 37.5 (45) | |
| Hemorrhagic intestinal content | 37.5 (3) | 32.5 (26) | 50.0 (2) | 17.5 (7) | 41.7 (5) | 27.5 (33) | |
| Total gross lesions (n = 8) | 100.0 (8) | 50.8 (325) | 37.5 (3) | 5.9 (19) | 100.0 (8) | 35.8 (344) | |
| Microscopic lesions in liver | |||||||
| Irregular hepatic cords | 62.5 (5) | 57.5 (46) | 0.0 (0) | 0.0 (0) | 41.7 (5) | 38.3 (46) | |
| Abnormal hepatocytes | 62.5 (5) | 62.5 (50) | 25.0 (1) | 7.5 (3) | 50.0 (6) | 44.2 (53) | |
| Liver necrosis | 87.5 (7) | 61.3 (49) | 25.0 (1) | 20.0 (8) | 66.7 (8) | 47.5 (57) | |
| Cytoplasmic vacuoles in hepatocytes | 100.0 (8) | 100.0 (80) | 0.0 (0) | 0.0 (0) | 66.7 (8) | 66.7 (80) | |
| Hyperchromatic nucleus | 87.5 (7) | 72.5 (58) | 0.0 (0) | 0.0 (0) | 58.3 (7) | 48.3 (58) | |
| Prominent nucleolus | 75.0 (6) | 45.0 (36) | 0.0 (0) | 0.0 (0) | 50.0 (6) | 30.0 (36) | |
| Total microscopic lesions (n = 6) | 100.0 (6) | 66.5 (319) | 33.3 (2) | 4.6 (11) | 100.0 (6) | 45.8 (330) | |
| Total pathological lesions (n = 14) | 100.0 (14) | 57.5 (644) | 33.3 (2) | 5.4 (30) | 100.0 (14) | 40.1 (674) | |
© 2018 by the authors. Licensee MDPI, Basel, Switzerland. This article is an open access article distributed under the terms and conditions of the Creative Commons Attribution (CC BY) license (http://creativecommons.org/licenses/by/4.0/).
Share and Cite
Mwihia, E.W.; Mbuthia, P.G.; Eriksen, G.S.; Gathumbi, J.K.; Maina, J.G.; Mutoloki, S.; Waruiru, R.M.; Mulei, I.R.; Lyche, J.L. Occurrence and Levels of Aflatoxins in Fish Feeds and Their Potential Effects on Fish in Nyeri, Kenya. Toxins 2018, 10, 543. https://0-doi-org.brum.beds.ac.uk/10.3390/toxins10120543
Mwihia EW, Mbuthia PG, Eriksen GS, Gathumbi JK, Maina JG, Mutoloki S, Waruiru RM, Mulei IR, Lyche JL. Occurrence and Levels of Aflatoxins in Fish Feeds and Their Potential Effects on Fish in Nyeri, Kenya. Toxins. 2018; 10(12):543. https://0-doi-org.brum.beds.ac.uk/10.3390/toxins10120543
Chicago/Turabian StyleMwihia, Evalyn Wanjiru, Paul Gichohi Mbuthia, Gunnar Sundstøl Eriksen, James K. Gathumbi, Joyce G. Maina, Stephen Mutoloki, Robert Maina Waruiru, Isaac Rumpel Mulei, and Jan Ludvig Lyche. 2018. "Occurrence and Levels of Aflatoxins in Fish Feeds and Their Potential Effects on Fish in Nyeri, Kenya" Toxins 10, no. 12: 543. https://0-doi-org.brum.beds.ac.uk/10.3390/toxins10120543