1. Introduction
Wheat is a staple food crop in many parts of the world, and has a per capita consumption of 78.46 kg/years in China. Annual global wheat production has increased steadily in recent years, reaching 733.8 million tonnes (MT) in 2015 after increasing from 713.2 MT in 2013 [
1]. This has led to a rapid increase of the ending stocks from 189.4 MT in 2013 to 225.8 MT in 2015 [
1]. China is the second largest producer of wheat in the world, and its annual production was 121.9 MT in 2013 and 130.2 MT in 2015. Accordingly, wheat stocks increased from 32.43 MT in 2013 to 40.23 MT in 2015 [
1], about 40% of which is usually stored in farmers’ houses under natural conditions at room temperature with no ventilation facility. During storage, wheat often experiences mold growth and mycotoxin contamination, resulting in food safety concerns and huge losses [
2].
Various fungal species have been found in stored wheat in different countries, ruining grains and resulting in unusable products [
3,
4,
5]; mycotoxigenic fungi often cause the most severe damage to wheat. For instance,
Fusarium graminearum was reported to be the most frequent species that contaminated durum and soft wheat in a central Italian area in 2009 and 2010, whereas
F. avenaceum and
F. poae only accounted for a small proportion of contamination [
3]. In Iranian silos, wheat samples imported from Argentina contained six fungi, including toxigenic fungi
Fusarium spp. and
Penicillium spp.
Penicillium spp., together with five other fungal species, were present in Australian wheat in which no
Fusarium spp. were detected. In Kazakhstan, wheat grains that were stored in Karaj silos or unloaded from trains contained ten fungal genera, including the toxigenic species
Aspergillus spp.,
Fusarium spp., and
Penicillium [
5]. In Saudi Arabia, wheat grains were contaminated by six fungal genera, and the most common toxigenic genera were
Fusarium (29.1%),
Aspergillus (14.3%), and
Penicillium (9.3%) [
4].
Non-mycotoxigenic fungi have also been identified in stored wheat grains. For instance, in Iranian silos, wheat grains contain
Rhizopus nigricans,
Ulocladium spp.,
Cladosporium spp., and
Alternaria spp. In Kazakistan,
Mucor mucedo,
Curvularia triticola,
Ulocladium clamydosporium, Alternaria spp. and
Cytospora tritici [
5] were identified. In Saudi Arabia, the most common fungal genera in stored wheat include
Alternaria (8.2%).
Mycotoxins that contaminate wheat grains pose a serious and direct threat to the health of humans and domestic animals due to their high toxicity [
6,
7,
8]. Fungal species from
Aspergillus,
Fusarium, and
Penicillium are toxigenic producers that generate the most important mycotoxins and reduce quality of products [
9,
10,
11,
12,
13,
14,
15,
16]. In particular,
F. graminearum and
A. flavus produce widely distributed mycotoxins such as deoxynivalenol (DON), nivalenol (NIV), and aflatoxins [
17,
18]. In Iran, 10 of 34 wheat samples collected from three silos in Golestan province contained aflatoxins, with levels ranging from 0.23 ng/g to 7.08 ng/g [
19]. In China, DON is the predominant mycotoxin that contaminates wheat, and 89% of harvested wheat grains from Anhui and Jiangsu provinces in the middle and downstream regions of the Yangtze river have been reported to contain DON, with levels from 993 to 2691 μg/kg [
20]. Studies have also reported detection of aflatoxins in wheat flour, whereas the aflatoxin-producing fungi were not revealed [
21,
22].
In the present study, barcoded Illumina paired-end sequencing (BIPES) and chemical analyses were used to investigate the microbiome and mycotoxin profiles of wheat at different times and silo positions during one year of storage. The results showed that F. graminearum was one of the predominant toxigenic species, and DON was the predominant Fusarium mycotoxin, with substantial variations among storage times and silo positions. A relatively low abundance of A. flavus was detected, with a low level of aflatoxins. These findings are likely to encourage the implementation and design of mold and mycotoxin management strategies, as well as prediction models under storage conditions.
2. Results
2.1. Data Characteristics
Total DNA from all 39 wheat samples stored in three silos (three repeats; three positions in each silo, top, middle, and bottom) was isolated and used for PCR with a fungal ITS2 primer pair and a bacterial V3V4 primer pair. PCR results showed that all samples contained one clear fungal DNA fragment of about 500 bp in length and one bacterial DNA fragment of about 500 bp in length, as expected (
Figure S1). These results indicated that all wheat samples contained both fungal and bacterial communities, and thus, the isolated DNA was subjected to BIPES.
Based on metagenomic sequencing of fungal ITS2 in stored wheat grains, the average number of raw paired reads generated per sample was 33,762. After filtering and de-noising, the average number of clean, paired reads was 29,409 (
Table S1). Tags were assembled from paired reads and the average number of tags was 26,324 (
Table S1). Lengths of tags ranged from 308 to 371 bp. These tags were subsequently clustered into different operational taxonomic units (OTUs), and the average number of OTUs was 205 (range: 20–466).
Bacterial V3V4 sequencing revealed that the average number of raw paired reads generated per sample was 33,046. After filtering and de-noising, the average number of clean, paired reads was 30,535 (
Table S2). Tags were assembled from paired reads, and the average number of tags was 30,169. The lengths of all tags obtained were longer than 425 bp (
Table S2). The tags were subsequently clustered into different OTUs, and the average number of OTUs was 117 (range: 38–239). The data were further used for variation analyses at different taxonomic levels across storage time and silo position.
2.2. Fungus Variation at the Phylum Level across Storage Time and Silo Position
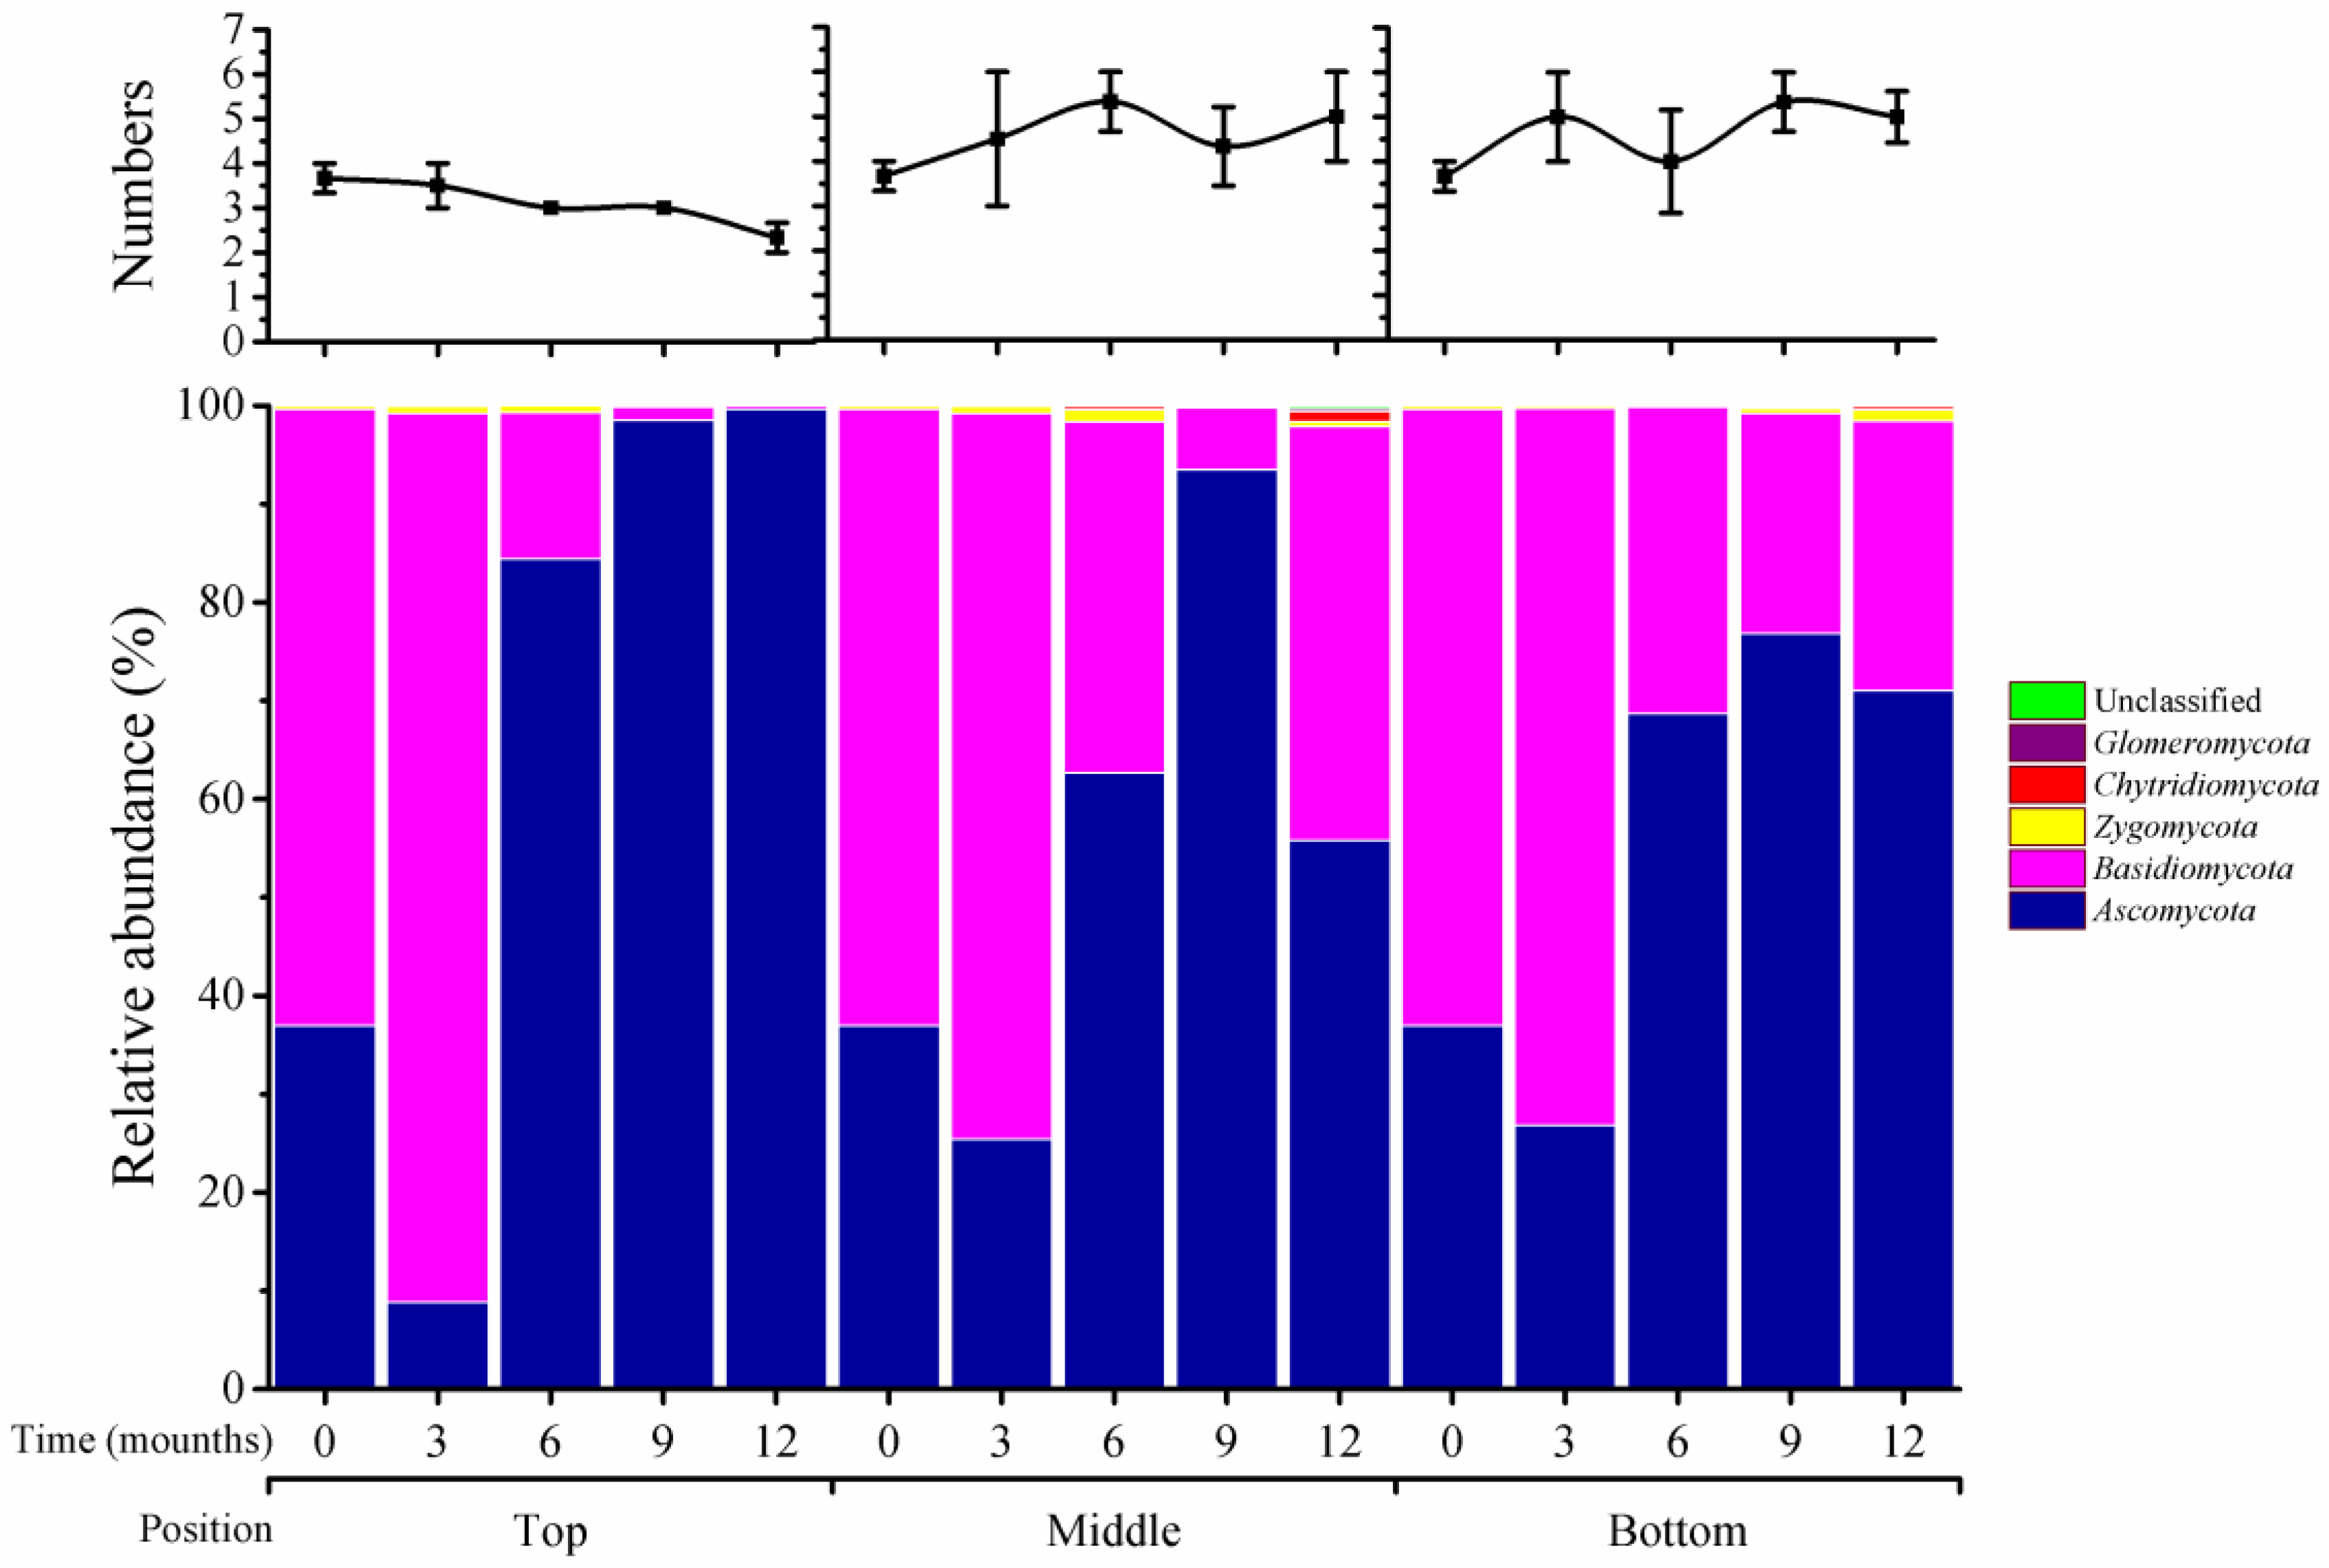
As shown in
Figure 1, five fungal phyla were classified in stored wheat samples, including Ascomycota, Basidiomycota, Chytridiomycota, Glomeromycota, and Zygomycota, and their numbers varied across storage times and positions of silos. Unclassified fungi accounted for a small portion. At the top position of silos, there were four phyla at 0 and 3 months, three phyla at 6 and 9 months, and two phyla at 12 months. However, at the middle and bottom positions, phylum numbers increased from four at time 0 to five at 3 months and onward. The relative abundance of phyla also varied at different times and positions. For instance, the relative abundance of Ascomycota increased from 38% at time 0 to 99.7% at 12 months in top positions, while it reached 94% and 77% in the middle and bottom positions, respectively, at 12 months. Basidiomycota was at 55% at time 0, but had disappeared from the top position at 12 months; this phylum accounted for 48% and 22% at 12 months in the middle and bottom positions, respectively. Thus, storage time and position in silos had varied impacts on the type and abundance of fungi during wheat storage.
2.3. Variation in Fungal Genera across Storage Time and Silo Position
There were 81 genera that could be classified, and 21 genera that were unclassified at T
0 in the fungal community. Substantial variations were detected in different positions of silos and at different storage times (
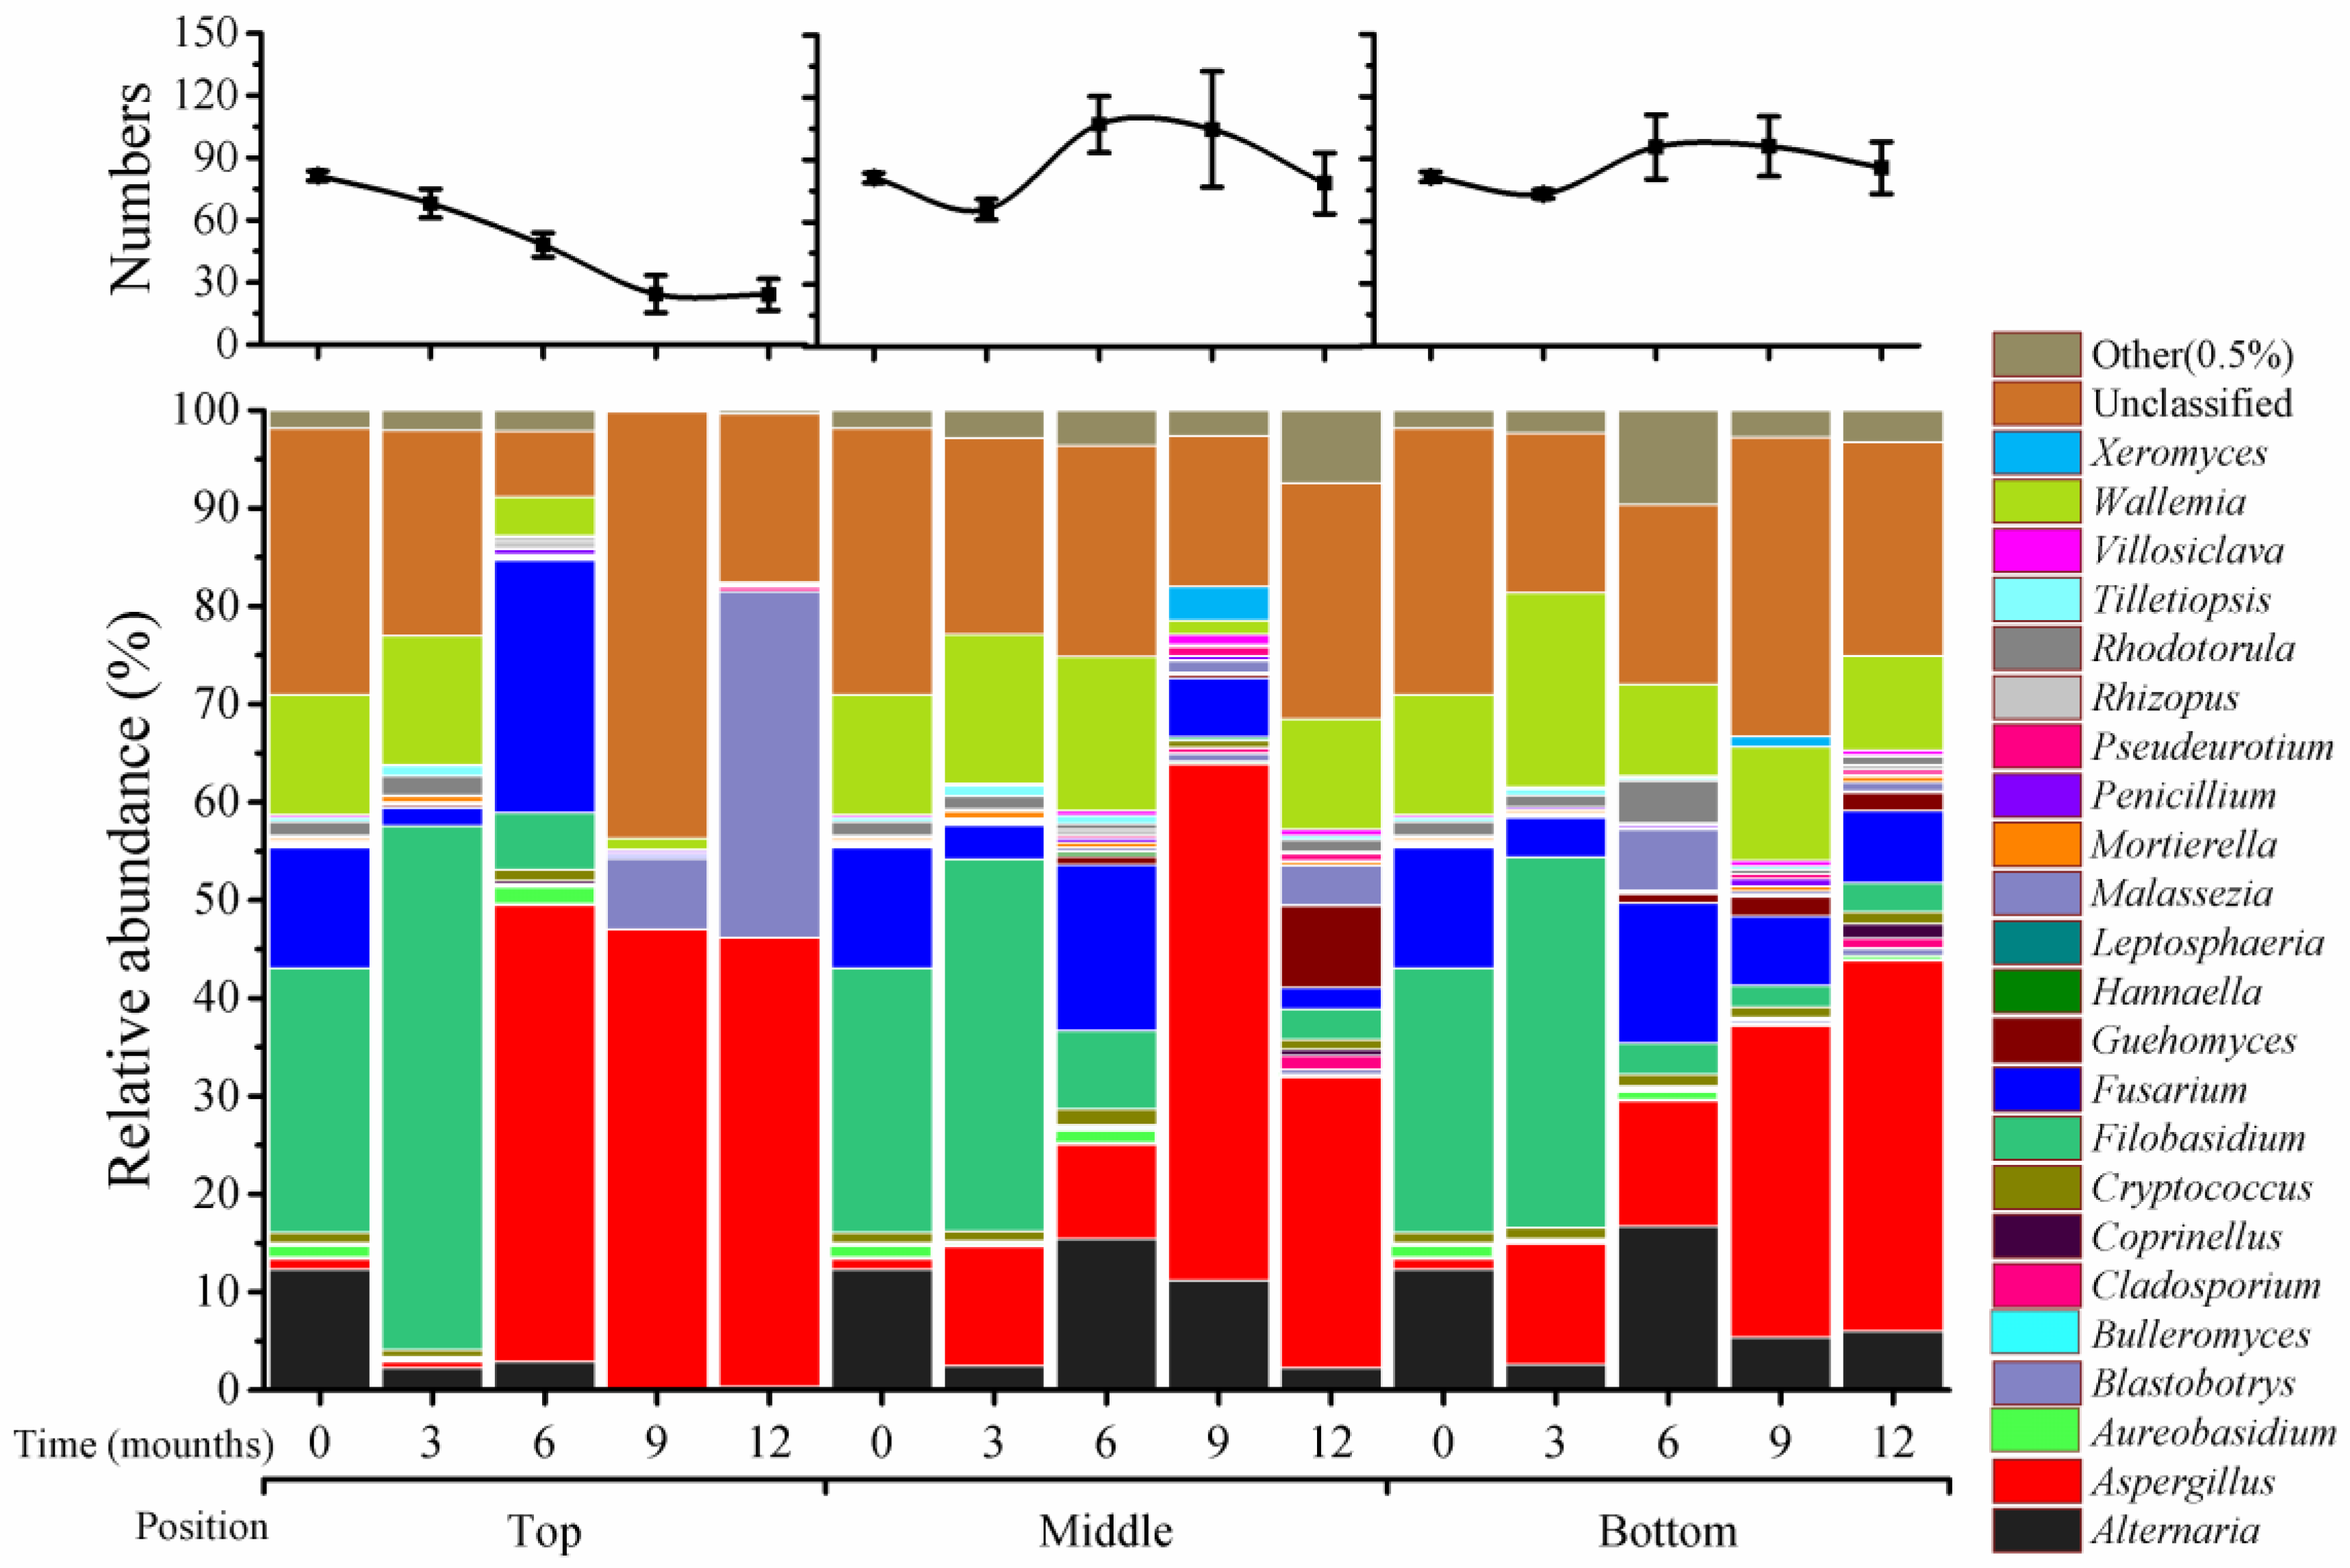
Figure 2). At top positions, the genus numbers were gradually reduced from 81 (time 0), to 68 (3 months), 48 (6 months), and 24 (9 months), and maintained at 24 by 12 months; this was a 3.4-fold reduction between 0 and 9 months. However, in the middle and bottom positions, genus numbers were substantially increased at 6 (middle: 107; bottom: 96) and 9 months (middle: 105; bottom: 96), after a reduction at 3 months in middle (66) and bottom (73) positions. The numbers were maintained at a high level at 12 months (middle; 79; bottom, 86).
There were four predominant genera at T0: Filobasidium (27%), Fusarium (12%), Alternaria (12%), and Wallemia (12%). These four genera displayed different patterns during storage. Filobasidium increased at 3 months (38% to 54%) and then declined sharply from 6 to 12 months (0% to 3%) in all three positions. Fusarium was reduced at 3 months (2% to 4%) and increased at 6 months (17% to 26%) in all positions; at 9 and 12 months, this genus accounted for only about 0.3% in top positions, 2% to 6% in the middle, and 7% in bottom positions. Alternaria and Wallemia had very low abundance (about 1%) at 9 to 12 months in top positions and retained quite high levels (2% to 17%) in the middle and bottom positions.
Four secondary genera, Aspergillus, Aureobasidium, Cryptococcus, and Rhodotorula, each accounted for about 1% at T0. Among them, Aspergillus had substantial increases of its relative abundance in all positions during storage; it remained at 1% at 3 months and increased at 6, 9, and 12 months (by about 47%) in top positions. In the middle and bottom positions, this genus had steady increases at 3 (10%), 6 (12%), 9 (30%), and 12 (53%) months. The remaining three genera remained constant during the entire storage period.
Blastobotrys varied significantly only in the top positions. The relative abundance of this genus was about 0.01% at T
0, and at 3 and 6 months, but increased at 9 months (7%) and 12 months (35%) (
Figure 2).
Unclassified fungi accounted for 27% of all fungi and the remaining 73 genera that were classified together accounted for only about 6% at T0. Unclassified fungi varied in top positions and were at a high proportion in middle and bottom positions. Overall, the 73 fungi had low relative abundance during the storage period.
2.4. Fungal Variation in Species across Storage Time at Different Silo Positions
As shown in
Figure 3, there were 105 species that were classified at T
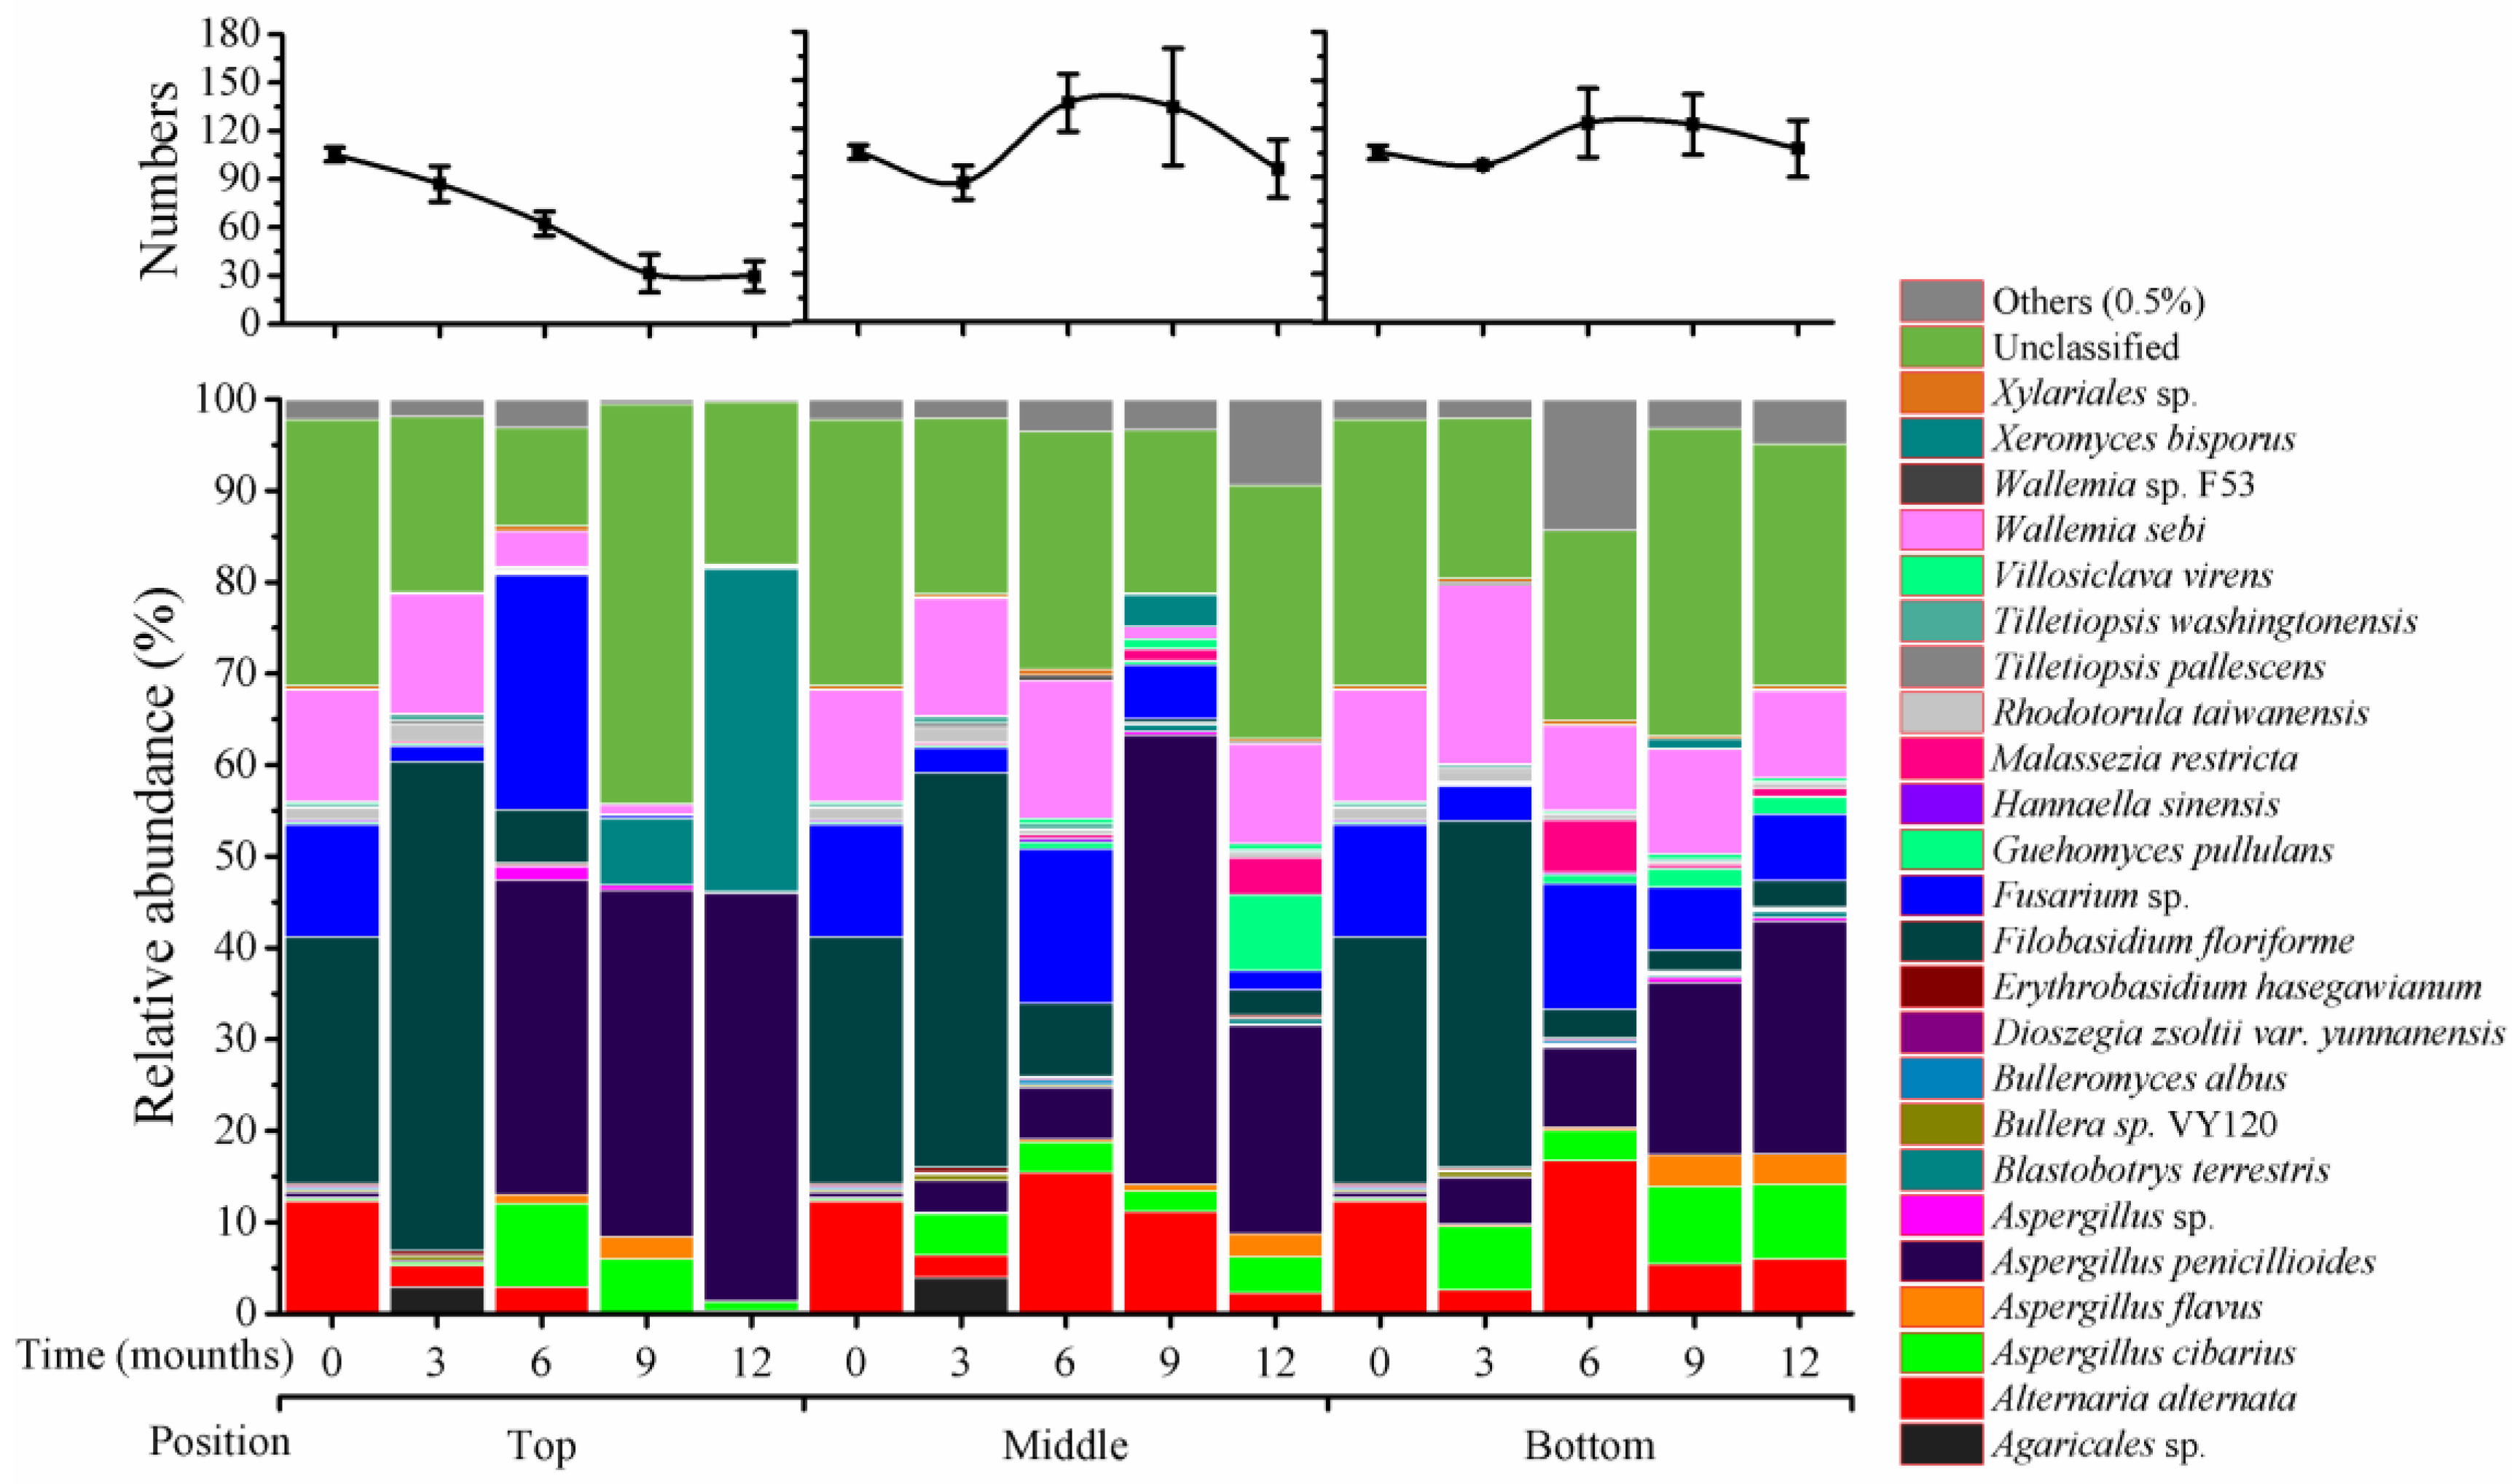
0, and 41 species that were unclassified. In top positions, species numbers were gradually reduced at 3 (87), 6 (62), 9 (31), and 12 (30) months of storage. In middle positions, species increased at 6 (136) and 9 months (133) of storage and remained high at 12 months (95); similar variation was seen in bottom positions.
Among the 105 species, four predominant fungal species had greater than 10% of relative abundance at T
0, including
Alternaria alternata (12%),
Filobasidium floriforme (27%),
Fusarium graminearum (12%), and
Wallemia sebi (12%). These relative abundances are almost the same as that of four genera presented above (
Figure 2). This is because some genera either had only one species (
Alternaria and
Filobasidium) or other species within the genus had very low relative abundance; for instance, the genus
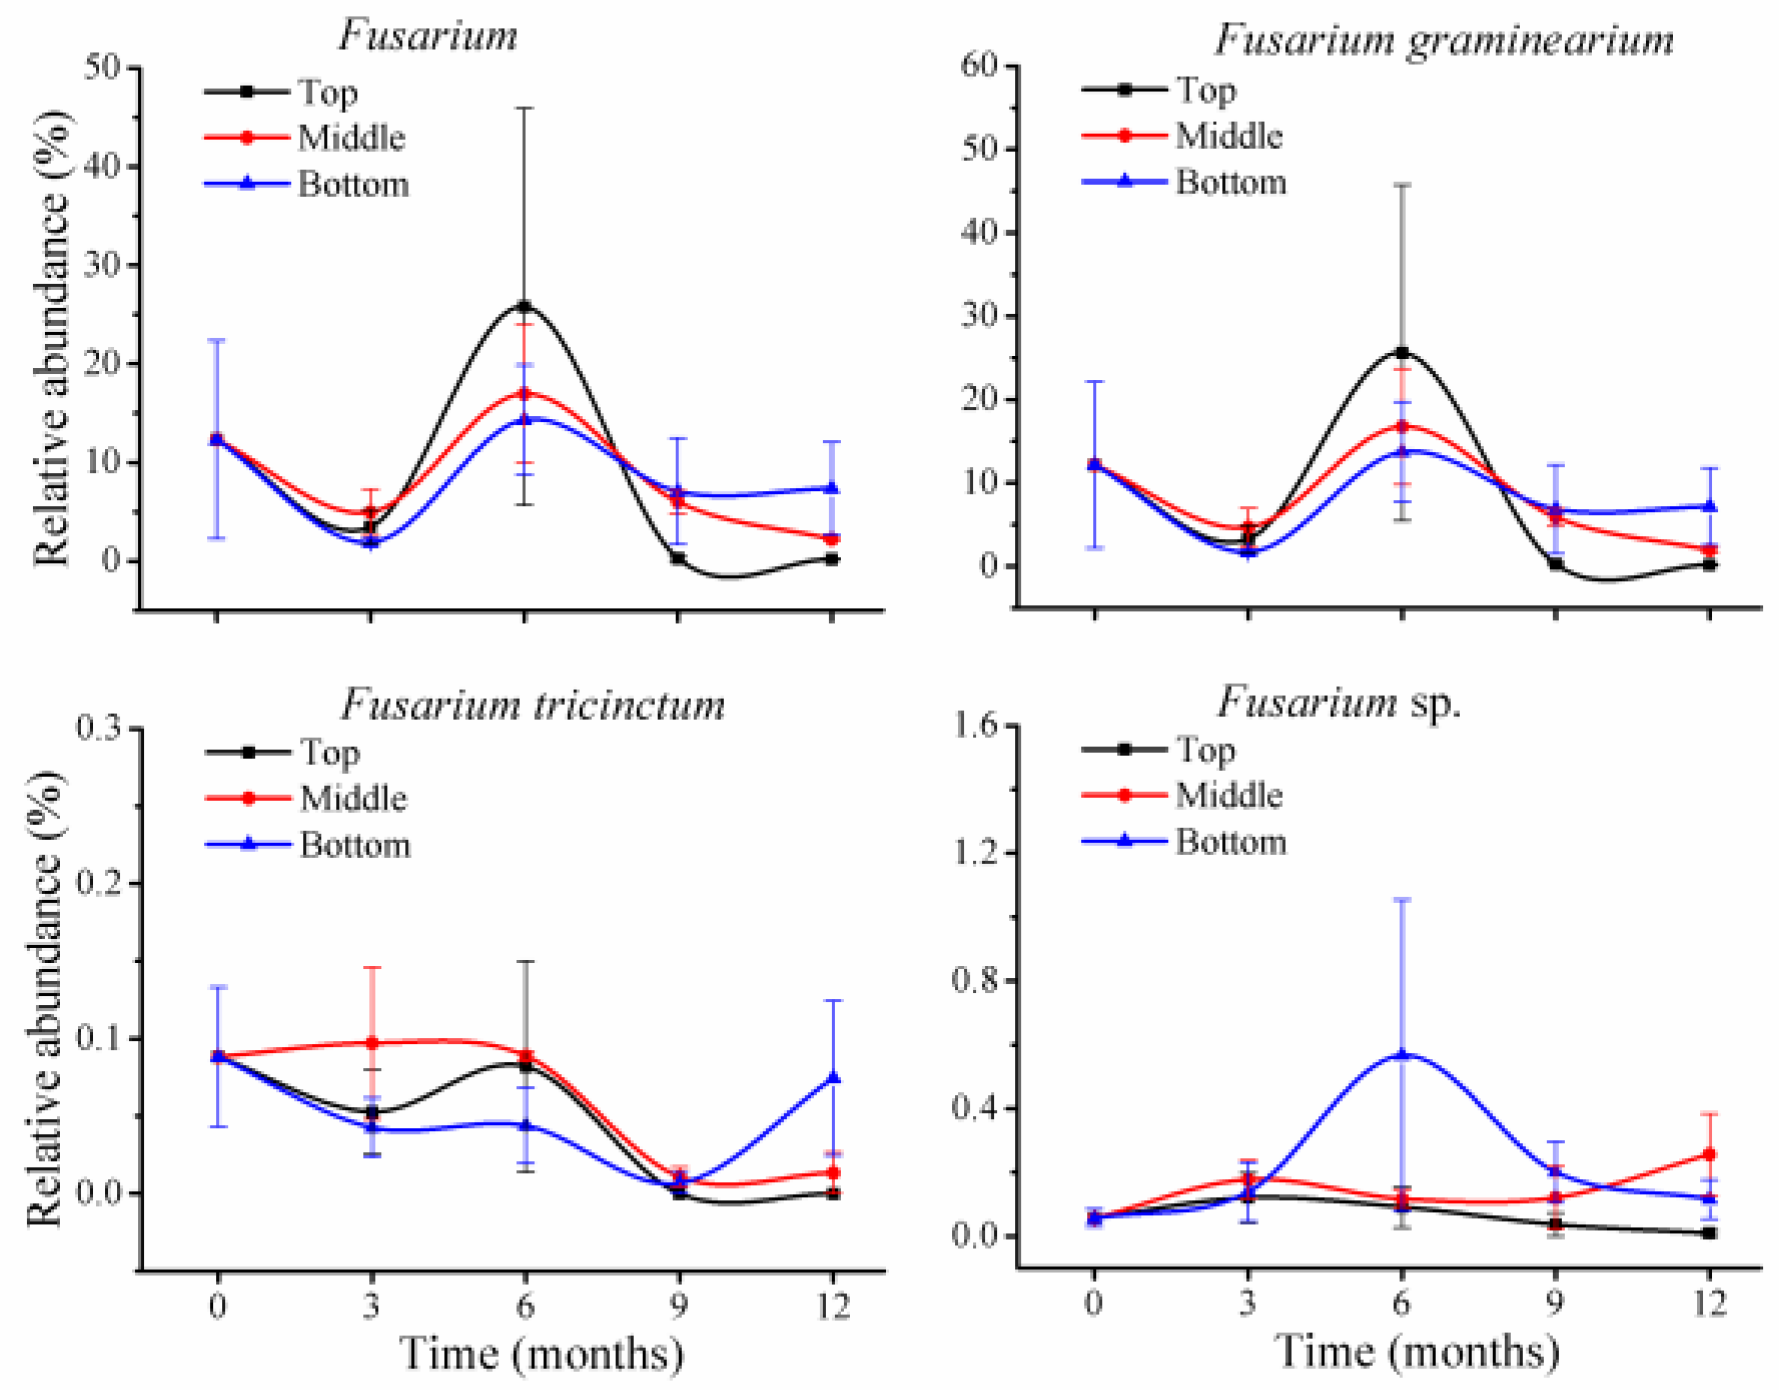
Fusarium included three species, with
F. tricinctum and another unclassified
Fusarium sp. at less than 0.1% (
Figure 4); in
Wallemia,
Wallemia sp. F53 was at 0.1% of relative abundance. Thus, variation patterns for these four species during storage are also the same as their genera shown above in
Figure 2.
Rhodotorula taiwanensis had 1% and
Blastobotrys terrestris had 0.1% of relative abundance at T
0; these were the only species from these genera. Thus, variations of these two species during storage are the same as for their genera (
Figure 2).
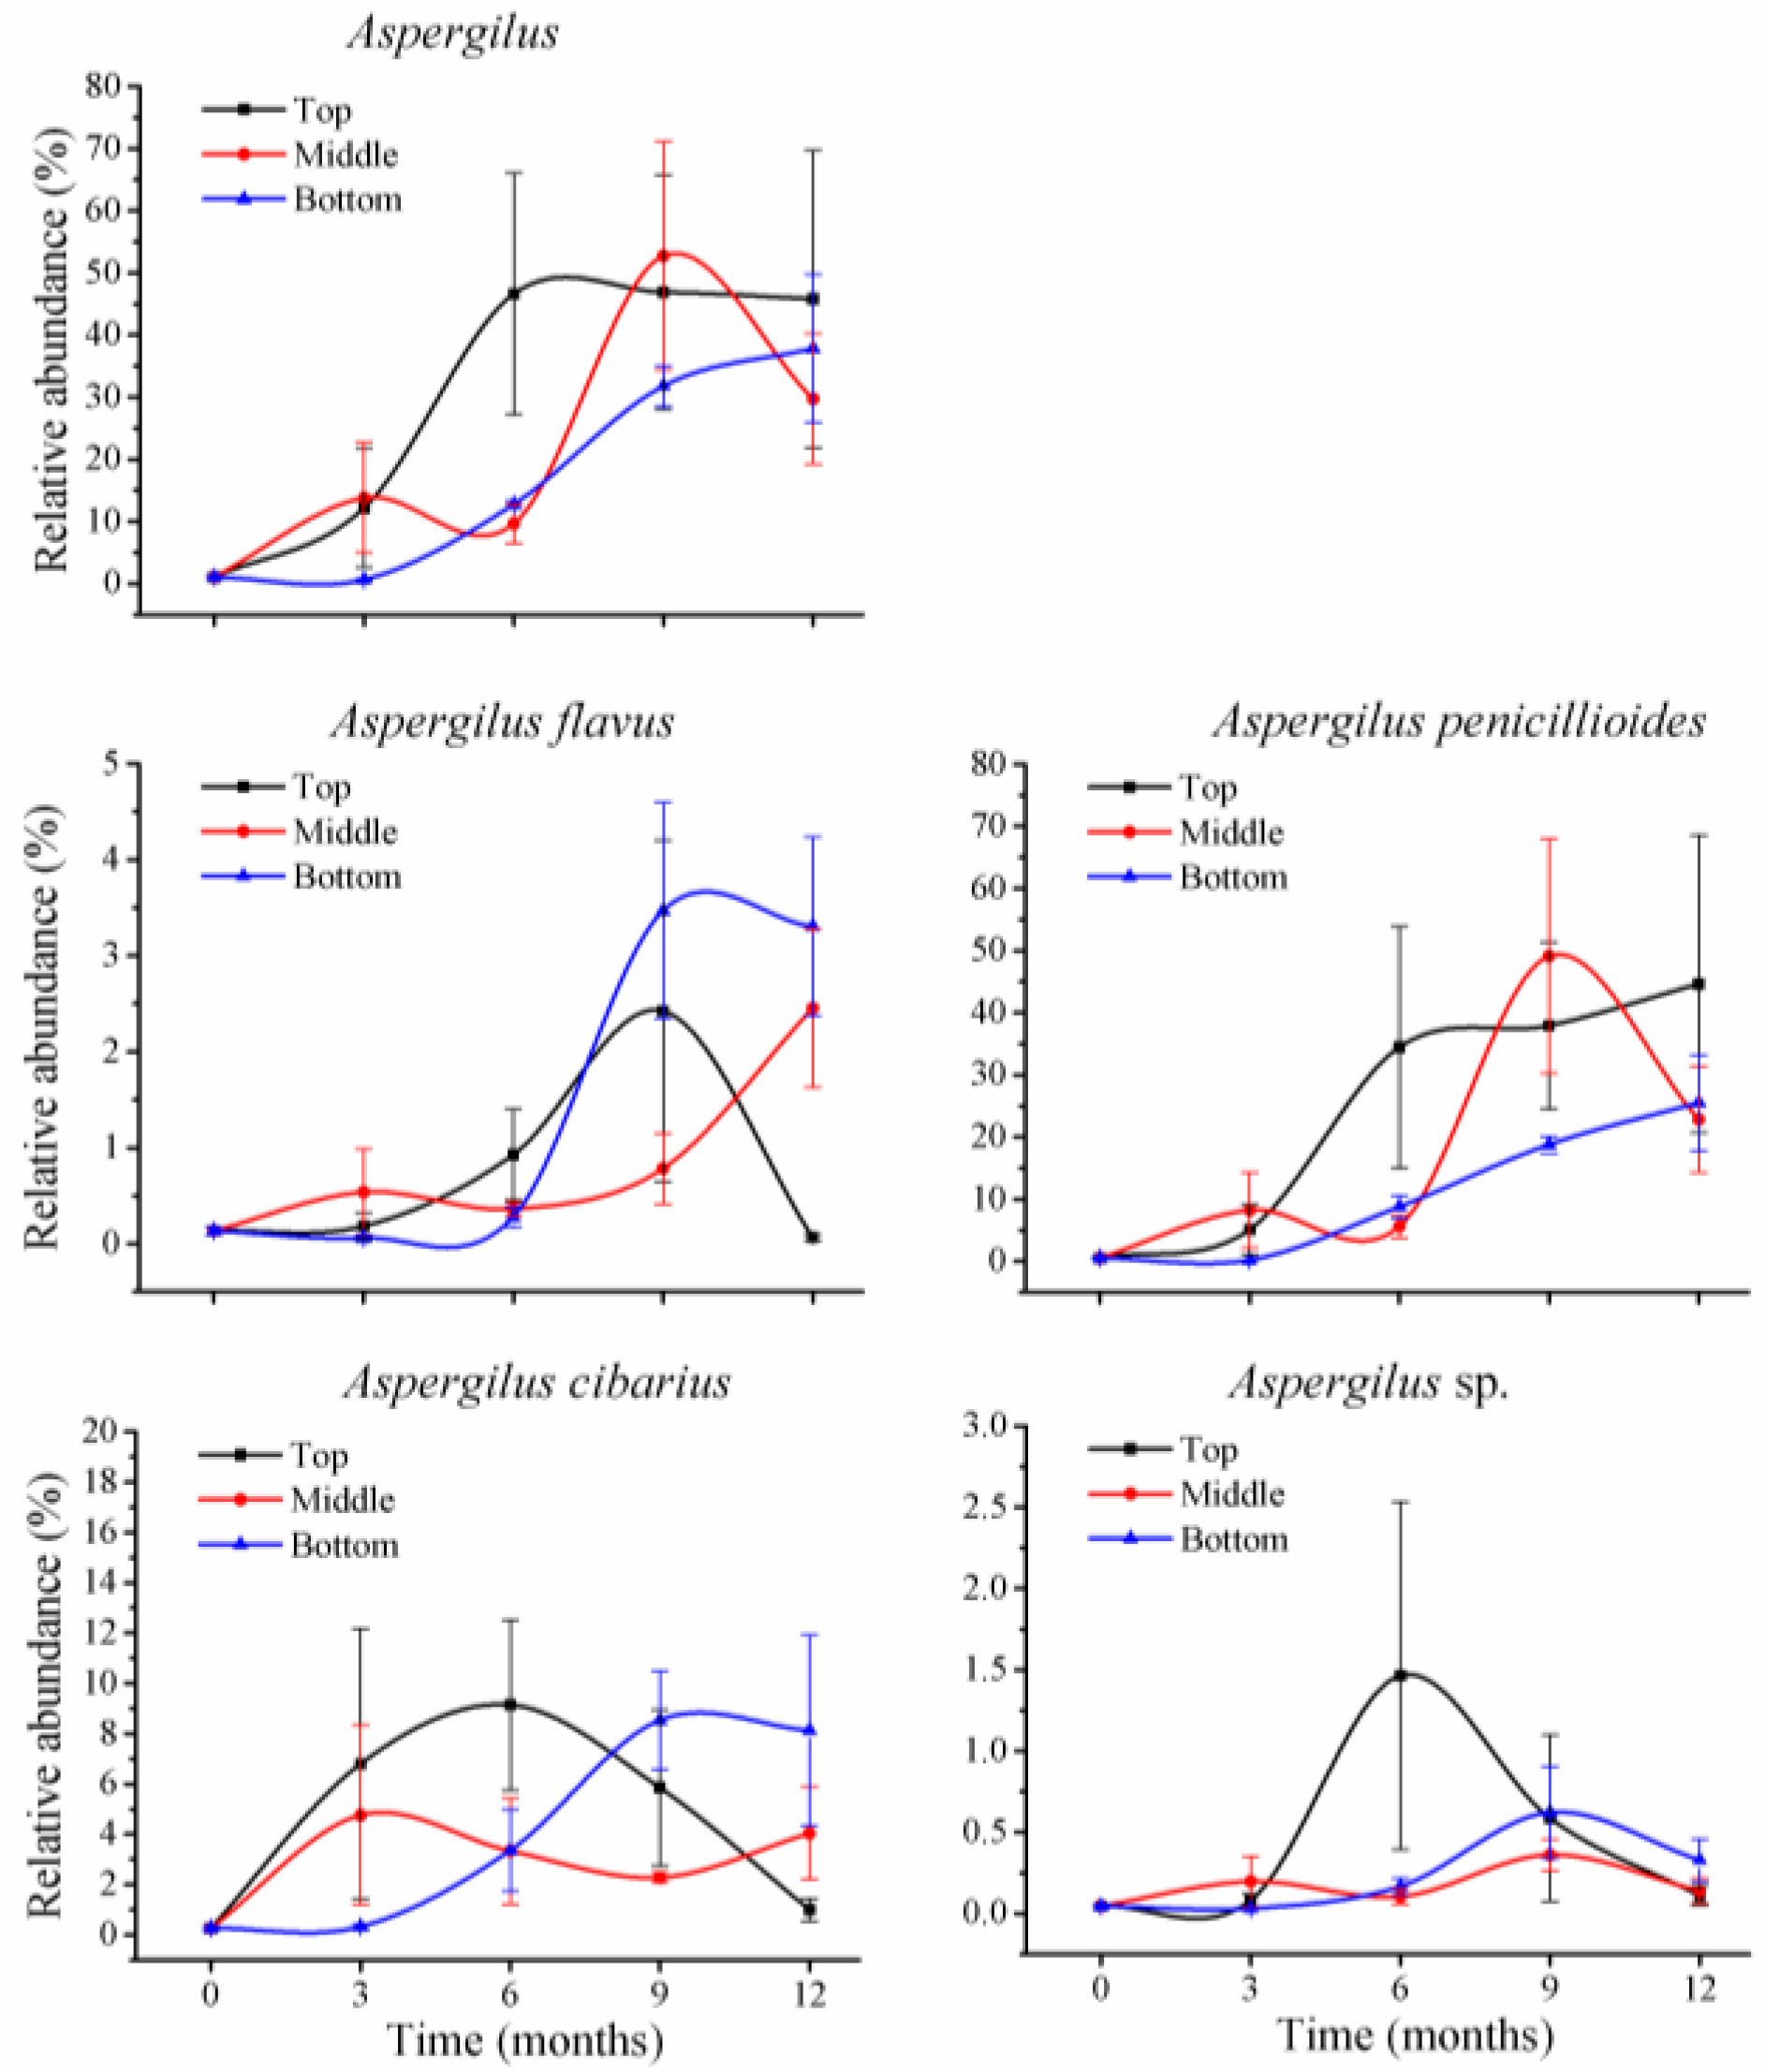
Within
Aspergillus, there were four species at less than 1% of relative abundance at T
0 (
Figure 5):
A. flavus (0.1%),
A. cibarius (0.3%),
A. penicillioides (0.5%), and one unclassified species (0.05%). During storage, abundance of the first three species was variable; the relative abundance for
A. flavus was 2% at 9 months in top positions, and at 12 months in middle positions, and 3% at 9 and 12 months in bottom positions, but was less than 1% of relative abundance in the remaining storage times.
A. cibarius was at 9% at 6 months and 5% at 9 months in top positions, and 2 to 5% (middle positions) and 6 to 9% (bottom positions) during months 3 to 12.
2.5. Bacterial Variation across Storage Time at Different Silo Positions
Based on sequencing the bacterial V3V4 regions, nine phyla were detected and six of them were classified, including Proteobacteria, Firmicutes, Cyanobacteria, Chloroflexi, Bacteroidetes, and Actinobacteria (
Figure S2). There were two predominant phyla, Firmicutes (6%) and Proteobacteria (92%), at T
0, that had different patterns of variation during storage. In top and middle positions, Firmicutes had substantial increases at 9 months (top, 67%; middle 26%) and 12 months (top, 46%; middle, 53%), but at the same positions, Proteobacteria had reduced relative abundance at 9 (top, 31%; middle, 71%) and 12 months (top, 51%; middle, 47%). Cyanobacteria and Chloroflexi had disappeared from top positions by 12 months.
There were 54 bacterial genera in the bacterial community that were classified, but around 90% of bacteria were unclassified (
Figure S3). Among classified bacteria, there were three predominant genera,
Bacillus (2%),
Paenibacillus (4%), and
Pseudomonas (3%) at T
0. During storage, a substantial increase in relative abundance was seen at 9 and 12 months for
Bacillus (36% and 4%),
Lactococcus (10% and 7%), and
Staphylococcus (14% and 28%) in top positions. In middle positions,
Lactococcus accounted for 18% at 9 months and
Bacillus for 48% at 12 months, whereas
Stenotrophomonas accounted for 21% in 6 months at bottom positions.
From 60 classified bacterial species, three species,
Bacillus cereus,
B. flexus, and
Pseudomonas viridiflava, each accounted for about 1% (
Figure S4). More than 95% were unclassified. During storage in top and middle positions,
B. cereus increased in relative abundance at 9 months (top, 36%; middle, 3%) and 12 months (top, 4%; middle, 15%); similarly,
Lactococcus garviease also increased at these two storage times.
Bacillus flexus, belonging to the phylum
Firmicutes, had a slight increase at 9 months (4%) and significantly increased at 12 months (32%) in middle positions. Thus, only a few bacterial species varied substantially at certain silo positions during storage.
2.6. Correlation of Toxigenic Fusarium and Aspergillus Species with Other Fungi
Significant correlations were seen between toxigenic fungi
Fusarium and
Aspergillus species with other fungi during storage (
Tables S3 and S4,
Figures S5 and S6). For instance, variation of
F. graminearium and
F. tricinctum were significantly positively correlated with
A. alternata,
Xylariales sp.,
Bulleromyces albus,
Hannaella sinensis,
Dioszegia zsoltii var.
yunnanensis, and
Pseudomonas viridiflava in all silo positions at all storage times. Variation in
A. flavus was significantly positively correlated with
Guehomyces pullulans,
Villosiclava virens, and
A. cibarius, but negatively correlated with
Rhodotorula taiwanensis. In addition, the variation of
A. cibarius and
A. penicillioides were significantly negatively correlated with
R. taiwanensis.
2.7. DON and NIV Variation across Storage Time and Silo Positions
Trichothecene mycotoxins were extracted from all 39 wheat samples and five mycotoxins, NIV, DON, 3A-DON, 15A-DON, and FX, were chemically analyzed. Two mycotoxins, DON (2652 μg/kg) and NIV (436 μg/kg), were detected in wheat grains at T
0 (
Figure 6). After three months of storage, the two mycotoxins accumulated to higher amounts in all three silo positions, with increases of 17–34% for DON (3090 to 3552 μg/kg) and 7–13% for NIV (465 to 490.5 μg/kg). Mycotoxin amounts varied at different silo positions during subsequent storage time points. In top positions, DON remained constant from 6 to 12 months (2957 μg/kg), whereas NIV declined at 9 months (427 μg/kg) and reached a peak at 12 months (537 μg/kg). In the other two positions, DON increased at 6 months (middle, 4168 μg/kg; bottom, 3784 μg/kg), declined at 9 months (middle, 3554 μg/kg; bottom, 3039 μg/kg), and increased again at 12 months (middle, 3958 μg/kg; bottom, 3820 μg/kg); these variations indicated significant increases of 43% (bottom) to 57% (middle) at 6 months and 44% (bottom) to 50% (middle) at 12 months compared with T
0. NIV had the highest amounts at 12 months in all positions, with increases of 19–24%. Thus, the two mycotoxins increased during storage, but with different patterns, and DON increased more than NIV.
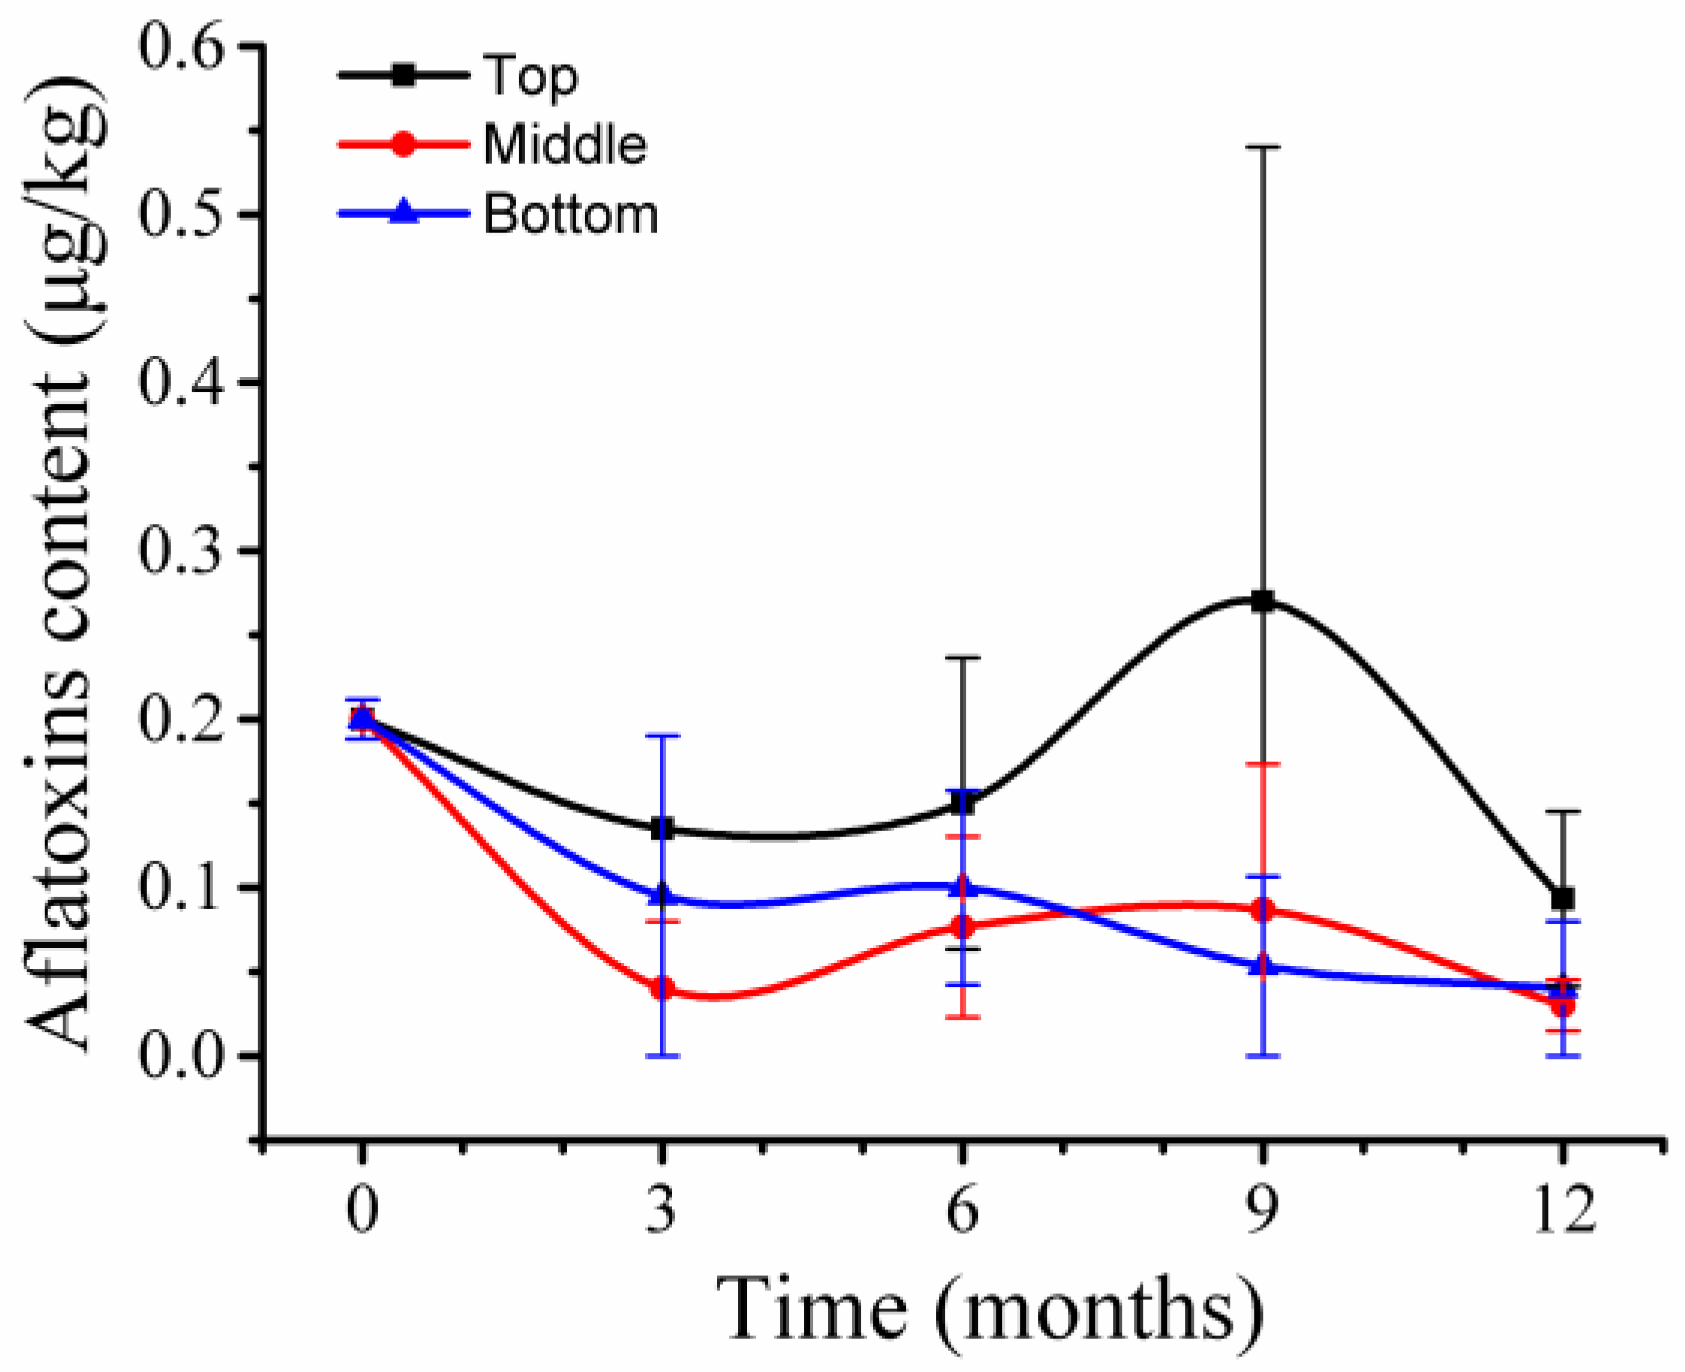
2.8. Aflatoxin Variations across Storage Time at Different Silo Positions
Aflatoxins were extracted from 39 wheat samples and four types of aflatoxins—AFB1, AFB2, AFG1, and AFG2—were analyzed by LC/MS. Only AFG2 was detected at a level of 0.2 μg/kg in the samples at T
0 (
Figure 7). During storage, wheat samples at 9 months in top positions had the highest level of AFG2, 0.27 μg/kg, while other wheat samples had AFG2 at levels ranging from 0.03 μg/kg to 0.1 μg/kg. Thus, a low level of aflatoxins which are lower than regulatory limits [
22] was present in wheat grains before and after storage.
3. Discussion
Cereal grains, such as wheat, are currently widely stored under natural conditions with no controlled facilities in many developing countries, including China, where around 40% of grains are stored in small-scale silos in farmers’ houses. Investigation of microbiomes and associated mycotoxins of wheat grains in small-scale silos at room temperature may provide information that can be used to develop measures to prevent mycotoxins from entering food/feed chains. Metagenomic analyses of fungal ITS2 sequences and bacterial V3V4 sequences from microbiomes revealed the presence of at least 105 fungal species and 60 bacterial species on wheat grains before storage, which underwent substantial variations across times and silo positions during storage. This is the first known report of variation in microbiomes and associated mycotoxins on wheat grains during storage based on BIPES.
Impacts of silo position on microbiome variation during storage were significant, especially for fungal communities. The numbers of fungi declined in top positions, but increased in the other two positions (
Figure 1,
Figure 2 and
Figure 3); these changes then affected the relative abundances of individual species. It is likely that ventilation at top positions (around 30 cm from the top of the silo) is better than at middle and bottom positions; a silo microenvironment that includes ventilation may, thus, be unfavorable for growth and propagation of fungal species [
6].
The toxigenic fungus
F. graminearium was among the most variable species, with relative abundance that was reduced during the storage period; however, mycotoxins produced by
F. graminearium increased. This phenomenon was particularly obvious at 3 months of storage in all three positions, with four- to six-fold reduction of fungi and 7–34% increase of mycotoxins. This variation may reflect complexity of the interaction between wheat and
F. graminearium. Wheat cells could not metabolize
Fusarium mycotoxins, and necrotrophic
Fusarium fungi that already colonized wheat grains in the field continuously produced mycotoxins, leading to the accumulation of mycotoxins in wheat grains. Although the storage environment in top positions does not favor
Fusarium growth, the reduction of colonizing
Fusarium fungi on wheat grains took place gradually while mycotoxins steadily accumulated, giving rise to a steady increase of mycotoxins. After storage for 9 and 12 months in top positions,
Fusarium fungi left on wheat grains were at very low levels, while amounts of mycotoxins remained constant. On the other hand, in middle and bottom positions, there was a high relative abundance of toxigenic fungi, and mycotoxins accordingly increased after 6 months, especially in the middle positions, where even higher amounts of mycotoxins were accumulated. These results provided more support for ventilation as an important factor for
Fusarium fungi, whose relative abundance is closely associated with mycotoxin amounts in wheat grains during storage. Taken together, the present results suggested that several factors should be considered when storing wheat grains under natural conditions in regions similar to Wuhan: (i) heights of wheat grains in silos during storage should be about 70 cm or lower to provide a favorable ventilation environment; (ii) before storage, wheat grains should have levels of mycotoxins that are less than 750 μg/kg in order to avoid accumulation to the 1000 μg/kg limit set by regulatory office because mycotoxins could increase up to 34% during three months of storage; and (iii) if the heights are higher than 70 cm and storage is longer than three months, the amounts of mycotoxins in wheat before storage should be lower than 572 μg/kg (
Figure 6).
Aspergillus fungi accounted for a low portion before storage and increased their relative abundance during storage. However, toxigenic
A. flavus had low relative abundance and the predominant increase occurred for
A. cibarius, a non-toxigenic
Aspergillus species (
Figure 5). Thus, aflatoxins were at very low levels before and during storage. These results indicated that during storage, toxigenic
Aspergillus species are not predominant fungi, and aflatoxins are not the main mycotoxins in wheat grains under these conditions.
Bacteria in wheat grains detected by V3V4 sequencing were mainly taxonomically identified at the phylum level, and the vast majority of bacteria detected were unclassified at genus and species levels. Thus, it is currently difficult to analyze individual bacterial species and their impacts on the microbiome/mycotoxins on wheat grains during storage. These results implied that conventional methods of plating bacterial cells [
23,
24,
25] might only detect a very small proportion of the active bacteria that are present on wheat grains. Therefore, more efforts may be required to characterize bacterial communities on wheat grains during storage using BIPES with other genome data of bacteria.
Correlation analyses suggest that some species of fungi and bacteria that can grow on wheat grains may have similar features, or that they interact each other to grow. How this interaction takes place requires further investigation.
It should be noted that the current study used a rinsing method [
26,
27] to isolate DNA for analysis of grain surface microbiome, and this may not isolate all fungal or bacterial species from the grains, especially for species from endophytes or cryptic infection. Thus, a higher fungal and bacterial diversity would be present in the stored wheat grains.
The current study revealed that, in wheat grains, F. graminearum was the predominant toxigenic fungal species, and the associated mycotoxins DON and NIV were the predominant mycotoxins. However, the fungal species substantially decreased, and mycotoxins significantly increased during storage. In the top positions of silos, these two mycotoxins and the fungi that produce them were all lower than at the other two silo positions. Aflatoxins and their producers, Aspergillus species, were low before and during storage. These results provide information for storage of wheat grains to reduce mycotoxin loads for food/feed products and for further studies on the mechanisms regulating variation of the microbiome and mycotoxins during storage of wheat.
4. Materials and Methods
4.1. Wheat Grain Samples
Wheat grains (variety: Wanmai68) were harvested in June 2015 from Anhui province in China, an area with frequent historical FHB epidemics. Grains were treated with ozone to kill insects as described previously [
26,
27], placed in three silos (I, II, and III) at 1000 kg per silo, and stored for a period of 12 months at room temperature in Wuhan. Each circular silo was 150 cm high (wheat grains reached 140 cm in each silo), with a diameter of 110 cm. Wheat samples obtained from the first day of storage were designated as T
0 (1 August 2015), and one sample was obtained from each silo with a sampling apparatus according to a protocol [
28]. After storage for 3, 6, 9 and 12 months, wheat samples were taken from three positions of each silo, top (110 cm from bottom, T), middle (70 cm from bottom, M), and bottom (30 cm from bottom, B), and the samples were named as 3T/M/B, 6T/M/B, 9T/M/B, and 12T/M/B. In each silo position, five samples were taken and combined as one sample (1 kg), giving rise to one sample for each silo position at one time. In total, 39 wheat samples were obtained and stored at −20 °C until use.
4.2. DNA Extraction from Microbiomes of Wheat Grains
One hundred grams of wheat grains from each sample were washed in 100 mL sterilized water. The resulting liquid was collected and vacuum-filtered through 0.22 um filters [
27]. The filters containing microbiomes were placed in 5 mL tubes and stored at −20 °C. DNA from the microbiome on the filters was extracted with the MoBio Power Water DNA Isolation Kit (MoBio Laboratories, Inc., Carlsbad, CA, USA) according to the manufacturer’s instructions. The extracted DNA was suspended in sterile deionized water, DNA quantity was measured by spectrophotometric quantification in a NanoDrop 1000 (Thermo Fisher Scientific, Inc., Newark, DE, USA), and DNA quality was assayed by agarose gel electrophoresis. Extracted DNA was stored at −80 °C.
4.3. PCR Amplification and Sequencing of Fungal ITS2 and Bacterial V3V4
The universal fungal primers (annealing temperature of 50 °C) ITS3 (5′-GCATCGATGAAGAACGCAGC-3′) and ITS4 (5′-TCCTCCGCTTATTGATATGC-3′) were used to amplify ITS2 regions of fungal rDNA. Bacterial universal primers (annealing temperature of 50 °C) 341F (5′-ACTCCTACGGGAGGCAGCAG-3′) and 806R (degenerate primer) (5′-GGACTACHVGGGTWTCTAAT-3′) were used to amplify the V3V4 regions of bacterial rDNA. PCR reactions were carried out in a total reaction volume of 50 μL consisting of 5 μL KOD plus buffer, 5 μL dNTP, 2 μL MgSO4, 0.5 μM of forward and reverse primers, and 10 ng of template DNA. The PCR amplification program consisted of initial heating to 95 °C for 5 min, 35 cycles of denaturation at 95 °C for 20 s, annealing at 50 °C for 30 s, and extension at 68 °C for 60 s, followed by a 10 min extension at 68 °C. The AxyPrepTM DNA Gel Extraction Kit (Axygen, Jiangsu, Suzou, China) was used to purify the amplified products. Amplicons were quantified, and sequencing libraries were generated using NEB Next Ultra DNA library Prep Kit for Illumina (New England Biolabs, Inc., Ipswich, MA, USA). The libraries were subsequently sequenced on an Illumina MiSeq PE250 platform at the Beijing Genomics Institute (BGI, Wuhan, China).
4.4. DNA Sequence Analysis and Bioinformatics
FLASH was used to merge the paired-end reads to a tag from the high quality clean reads. The tags were clustered to operational taxonomic unit (OTU) by scripts in the program USEARCH (v7.0.1090, Sonoma, CA, USA, 2014), detailed as follows: (i) tags were clustered into OTUs with a 97% threshold using UPARSE, and unique, representative OTU sequences were obtained; (ii) chimeras were filtered out using UCHIME (v4.2.40, Sonoma, CA, USA, 2017), and the 16S rDNA and ITS2 sequences were screened for chimeras by separate mapping to the gold database (v20110519) or UNITE (v20140703), and de novo chimera detection was done for 18S rDNA sequences; and (iii) all tags were mapped to each OTU representative sequence using USEARCH GLOBAL, and then the tag numbers of each OTU in each sample were summarized in an OTU abundance table. OTU representative sequences were taxonomically classified using Ribosomal Database Project Classifier (RDP, v.2.2, East Lansing, MI, USA, 2016) trained on the Greengenes database, using 0.8 confidence values as cutoffs. 16S rDNA was used for bacterial and archaeal communities (Greengenes, V201305, Berkeley, CA, USA, 2013), and ITS was used for the fungal community (UNITE, Version6, Vanemuise, Tartu, Estonia). Alpha diversity was used to analyze complexity of species diversity for a sample based on several indices, including observed species, Chao1, ACE, and Shannon and Simpson indexes. Beta diversity analysis was used to evaluate differences of samples in terms of their species complexity. Beta diversity analysis was conducted in QIIME (v1.80, Twin Cities, MN, USA, 2017). Correlation analysis was performed using Origin (v9.1) in the microbiome. Differences were considered significant at p < 0.05.
4.5. Quantification of Trichothecenes
Stored wheat grains (5 grams) were ground to a powder. Crude mycotoxins were extracted as previously described [
29,
30]. For each sample, ground grains were extracted three times with 20 mL extraction solvent (acetonitrile/water = 84:16,
v/v). Extracts were cleaned-up using a silica gel cartridge and a MultiSep 211 column (Romer Labs, Washington, MO, USA) before analysis. Gas chromatography-mass spectrometry analyses (GC-MS) of DON, NIV and their derivatives were performed as described previously [
28]. Standards for DON, 3-acetyldeoxynivalenol (3A-DON), 15-acetyldeoxynivalenol (15A-DON), fusarenon-X (FX), and NIV were purchased from Sigma (St. Louis, MO, USA).
4.6. Determination of Aflatoxins
Ground wheat samples (2 grams) were placed into 50 mL centrifuge tubes, and 8 mL of acetonitrile/water/methanoic acid solution (80:19:1,
v/v/v) were added for extraction of crude mycotoxins as previously described [
31,
32,
33]. After vortexing for 2 min, samples were subjected to ultrasonication for 40 min, followed by centrifuging at 4000 rpm for 5 min. Then, 2 mL of the supernatant were transferred into a screw cap test tube containing 150 mg anhydrous MgSO
4 and 1 mL hexane. The mixture was immediately shaken for 2 min. The hexane layer was removed after centrifugation at 4000 rpm for 5 min, and the remaining solution was evaporated to dryness at 50 °C under a stream of nitrogen gas. The residue was re-dissolved in a 1 mL acetonitrile/water solution (20:80,
v/v). The mixture was filtrated through a 0.22 μm nylon filter and four aflatoxins—aflatoxin B1 (AFB1), aflatoxin B2 (AFB2), aflatoxin G1 (AFG1), and aflatoxin G2 (AFG2)—were measured using ultra-high performance liquid chromatography-tandem mass spectrometry (UHPLC-MS/MS) [
31,
32,
33]. Standards for AFB1, AFB2, AFG1, and AFG2 were purchased from Alexisa (San Diego, CA, USA).
4.7. Climatic Data
During the storage period, climatic data, such as temperature (°C) and RH (Relative humidity %), were recorded monthly in the regions of the experiment. Daily mean temperature is the average value of temperature at 2:00, 8:00, 14:00, and 20:00 each day. Monthly mean temperature is the average value of daily mean temperature in 1 month. Three monthly mean temperature is the average value of daily mean temperature in 3 months. The calculation of daily mean RH, monthly mean RH and three monthly mean RH is similar with temperature. The temperature and RH in storage areas were shown in
Figure S7.
4.8. Statistical Analyses
The correlation coefficient analysis of fungi was conducted in OriginPro 9.1 (OriginLab Corporation, Northampton, MA, USA) software that was evaluated by the Pearson correlation. Differences were considered significant at p < 0.05.

 ,
, 


