Oxygen Consumption Rate Analysis of Mitochondrial Dysfunction Caused by Bacillus cereus Cereulide in Caco-2 and HepG2 Cells

 , , and
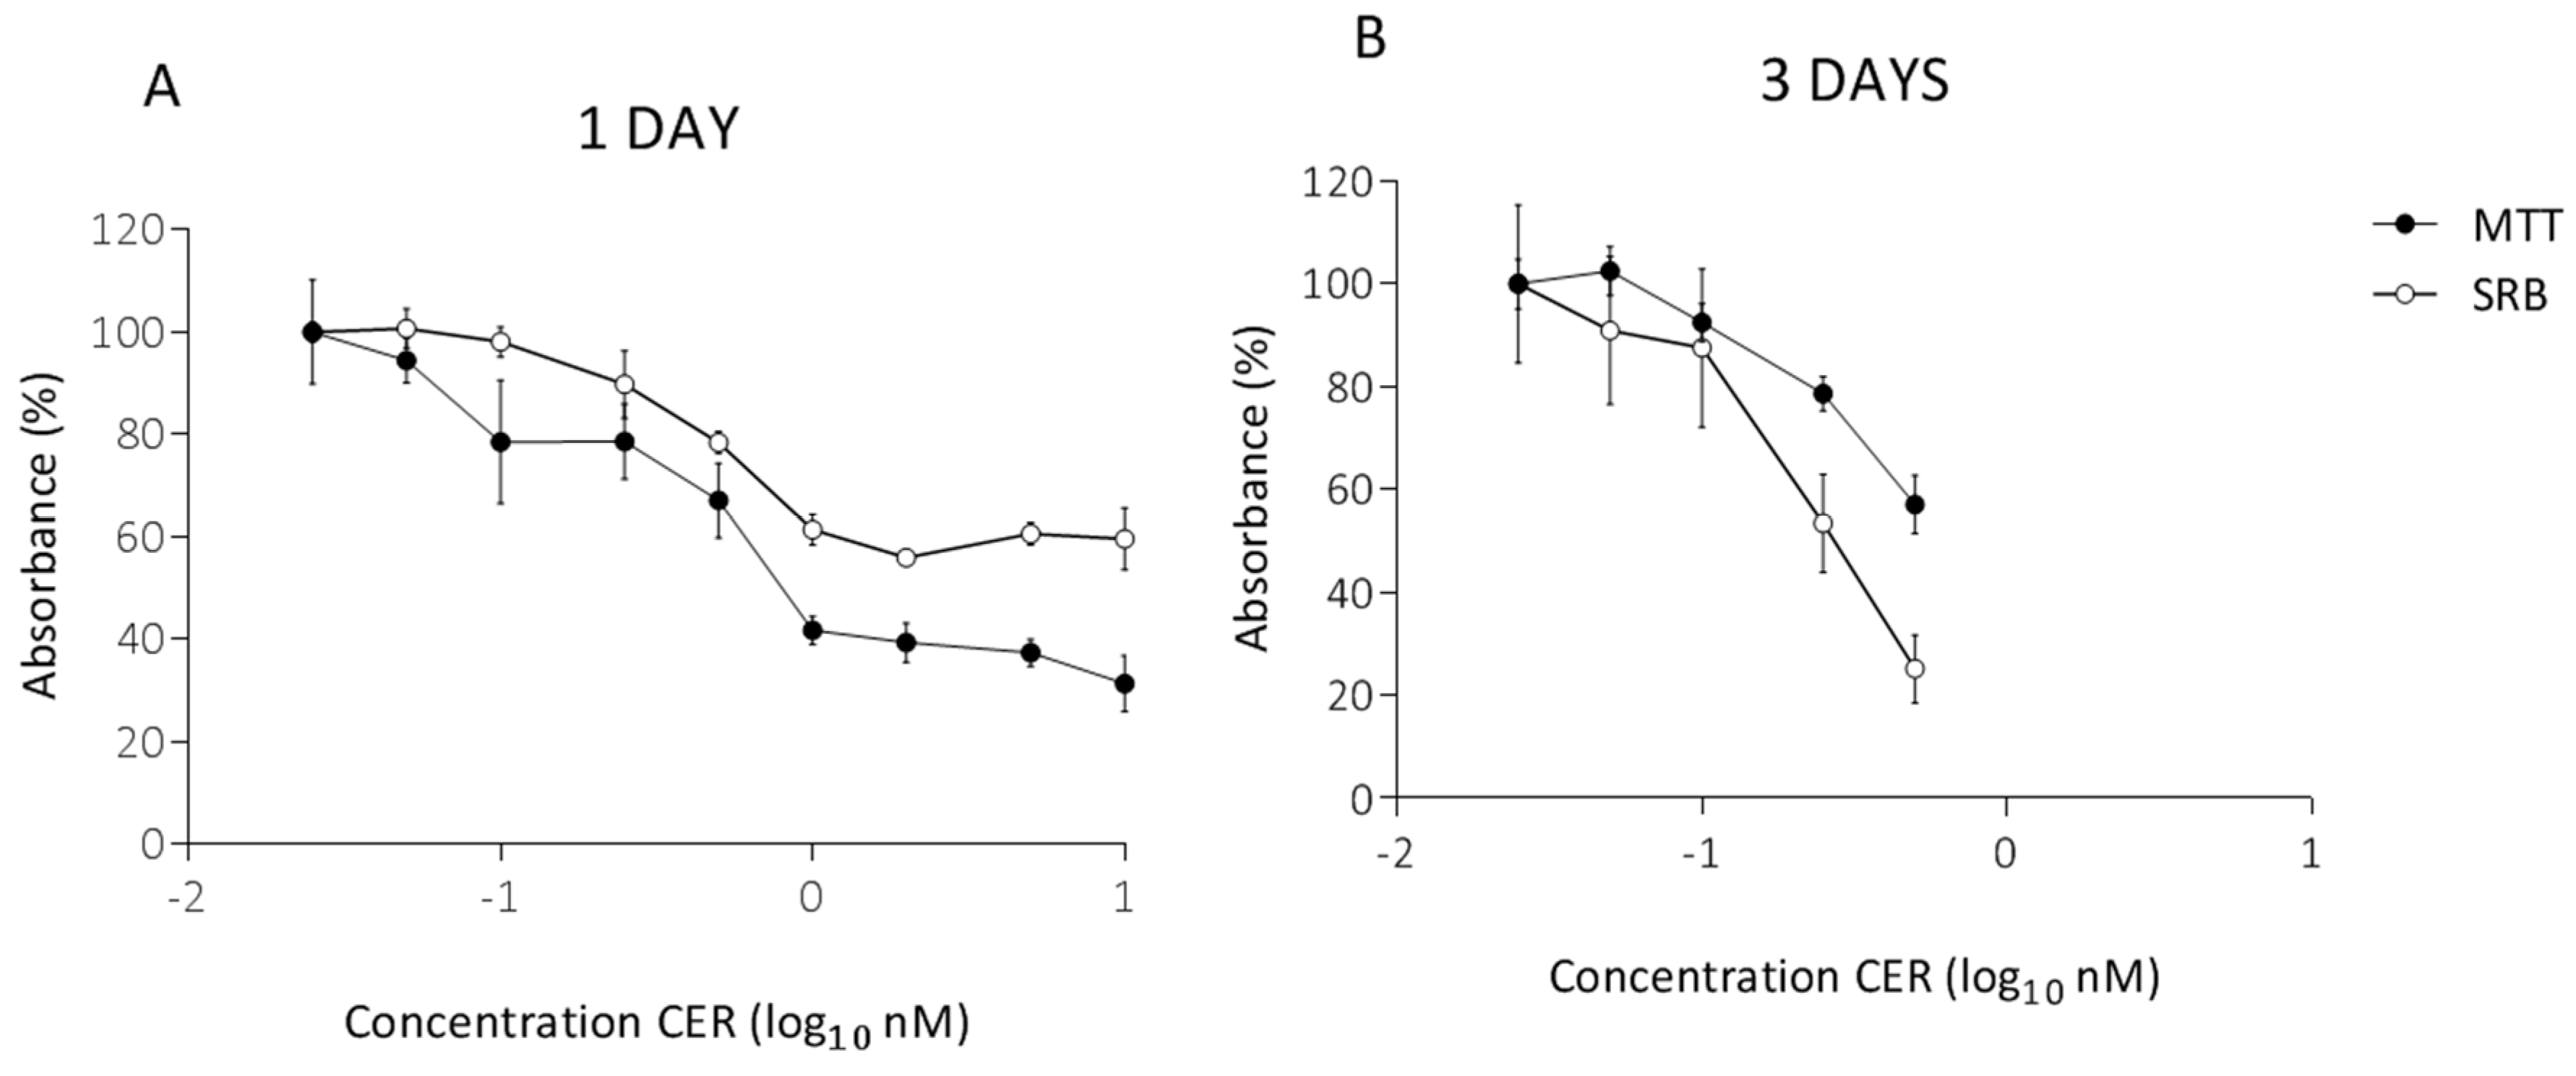
Abstract
:1. Introduction
2. Results
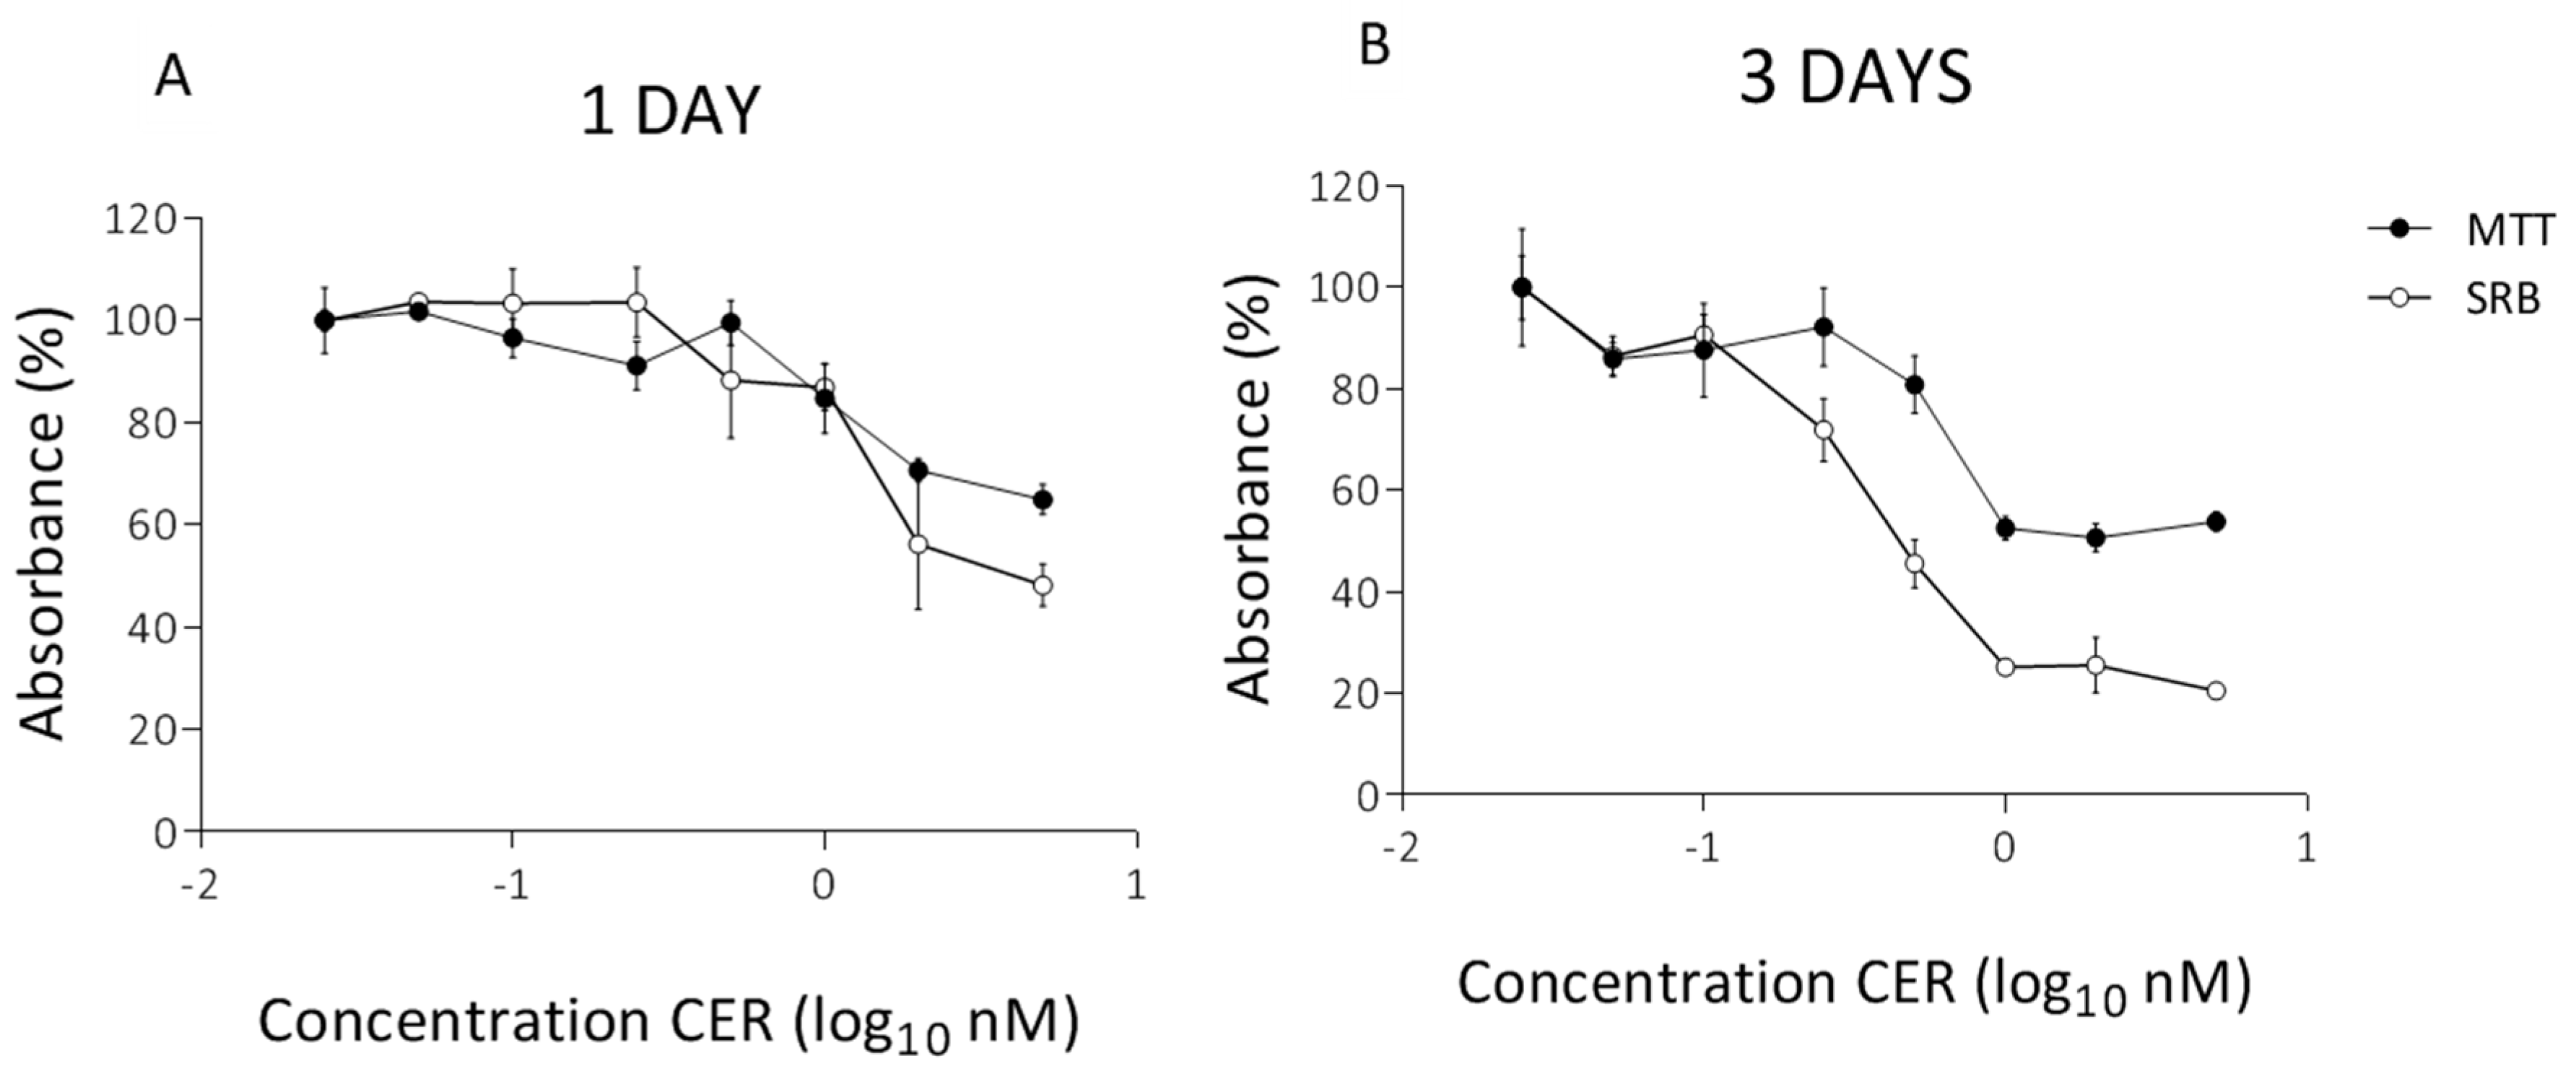
2.1. Determination of Subacute Concentrations of CER on Caco-2 and HepG2 Cells
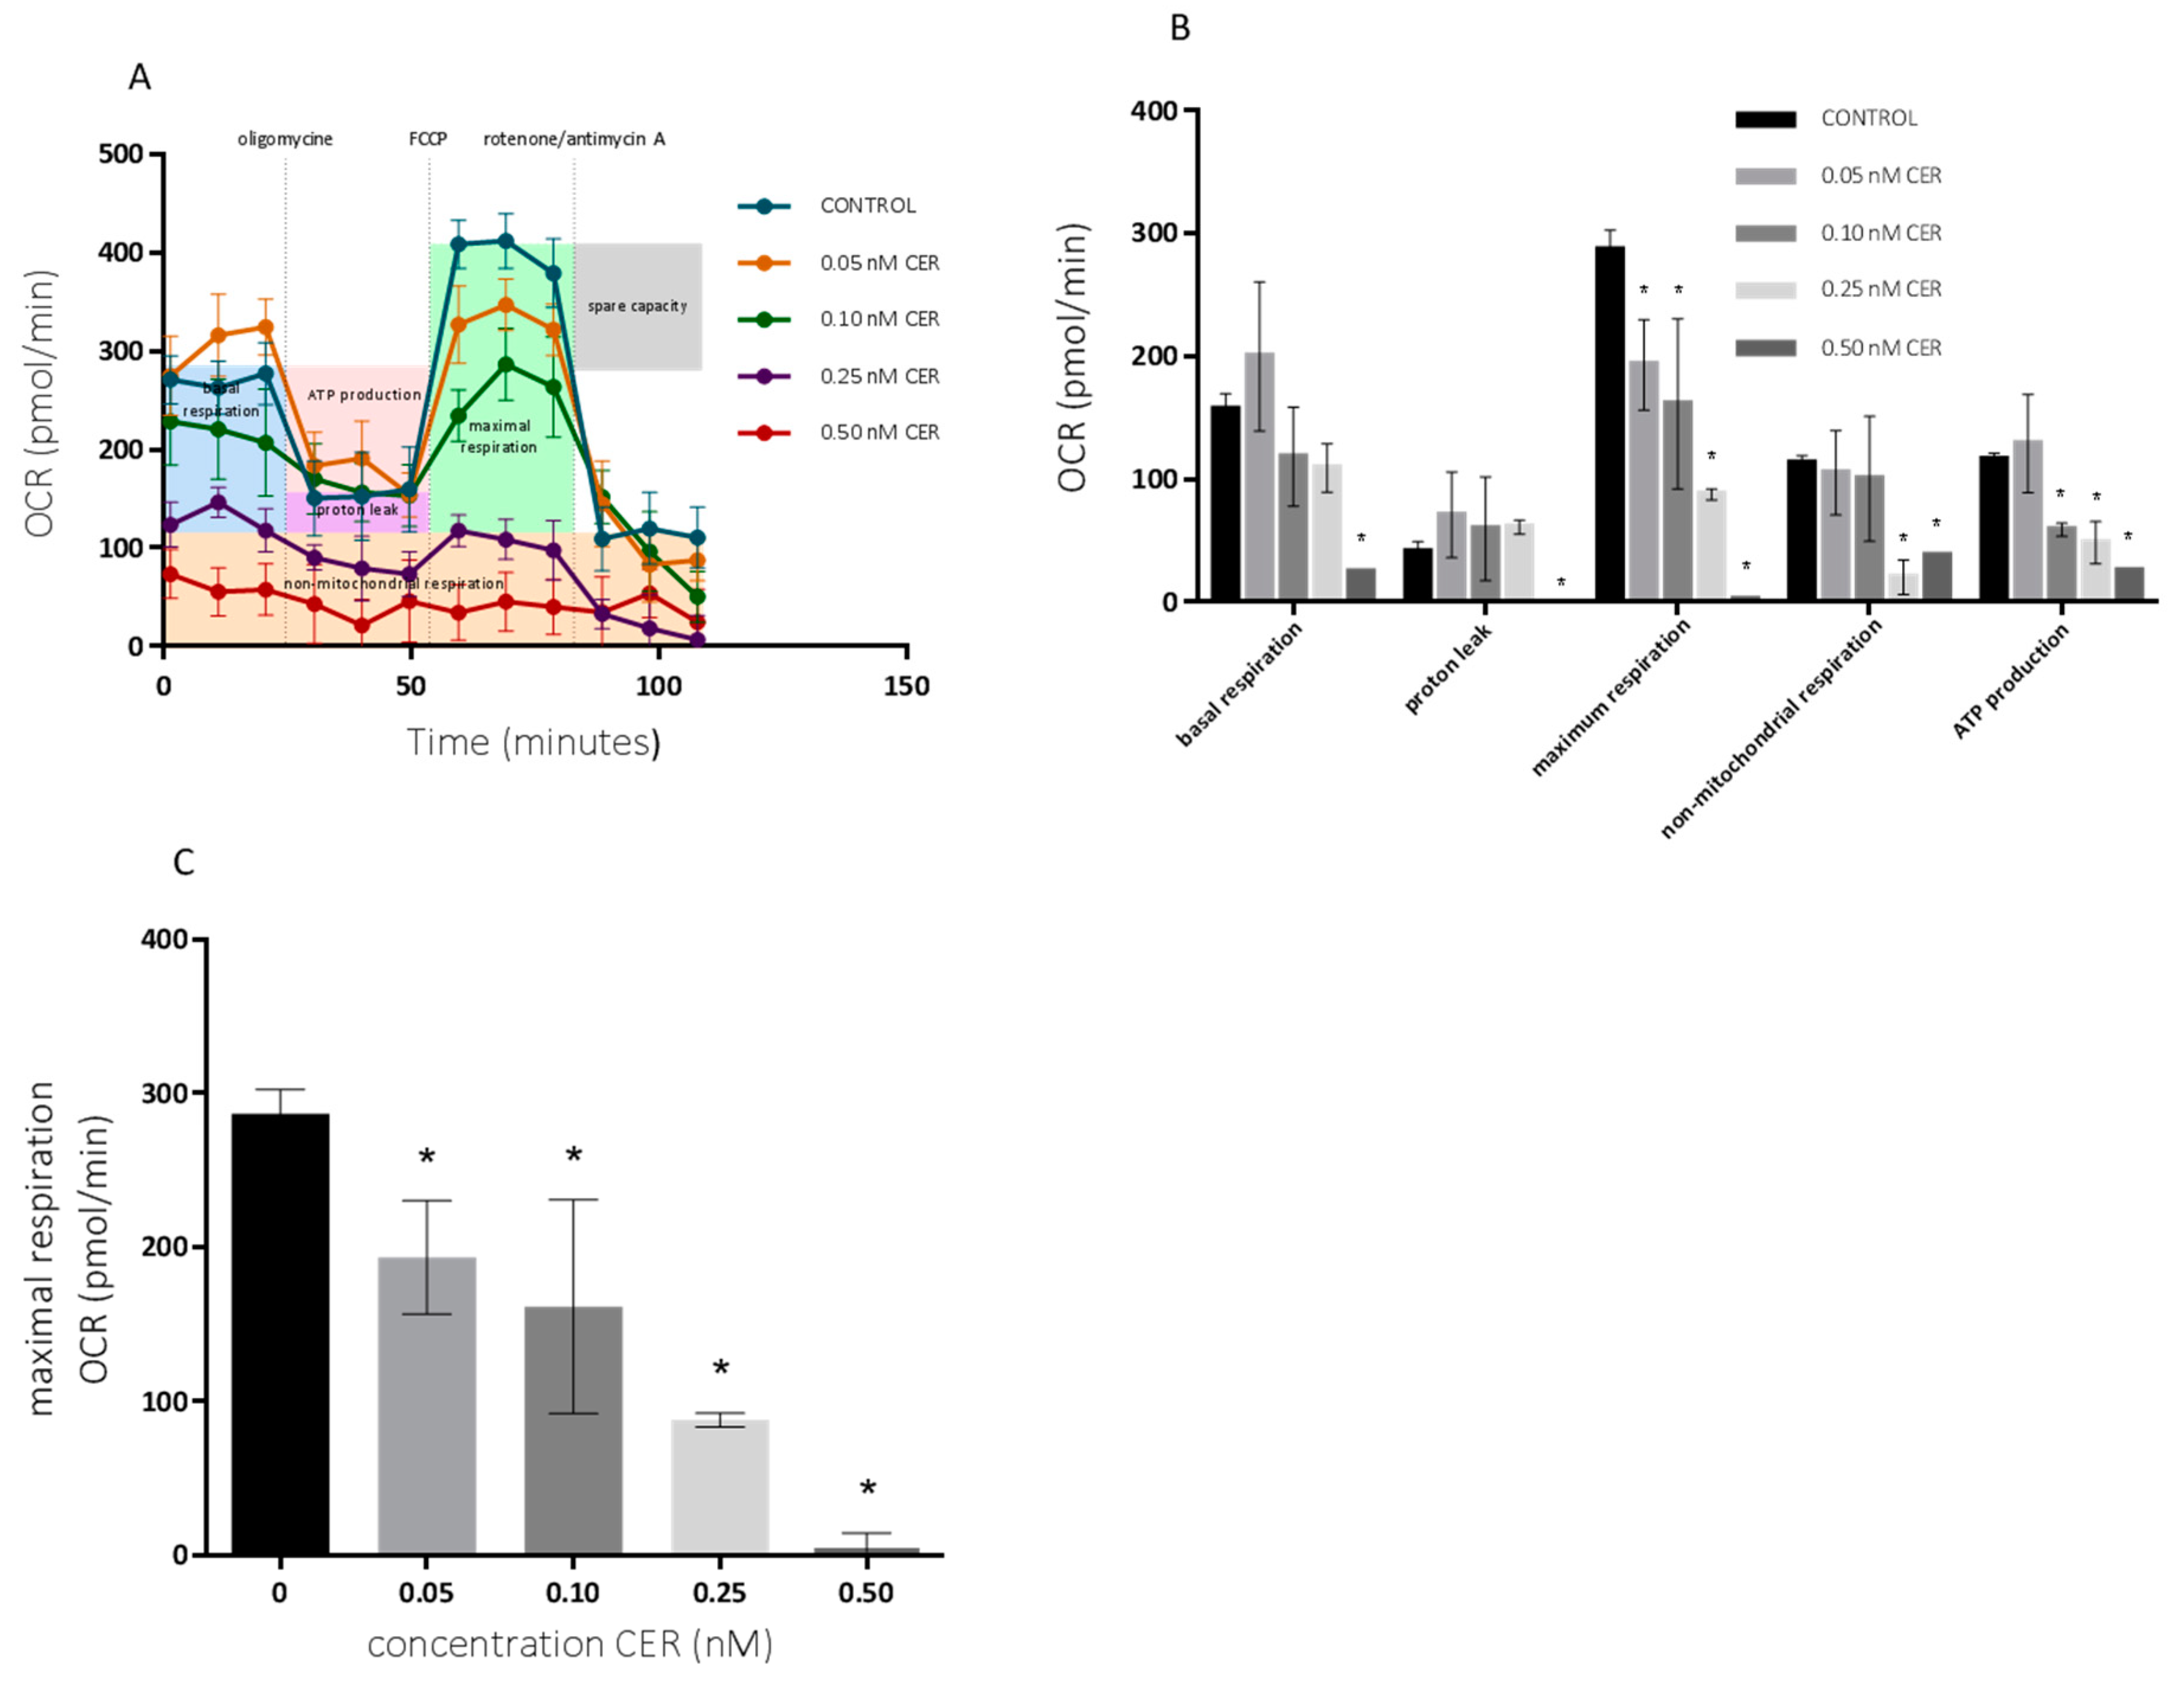
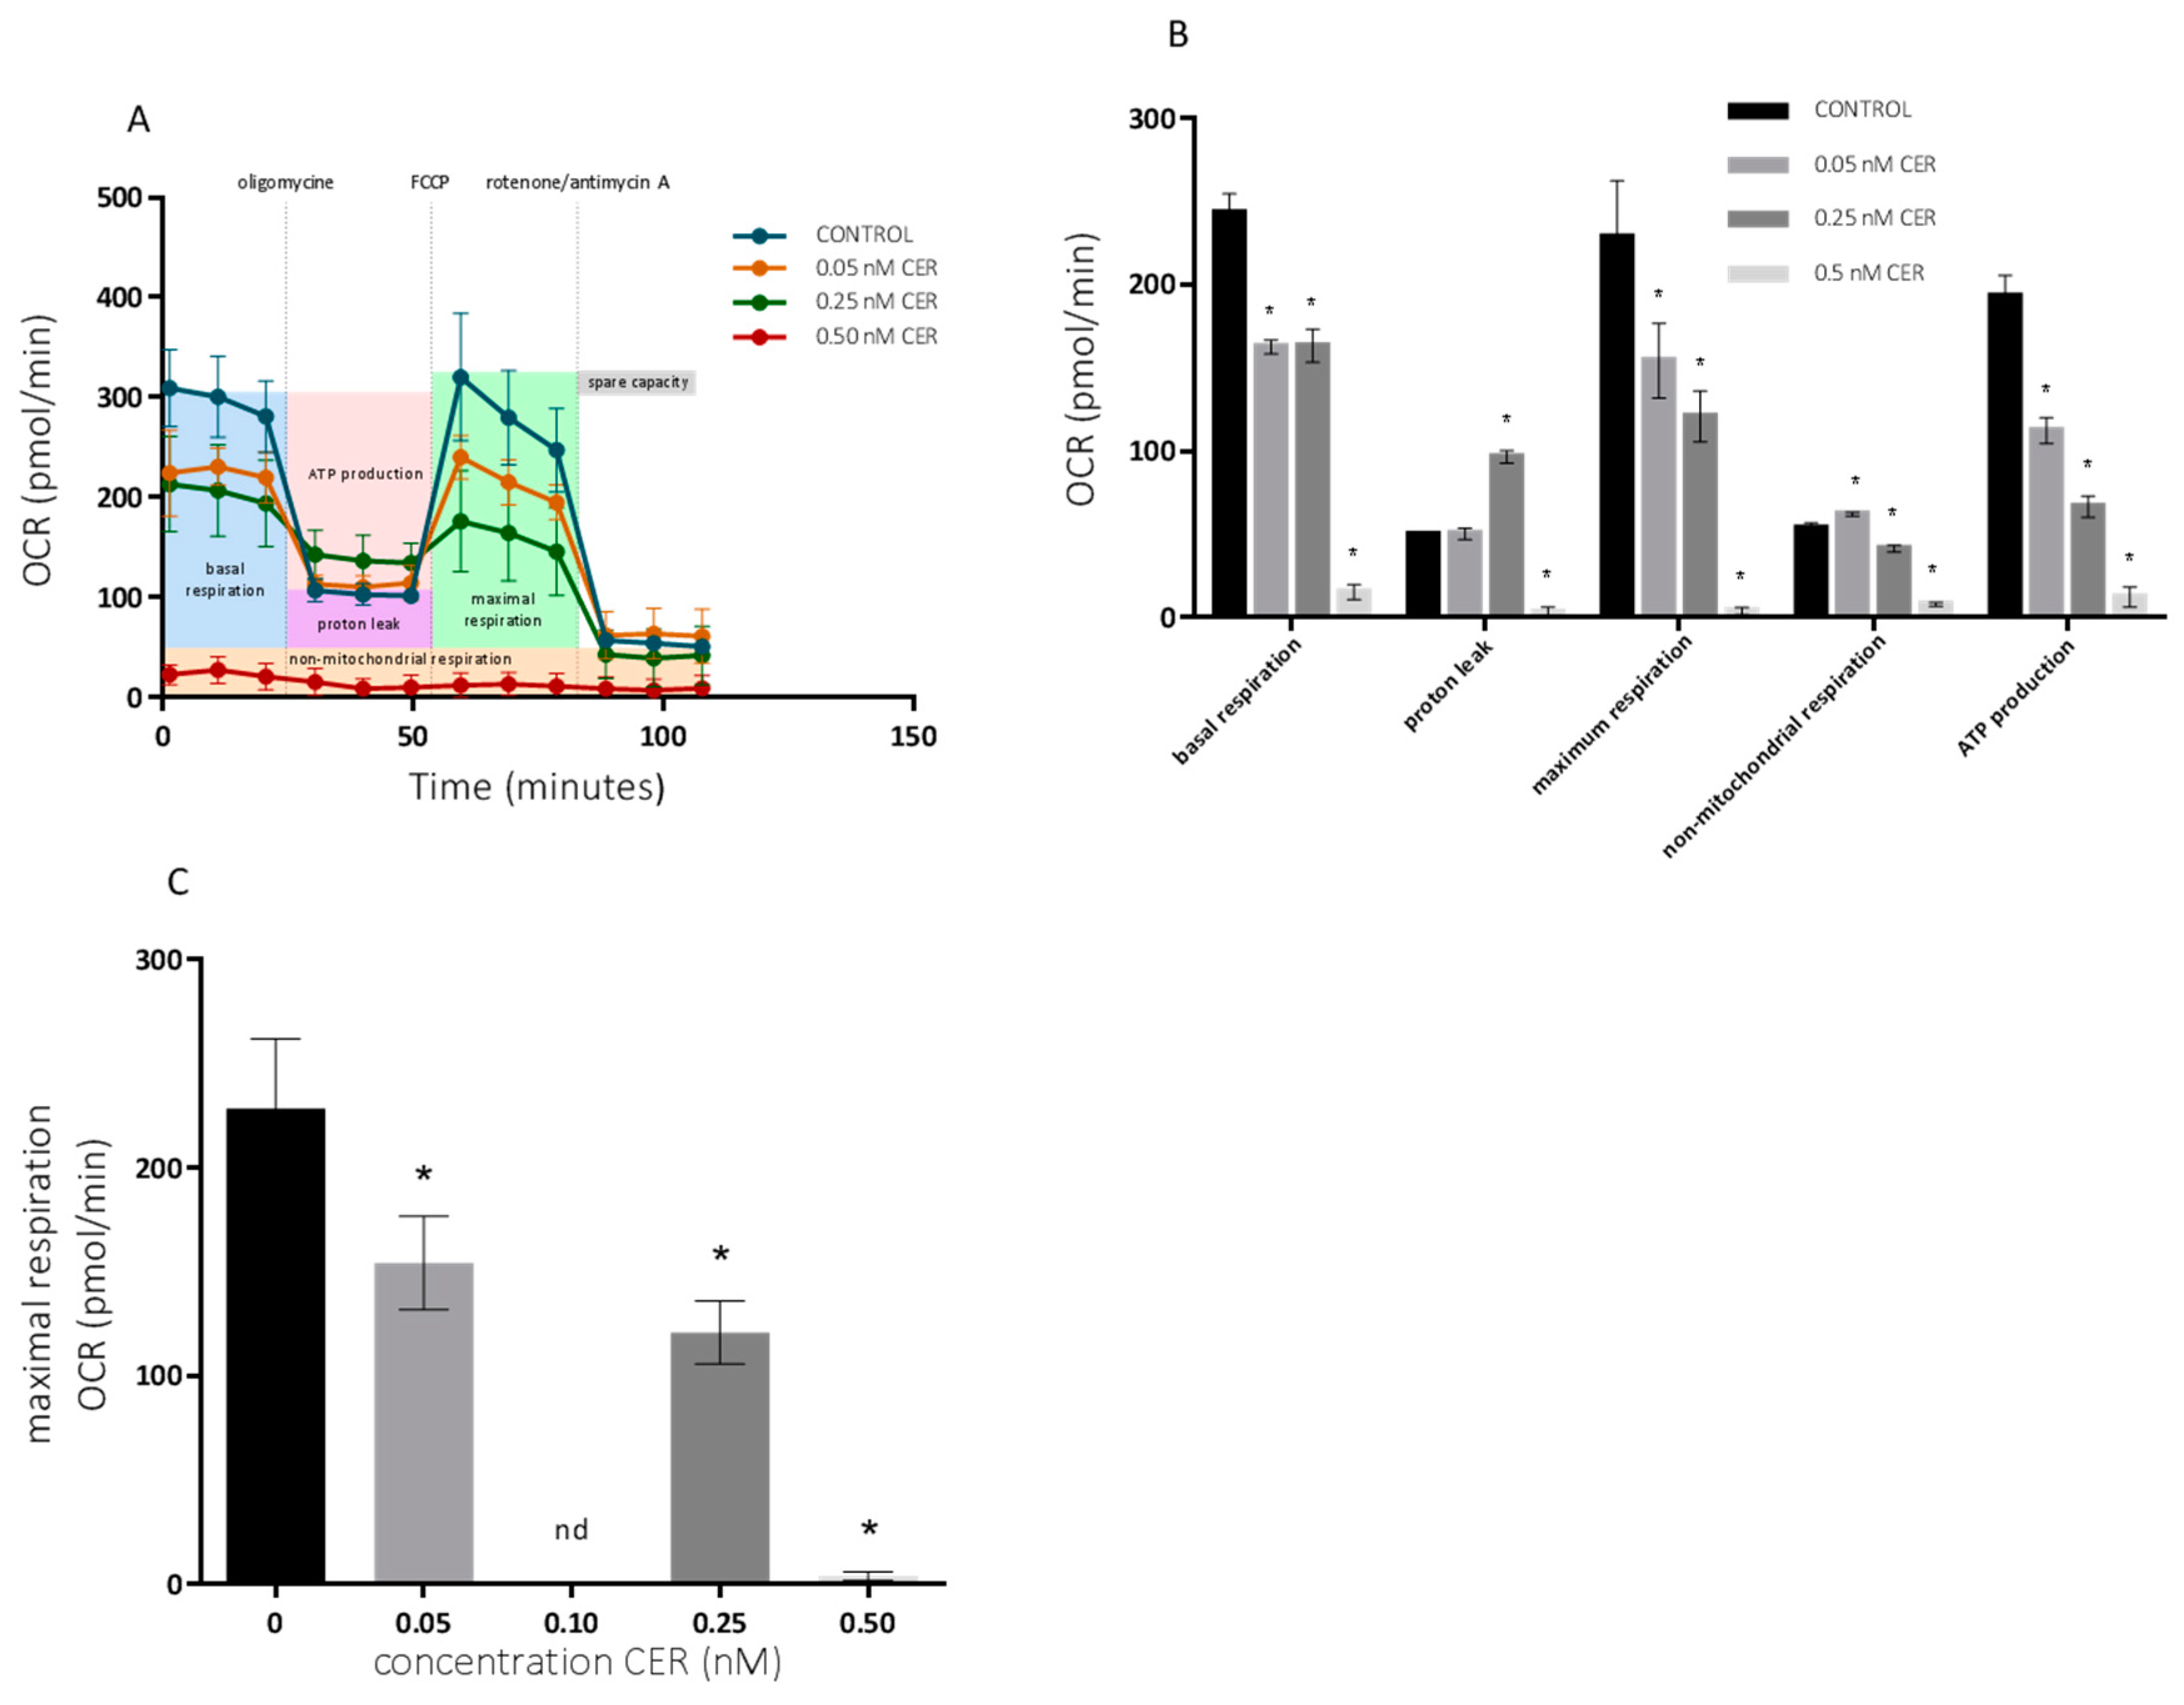
2.2. Long-Term Effects of Cereulide on Mitochondrial Respiration of Caco-2 and HepG2 Cells
3. Conclusions
4. Materials and Methods
4.1. Materials and Reagents
4.2. Cell Culture
4.3. Exposure of Cells to Cereulide
4.4. Cell Viability and Protein Content Assays
4.5. Seahorse Extracellular Flux Analysis of Mitochondrial Respiration
4.6. Data Analysis
Author Contributions
Funding
Acknowledgments
Conflicts of Interest
References
- Dierick, K.; Van Coillie, E.; Swiecicka, I.; Meyfroidt, G.; Devlieger, H.; Meulemans, A.; Hoedemaekers, G.; Fourie, L.; Heyndrickx, M.; Mahillon, J. Fatal family outbreak of Bacillus cereus-associated food poisoning. J. Clin. Microbiol. 2005, 43, 4277–4279. [Google Scholar] [CrossRef] [PubMed]
- Stenfors Arnesen, L.P.; Fagerlund, A.; Granum, P.E. From soil to gut: Bacillus cereus and its food poisoning toxins. FEMS Microbiol. Rev. 2008, 32, 579–606. [Google Scholar] [CrossRef] [PubMed]
- Naranjo, M.; Denayer, S.; Botteldoorn, N.; Delbrassinne, L.; Veys, J.; Waegenaere, J.; Sirtaine, N.; Driesen, R.B.; Sipido, K.R.; Mahillon, J.; et al. Sudden death of a young adult associated with Bacillus cereus Food Poisoning. J. Clin. Microbiol. 2011, 49, 4379–4381. [Google Scholar] [CrossRef] [PubMed]
- Mahler, H.; Pasi, A.; Kramer, J.M.; Schulte, P.; Scoging, A.C.; Bar, W.; Krahenbuhl, S. Fulminant liver failure in association with the emetic toxin of Bacillus cereus. N. Engl. J. Med. 1997, 336, 1142–1148. [Google Scholar] [CrossRef] [PubMed]
- Ichikawa, K.; Gakumazawa, M.; Inaba, A.; Shiga, K.; Takeshita, S.; Mori, M.; Kikuchi, N. Acute encephalopathy of Bacillus cereus mimicking Reye syndrome. Brain Dev.-Jpn. 2010, 32, 688–690. [Google Scholar] [CrossRef] [PubMed]
- Agata, N.; Mori, M.; Ohta, M.; Suwan, S.; Ohtani, I.; Isobe, M. A novel dodecadepsipeptide, cereulide, isolated from Bacillus cereus causes vacuole formation in HEp-2 cells. FEMS Microbiol. Lett. 1994, 121, 31–34. [Google Scholar] [PubMed]
- Makarasen, A.; Yoza, K.; Isobe, M. Higher Structure of Cereulide, an Emetic Toxin from Bacillus cereus, and Special Comparison with Valinomycin, an Antibiotic from Streptomyces fulvissimus. Chem. Asian J. 2009, 4, 688–698. [Google Scholar] [CrossRef] [PubMed]
- Ristow, H.; Salnikow, J.; Kleinkauf, H. Biosynthesis of Valinomycin. FEBS Lett. 1974, 42, 127–130. [Google Scholar] [CrossRef]
- Jaitzig, J.; Li, J.; Sussmuth, R.D.; Neubauer, P. Reconstituted Biosynthesis of the Nonribosomal Macrolactone Antibiotic Valinomycin in Escherichia coli. ACS Synth. Biol. 2014, 3, 432–438. [Google Scholar] [CrossRef] [PubMed]
- Li, J.; Jaitzig, J.; Theuer, L.; Legala, O.E.; Sussmuth, R.D.; Neubauer, P. Type II thioesterase improves heterologous biosynthesis of valinomycin in Escherichia coli. J. Biotechnol. 2015, 193, 16–22. [Google Scholar] [CrossRef] [PubMed]
- Lee, D.W.; Ng, B.G.; Kim, B.S. Increased valinomycin production in mutants of Streptomyces sp M10 defective in bafilomycin biosynthesis and branched-chain alpha-keto acid dehydrogenase complex expression. J. Ind. Microbiol. Biotechnol. 2015, 42, 1507–1517. [Google Scholar] [CrossRef] [PubMed]
- Horwood, P.F.; Burgess, G.W.; Oakey, H.J. Evidence for non-ribosomal peptide synthetase production of cereulide (the emetic toxin) in Bacillus cereus. FEMS Microbiol. Lett. 2004, 236, 319–324. [Google Scholar] [CrossRef] [PubMed]
- Lucking, G.; Frenzel, E.; Rutschle, A.; Marxen, S.; Stark, T.D.; Hofmann, T.; Scherer, S.; Ehling-Schulz, M. Ces locus embedded proteins control the non-ribosomal synthesis of the cereulide toxin in emetic Bacillus cereus on multiple levels. Front. Microbiol. 2015, 6. [Google Scholar] [CrossRef] [PubMed]
- Rajkovic, A.; Kljajic, M.; Smigic, N.; Devlieghere, F.; Uyttendaele, M. Toxin producing Bacillus cereus persist in ready-to-reheat spaghetti Bolognese mainly in vegetative state. Int. J. Food Microbiol. 2013, 167, 236–243. [Google Scholar] [CrossRef] [PubMed]
- Rajkovic, A.; Uyttendaele, M.; Vermeulen, A.; Andjelkovic, M.; Fitz-James, I.; In’t Veld, P.; Denon, Q.; Verhe, R.; Debevere, J. Heat resistance of Bacillus cereus emetic toxin, cereulide. Lett. Appl. Microbiol. 2008, 46, 536–541. [Google Scholar] [CrossRef] [PubMed]
- Shinagawa, K.; Ueno, Y.; Hu, D.; Ueda, S.; Sugii, S. Mouse lethal activity of a HEp-2 vacuolation factor, cereulide, produced by Bacillus cereus isolated from vomiting-type food poisoning. J. Vet. Med. Sci. 1996, 58, 1027–1029. [Google Scholar] [CrossRef] [PubMed]
- Delbrassinne, L.; Andjelkovic, M.; Dierick, K.; Denayer, S.; Mahillon, J.; Van Loco, J. Prevalence and levels of Bacillus cereus emetic toxin in rice dishes randomly collected from restaurants and comparison with the levels measured in a recent foodborne outbreak. Foodborne Pathog. Dis. 2012, 9, 809–814. [Google Scholar] [CrossRef] [PubMed]
- Rajkovic, A.; Uyttendaele, M.; Ombregt, S.-A.; Jääskeläinen, E.; Salkinoja-Salonen, M.; Debevere, J. Influence of type of food on the kinetics and overall production of Bacillus cereus emetic toxin. J. Food Prot. 2006, 69, 847–852. [Google Scholar] [CrossRef] [PubMed]
- Jääskeläinen, E.L.; Teplova, V.; Andersson, M.A.; Andersson, L.C.; Tammela, P.; Andersson, M.C.; Pirhonen, T.I.; Saris, N.E.L.; Vuorela, P.; Salkinoja-Salonen, M.S. In vitro assay for human toxicity of cereulide, the emetic mitochondrial toxin produced by food poisoning Bacillus cereus. Toxicol. In Vitro 2003, 17, 737–744. [Google Scholar] [CrossRef]
- Shinagawa, K.; Konuma, H.; Sekita, H.; Sugii, S. Emesis of rhesus monkeys induced by intragastric administration with the Hep-2 vacuolation factor (cereulide) produced by Bacillus cereus. FEMS Microbiol. Lett. 1995, 130, 87–90. [Google Scholar] [PubMed]
- Agata, N.; Ohta, M.; Mori, M.; Isobe, M. A novel dodecadepsipeptide, cereulide, is an emetic toxin of Bacillus cereus. FEMS Microbiol. Lett. 1995, 129, 17–19. [Google Scholar] [PubMed]
- Witpas, K.; Van Loco, J.; Botteldoorn, N.; Andjelkovic, M. Evaluation of the presence of cereulide in food products collected from the Belgian market. Int. J. Food Contam. 2015, 2, 14. [Google Scholar] [CrossRef]
- Biesta-Peters, E.G.; Dissel, S.; Reij, M.W.; Zwietering, M.H.; In’t Veld, P.H. Characterization and exposure assessment of emetic Bacillus cereus and cereulide production in food products on the Dutch market. J. Food Prot. 2016, 79, 230–238. [Google Scholar] [CrossRef] [PubMed]
- Ronning, H.T.; Asp, T.N.; Granum, P.E. Determination and quantification of the emetic toxin cereulide from Bacillus cereus in pasta, rice and cream with liquid chromatography-tandem mass spectrometry. Addit. Contam. Part A Chem. Anal. Control Expo. Risk Assess. 2015, 32, 911–921. [Google Scholar] [CrossRef] [PubMed]
- Vangoitsenhoven, R.; Rondas, D.; Crevecoeur, I.; D’Hertog, W.; Baatsen, P.; Masini, M.; Andjelkovic, M.; Van Loco, J.; Matthys, C.; Mathieu, C.; et al. Foodborne cereulide causes beta-cell dysfunction and apoptosis. PLoS ONE 2014, 9, e104866. [Google Scholar] [CrossRef] [PubMed]
- Rajkovic, A.; Grootaert, C.; Butorac, A.; Cucu, T.; De Meulenaer, B.; van Camp, J.; Bracke, M.; Uyttendaele, M.; Bacun-Druzina, V.; Cindric, M. Sub-emetic toxicity of Bacillus cereus toxin cereulide on cultured human enterocyte-like Caco-2 cells. Toxins 2014, 6, 2270–2290. [Google Scholar] [CrossRef] [PubMed] [Green Version]
- Rajkovic, A. Microbial toxins and low level of foodborne exposure. Trends Food Sci. Technol. 2014, 38, 149–157. [Google Scholar] [CrossRef]
- Ceuppens, S.; Rajkovic, A.; Heyndrickx, M.; Tsilia, V.; van De Wiele, T.; Boon, N.; Uyttendaele, M. Regulation of toxin production by Bacillus cereus and its food safety implications. Crit. Rev. Microbiol. 2011, 37, 188–213. [Google Scholar] [CrossRef] [PubMed]
- Messelhausser, U.; Frenzel, E.; Blochinger, C.; Zucker, R.; Kampf, P.; Ehling-Schulz, M. Emetic Bacillus cereus are more volatile than thought: Recent foodborne outbreaks and prevalence studies in Bavaria (2007–2013). Biomed. Res. Int. 2014, 2014, 465603. [Google Scholar] [CrossRef] [PubMed]
- Messelhausser, U.; Kampf, P.; Fricker, M.; Ehling-Schulz, M.; Zucker, R.; Wagner, B.; Busch, U.; Holler, C. Prevalence of emetic Bacillus cereus in different ice creams in Bavaria. J. Food Prot. 2010, 73, 395–399. [Google Scholar] [CrossRef] [PubMed]
- Kranzler, M.; Stollewerk, K.; Rouzeau-Szynalski, K.; Blayo, L.; Sulyok, M.; Ehling-Schulz, M. Temperature exerts control of Bacillus cereus emetic toxin production on post-transcriptional levels. Front. Microbiol. 2016, 7. [Google Scholar] [CrossRef] [PubMed]
- Smolina, N.; Bruton, J.; Kostareva, A.; Sejersen, T. Assaying Mitochondrial Respiration as an Indicator of Cellular Metabolism and Fitness. In Cell Viability Assays: Methods and Protocols; Gilbert, D.F., Friedrich, O., Eds.; Springer: New York, NY, USA, 2017; pp. 79–87. [Google Scholar]
- Leipnitz, G.; Mohsen, A.W.; Karunanidhi, A.; Seminotti, B.; Roginskaya, V.Y.; Markantone, D.M.; Grings, M.; Mihalik, S.J.; Wipf, P.; Van Houten, B.; et al. Evaluation of mitochondrial bioenergetics, dynamics, endoplasmic reticulum-mitochondria crosstalk, and reactive oxygen species in fibroblasts from patients with complex I deficiency. Sci. Rep. 2018, 8. [Google Scholar] [CrossRef] [PubMed]
- Brand, M.D.; Nicholls, D.G. Assessing mitochondrial dysfunction in cells. Biochem. J. 2011, 435, 297–312. [Google Scholar] [CrossRef] [PubMed] [Green Version]
- Kawamura-Sato, K.; Hirama, Y.; Agata, N.; Ito, H.; Torii, K.; Takeno, A.; Hasegawa, T.; Shimomura, Y.; Ohta, M. Quantitative analysis of cereulide, an emetic toxin of Bacillus cereus, by using rat liver mitochondria. Microbiol. Immunol. 2005, 49, 25–30. [Google Scholar] [CrossRef] [PubMed]
- Hoornstra, D.; Andersson, M.A.; Teplova, V.V.; Mikkola, R.; Uotila, L.M.; Andersson, L.C.; Roivainen, M.; Gahmberg, C.G.; Salkinoja-Salonen, M.S. Potato crop as a source of emetic Bacillus cereus and cereulide-induced mammalian cell toxicity. Appl. Environ. Microbiol. 2013, 79, 3534–3543. [Google Scholar] [CrossRef] [PubMed]
- Ruas, J.S.; Siqueira-Santos, E.S.; Amigo, I.; Rodrigues-Silva, E.; Kowaltowski, A.J.; Castilho, R.F. Underestimation of the maximal capacity of the mitochondrial electron transport system in oligomycin-treated cells. PLoS ONE 2016, 11, e0150967. [Google Scholar] [CrossRef] [PubMed]
- Alberts, B.; Johnson, A.; Lewis, J.; Raff, M.; Robers, K.; Walter, P. Molecular Biology of the Cell, 4th ed.; Garland Science: New York, NY, USA, 2002. [Google Scholar]
- Teplova, V.V.; Mikkola, R.; Tonshin, A.A.; Saris, N.E.L.; Salkinoja-Salonen, M.S. The higher toxicity of cereulide relative to valinomycin is due to its higher affinity for potassium at physiological plasma concentration. Toxicol. Appl. Pharmacol. 2006, 210, 39–46. [Google Scholar] [CrossRef] [PubMed]
- Virtanen, S.M.; Roivainen, M.; Andersson, M.A.; Ylipaasto, P.; Hoornstra, D.; Mikkola, R.; Salkinoja-Salonen, M.S. In vitro toxicity of cereulide on porcine pancreatic Langerhans islets. Toxicon 2008, 51, 1029–1037. [Google Scholar] [CrossRef] [PubMed]
- Vangoitsenhoven, R.; Maris, M.; Overbergh, L.; Van Loco, J.; Mathieu, C.; Van der Schueren, B. Cereulide food toxin, beta cell function and diabetes: Facts and hypotheses. Diabetes Res. Clin. Pract. 2015, 109, 1–5. [Google Scholar] [CrossRef] [PubMed]
- Mikkola, R.; Andersson, M.A.; Grigoriev, P.; Heinonen, M.; Salkinoja-Salonen, M.S. The toxic mode of action of cyclic lipodepsipeptide fusaricidins, produced by Paenibacillus polymyxa, toward mammalian cells. J. Appl. Microbiol. 2017, 123, 436–449. [Google Scholar] [CrossRef] [PubMed]
- Wollenman, L.C.; Ploeg, M.R.V.; Miller, M.L.; Zhang, Y.Z.; Bazil, J.N. The effect of respiration buffer composition on mitochondrial metabolism and function. PLoS ONE 2017, 12. [Google Scholar] [CrossRef] [PubMed]
- Lozoya-Agullo, I.; Araujo, F.; Gonzalez-Alvarez, I.; Merino-Sanjuan, M.; Gonzalez-Alvarez, M.; Bermejo, M.; Sarmento, B. Usefulness of Caco-2/HT29-MTX and Caco-2/HT29-MTX/Raji B Coculture Models to Predict Intestinal and Colonic Permeability Compared to Caco-2 Monoculture. Mol. Pharm. 2017, 14, 1264–1270. [Google Scholar] [CrossRef] [PubMed]
- Stefanikova, A.; Klacanova, K.; Pilchova, I.; Hatok, J.; Racay, P. Cyclin-dependent kinase 2 inhibitor SU9516 increases sensitivity of colorectal carcinoma cells Caco-2 but not HT29 to BH3 mimetic ABT-737. Gen. Physiol. Biophys. 2017, 36, 539–547. [Google Scholar] [CrossRef] [PubMed] [Green Version]
- Garcia-Rodriguez, A.; Vila, L.; Cortes, C.; Hernandez, A.; Marcos, R. Exploring the usefulness of the complex in vitro intestinal epithelial model Caco-2/HT29/Raji-B in nanotoxicology. Food Chem. Toxicol. 2018, 113, 162–170. [Google Scholar] [CrossRef] [PubMed]
- Bourgine, J.; Billaut-Laden, I.; Happillon, M.; Lo-Guidice, J.M.; Maunoury, V.; Imbenotte, M.; Broly, F. Gene Expression Profiling of Systems Involved in the Metabolism and the Disposition of Xenobiotics: Comparison between Human Intestinal Biopsy Samples and Colon Cell Lines. Drug Metab. Dispos. 2012, 40, 694–705. [Google Scholar] [CrossRef] [PubMed] [Green Version]
- Roggen, E.L. In vitro toxicity testing in the twenty-first century. Front. Pharmacol. 2011, 2. [Google Scholar] [CrossRef] [PubMed]
- Guillouzo, A.; Corlu, A.; Aninat, C.; Glaise, D.; Morel, F.; Guguen-Guillouzo, C. The human hepatoma HepaRG cells: A highly differentiated model for studies of liver metabolism and toxicity of xenobiotics. Chem. Biol. Interact. 2007, 168, 66–73. [Google Scholar] [CrossRef] [PubMed]
- Gerets, H.H.J.; Tilmant, K.; Gerin, B.; Chanteux, H.; Depelchin, B.O.; Dhalluin, S.; Atienzar, F.A. Characterization of primary human hepatocytes, HepG2 cells, and HepaRG cells at the mRNA level and CYP activity in response to inducers and their predictivity for the detection of human hepatotoxins. Cell Biol. Toxicol. 2012, 28, 69–87. [Google Scholar] [CrossRef] [PubMed] [Green Version]
- Xu, J.J.; Diaz, D.; O'Brien, P.J. Applications of cytotoxicity assays and pre-lethal mechanistic assays for assessment of human hepatotoxicity potential. Chem. Biol. Interact. 2004, 150, 115–128. [Google Scholar] [CrossRef] [PubMed]
- Shiota, M.; Saitou, K.; Mizumoto, H.; Matsusaka, M.; Agata, N.; Nakayama, M.; Kage, M.; Tatsumi, S.; Okamoto, A.; Yamaguchi, S.; et al. Rapid detoxification of Cereulide in Bacillus cereus food poisoning. Pediatrics 2010, 125, E951–E955. [Google Scholar] [CrossRef] [PubMed]
- Kamalian, L.; Chadwick, A.E.; Bayliss, M.; French, N.S.; Monshouwer, M.; Snoeys, J.; Park, B.K. The utility of HepG2 cells to identify direct mitochondrial dysfunction in the absence of cell death. Toxicol. In Vitro 2015, 29, 732–740. [Google Scholar] [CrossRef] [PubMed]
- Rajkovic, A.; Uyttendaele, M.; Debevere, J. Computer aided boar semen motility analysis for cereulide detection in different food matrices. Int. J. Food Microbiol. 2007, 114, 92–99. [Google Scholar] [CrossRef] [PubMed]
- Vichai, V.; Kirtikara, K. Sulforhodamine B colorimetric assay for cytotoxicity screening. Nat. Protoc. 2006, 1, 1112–1116. [Google Scholar] [CrossRef] [PubMed]
- Mosmann, T. Rapid colorimetric assay for cellular growth and survival: Application to proliferation and cytotoxicity assays. J. Immunol. Methods 1983, 65, 55–63. [Google Scholar] [CrossRef]
- Salabei, J.K.; Gibb, A.A.; Hill, B.G. Comprehensive measurement of respiratory activity in permeabilized cells using extracellular flux analysis. Nat. Protoc. 2014, 9, 421–438. [Google Scholar] [CrossRef] [PubMed] [Green Version]


© 2018 by the authors. Licensee MDPI, Basel, Switzerland. This article is an open access article distributed under the terms and conditions of the Creative Commons Attribution (CC BY) license (http://creativecommons.org/licenses/by/4.0/).
Share and Cite
Decleer, M.; Jovanovic, J.; Vakula, A.; Udovicki, B.; Agoua, R.-S.E.K.; Madder, A.; De Saeger, S.; Rajkovic, A. Oxygen Consumption Rate Analysis of Mitochondrial Dysfunction Caused by Bacillus cereus Cereulide in Caco-2 and HepG2 Cells. Toxins 2018, 10, 266. https://0-doi-org.brum.beds.ac.uk/10.3390/toxins10070266
Decleer M, Jovanovic J, Vakula A, Udovicki B, Agoua R-SEK, Madder A, De Saeger S, Rajkovic A. Oxygen Consumption Rate Analysis of Mitochondrial Dysfunction Caused by Bacillus cereus Cereulide in Caco-2 and HepG2 Cells. Toxins. 2018; 10(7):266. https://0-doi-org.brum.beds.ac.uk/10.3390/toxins10070266
Chicago/Turabian StyleDecleer, Marlies, Jelena Jovanovic, Anita Vakula, Bozidar Udovicki, Rock-Seth E. K. Agoua, Annemieke Madder, Sarah De Saeger, and Andreja Rajkovic. 2018. "Oxygen Consumption Rate Analysis of Mitochondrial Dysfunction Caused by Bacillus cereus Cereulide in Caco-2 and HepG2 Cells" Toxins 10, no. 7: 266. https://0-doi-org.brum.beds.ac.uk/10.3390/toxins10070266