Article

Cytotoxic Properties of HT-2 Toxin in Human Chondrocytes: Could T3 Inhibit Toxicity of HT-2?

1
School of Public Health, Health Science Center of Xi’an Jiaotong University, Key Laboratory of Trace Elements and Endemic Diseases, National Health Commission of the People’s Republic of China, Xi’an 710061, China
2
Department of Integrative Medical Biology, University of Umeå, 90187 Umeå, Sweden
*
Authors to whom correspondence should be addressed.
Submission received: 27 September 2019 / Revised: 5 November 2019 / Accepted: 9 November 2019 / Published: 15 November 2019
(This article belongs to the Special Issue Mycotoxin Exposure and Related Diseases)

Abstract

:
Thyroid hormone triiodothyronine (T3) plays an important role in coordinated endochondral ossification and hypertrophic differentiation of the growth plate, while aberrant thyroid hormone function appears to be related to skeletal malformations, osteoarthritis, and Kashin-Beck disease. The T-2 toxin, present extensively in cereal grains, and one of its main metabolites, HT-2 toxin, are hypothesized to be potential factors associated with hypertrophic chondrocyte-related osteochondropathy, known as the Kashin-Beck disease. In this study, we investigated the effects of T3 and HT-2 toxin on human chondrocytes. The immortalized human chondrocyte cell line, C-28/I2, was cultured in four different groups: controls, and cultures with T3, T3 plus HT-2 and HT-2 alone. Cytotoxicity was assessed using an MTT assay after 24-h-exposure. Quantitative RT-PCR was used to detect gene expression levels of collagen types II and X, aggrecan and runx2, and the differences in runx2 were confirmed with immunoblot analysis. T3 was only slightly cytotoxic, in contrast to the significant, dose-dependent cytotoxicity of HT-2 alone at concentrations ≥ 50 nM. T3, together with HT-2, significantly rescued the cytotoxic effect of HT-2. HT-2 induced significant increases in aggrecan and runx2 gene expression, while the hypertrophic differentiation marker, type X collagen, remained unchanged. Thus, T3 protected against HT-2 induced cytotoxicity, and HT-2 was an inducer of the pre-hypertrophic state of the chondrocytes.
Key Contribution: Triiodothyronine partly rescued the chondrocytes from cytotoxicity caused by HT-2. HT-2 toxin appeared to effectively induce the switch of the chondrocytes into pre-hypertrophic state.

1. Introduction

Thyroid hormone (triiodothyronine, T3) is converted to this active form from thyroxine (T4) by deiodinase 2 (DIO2), and it is known to be an essential regulator in metabolism, growth, and development of the human body, and it is critical for the maturation of the skeletal system [1]. It controls the linear growth of bone by regulating endochondral ossification and promotes chondrocyte maturation and hypertrophic differentiation [2]. It has also been exploited to enhance cartilage formation and improve the functional properties of tissue-engineered neocartilage [3]. Furthermore, T3 enhances chondrogenesis of mesenchymal stem cells of the umbilical cord [4]. In addition, T3 regulates the transition between proliferation and terminal differentiation of chondrocytes in the growth plate via the Wnt/β-catenin signaling pathway [5,6]. Thus, a body of evidence implies that T3 has significant effects on cartilage and chondrocyte physiology. It is worth mentioning that up-regulated DIO2 expression has been observed in osteoarthritic human articular cartilage and transgenic mice overexpressing DIO2 [7]. Moreover, low serum T3 syndrome led to DIO2 dysfunction in Kashin-Beck disease (KBD) children [8,9].
T-2 and HT-2 toxins are two of the most representative and toxic members of the trichothecenes family, which are widely present in cereal grains and other cereal-based products, and are produced by various fungi species, such as Fusarium [10]. In rats, T-2 and HT-2 toxins were mainly distributed in the skeletal system at significantly higher concentrations than those in other organs [11]. In addition, the HT-2 toxin was shown to be a detectable metabolite of T-2 toxin in human chondrocytes, although it was deduced to be less toxic than T-2 [12]. After ingestion, the T-2 toxin is converted into more than 20 metabolites in animals [13]. The T-2 toxin is a cytotoxic fungal secondary metabolite produced by various species of Fusarium, and it interferes especially with the immune system, can harm fetal tissues, and induces cell death by apoptosis [13]. Furthermore, both the T-2 toxin and HT-2 toxin can result in apoptosis of chondrocytes by increased oxidative stress, which causes a release of Bax, caspase-3, and caspase-9 [14]. A number of studies have reported that the T-2 toxin induces chondrocytes’ apoptosis, promotes catabolism and intracellular impairment of cartilage, and is a risk factor of KBD [15,16,17]. However, studies on the direct effects of the HT-2 toxin on cartilage and chondrocytes are still missing.
It is important to clarify the potentially damaging effect of the HT-2 toxin on human chondrocytes to enrich our knowledge of the possible molecular mechanisms of the HT-2 toxin causing cartilage lesions observed in KBD. Furthermore, this study aimed to explore whether T3 can protect from the chondrocytic injury caused by the HT-2 toxin in vitro, which may contribute to the combined effects both on cartilage and the potential pathogenesis of KBD. The concurrence of the abnormal T3 level and HT-2 toxin in vivo of KBD prompted this study to explore the effect of T3 and the HT-2 toxin on C-28/I2 chondrocytes and their combined effects.

2. Results

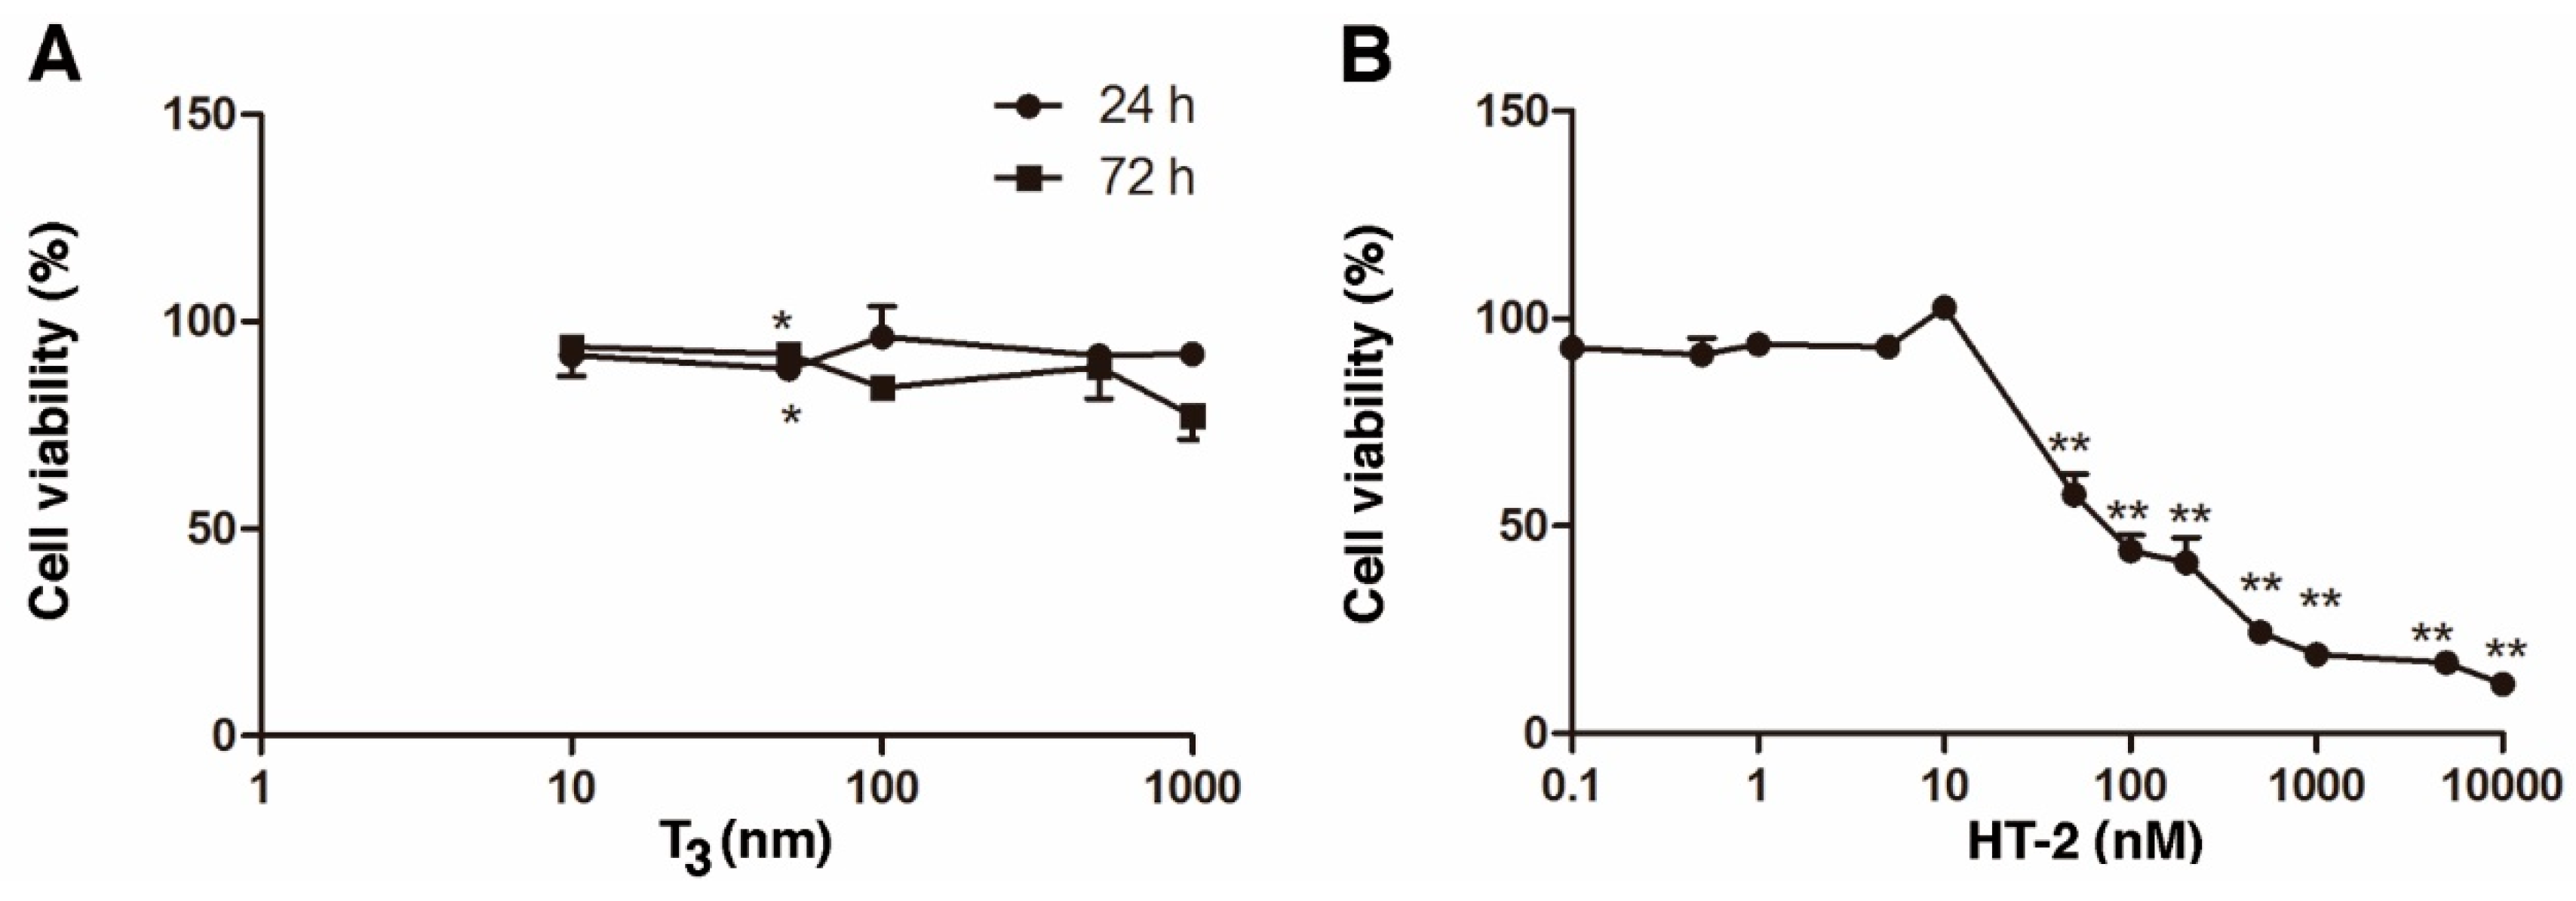
2.1. Individual Cytotoxicity of T3 and HT-2 Toxin in Human C-28/I2 Chondrocytes

MTT assay was used to evaluate the cytotoxicity in C-28/I2 chondrocyte cultures treated with T3 at concentrations ranging from 0 to 1000 nM. T3 was found to produce no major effect on the cell viability of C-28/I2 chondrocytes, even at 1000 nM concentration, although a statistically significant difference was observed at 50 nM (Figure 1A). In contrast, HT-2 was highly toxic to C-28/I2 cells, especially at concentrations ≥ 50 nM (Figure 1B).

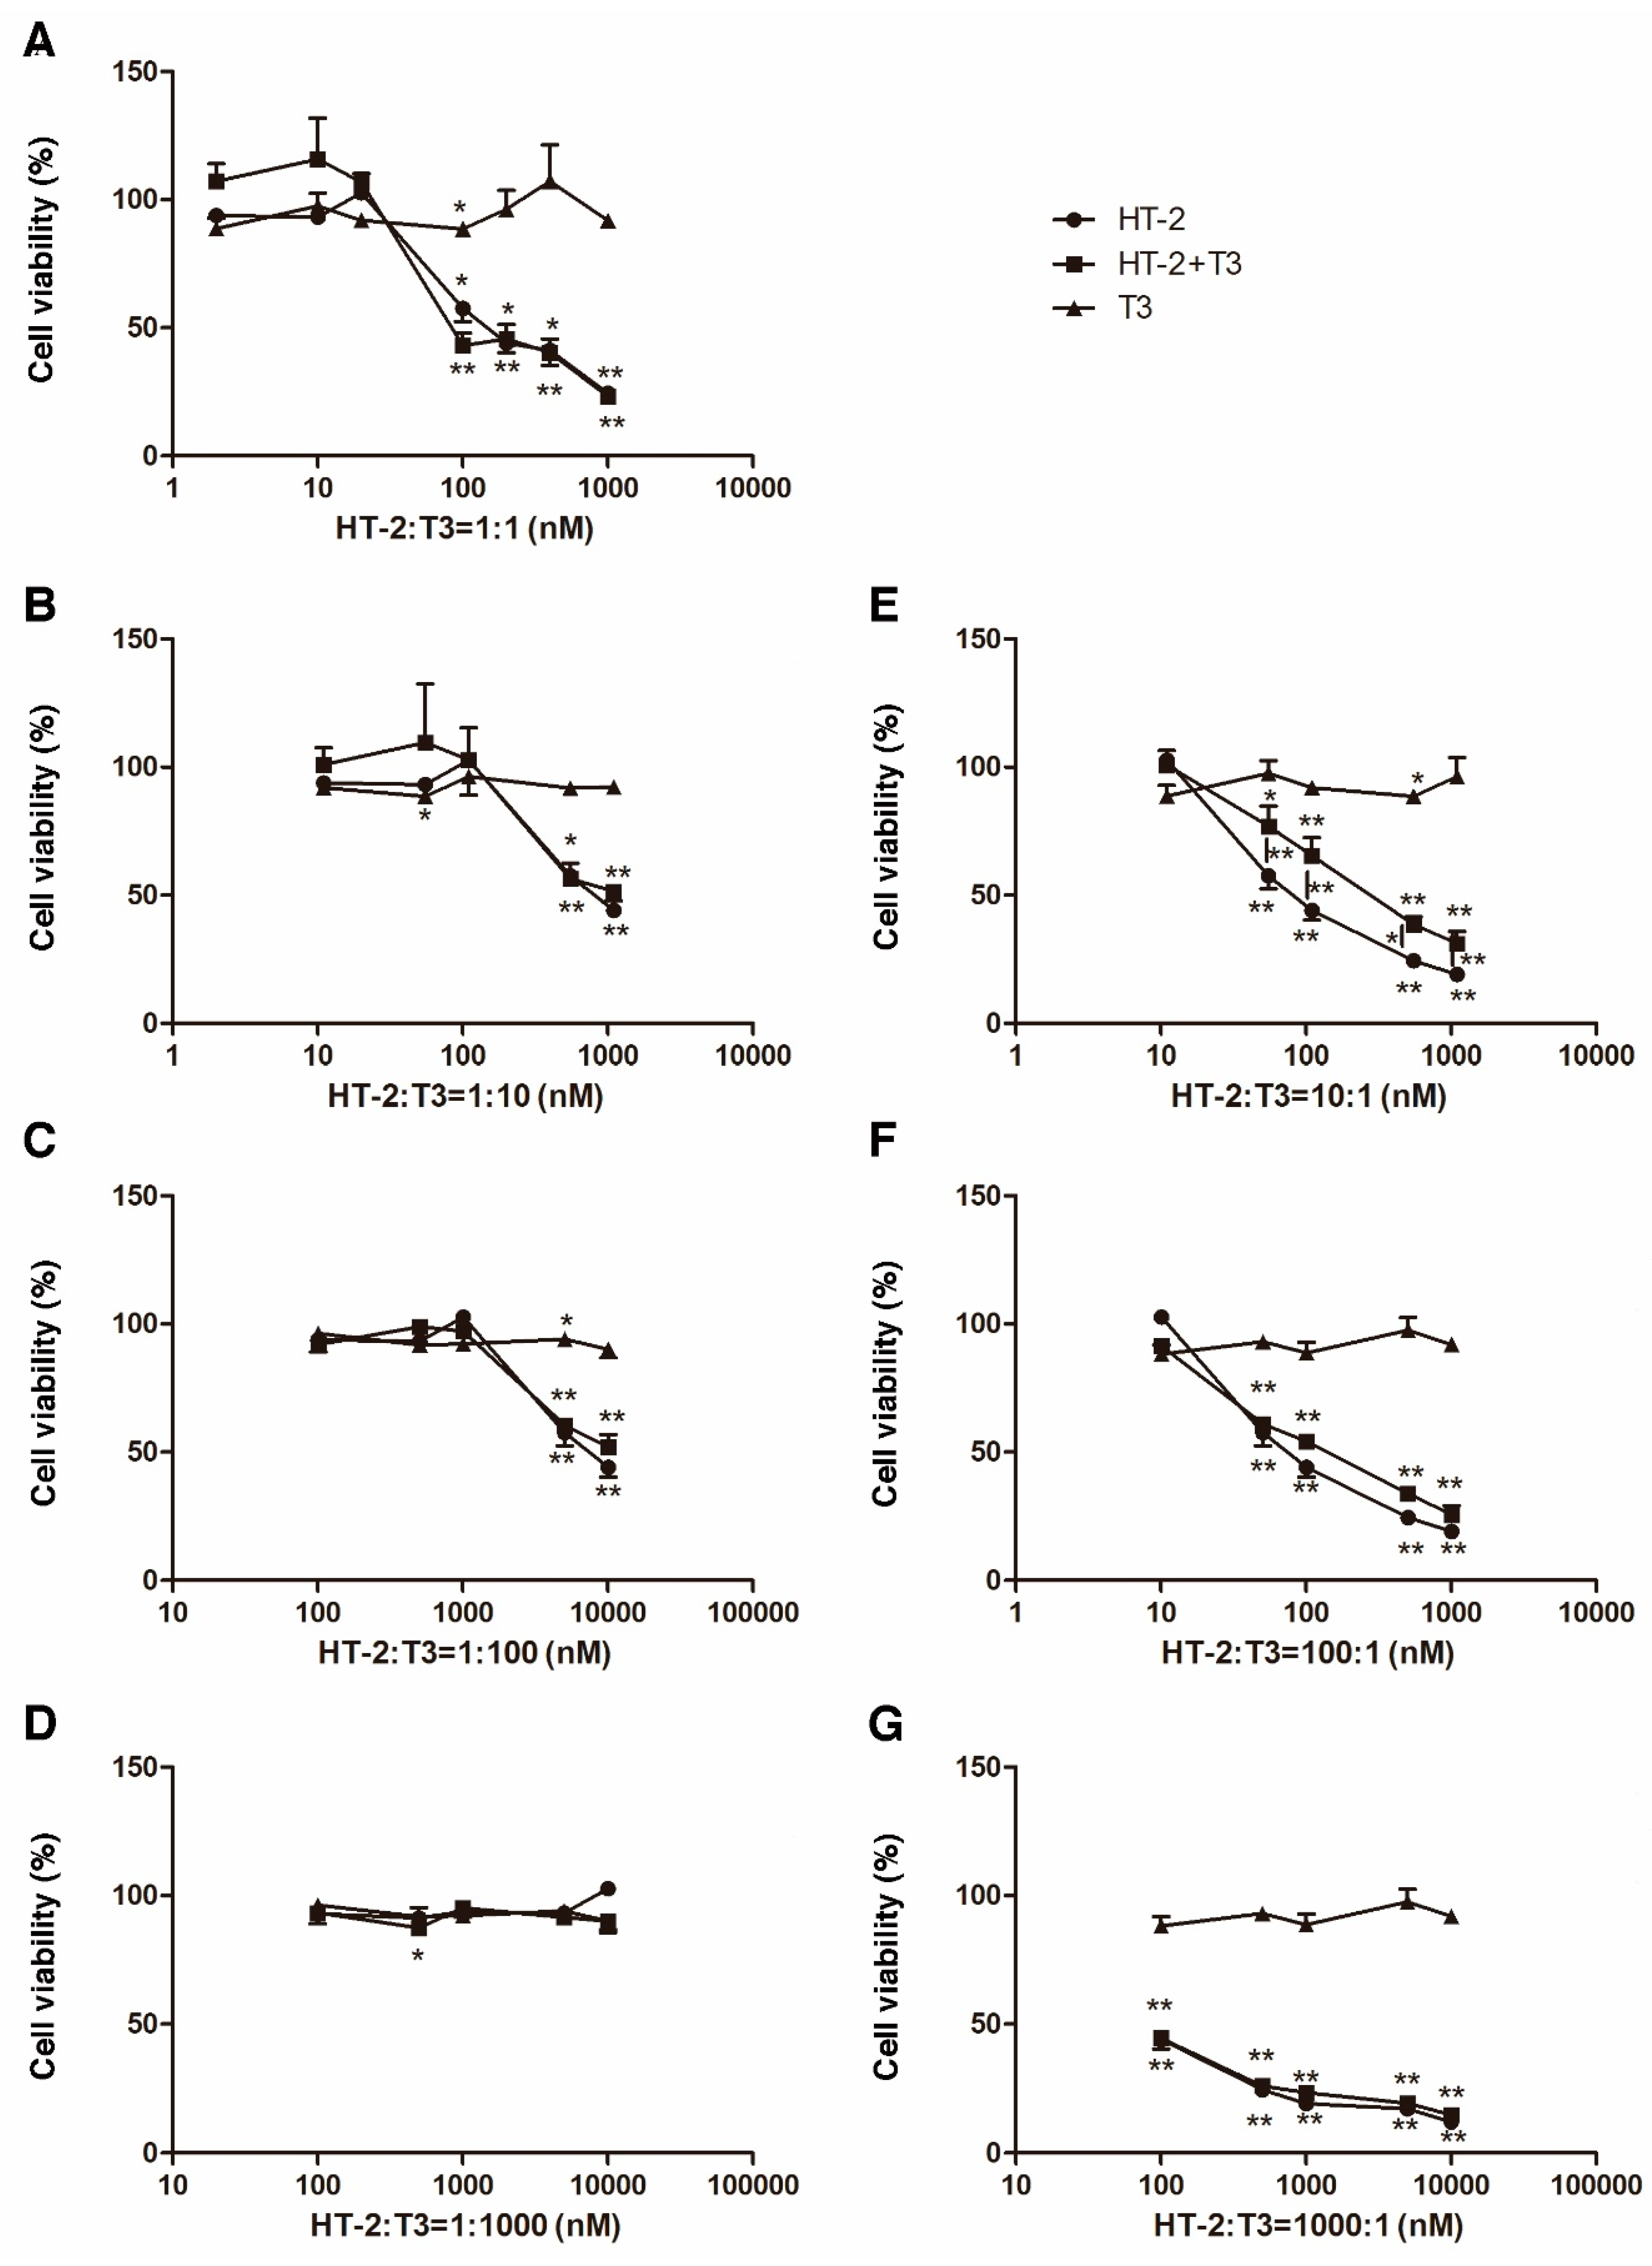
2.2. T3 Protects against HT-2 Toxin-Induced Toxicity

Mixtures of HT-2 toxin and T3 at different concentration ratios of both were tested following 24-hour-long exposures. In general, HT-2 concentrations ≥50 nM significantly decreased the cell viability in comparison to control cultures (Figure 2). However, at equimolar concentrations, it took a 100 nM concentration of HT-2 to result in a significant decrease in the cell viability (Figure 2A). Also, when T3 was present at higher molar ratios in relation to HT-2, cytotoxicity was obvious at HT-2 toxin concentrations ≥50 nM (Figure 2B,C). At the ratio 1:1000, HT-2 concentration did not reach 50 nM concentration, and no decrease in cell viability was observed (Figure 2D).
When the molar concentration of HT-2 toxin was higher than T3, a decrease in the cell viability due to HT-2 toxin was obvious starting from 50 nM concentrations (Figure 2E–G). However, the addition of T3 could partially rescue the effect of HT-2 toxin on cell viability (Figure 2E). At high molar ration of HT-2 toxin, T3 did not have a protective effect on cell viability (Figure 2F,G). The dose-effect plot of all ratios generated by CompuSyn software is shown as the Figure S1.

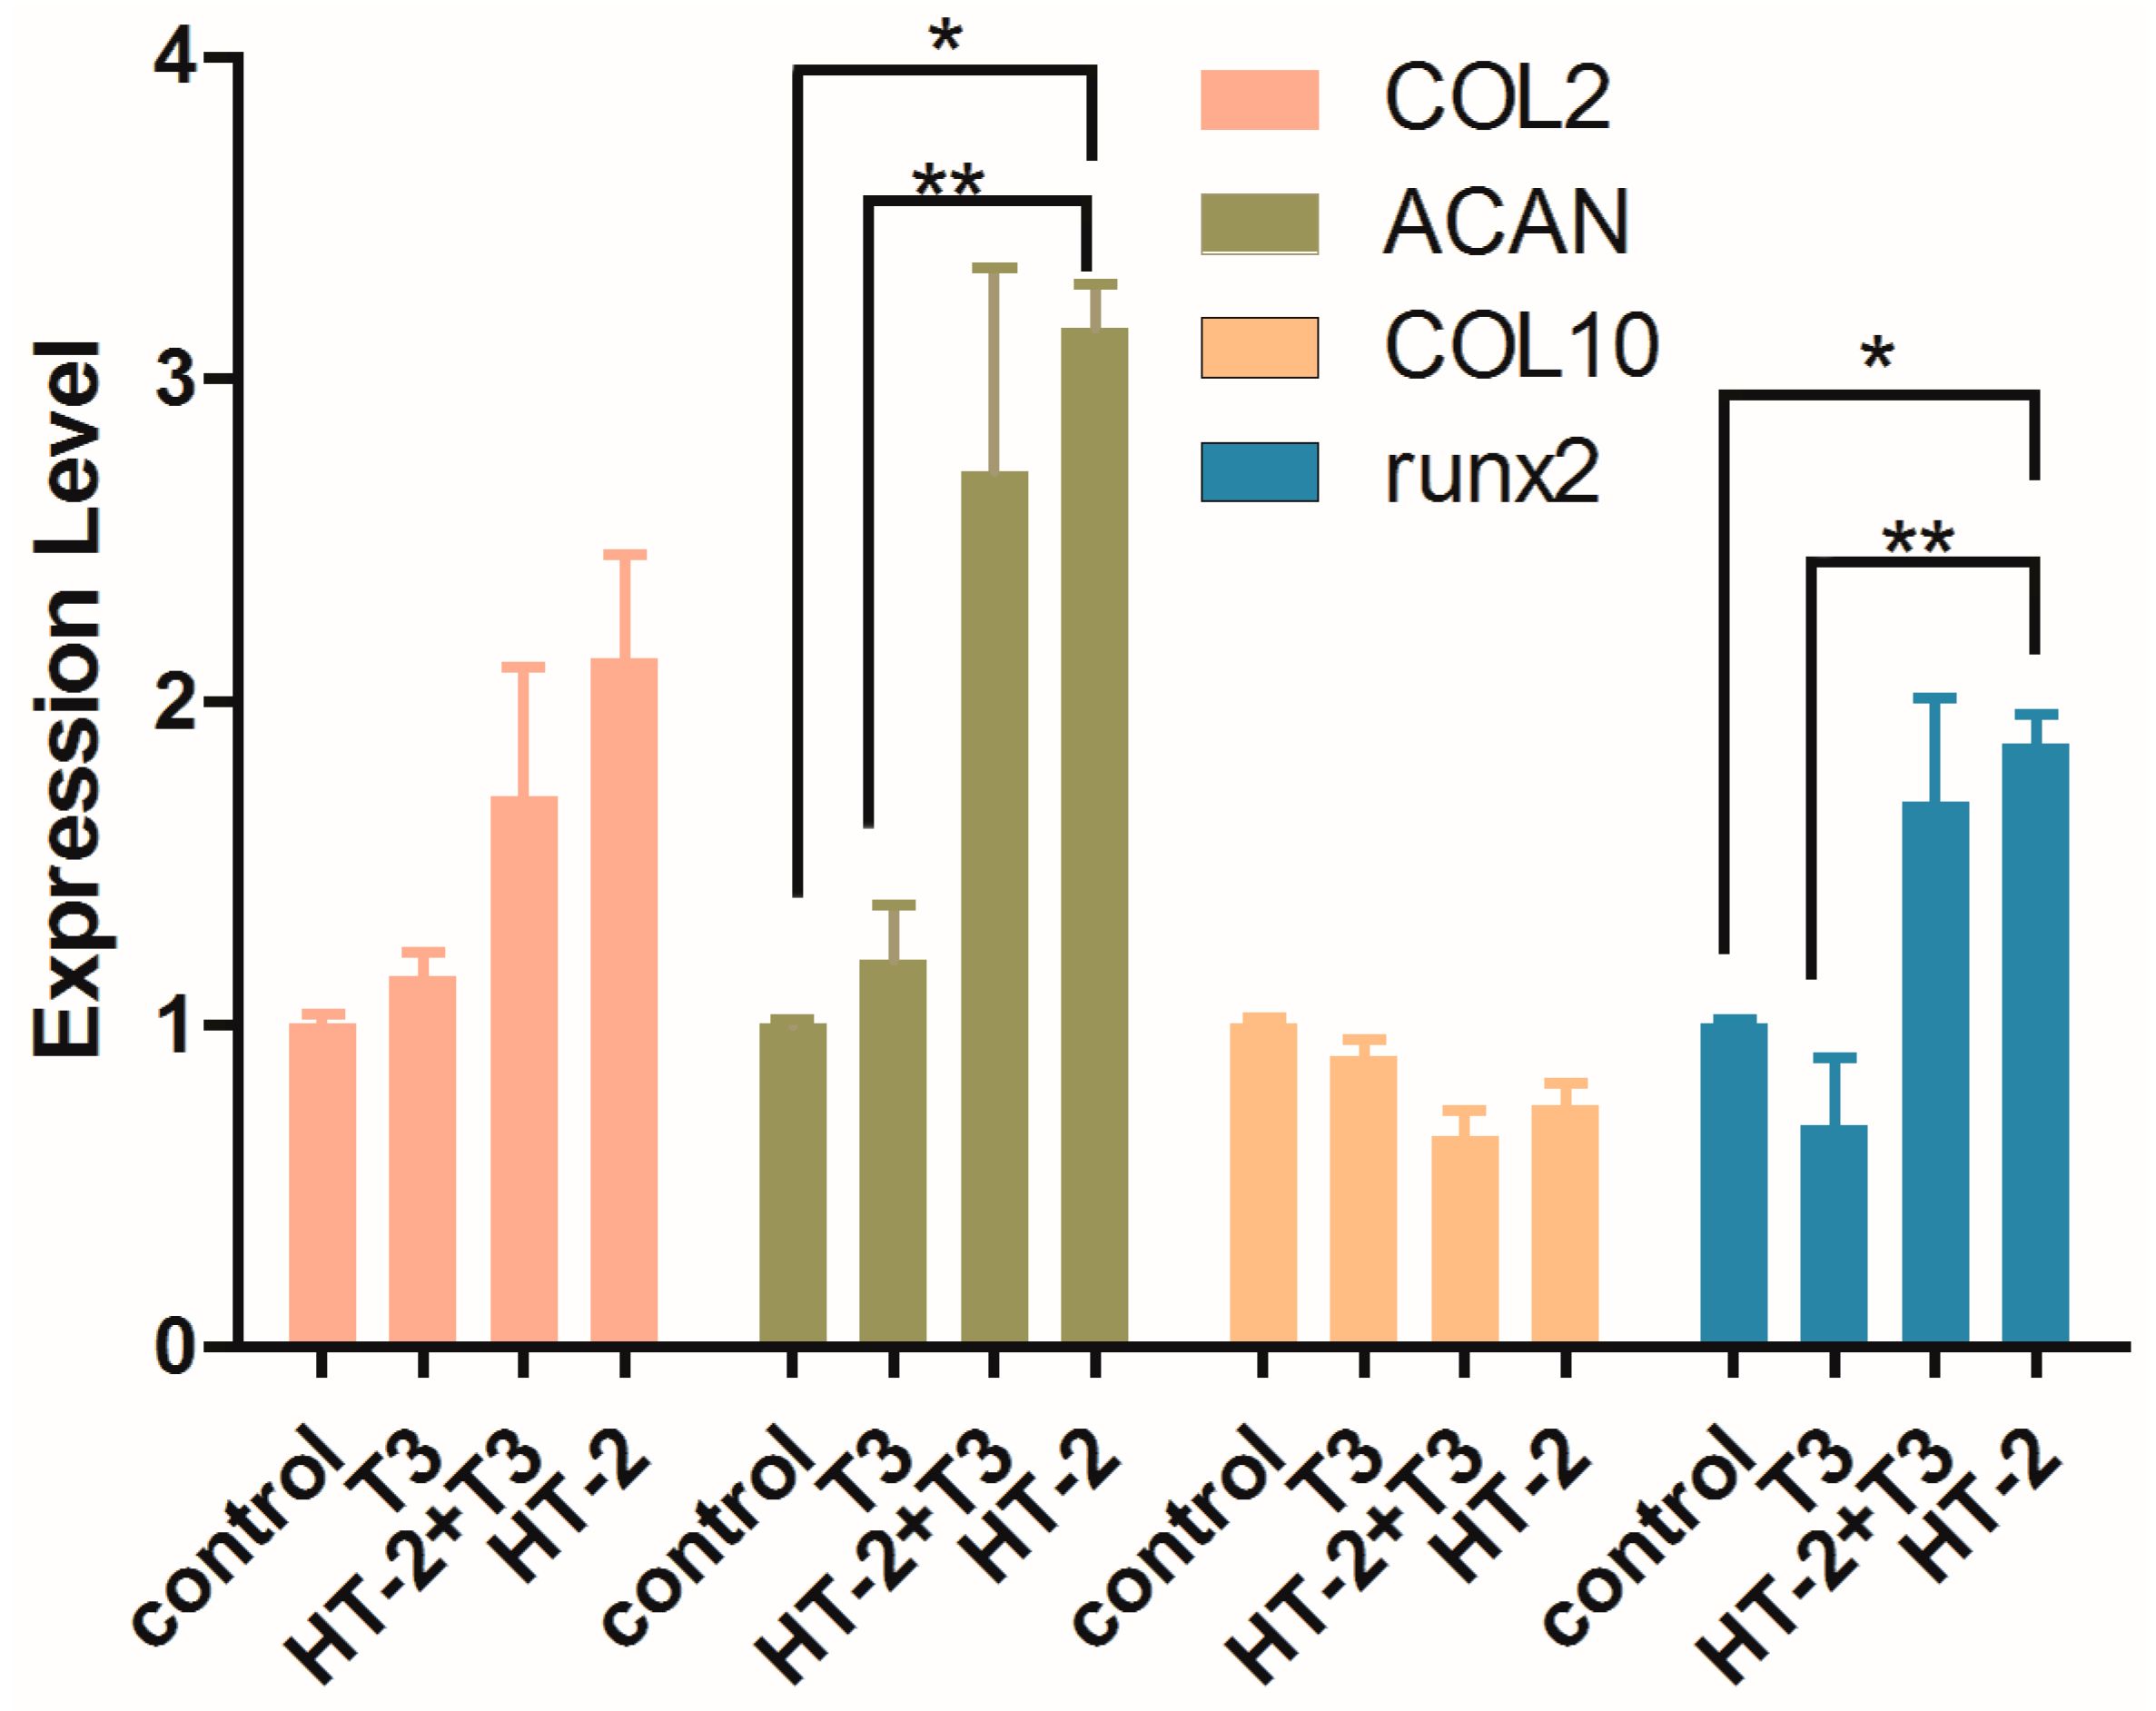
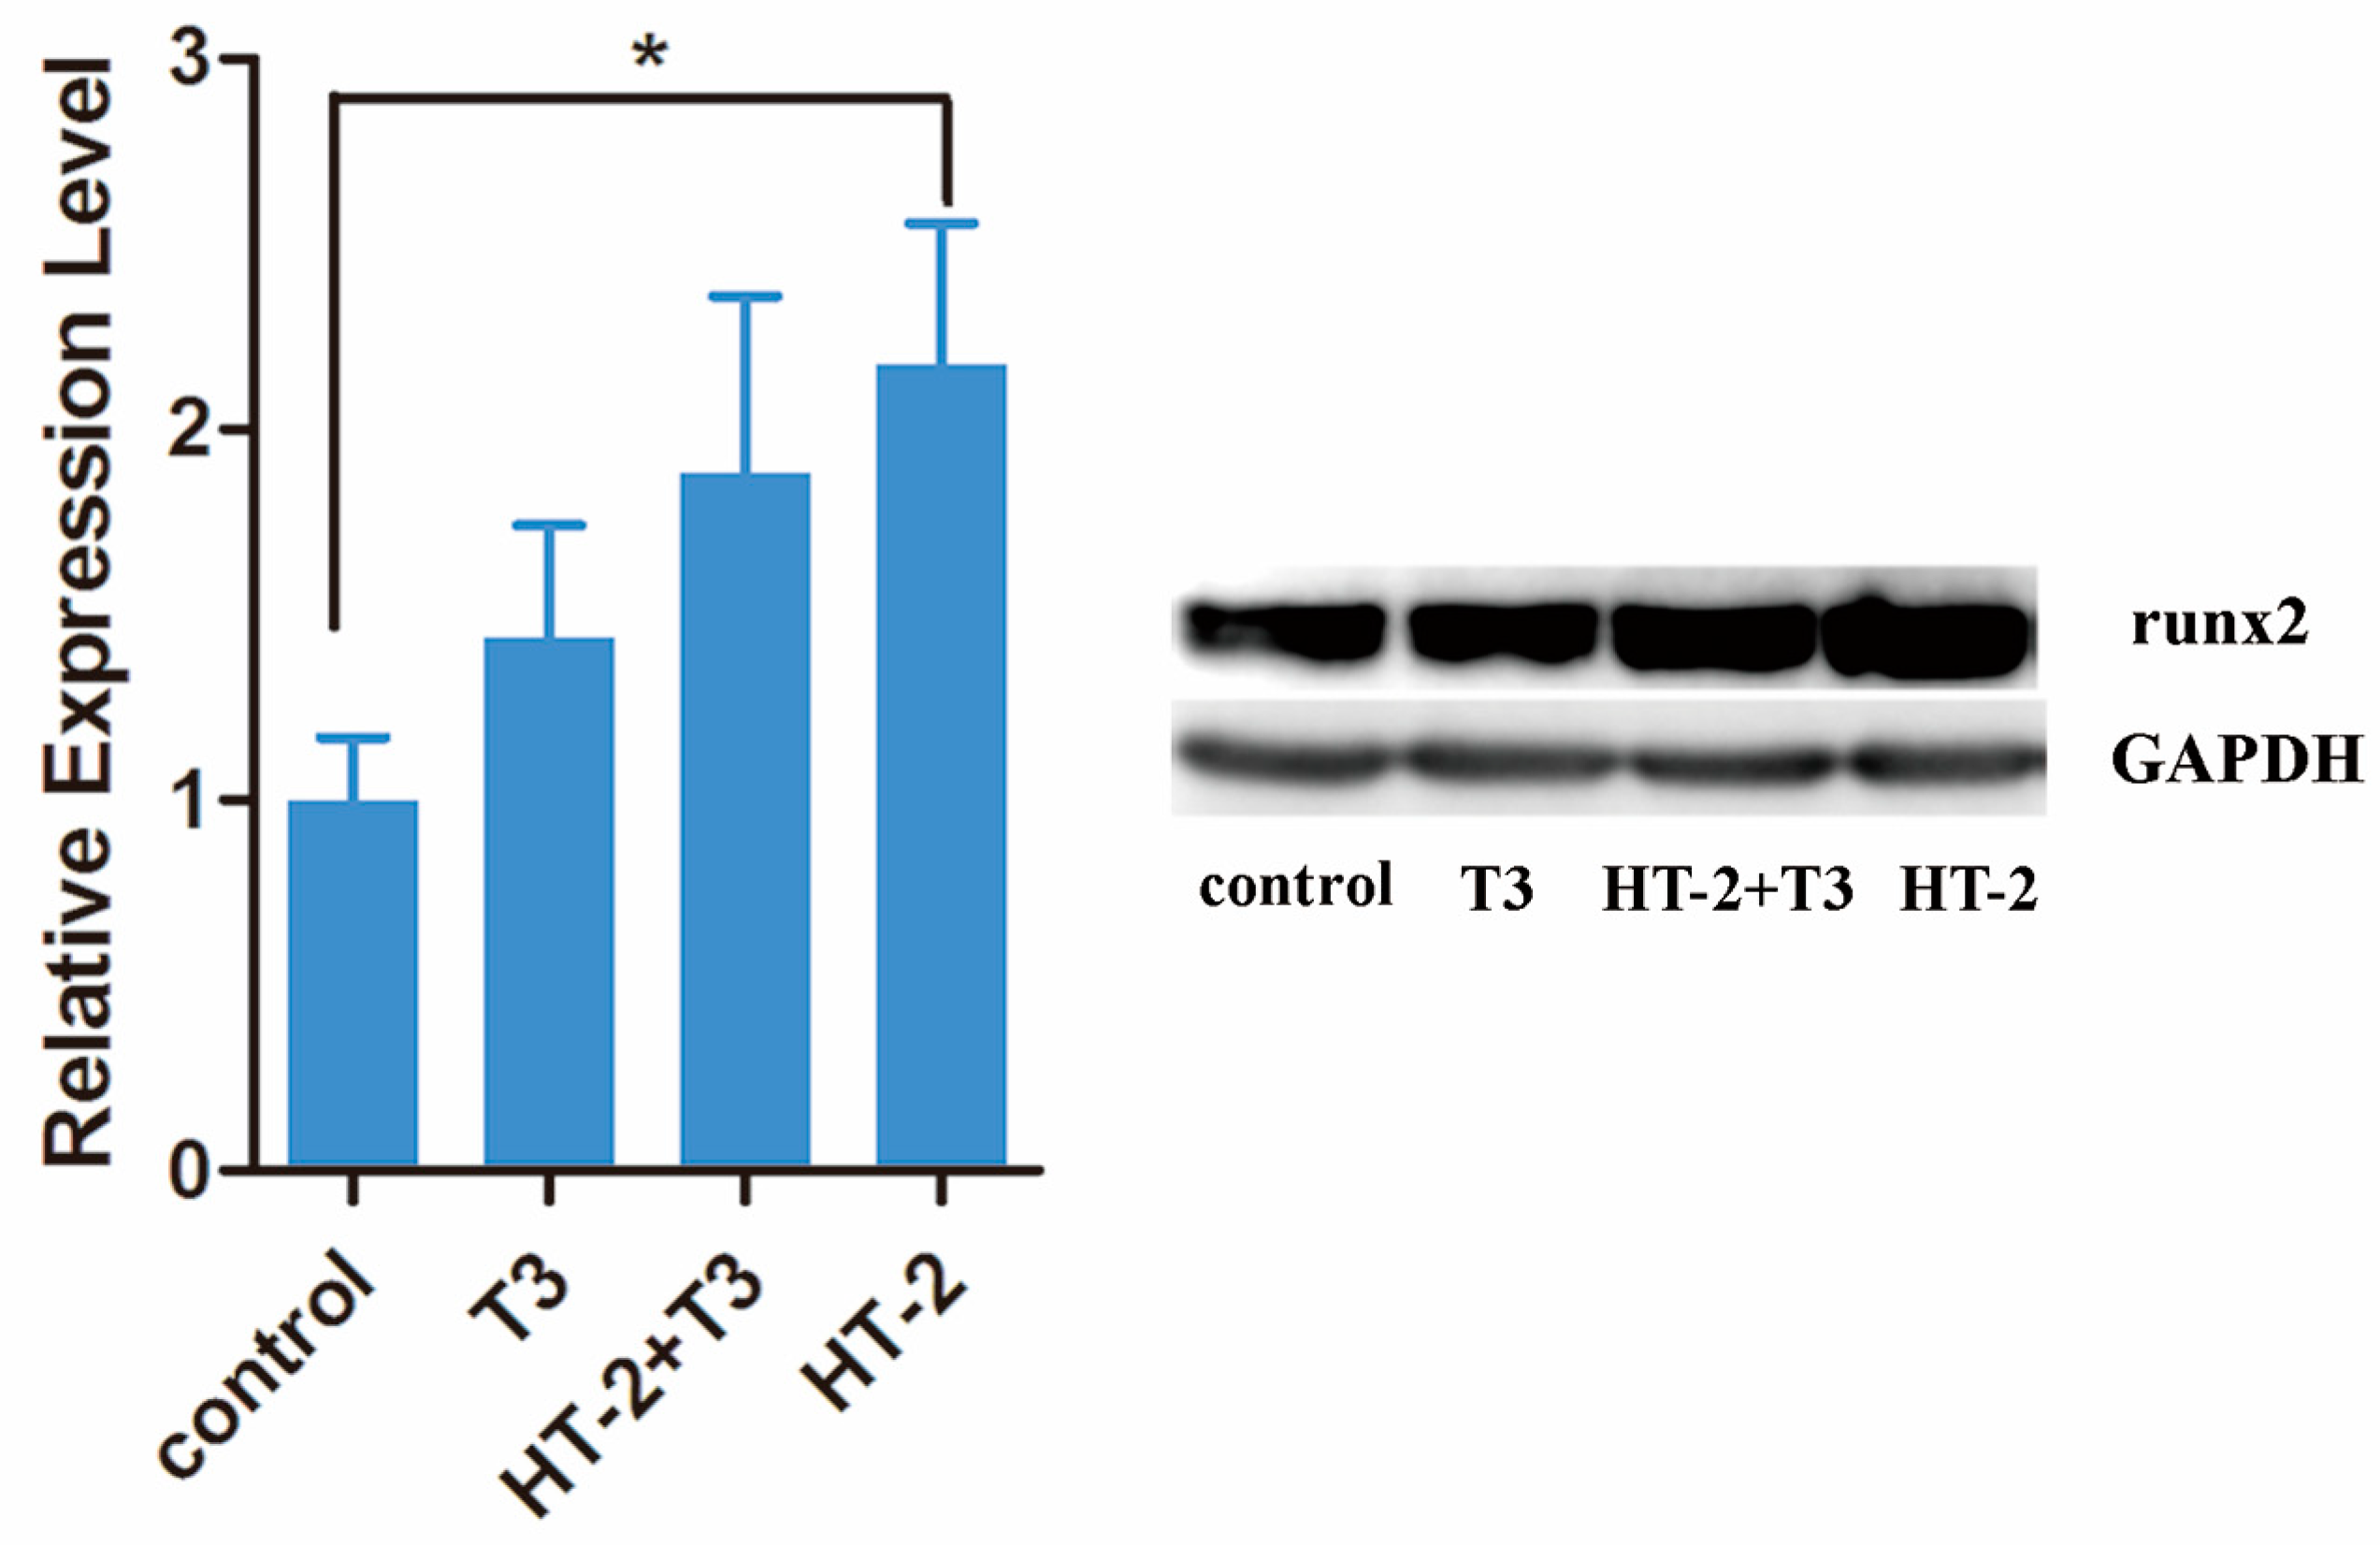
2.3. Expressions of Extracellular Matrix and Hypertrophy Related-Genes in Chondrocyte Cultures Treated with T3 and/or HT-2 Toxin

The expression levels of four chondrocyte phenotype-related genes (aggrecan, collagen types II and X, and runx2) were quantified in C-28/I2 chondrocytes treated with 50 nM T3, 50 nM T3 plus 50 nM HT-2 toxin, or 50 nM HT-2 for 24 h. Compared with the control group, 50 nM T3 did not produce any significant changes in the gene expression levels of collagen types II and X, aggrecan, or runx2 (Figure 3). The expression level of aggrecan was significantly increased in the presence of the HT-2 toxin (p < 0.05), and the level of collagen type II was 2-fold higher than the control (Figure 3). For the combination treatment of T3 and HT-2, gene expression patterns were similar to those by the HT-2 toxin alone (Figure 3).
It is well known that runx2 is a crucial transcription factor for chondrocyte maturation, and it induces the expression of type X collagen during the maturation process [18]. Thus, it was expected that T3, which takes part in hypertrophic differentiation, would increase the expression of runx2 and collagen type X. However, neither were affected by T3 (Figure 3). Surprisingly, the HT-2 toxin significantly increased gene expression of runx2, although type X collagen expression remained unchanged from control levels. Immunoblot analysis was performed to confirm the induction of runx2 at the protein level. Indeed, immunoblotting confirmed the induced expression of runx2 produced by HT-2 (Figure 4). A slight, but not significant, increase in runx2 level was also observed for the T3 treatment. In conclusion, chondrocytes apparently reached the pre-hypertrophic stage in the presence of HT-2, while T3 could not promote this in the relatively short, 24-h-long time of the experiment. The indication that HT-2 would be such a strong inducer of runx2 expression was surprising.

3. Discussion

It is well known that T3 has an important role in growth plate maturation and development [1,2] and that inhibition of the T3 response by dominant-negative nuclear receptors promotes defects in cartilage maturation, ossification, and bone mineralization [19]. The regulation of T3 is particularly important during growth, which is the time when aberrations in endochondral ossification and growth occur in KBD [20]. Mycotoxins T-2 and its metabolite HT-2 have been shown to accumulate especially in the skeletal tissues [11], and they have been considered as possible factors for the KBD.
In this study, the cytotoxicities of T3 and the HT-2 toxin alone were first examined. At most, a very weak T3-mediated cytotoxicity in C-28/I2 chondrocytes was noticed, even at a non-physiologically high dose following 24-h of exposure. Also, a longer, 72-h-treatment, changed the response only minimally. In contrast, the HT-2 toxin had a cytotoxic effect on human chondrocytes at a 50 nM concentration after 24-h-exposure. In growth plate chondrocytes, long-term exposure to T3 inhibits cellular proliferation, which obviously is also related to hypertrophic differentiation [1].
When HT-2 toxin and T3 were administered at equal concentrations, the concentration to induce a statistically significant decrease in cell viability was shifted from 50 nM to 100 nM, indicating a protective effect of T3 on cytotoxicity induced by the HT-2 toxin. This led us to investigate how different molar ratios of the HT-2 toxin and T3 affect chondrocyte viability. When the ratio of HT-2:T3 was 10:1, HT-2 toxin concentrations ≥50 nM caused a significantly reduced cell viability, which was partly rescued by T3. At ratios 100:1 and 1000:1, there were no obvious combined effects on cell viability.
Therefore, although T3 helped to reduce the cytotoxicity produced by the HT-2 toxin to human chondrocytes, it was most effective at an HT-2 toxin concentration range of 50–100 nM. However, the mechanism of the protective effect of T3 to chondrocyte death still remains unknown. In sheep growth plate chondrocytes, it has been shown that T3 is linked to chondrocyte proliferative capacity by targeted FGFR3 to regulate telomerase reverse transcriptase expression and telomerase activity [21]. Also, the bone morphogenetic protein pathway has been implicated to be essential for the function of T3 in chondrogenesis [22].
To study the HT-2 and T3 effects on gene expression, we selected 50 nM T3 and 50 nM HT-2, since the 50 nM concentration of HT-2 was the lowest concentration that decreased the cell viability of cultured chondrocytes. It was also noticed that the HT-2 toxin induced an increase in gene expression of aggrecan and runx2 and a trend for increased expression of type II collagen. The expression of type X collagen, a marker for hypertrophic chondrocytes [23], remained stable. Therefore, the cellular stage after HT-2 exposure can be considered to be pre-hypertrophic [18]. The increased level of runx2 at the protein level confirmed the mRNA result.
As mentioned previously, such a strong response in aggrecan and runx2 by HT-2 in comparison to the T3 effect was surprising, since T3 is known to induce hypertrophic differentiation. In tissue engineering applications, T3 has been shown to increase the expression and synthesis of type II collagen [24], and improve articular cartilage surface architecture [25]. As the metabolite of T-2 toxin, it would be reasonable to assume that the HT-2 toxin will share similarity with the T-2 toxin, which leads to cartilage destruction by the degradation of the extracellular matrix [26,27]. In another study, the T-2 toxin promoted aggrecanase-2 mRNA expression [28]. The ROS-NFκB-HIF-2α pathway was shown to be essential for the catabolic effects of the T-2 toxin [29]. However, in this cell culture model, it was not possible to confirm the possible anabolic or catabolic effects of HT-2 or T3 at the protein level due to the limited contents of extracellular matrix molecules secreted into the medium during the exposure time.

4. Conclusions

In conclusion, the HT-2 toxin led to significant cell death of human chondrocytes at rather low concentrations (threshold above 50 nM). Supplementation of T3 in cell culture medium decreased the cytotoxic effects of the HT-2 toxin only when it was applied in molar ratio 1:10, while other molar combinations failed to produce protective effects. The decrease in cell viability caused by the HT-2 toxin may be partly related to the finding that the cells appeared to shift quickly into a pre-hypertrophic state, indicated by an increased expression of aggrecan and runx2, and partly collagen type II. However, the major part of the HT-2 toxin effects is most likely due to its toxicity. Thus, further studies on the exact mechanism underlying the combined effect of T3 and HT-2 toxin on chondrocytes are warranted to provide a better understanding of the mechanism of HT-2 toxin cytotoxicity.

5. Materials and Methods

5.1. Chondrocyte Culture

The immortalized human chondrocyte cell line C28/I2 was a kind gift from Dr. Mary B. Goldring (Hospital for Special Surgery, New York, NY, USA). Chondrocytes were cultured in Dulbecco’s modified Eagle’s medium (DMEM/F12; Hyclone, Logan, UT, USA), supplemented with 10% fetal bovine serum (FBS; Zhejiang Tianhang Biological Technology Stock Co., Huzhou, China), 100 U/mL penicillin/100 µg/mL streptomycin (Hyclone) at 37 °C and 5% CO2. During the culture period, the cells were passaged at subconfluency by sequential digestion in trypsin/EDTA (Hyclone; Sigma, St Louis, MO, USA), and the medium was replaced every 2 days [30]. Three to four independent experiments were performed.

5.2. MTT Cytotoxicity Assay

Human chondrocytes C-28/I2 were seeded in 96-well plates at a density of 6.5 × 10³ cells/well. After incubation for 24 h, the culture medium was replaced to fresh medium (DMEM/F12 with 10% FBS and 1% penicillin and streptomycin) containing several mixture concentrations of T3 and/or HT-2 toxin (Table 1), then treated for another 24 or 72 h. At the end of the intervention, the medium with T3 and/or HT-2 toxin was removed and replaced with fresh medium, and 20 μL aliquots of 5 mg/mL MTT stock solution (Amresco, Solon, OH, USA) were added into each well. After 4 h incubation in the presence of MTT to allow time for formazan formation, the medium was removed, and 150 μL dimethylsulfoxide was used to dissolve the formazan crystals from the wells. Optical densities of the samples were measured with a multi-plate reader (Infinite M200; Tecan Group, Männedorf, Switzerland) at a wavelength of 490 nm. The control groups included blank controls and normal controls. The blank control was fresh medium without the cells, and the normal control referred to the medium from the cell without T3 or the HT-2 toxin.

5.3. RNA Isolation and Quantitative Real-Time RT-PCR

Total RNA was isolated from the chondrocytes according to the manufacturer’s protocols using Trizol reagent (Invitrogen, Carlsbad, CA, USA). Reverse-transcription was performed using PrimeScript™ RT Master Mix Kit (Takara, Kusatsu, Shiga, Japan). Real-time PCR reactions were conducted in the Real-Time PCR Detection System (Bio-Rad, Hercules, CA, USA) using TB Green Premix Ex Taq™ II Kit (Takara), using the following parameters: 95 °C for 5 s, then 60 °C for 30 s, and 72 °C for 30 s, 40 cycles. The fold changes of relative gene expression were calculated with the 2(−∆∆Ct) method [31] using GAPDH as the reference gene. The primer sequences used in this study are shown in Table 2.

5.4. Immunoblot Analysis

The total protein was extracted from the cultured chondrocytes according to the manufacturer’s protocols using an RIPA buffer (Beyotime, Shanghai, China). After denaturation, 30 μg of total protein was electrophoresed for immunoblot analysis. The blots were probed with primary antibodies directed against runx2 (Abcam, Cambridge, UK) overnight at 4 °C. GAPDH polyclonal antibody (Bioworld, Minneapolis, MN, USA) was used as a housekeeping reference. Peroxidase-conjugated goat anti-rabbit IgG (Thermo Fisher Scientific, Waltham, MA, USA) or goat anti-mouse IgG (Bioss, Shanghai, China) antibodies were used to visualize proteins using Western blotting chemiluminescence luminol reagent on a GeneGnome XRQ Western Blotting Analysis System (Syngene, Frederick, MD, USA). Working concentrations for each antibody were determined empirically based on the recommended stock solutions. Image J was used to quantify the band intensities of proteins of interest in the experimental and control groups.

5.5. Statistical Analysis

All experiments were performed three to four times. Parametric statistical analyses were selected to compare the effect of T3 and/or HT-2 toxin on C-28/I2 chondrocytes. One-way analysis of variance (ANOVA) was used to analyze the general difference, and the LSD-t (equal variances assumed) or Dunnett’s T3-test (equal variances not assumed) post-hoc tests were used for further pairwise comparison with SPSS 13.0 (SPSS Inc., Chicago, IL, USA). The difference was considered statistically significant when the p-value was less than 0.05.

Supplementary Materials

The following are available online at https://0-www-mdpi-com.brum.beds.ac.uk/2072-6651/11/11/667/s1, Figure S1: The dose-effect plot for Figure 2 generated by CompuSyn software.

Author Contributions

Conceptualization, M.J.L. and X.G.; methodology, F.Z., M.J.L. and, X.G.; software, F.Z.; resources, W.S. and P.Z.; data curation, Y.Z. and H.W.; writing—original draft preparation, F.Z.; writing—review and editing, M.J.L., W.S., P.Z., Y.Z., H.W. and X.G.; supervision, M.J.L. and X.G.; project administration, X.G.; funding acquisition, X.G.

Funding

This research was funded by the National Natural Science Foundation of China, grant numbers 81620108026 and 81472924.

Acknowledgments

We thank Mary B. Goldring for donating the immortalized human chondrocyte cell line C-28/I2. We thank Daniel Marcellino, Umeå University for checking the language of the manuscript.

Conflicts of Interest

The authors declare no conflict of interest. The funders had no role in the design of the study; in the collection, analyses, or interpretation of data; in the writing of the manuscript, or in the decision to publish the results.

References

  1. Robson, H.; Siebler, T.; Stevens, D.A.; Shalet, S.M.; Williams, G.R. Thyroid hormone acts directly on growth plate chondrocytes to promote hypertrophic differentiation and inhibit clonal expansion and cell proliferation. Endocrinology 2000, 141, 3887–3897. [Google Scholar] [CrossRef] [PubMed]
  2. Bassett, J.H.D.; Williams, G.R. The molecular actions of thyroid hormone in bone. Trends Endocrinol. Metab. 2003, 14, 356–364. [Google Scholar] [CrossRef]
  3. Lee, J.K.; Gegg, C.A.; Hu, J.C.; Reddi, A.H.; Athanasiou, K.A. Thyroid hormone enhance the biomechanical functionality of scaffold-free neocartilage. Arthritis Res. Ther. 2015, 17, 28. [Google Scholar] [CrossRef] [PubMed]
  4. Fernandez-Pernas, P.; Fafian-Labora, J.; Lesende-Rodriguez, I.; Mateos, J.; de la Fuente, A.; Fuentes, I.; de Toro Santos, J.; Blanco Garcia, F.; Arufe, M.C. 3,3′,5-triiodo-L-thyronine increases in vitro chondrogenesis of mesenchymal stem cells from umbilical cord stroma through SRC2. J. Cell. Biochem. 2016, 117, 2097–2108. [Google Scholar] [CrossRef] [PubMed]
  5. Wang, L.; Shao, Y.Y.; Ballock, R.T. Thyroid hormone interacts with the Wnt/β-catenin signaling pathway in the terminal differentiation of growth plate chondrocytes. J. Bone Miner. Res. 2007, 22, 1988–1995. [Google Scholar] [CrossRef] [PubMed]
  6. Ray, R.D.; Asling, C.W.; Walker, D.G.; Simpson, M.E.; Li, C.H.; Evans, H.M. Growth and differentiation of the skeleton in thyreoidectomized-hypophysectomized rats treated with thyroxin, growth hormone, and combination. J. Bone Jt. Surg. Am. 1954, 36, 94–103. [Google Scholar] [CrossRef]
  7. Nagase, H.; Nagasawa, Y.; Tachida, Y.; Sakakibara, S.; Okutsu, J.; Suematsu, N.; Arita, S.; Shimada, K. Deiodinase 2 upregulation demonstrated in osteoarthritis patients cartilage causes cartilage destruction in tissue-specific transgenic rats. Osteoarthr. Cartil. 2013, 21, 514–523. [Google Scholar] [CrossRef]
  8. Xiong, Y.M.; Song, R.X.; Jiao, X.H.; Du, X.L.; Liu, J.F.; Liu, X.; Chen, Q. PMS13-Study on mechanism of type 2 deiodinase gene and Erk signal transduction in Kashin-Beck disease. Value Health 2014, 17, A43. [Google Scholar] [CrossRef]
  9. Wen, Y.; Zhang, F.; Li, C.; He, S.; Tan, W.; Lei, Y.; Zhang, Q.; Yu, H.; Zheng, J.; Guo, X. Gene expression analysis suggests bone development-related genes GDF5 and DIO2 are involved in the development of Kashin-Beck disease in children rather than adults. PLoS ONE 2014, 9, e103618. [Google Scholar] [CrossRef]
  10. Van der Fels-Klerx, H.J. Occurrence data of trichothecene mycotoxins T-2 toxin and HT-2 toxin in food and feed. EFSA Support. Publ. 2010, 7, 1–43. [Google Scholar] [CrossRef]
  11. Yu, F.F.; Lin, X.L.; Yang, L.; Liu, H.; Wang, X.; Fang, H.; Lammi, M.J.; Guo, X. Comparison of T-2 toxin and HT-2 toxin distributed in the skeletal system with that in other tissues of rats by acute toxicity test. Biomed. Environ. Sci 2017, 30, 851–854. [Google Scholar] [CrossRef] [PubMed]
  12. Yu, F.F.; Lin, X.L.; Liu, H.; Yang, L.; Goldring, M.B.; Lammi, M.J.; Guo, X. Selenium promotes metabolic conversion of T-2 toxin to HT-2 toxin in cultured human chondrocytes. J. Trace Elem. Med. Biol. 2017, 44, 218–224. [Google Scholar] [CrossRef]
  13. Li, Y.; Wang, Z.; Beier, R.C.; Shen, J.; de Smet, D.; de Saeger, S.; Zhang, S. T-2 toxin, a trichothecene mycotoxin: Review of toxicity, metabolism, and analytical methods. J. Agric. Food Chem. 2011, 59, 3441–3453. [Google Scholar] [CrossRef] [PubMed]
  14. Yu, F.F.; Lin, X.L.; Wang, X.; Ping, Z.G.; Guo, X. Comparison of apoptosis and autophagy in human chondrocytes induced by the T-2 and HT-2 toxins. Toxins 2019, 11, 260. [Google Scholar] [CrossRef] [PubMed]
  15. Liu, J.; Wang, L.; Guo, X.; Pang, Q.; Wu, S.; Wu, C.; Xu, P.; Bai, Y. The role of mitochondria in T-2 toxin-induced human chondrocytes apoptosis. PLoS ONE 2014, 9, e108394. [Google Scholar] [CrossRef]
  16. Chang, Y.; Wang, X.; Sun, Z.; Jin, Z.; Chen, M.; Wang, X.; Lammi, M.J.; Guo, X. Inflammatory cytokine of IL-1β is involved in T-2 toxin-triggered chondrocyte injury and metabolism imbalance by the activation of Wnt/β-catenin signaling. Mol. Immunol. 2017, 91, 195–201. [Google Scholar] [CrossRef]
  17. Li, D.; Han, J.; Guo, X.; Qu, C.; Yu, F.; Wu, X. The effects of T-2 toxin on the prevalence and development of Kashin-Beck disease in China: A meta-analysis and systematic review. Toxicol. Res. 2016, 5, 731–751. [Google Scholar] [CrossRef]
  18. Bruderer, M.; Richards, R.G.; Alini, M.; Stoddart, M.J. Role and regulation of RUNX2 in osteogenesis. Eur. Cell Mater. 2014, 28, 269–286. [Google Scholar] [CrossRef]
  19. Desjardin, C.; Charles, C.; Benoist-Lasselin, C.; Riviere, J.; Gilles, M.; Chassande, O.; Morgenthaler, C.; Laloe, D.; Lecardonnel, J.; Flamant, F.; et al. Chondrocytes play a major role in the stimulation of bone growth by thyroid hormone. Endocrinology 2014, 155, 3123–3135. [Google Scholar] [CrossRef]
  20. Guo, X.; Ma, W.J.; Zhang, F.; Ren, F.L.; Qu, C.J.; Lammi, M.J. Recent advances in the research of an endemic osteochondropathy in China: Kashin-Beck disease. Osteoarthr. Cartil. 2014, 22, 1774–1783. [Google Scholar] [CrossRef]
  21. Smith, L.B.; Belanger, J.M.; Oberbauer, A.M. Fibroblast growth factor receptor 3 effects on proliferation and telomerase activity in sheep growth plate chondrocytes. J. Anim. Sci. Biotechnol. 2012, 3, 39. [Google Scholar] [CrossRef]
  22. Karl, A.; Olbrich, N.; Pfeifer, C.; Berner, A.; Zellner, J.; Kujat, R.; Angele, P.; Nerlich, M.; Mueller, M.B. Thyroid hormone-induced hypertrophy in mesenchymal stem cell chondrogenesis is mediated by bone morphogenetic protein-4. Tissue Eng. A 2014, 20, 178–188. [Google Scholar] [CrossRef] [PubMed]
  23. Von der Mark, K.; Kirsch, T.; Nerlich, A.; Kuss, A.; Weseloh, G.; Glückert, K.; Stöss, H. Type X collagen synthesis in human osteoarthritic cartilage. Indication of chondrocyte hypertrophy. Arthritis Rheumatol. 1992, 35, 806–811. [Google Scholar] [CrossRef] [PubMed]
  24. Whitney, G.A.; Kean, T.J.; Fernandes, R.J.; Waldman, S.; Tse, M.Y.; Pang, S.C.; Mansour, J.M.; Dennis, J.E. Thyroxine increases collagen type II expression and accumulation in scaffold-free tissue-engineered articular cartilage. Tissue Eng. A 2018, 24, 369–381. [Google Scholar] [CrossRef] [PubMed]
  25. Jia, P.T.; Zhang, X.L.; Zuo, H.N.; Lu, X.; Gai, P.Z. A study on role of triiodothyronine (T3) hormone on the improvement of articular cartilage surface architecture. Exp. Toxicol. Pathol. 2017, 69, 625–629. [Google Scholar] [CrossRef] [PubMed]
  26. Chen, J.; Chu, Y.; Cao, J.; Wang, W.; Liu, J.; Wang, J. Effects of T-2 toxin and selenium on chondrocyte expression of matrix metalloproteinases (MMP-1, MMP-13), α2-macroglobulin (α2M) and TIMPs. Toxicol. Vitro 2011, 25, 492–499. [Google Scholar] [CrossRef] [PubMed]
  27. Li, Y.; Zou, N.; Wang, J.; Wang, K.W.; Li, F.Y.; Chen, F.X.; Sun, B.Y.; Sun, D.J. TGF-β1/Smad3 signaling pathway mediates T-2 toxin-induced decrease of type II collagen in cultured rat chondrocytes. Toxins 2017, 9, 359. [Google Scholar] [CrossRef]
  28. Li, S.Y.; Cao, J.L.; Shi, Z.L.; Chen, J.H.; Zhang, Z.T.; Hughes, C.E.; Caterson, B. Promotion of the articular cartilage proteoglycan degradation by T-2 toxin and selenium protective effect. J. Zhejiang Univ. Sci. B 2008, 9, 22–33. [Google Scholar] [CrossRef]
  29. Tian, J.; Yan, J.; Wang, W.; Zhong, N.; Tian, L.; Sun, J.; Min, Z.; Ma, J.; Lu, S. T-2 toxin enhances catabolic activity of hypertrophic chondrocytes through ROS-NF-κB-HIF-2α pathway. Toxicol. Vitro 2012, 26, 1106–1113. [Google Scholar] [CrossRef]
  30. Goldring, M.B. Immortalization of human articular chondrocytes for generation of stable, differentiated cell lines. Methods Mol. Med. 2004, 100, 23–36. [Google Scholar] [CrossRef]
  31. Livak, K.J.; Schmittgen, T.D. Analysis of relative gene expression data using real-time quantitative PCR and the 2(-delta delta C(T)) method. Methods 2001, 25, 402–408. [Google Scholar] [CrossRef]
Figure 1. (A) Effect of T3 on viability of human C-28/I2 chondrocytes cultured for 24 and 72 h at T3 concentrations of 10, 50, 100, 500, and 1000 nM; (B) effect of HT-2 on human C-28/I2 chondrocytes cultured for 24 h at 0.1, 0.5, 1, 5, 10, 50, 100, 200, 500 1000, 5000, and 10,000 nM concentrations. The values show means ± SEM of three independent experiments. Cell viability of non-treated cultures in T3 experiments for 24 and 72 h were 100.0% ± 1.11% and 100.0% ± 10.06%, respectively, and in the HT-2 experiment, 100.0% ± 4.7%. Statistically significant differences against control cultures are indicated with asterisks, * p < 0.05 and ** p < 0.01.
Toxins 11 00667 g001
Figure 2. Cytotoxicity of T3 and the HT-2 toxin. The ratios of HT-2:T3 were (A) 1:1, (B) 1:10, (C) 1:100, (D) 1:1000, (E) 10:1, (F) 100:1, and (G) 1000:1. The values are shown as means ± SEM of three independent experiments. The cell viability in the non-treated control cultures were (A) 100.0% ± 4.5%, (B) 100.0% ± 3.7%, (C) 100.0% ± 5.0%, (D) 100.0% ± 4.1%, (E) 100.0% ± 0.4%, (F) 100.0% ± 1.3%, and (G) 100.0% ± 5.4%. Statistically significant differences against control cultures are marked with asterisks, * p < 0.05 and ** p < 0.01. The statistically significant differences observed between the HT-2 toxin and the mixture of the HT-2 toxin and T3 are also marked in (EG). The amounts of T3 and HT-2 toxin for each mixture are provided in Table 1.
Toxins 11 00667 g002
Figure 3. Gene expression levels of collagen types II and X, aggrecan and runx2, in C-28/I2 chondrocytes in control cultures and those treated with 50 nM T3 alone, 50 nM T3 plus 50 nM HT-2 toxin, and 50 nM HT-2 alone for 24 h. The fold changes are shown as mean ± SEM from three independent experiments. Statistically significant differences against control cultures are marked with asterisks, * p < 0.05 and ** p < 0.01.
Toxins 11 00667 g003
Figure 4. Protein expression levels of runx2 in C-28/I2 chondrocytes in control cultures and those treated with 50 nM T3 alone, 50 nM T3 plus 50 nM HT-2 toxin, and 50 nM HT-2 alone for 24 h. The fold changes are shown as mean ± SEM from four independent experiments. Statistically significant differences against control cultures are marked with asterisks, * p < 0.05.
Toxins 11 00667 g004
Table 1. The contents of the HT-2 toxin and T3 mixtures.
RatiosComponentsConcentrations (nM)
1:1HT-21, 5, 10, 50, 100, 200, 500
T31, 5, 10, 50, 100, 200, 500
HT-2:T31:1, 5:5, 10:10, 50:50, 100:100, 200:200, 500:500
1:10HT-21, 5, 10, 50, 100
T310, 50, 100, 500, 1000
HT-2:T31:10, 5:50, 10:100, 50:500, 100:1000
1:100HT-21, 5, 10, 50, 100
T3100, 500, 10, 50, 100, 200, 500
HT-2:T31:100, 5:500, 10:1000, 50:5000, 100:10,000
1:1000HT-20.1, 0.5, 1, 5, 10
T3100, 500, 1000, 5000, 10,000
HT-2:T30.1:100, 0.5:500, 1:1000, 5:5000, 10:10,000
10:1HT-210, 50, 100, 500, 1000
T31, 5, 10, 50, 100
HT-2:T310:1, 50:5, 100:10, 500:50, 1000:100
100:1HT-210, 5,0 100, 500, 1000
T30.1, 0.5, 1, 5, 10
HT-2:T310:0.1, 50:0.5, 100:1, 500:5, 1000:10
1000:1HT-2100, 500, 1000, 5000, 10,000
T30.1, 0.5, 1, 5, 10
HT-2:T3100:0.1, 500:0.5, 1000:1, 5000:5, 10,000:10
Table 2. Specific primers for quantitative RT-PCR.
GenesForward PrimerReverse Primer
COL2A1AGACTGGCGAGACTTGCGTCTAATCTCGGACGTTGGCAGTGTTG
ACANCTGAACGACAGGACCATCGAACGTGCCAGATCATCACCACA
COL10A1GACTCATGTTTGGGTAGGCCTGTACCCTGAAGCCTGATCCAGGTA
Runx2AGCTTCTGTCTGTGCCTTCTGGGGAGTGGACGAGGCAAGAGTTT
GAPDHGCACCGTCAAGGCTGAGAACTGGTGAAGACGCCAGTGGA

