Measurement of Microcystin and Nodularin Activity in Human Urine by Immunocapture-Protein Phosphatase 2A Assay

 , , and
Abstract
: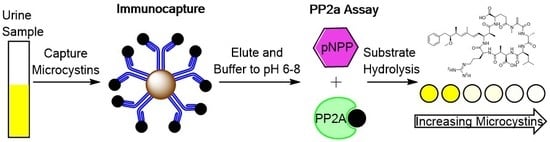
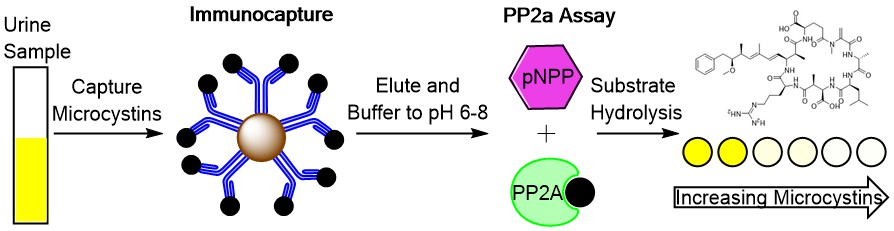
1. Introduction
2. Results
2.1. Method Optimization
2.2. Recovery of MC-RR, MC-LR and MC-LF after IC
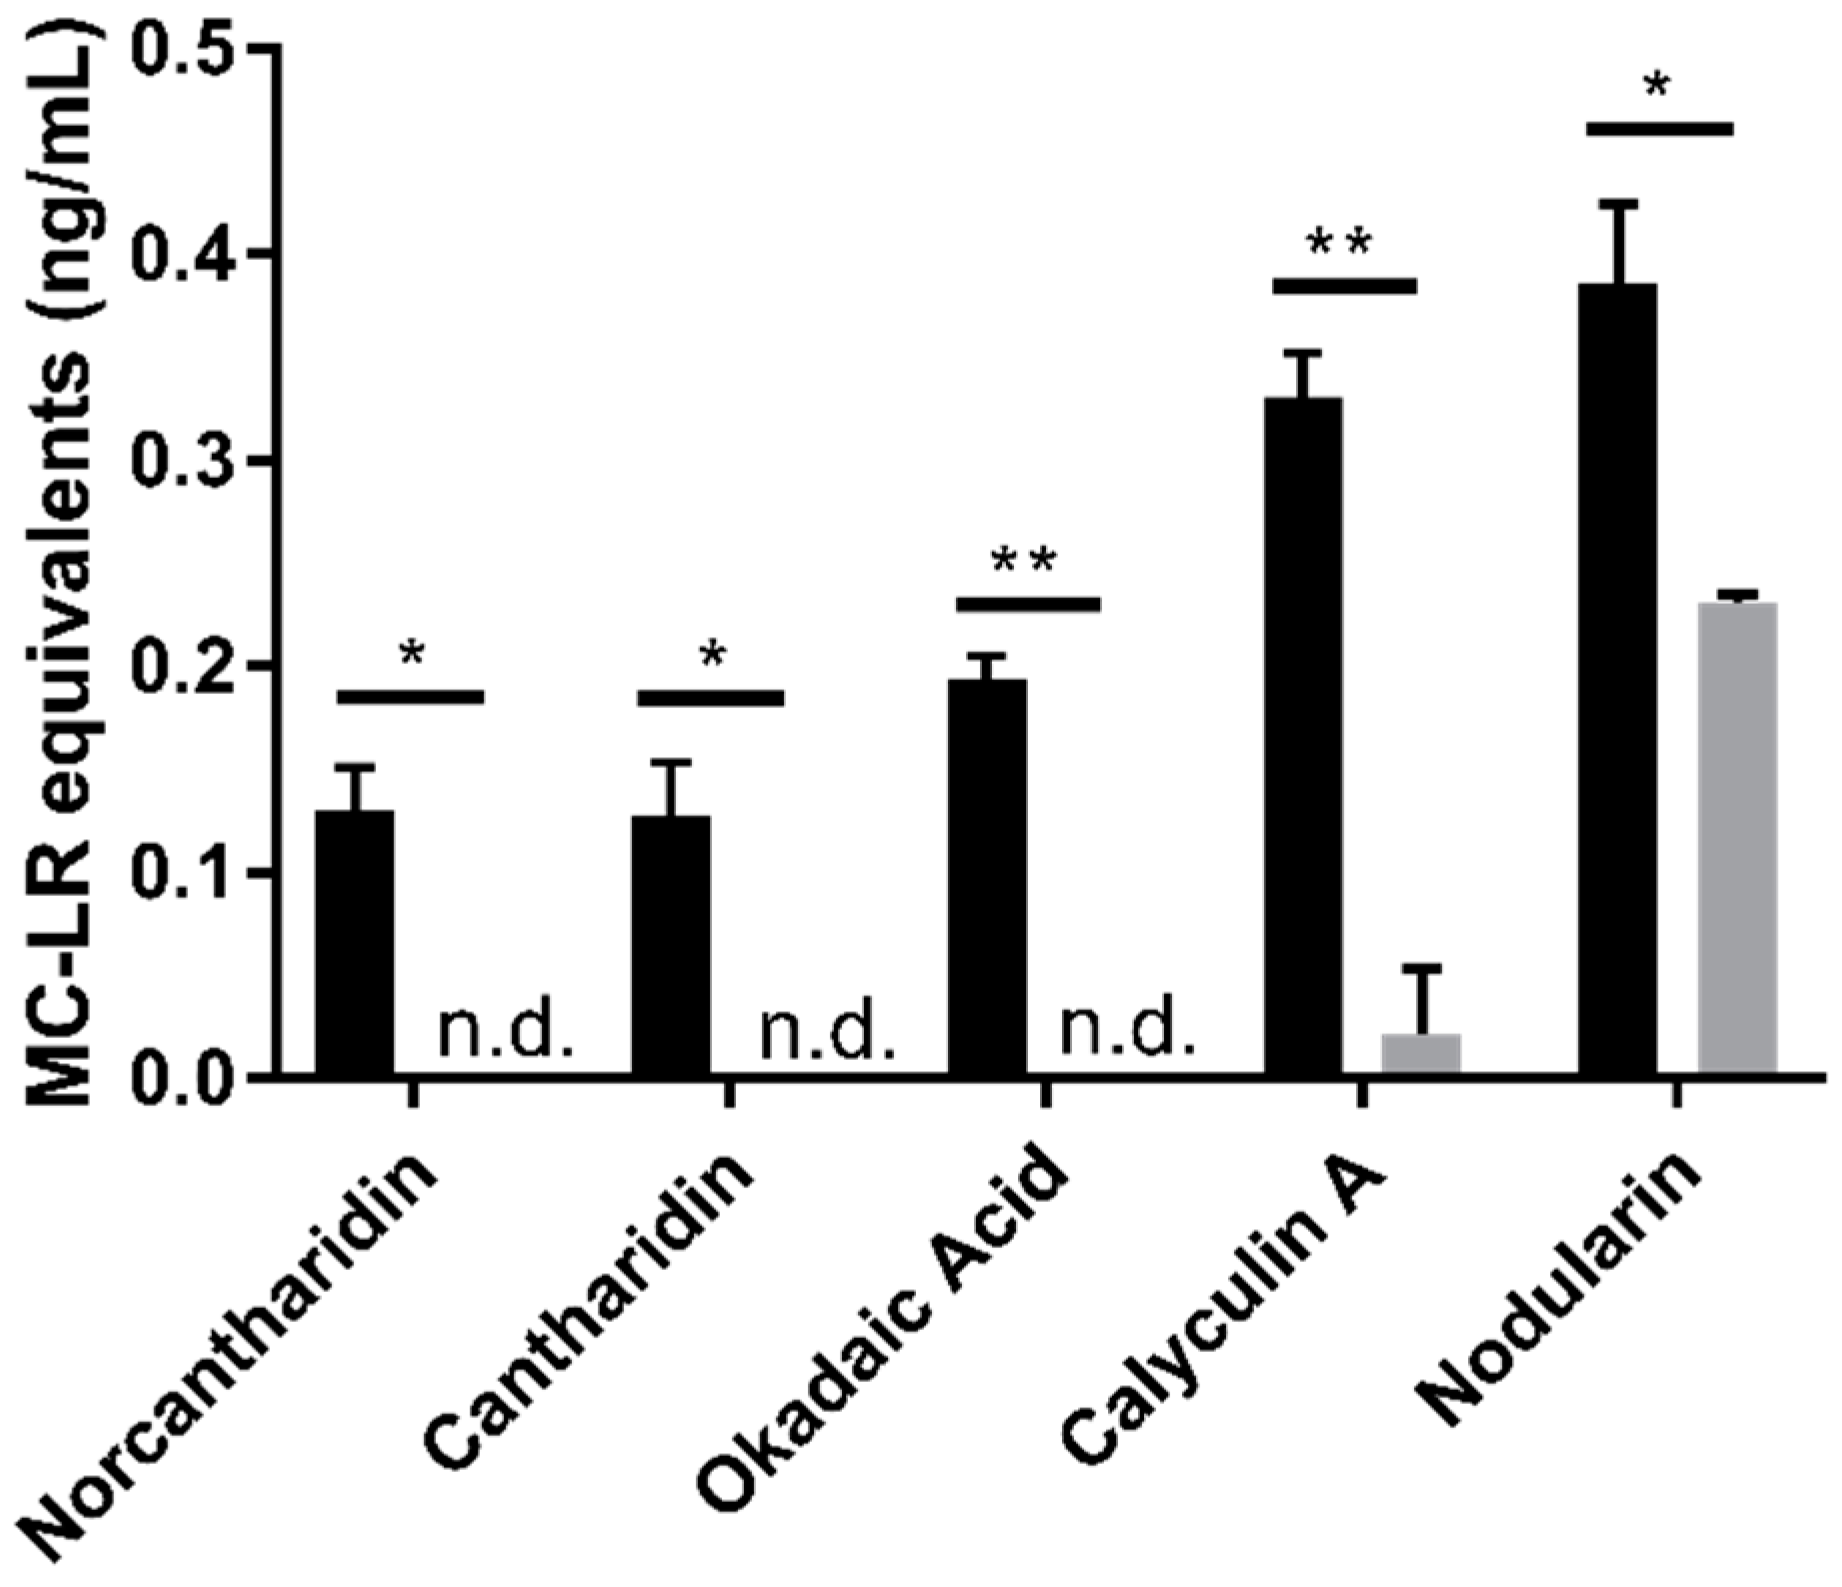
2.3. Specificity
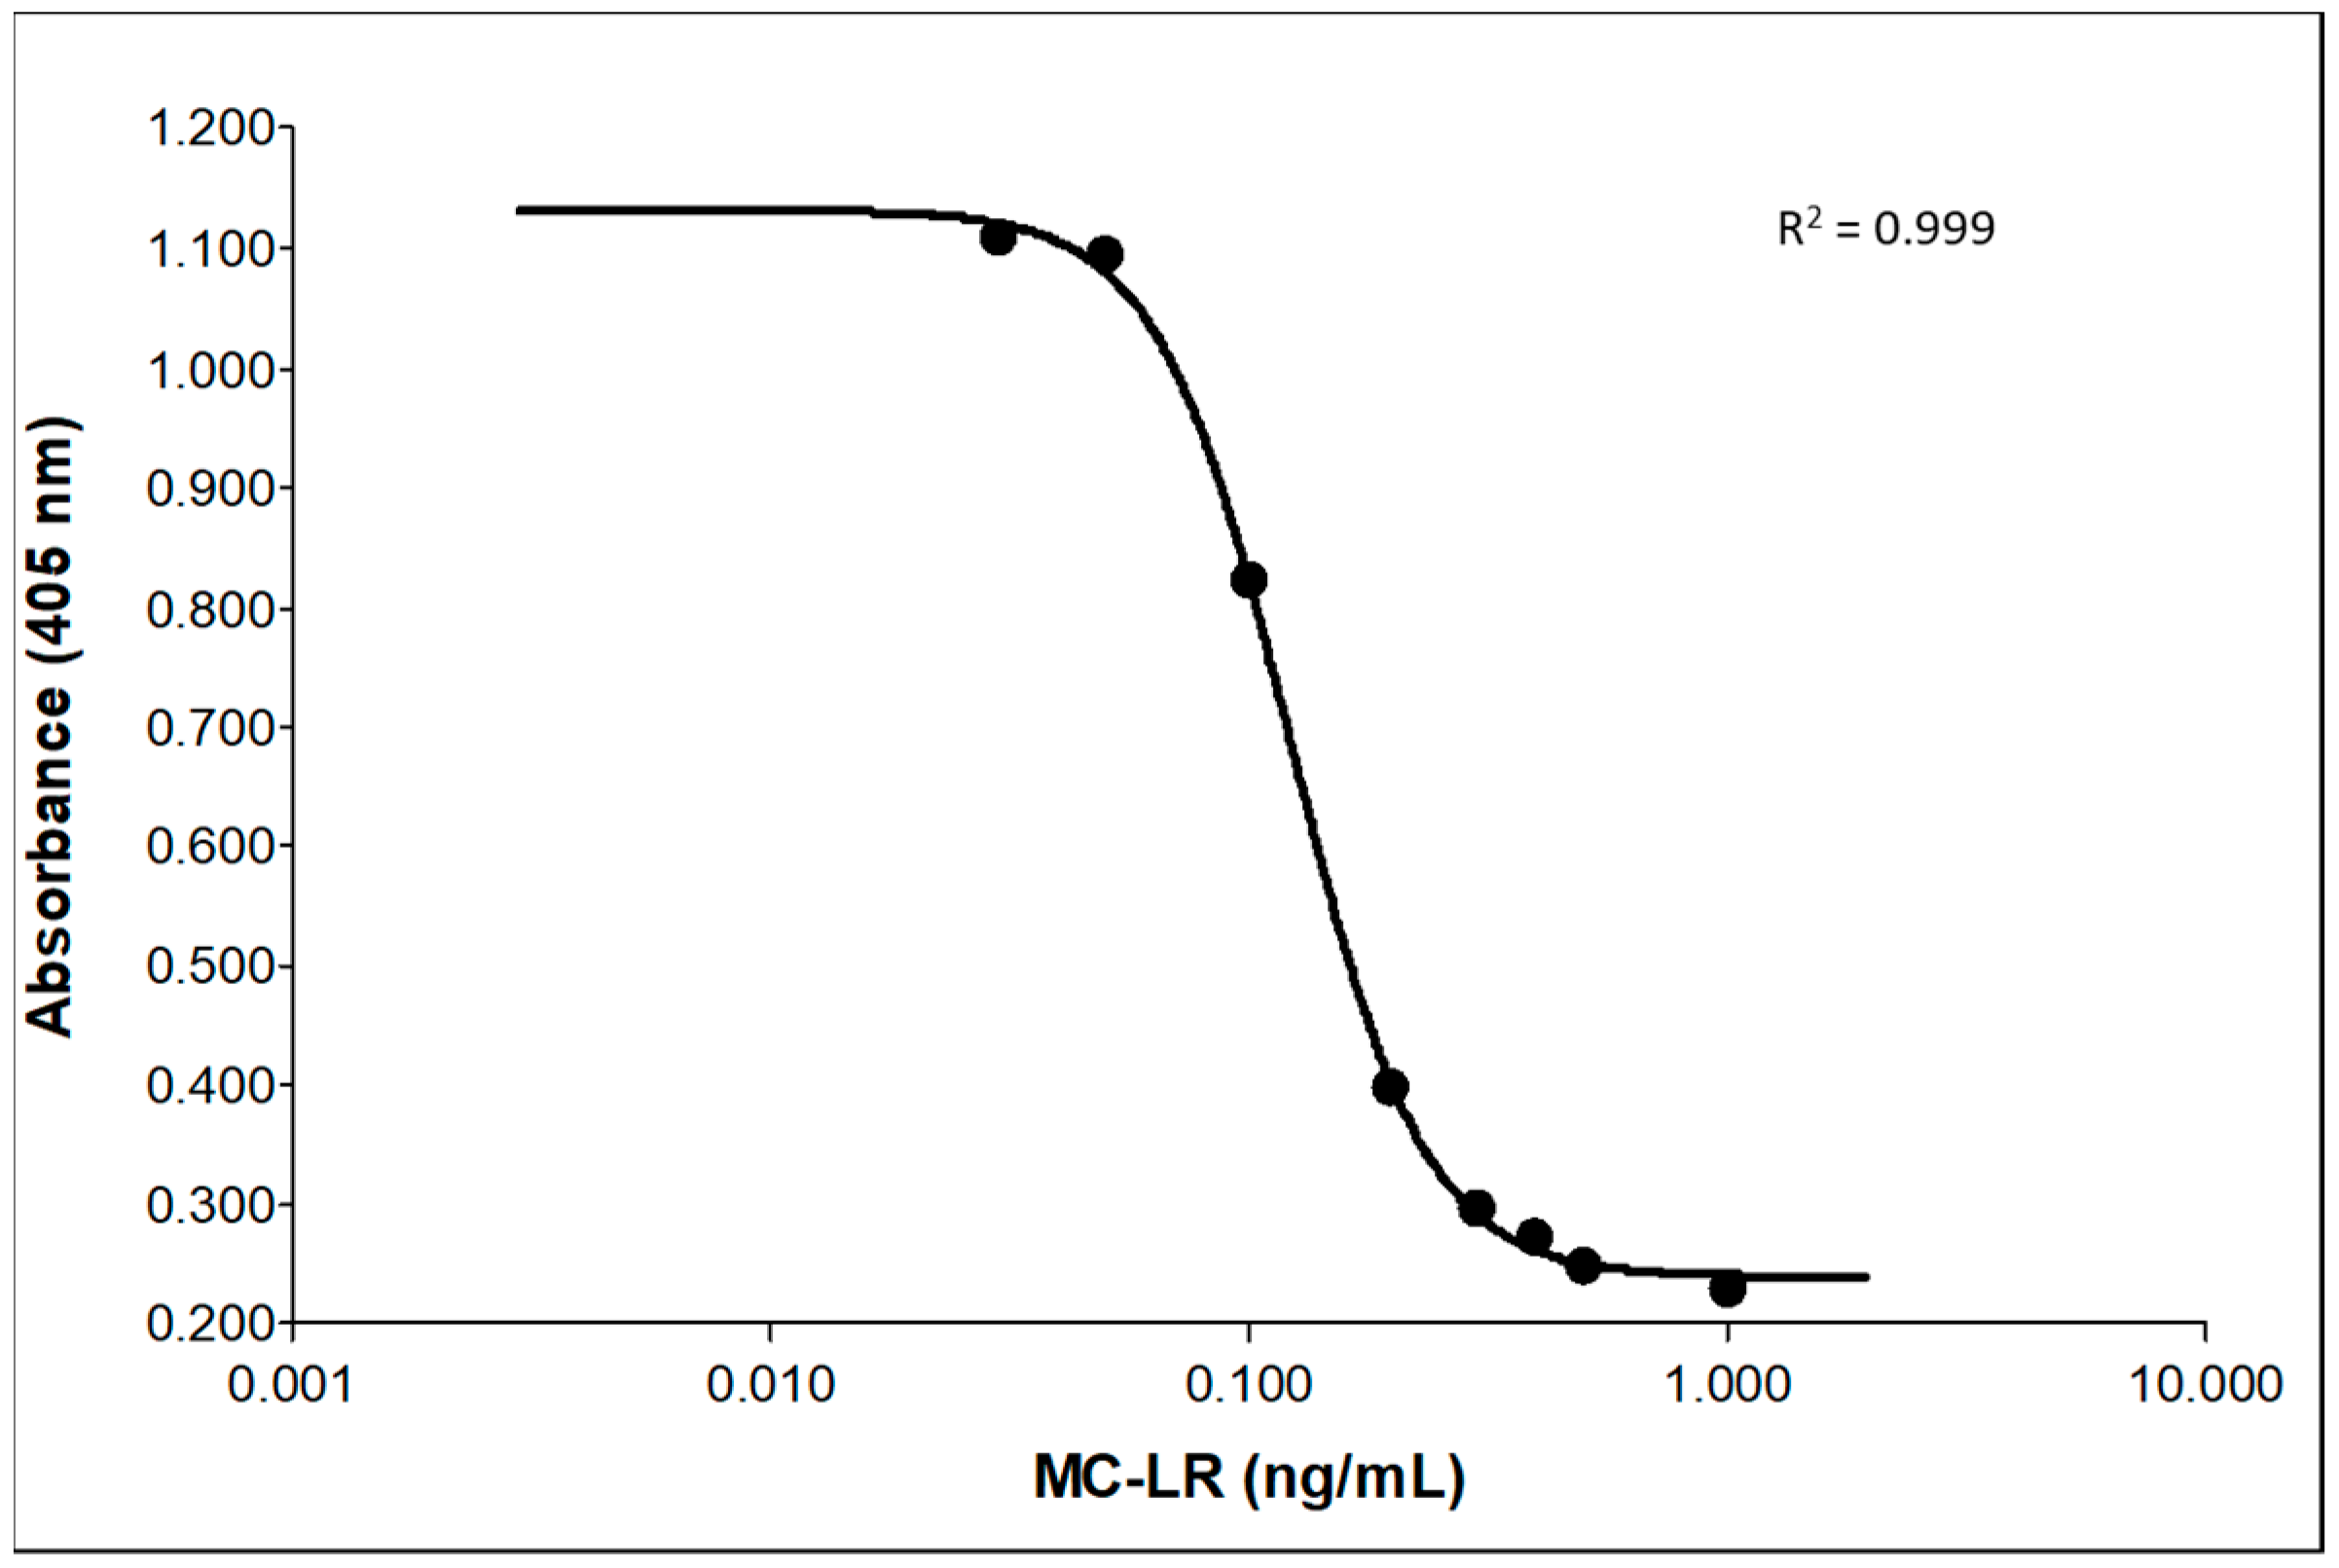
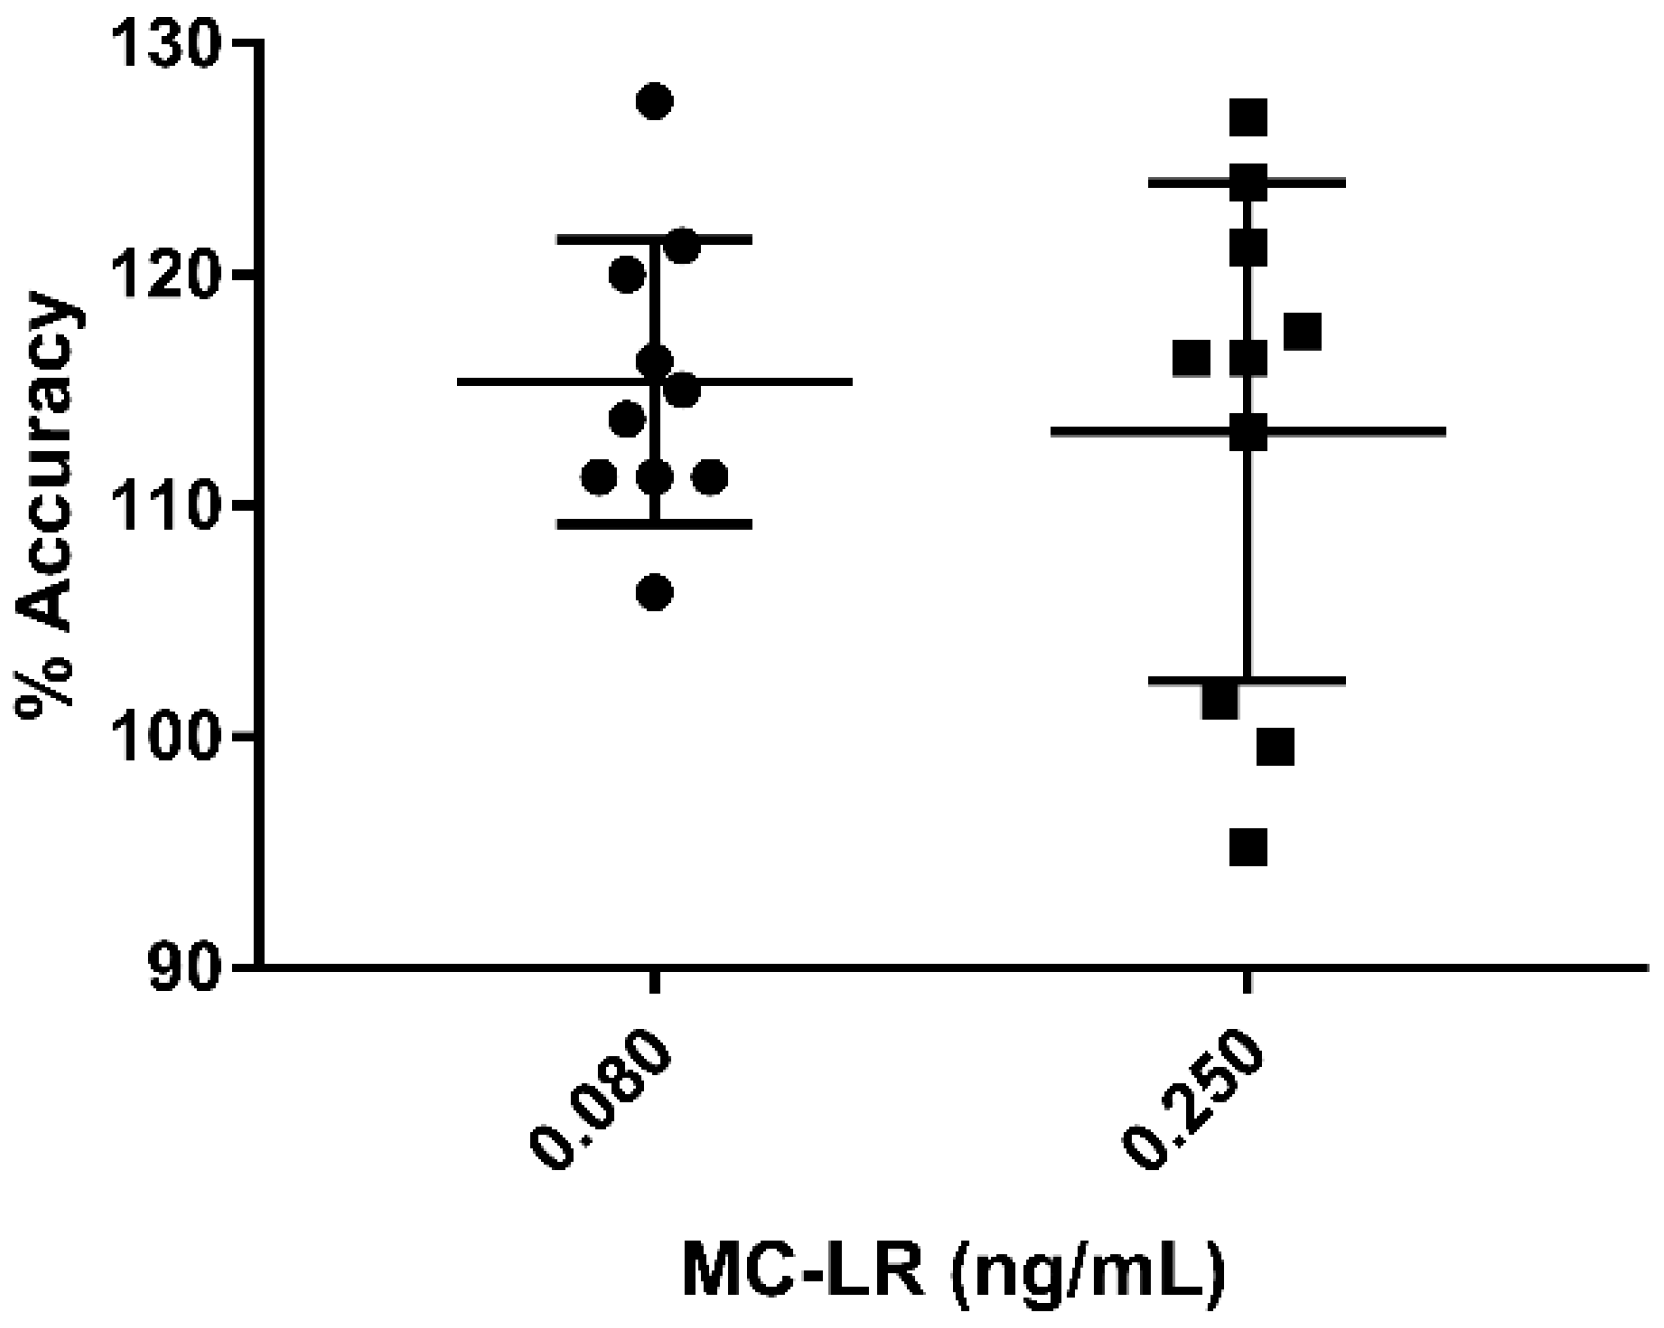
2.4. Validation of MC-LR
2.5. Analysis of Urine Samples from Florida Residents
3. Discussion
4. Materials and Methods
4.1. Materials
4.2. Biological Specimens
4.3. Preparation of Anchors, Calibrators, and Quality Control Samples
4.4. Mass Spectrometry Conditions
4.5. Liquid Chromatography Conditions
4.6. MC IC Protocol
4.7. Protein Phosphatase Inhibition Assay
4.8. Data Analysis
Author Contributions
Funding
Acknowledgments
Conflicts of Interest
Disclaimer
References
- Greer, B.; Maul, R.; Campbell, K.; Elliott, C.T. Detection of freshwater cyanotoxins and measurement of masked microcystins in tilapia from Southeast Asian aquaculture farms. Anal. Bioanal. Chem. 2017, 409, 4057–4069. [Google Scholar] [CrossRef] [PubMed] [Green Version]
- Spoof, L.A.C. Handbook of Cyanobacterial Monitoring and Cyanotoxin Analysis, 1st ed.; Meriluoto, J.S.L., Codd, G.A., Eds.; John Wiley & Sons, Ltd.: Hoboken, NJ, USA, 2017; pp. 526–537. [Google Scholar]
- Codd, G.; Bell, S.; Kaya, K.; Ward, C.; Beattie, K.; Metcalf, J. Cyanobacterial toxins, exposure routes and human health. Eur. J. Phycol. 1999, 34, 405–415. [Google Scholar] [CrossRef]
- Dawson, R.M. The toxicology of microcystins. Toxicon 1998, 36, 953–962. [Google Scholar] [CrossRef]
- Nishiwaki-Matsushima, R.; Ohta, T.; Nishiwaki, S.; Suganuma, M.; Kohyama, K.; Ishikawa, T.; Carmichael, W.W.; Fujiki, H. Liver tumor promotion by the cyanobacterial cyclic peptide toxin microcystin-LR. J. Cancer Res. Clin. Oncol. 1992, 118, 420–424. [Google Scholar] [CrossRef]
- McLellan, N.L.; Manderville, R.A. Toxic mechanisms of microcystins in mammals. Toxicol. Res. 2017, 6, 391–405. [Google Scholar] [CrossRef] [Green Version]
- Chen, L.; Chen, J.; Zhang, X.; Xie, P. A review of reproductive toxicity of microcystins. J. Hazard. Mater. 2016, 301, 381–399. [Google Scholar] [CrossRef]
- Lone, Y.; Bhide, M.; Koiri, R.K. Microcystin-LR Induced Immunotoxicity in Mammals. J. Toxicol. 2016, 2016, 8048125. [Google Scholar] [CrossRef] [Green Version]
- WHO. Guidelines for Drinking-Water Quality, 2nd ed.; Health Criteria and Other Supporting Information—Addendum; WHO: Geneva, Switzerland, 1998; Volume 2. [Google Scholar]
- Kondo, F.; Ikai, Y.; Oka, H.; Matsumoto, H.; Yamada, S.; Ishikawa, N.; Tsuji, K.; Harada, K.; Shimada, T.; Oshikata, M.; et al. Reliable and sensitive method for determination of microcystins in complicated matrices by frit-fast atom bombardment liquid chromatography/mass spectrometry. Nat. Toxins 1995, 3, 41–49. [Google Scholar] [CrossRef]
- Luukkainen, R.; Namikoshi, M.; Sivonen, K.; Rinehart, K.L.; Niemela, S.I. Isolation and identification of 12 microcystins from four strains and two bloom samples of Microcystis spp.: Structure of a new hepatotoxin. Toxicon 1994, 32, 133–139. [Google Scholar] [CrossRef]
- Barco, M.; Rivera, J.; Caixach, J. Analysis of cyanobacterial hepatotoxins in water samples by microbore reversed-phase liquid chromatography-electrospray ionisation mass spectrometry. J. Chromatogr. A 2002, 959, 103–111. [Google Scholar] [CrossRef]
- Spoof, L.; Vesterkvist, P.; Lindholm, T.; Meriluoto, J. Screening for cyanobacterial hepatotoxins, microcystins and nodularin in environmental water samples by reversed-phase liquid chromatography-electrospray ionisation mass spectrometry. J. Chromatogr. A 2003, 1020, 105–119. [Google Scholar] [CrossRef]
- Zweigenbaum, J.A.; Henion, J.D.; Beattie, K.A.; Codd, G.A.; Poon, G.K. Direct analysis of microcystins by microbore liquid chromatography electrospray ionization ion-trap tandem mass spectrometry. J. Pharm. Biomed. Anal. 2000, 23, 723–733. [Google Scholar] [CrossRef]
- Welker, M.; Fastner, J.; Erhard, M.; von Dohren, H. Applications of MALDI-TOF MS analysis in cyanotoxin research. Environ. Toxicol. 2002, 17, 367–374. [Google Scholar] [CrossRef] [PubMed]
- Nagata, S.; Tsutsumi, T.; Yoshida, F.; Ueno, Y. A new type sandwich immunoassay for microcystin: production of monoclonal antibodies specific to the immune complex formed by microcystin and an anti-microcystin monoclonal antibody. Nat. Toxins 1999, 7, 49–55. [Google Scholar] [CrossRef]
- Zeck, A.; Weller, M.G.; Bursill, D.; Niessner, R. Generic microcystin immunoassay based on monoclonal antibodies against Adda. Analyst 2001, 126, 2002–2007. [Google Scholar] [CrossRef]
- Metcalf, J.S.; Bell, S.G.; Codd, G.A. Production of novel polyclonal antibodies against the cyanobacterial toxin microcystin-LR and their application for the detection and quantification of microcystins and nodularin. Water Res. 2000, 34, 2761–2769. [Google Scholar] [CrossRef]
- Meriluoto, J. Chromatography of microcystins. Anal. Chim. Acta 1997, 352, 277–298. [Google Scholar] [CrossRef]
- Meriluoto, J.; Kincaid, B.; Smyth, M.R.; Wasberg, M. Electrochemical detection of microcystins, cyanobacterial peptide hepatotoxins, following high-performance liquid chromatography. J. Chromatogr. A 1998, 810, 226–230. [Google Scholar] [CrossRef]
- MacKintosh, C.; Beattie, K.A.; Klumpp, S.; Cohen, P.; Codd, G.A. Cyanobacterial microcystin-LR is a potent and specific inhibitor of protein phosphatases 1 and 2A from both mammals and higher plants. FEBS Lett. 1990, 264, 187–192. [Google Scholar] [CrossRef] [Green Version]
- Xu, L.H.; Lam, P.K.; Chen, J.P.; Xu, J.M.; Wong, B.S.; Zhang, Y.Y.; Wu, R.S.; Harada, K.I. Use of protein phosphatase inhibition assay to detect microcystins in Donghu Lake and a fish pond in China. Chemosphere 2000, 41, 53–58. [Google Scholar] [CrossRef]
- Heresztyn, T.; Nicholson, B.C. Determination of cyanobacterial hepatotoxins directly in water using a protein phosphatase inhibition assay. Water Res. 2001, 35, 3049–3056. [Google Scholar] [CrossRef]
- Rivasseau, C.; Racaud, P.; Deguin, A.; Hennion, M.C. Development of a bioanalytical phosphatase inhibition test for the monitoring of microcystins in environmental water samples. Anal. Chim. Acta 1999, 394, 243–257. [Google Scholar] [CrossRef]
- McElhiney, J.; Lawton, L.A. Detection of the cyanobacterial hepatotoxins microcystins. Toxicol. Appl. Pharmacol. 2005, 203, 219–230. [Google Scholar] [CrossRef] [PubMed]
- Wharton, R.E.; Feyereisen, M.C.; Gonzalez, A.L.; Abbott, N.L.; Hamelin, E.I.; Johnson, R.C. Quantification of saxitoxin in human blood by ELISA. Toxicon 2017, 133, 110–115. [Google Scholar] [CrossRef]
- Xie, X.; Wu, M.Y.; Shou, L.M.; Chen, L.P.; Gong, F.R.; Chen, K.; Li, D.M.; Duan, W.M.; Xie, Y.F.; Mao, Y.X.; et al. Tamoxifen enhances the anticancer effect of cantharidin and norcantharidin in pancreatic cancer cell lines through inhibition of the protein kinase C signaling pathway. Oncol. Lett. 2015, 9, 837–844. [Google Scholar] [CrossRef]
- Fagerholm, A.E.; Habrant, D.; Koskinen, A.M.P. Calyculins and related marine natural products as serine-threonine protein phosphatase PP1 and PP2A inhibitors and total syntheses of calyculin A, B, and C. Mar. Drugs 2010, 8, 122–172. [Google Scholar] [CrossRef] [Green Version]
- Maynes, J.T.; Bateman, K.S.; Cherney, M.M.; Das, A.K.; Luu, H.A.; Holmes, C.F.; James, M.N. Crystal structure of the tumor-promoter okadaic acid bound to protein phosphatase-1. J. Biol. Chem. 2001, 276, 44078–44082. [Google Scholar] [CrossRef] [Green Version]
- NCCLS. Protocols for Determination of Limits of Detection and Limits of Quantitation; Approved Guideline. NCCLS document EP17-A [ISBN 1-56238-551-8]; NCCLS: Wayne, PA, USA, 2004.
- U.S. Department of Health and Human Services; FADA; Center for Drug Evaluation and Research (CDER); Center for Veterinary Medicine (CVM). FDA Guidance for Industry: Bioanalytical Method Validation; FDA: Rockville, MD, USA, 2013.
- Florida Department of Environmental Protection. Algal Bloom Sampling Results (January 2018–December 2018). Available online: https://floridadep.gov/dear/algal-bloom/content/algal-bloom-sampling-results (accessed on 12 December 2019).
- Robinson, N.A.; Pace, J.G.; Matson, C.F.; Miura, G.A.; Lawrence, W.B. Tissue distribution, excretion and hepatic biotransformation of microcystin-LR in mice. J. Pharmacol. Exp. Ther. 1991, 256, 176–182. [Google Scholar]
- Kondo, F.; Matsumoto, H.; Yamada, S.; Ishikawa, N.; Ito, E.; Nagata, S.; Ueno, Y.; Suzuki, M.; Harada, K. Detection and identification of metabolites of microcystins formed in vivo in mouse and rat livers. Chem. Res. Toxicol. 1996, 9, 1355–1359. [Google Scholar] [CrossRef]
- Ito, E.; Takai, A.; Kondo, F.; Masui, H.; Imanishi, S.; Harada, K.-I. Comparison of protein phosphatase inhibitory activity and apparent toxicity of microcystins and related compounds. Toxicon 2002, 40, 1017–1025. [Google Scholar] [CrossRef]
- Wharton, R.E.; Ojeda-Torres, G.; Cunningham, B.; Feyereisen, M.C.; Hill, K.L.; Abbott, N.L.; Seymour, C.; Hill, D.; Lang, J.; Hamelin, E.I.; et al. Quantification of Microcystin-LR in Human Urine by Immunocapture Liquid Chromatography Tandem Mass Spectrometry. Chem. Res. Toxicol. 2018, 31, 898–903. [Google Scholar] [CrossRef] [PubMed]
- Benke, P.I.; Vinay Kumar, M.C.S.; Pan, D.; Swarup, S. A mass spectrometry-based unique fragment approach for the identification of microcystins. Analyst 2015, 140, 1198–1206. [Google Scholar] [CrossRef] [PubMed]
- Namikoshi, M.; Rinehart, K.L.; Sakai, R.; Stotts, R.R.; Dahlem, A.M.; Beasley, V.R.; Carmichael, W.W.; Evans, W.R. Identification of 12 hepatotoxins from a Homer Lake bloom of the cyanobacteria Microcystis aeruginosa, Microcystis viridis, and Microcystis wesenbergii: Nine new microcystins. J. Org. Chem. 1992, 57, 866–872. [Google Scholar] [CrossRef]
- Foss, A.J.; Aubel, M.T. Using the MMPB technique to confirm microcystin concentrations in water measured by ELISA and HPLC (UV, MS, MS/MS). Toxicon 2015, 104, 91–101. [Google Scholar] [CrossRef] [PubMed]
- Heussner, A.; Altaner, S.; Kamp, L.; Rubio, F.; Dietrich, D. Pitfalls in microcystin extraction and recovery from human blood serum. Chem. Biol. Interact. 2014, 223, 87–94. [Google Scholar] [CrossRef] [Green Version]


| Sample (ng/mL) | Average (ng/mL) | % Accuracy | RSD | |
|---|---|---|---|---|
| Interday | 0.500 | 0.471 | 94.2 | 9.80 |
| 0.400 | 0.376 | 94.0 | 10.1 | |
| 0.250 (QH) | 0.295 | 118 | 7.82 | |
| 0.200 | 0.203 | 102 | 3.91 | |
| 0.100 | 0.100 | 100 | 2.16 | |
| 0.080 (QL) | 0.086 | 108 | 8.66 | |
| 0.050 | 0.053 | 106 | 15.0 | |
| Intraday | 0.250 (QH) | 0.283 | 113 | 12.7 |
| 0.080 (QL) | 0.080 | 100 | 10.5 |
© 2019 by the authors. Licensee MDPI, Basel, Switzerland. This article is an open access article distributed under the terms and conditions of the Creative Commons Attribution (CC BY) license (http://creativecommons.org/licenses/by/4.0/).
Share and Cite
Wharton, R.E.; Cunningham, B.R.; Schaefer, A.M.; Guldberg, S.M.; Hamelin, E.I.; Johnson, R.C. Measurement of Microcystin and Nodularin Activity in Human Urine by Immunocapture-Protein Phosphatase 2A Assay. Toxins 2019, 11, 729. https://0-doi-org.brum.beds.ac.uk/10.3390/toxins11120729
Wharton RE, Cunningham BR, Schaefer AM, Guldberg SM, Hamelin EI, Johnson RC. Measurement of Microcystin and Nodularin Activity in Human Urine by Immunocapture-Protein Phosphatase 2A Assay. Toxins. 2019; 11(12):729. https://0-doi-org.brum.beds.ac.uk/10.3390/toxins11120729
Chicago/Turabian StyleWharton, Rebekah E., Brady R. Cunningham, Adam M. Schaefer, Sophia M. Guldberg, Elizabeth I. Hamelin, and Rudolph C. Johnson. 2019. "Measurement of Microcystin and Nodularin Activity in Human Urine by Immunocapture-Protein Phosphatase 2A Assay" Toxins 11, no. 12: 729. https://0-doi-org.brum.beds.ac.uk/10.3390/toxins11120729