Aptamer-Based Fluorometric Ochratoxin A Assay Based on Photoinduced Electron Transfer

School of Life Sciences, Central South University, Changsha 410013, China
*
Author to whom correspondence should be addressed.
†
These authors contributed equally to this work.
Toxins 2019, 11(2), 65; https://0-doi-org.brum.beds.ac.uk/10.3390/toxins11020065
Submission received: 20 January 2019
/
Accepted: 22 January 2019
/
Published: 24 January 2019
(This article belongs to the Special Issue Advanced Methods for Mycotoxins Detection)
Abstract
:This study describes a novel quencher-free fluorescent method for ochratoxin A (OTA) detection based on the photoinduced electron transfer (PIET) between guanine and fluorophore. In the absence of OTA, carboxyfluorescein (FAM)-labeled aptamer can partly hybridize with the complementary strand of OTA aptamer (OTA-cAPT), which contains four guanines at its 3′-end. As a result, the fluorescence of FAM is quenched due to PIET and stacked guanines. In the presence of OTA, FAM-labeled OTA aptamer can bind specifically to OTA, and thereby the high fluorescence intensity of the dye can be maintained. Under the optimal conditions, the method had a detection limit of 1.3 nM. In addition, the method we proposed is highly sensitive and specific for OTA. Furthermore, the method was proven to be reliable based on its successful application in the detection of OTA in red wine samples. Therefore, this promising, facile, and quencher-free method may be applied to detect other toxins by using other appropriate aptamers.
Key Contribution: A quencher-free fluorescence strategy for sensitive detection of ochratoxin A based on photoinduced electron transfer is reported.

1. Introduction
Discovered in 1965, Ochratoxin A (OTA), a secondary metabolite in fungi, is one of the most common mycotoxins primarily produced by Aspergillus ochraceus, Aspergillus carbonarius, and Penicillium verrucosum (FAO/WHO, 2001) [1]. Food commodities, such as grains, beans, nuts, dried fruits, spices, wine, coffee, and meat products, are vulnerable to OTA contamination [2,3]. OTA can restrain protein synthesis, affect saccharide and calcium metabolisms, increase the rate of lipid of peroxidation, and disrupt the mitochondrial functions [4,5]. In order to prevent the potential risk resulting from OTA consumption, it is highly important to quantitatively analyze the level of OTA in contaminated raw materials. The determination of OTA has been carried out by a number of analytical methods, including thin layer chromatography (TLC), high-performance liquid chromatography (HPLC), mass spectrometry (MS), gas chromatography (GC), surface plasmon resonance (SPR), and so on [6,7,8,9,10]. Although these conventional methods have a number of advantages, such as high accuracy and selectivity, and low detection limits, they have many shortcomings, not only because they are time-consuming, but they also require high-priced instrumentation, sophisticated sample pretreatment, and trained personnel. In recent years, several economical and rapid immunoassays, including enzyme-linked immunosorbent assay (ELISA), have been employed to detect OTA [11,12,13]. Nevertheless, these methods are time-consuming and laborious. Hence, it can be beneficial to develop an alternative OTA detection method that is high-efficiency, simple, and low-cost.
Aptamers are single-stranded oligonucleotides or peptides that can be screened by an in vitro selection process called systematic evolution of ligands by exponential enrichment (SELEX). In this process, the aptamers bind with various target molecules, such as proteins, amino acids, tissues, small molecules, etc., with high affinity and specificity [14,15,16,17]. In comparison with antibodies, aptamers possess properties that can be easily chemically modified and higher stability, in addition to its lower cost and simpler synthesis process. The applications of aptamers can also be extended to analyze drugs and other biological molecules such as ATP, MicroRNA, glutathione, etc. [18,19,20,21]. Based on these advantages, a large number of aptamer-based methods have been applied to OTA detection [22,23,24]. For example, Jiang and Badie Bostan’s group team systematically introduced various strategies for OTA detection using aptasensors [25,26]. Lv’s group have developed a nuclease-aided target recycling signal amplification strategy for ochratoxin A monitoring [27]. Ma’s group used fluorometric aptamer-based determination of ochratoxin A based on the use of graphene oxide and RNase H-aided amplification [28].
Recently, methods for DNA and RNA analysis and metal ions detection based on the photoinduced electron transfer (PIET) between fluorophores and guanine bases has emerged [29,30]. As a result of PIET, the fluorescence of fluorophores can be quenched by the neighboring guanine molecules [31]. In this work, based on the high affinity between OTA and OTA aptamer, as well as the quenching ability of guanines, a simple and cost-effective quencher-free fluorescence method based on PIET was developed. The developed method was also successfully applied to detect OTA in red wine samples, and thus may have a promising application in the food safety fields.
2. Results and Discussion
2.1. Principle of OTA Detection
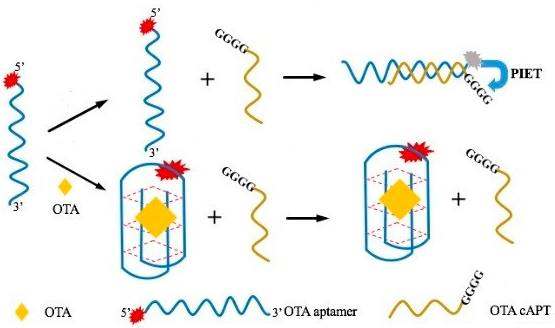
The principle of the proposed fluorescence assay in the detection of OTA is depicted in Scheme 1. The OTA aptamer sequence we used was firstly screened out by the team of Cruzaguado in 2008 [32]. OTA aptamer exhibits strong fluorescence intensity due to the fluorescein-based dye, FAM, attached to its 5′-end. OTA-cAPT partly hybridizes with its complementary OTA aptamer containing four guanines at its 3′-end, which are the fluorescence quenchers. In the absence of OTA, FAM-labeled OTA aptamer can hybridize with OTA-cAPT, forming double-stranded DNA. When FAM is in the proximity of the four guanines, the photoinduced electron transfer (PIET) between them is induced, thereby causing the fluorescence to be quenched. On the other hand, when OTA is present in the detection system, it can specifically bind FAM-labeled OTA aptamer with high affinity, folding into antiparallel G-quadruplex structure, which can protect fluorescence of the dye from being quenched by PIET. The change of fluorescence signal is closely linked with the concentration of OTA. By measuring the degree of fluorescence recovery, the amount of OTA can be determined.
2.2. Feasibility of the Proposed Method
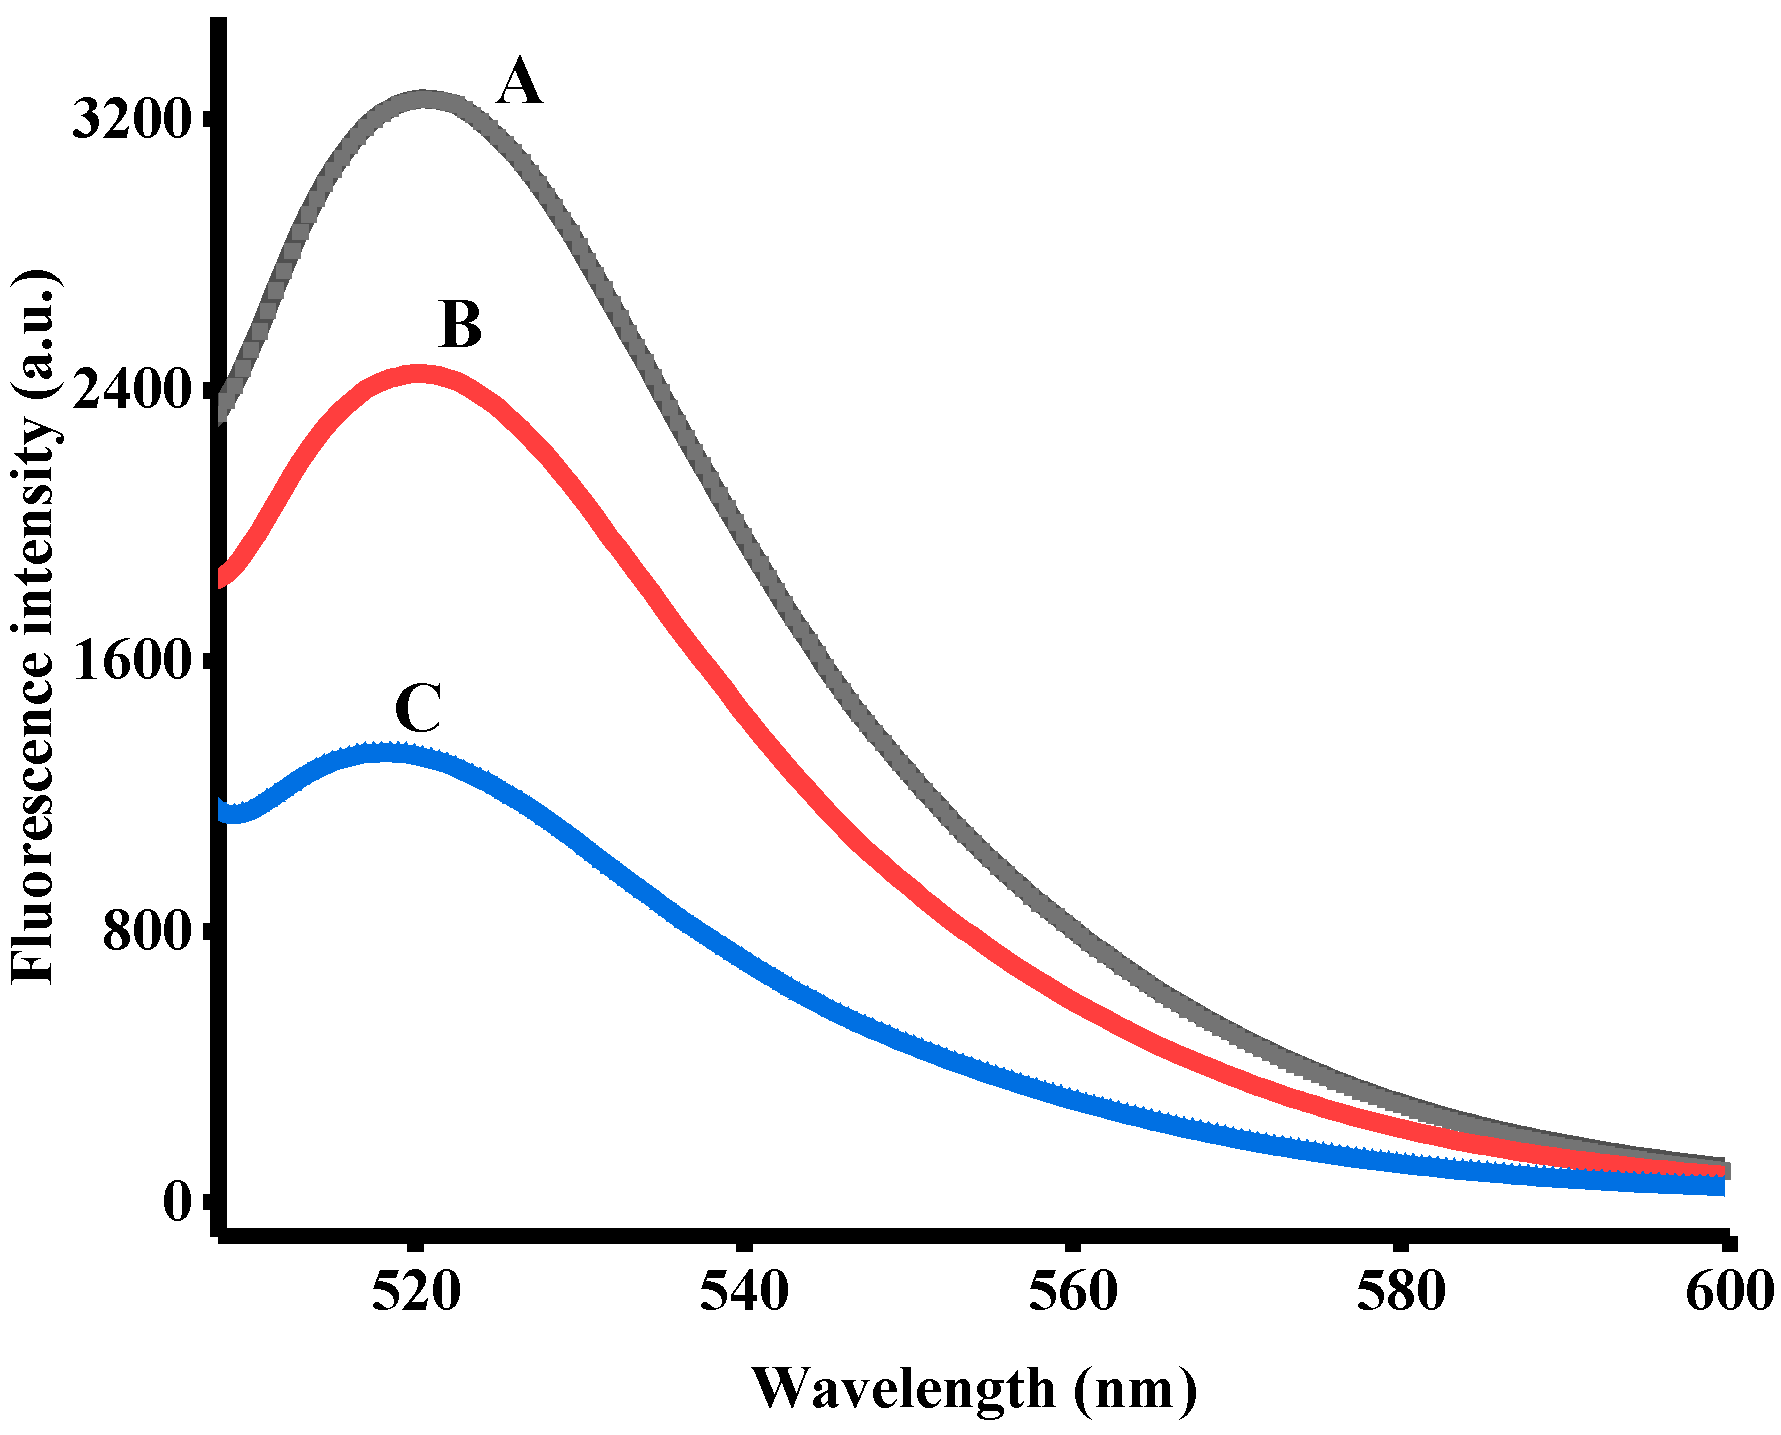
A series of experiments was carried out to evaluate the feasibility of the method. The fluorescence emission spectra of FAM-labeled OTA aptamer under different reaction conditions are shown in Figure 1. FAM-labeled OTA aptamer exhibited remarkable fluorescence intensity (curve A); However, the signal was rapidly decreased upon the addition of OTA-cAPT in the absence of OTA (curve C). It appears that the hybridization between FAM-labeled OTA aptamer and OTA-cAPT results in stacked guanines to be in the proximity of FAM dye, causing its fluorescence to be quenched due to PIET. However, as indicated by curve B (Figure 1), the fluorescence signal was recovered when OTA was present, due to the high affinity between OTA aptamer and OTA. This indicates that the G-quadruplex structure was formed, and could thereby maintain high fluorescence intensity of FAM. These data demonstrate that the proposed method can successfully be applied to detect OTA.
2.3. Optimization of Assay Conditions
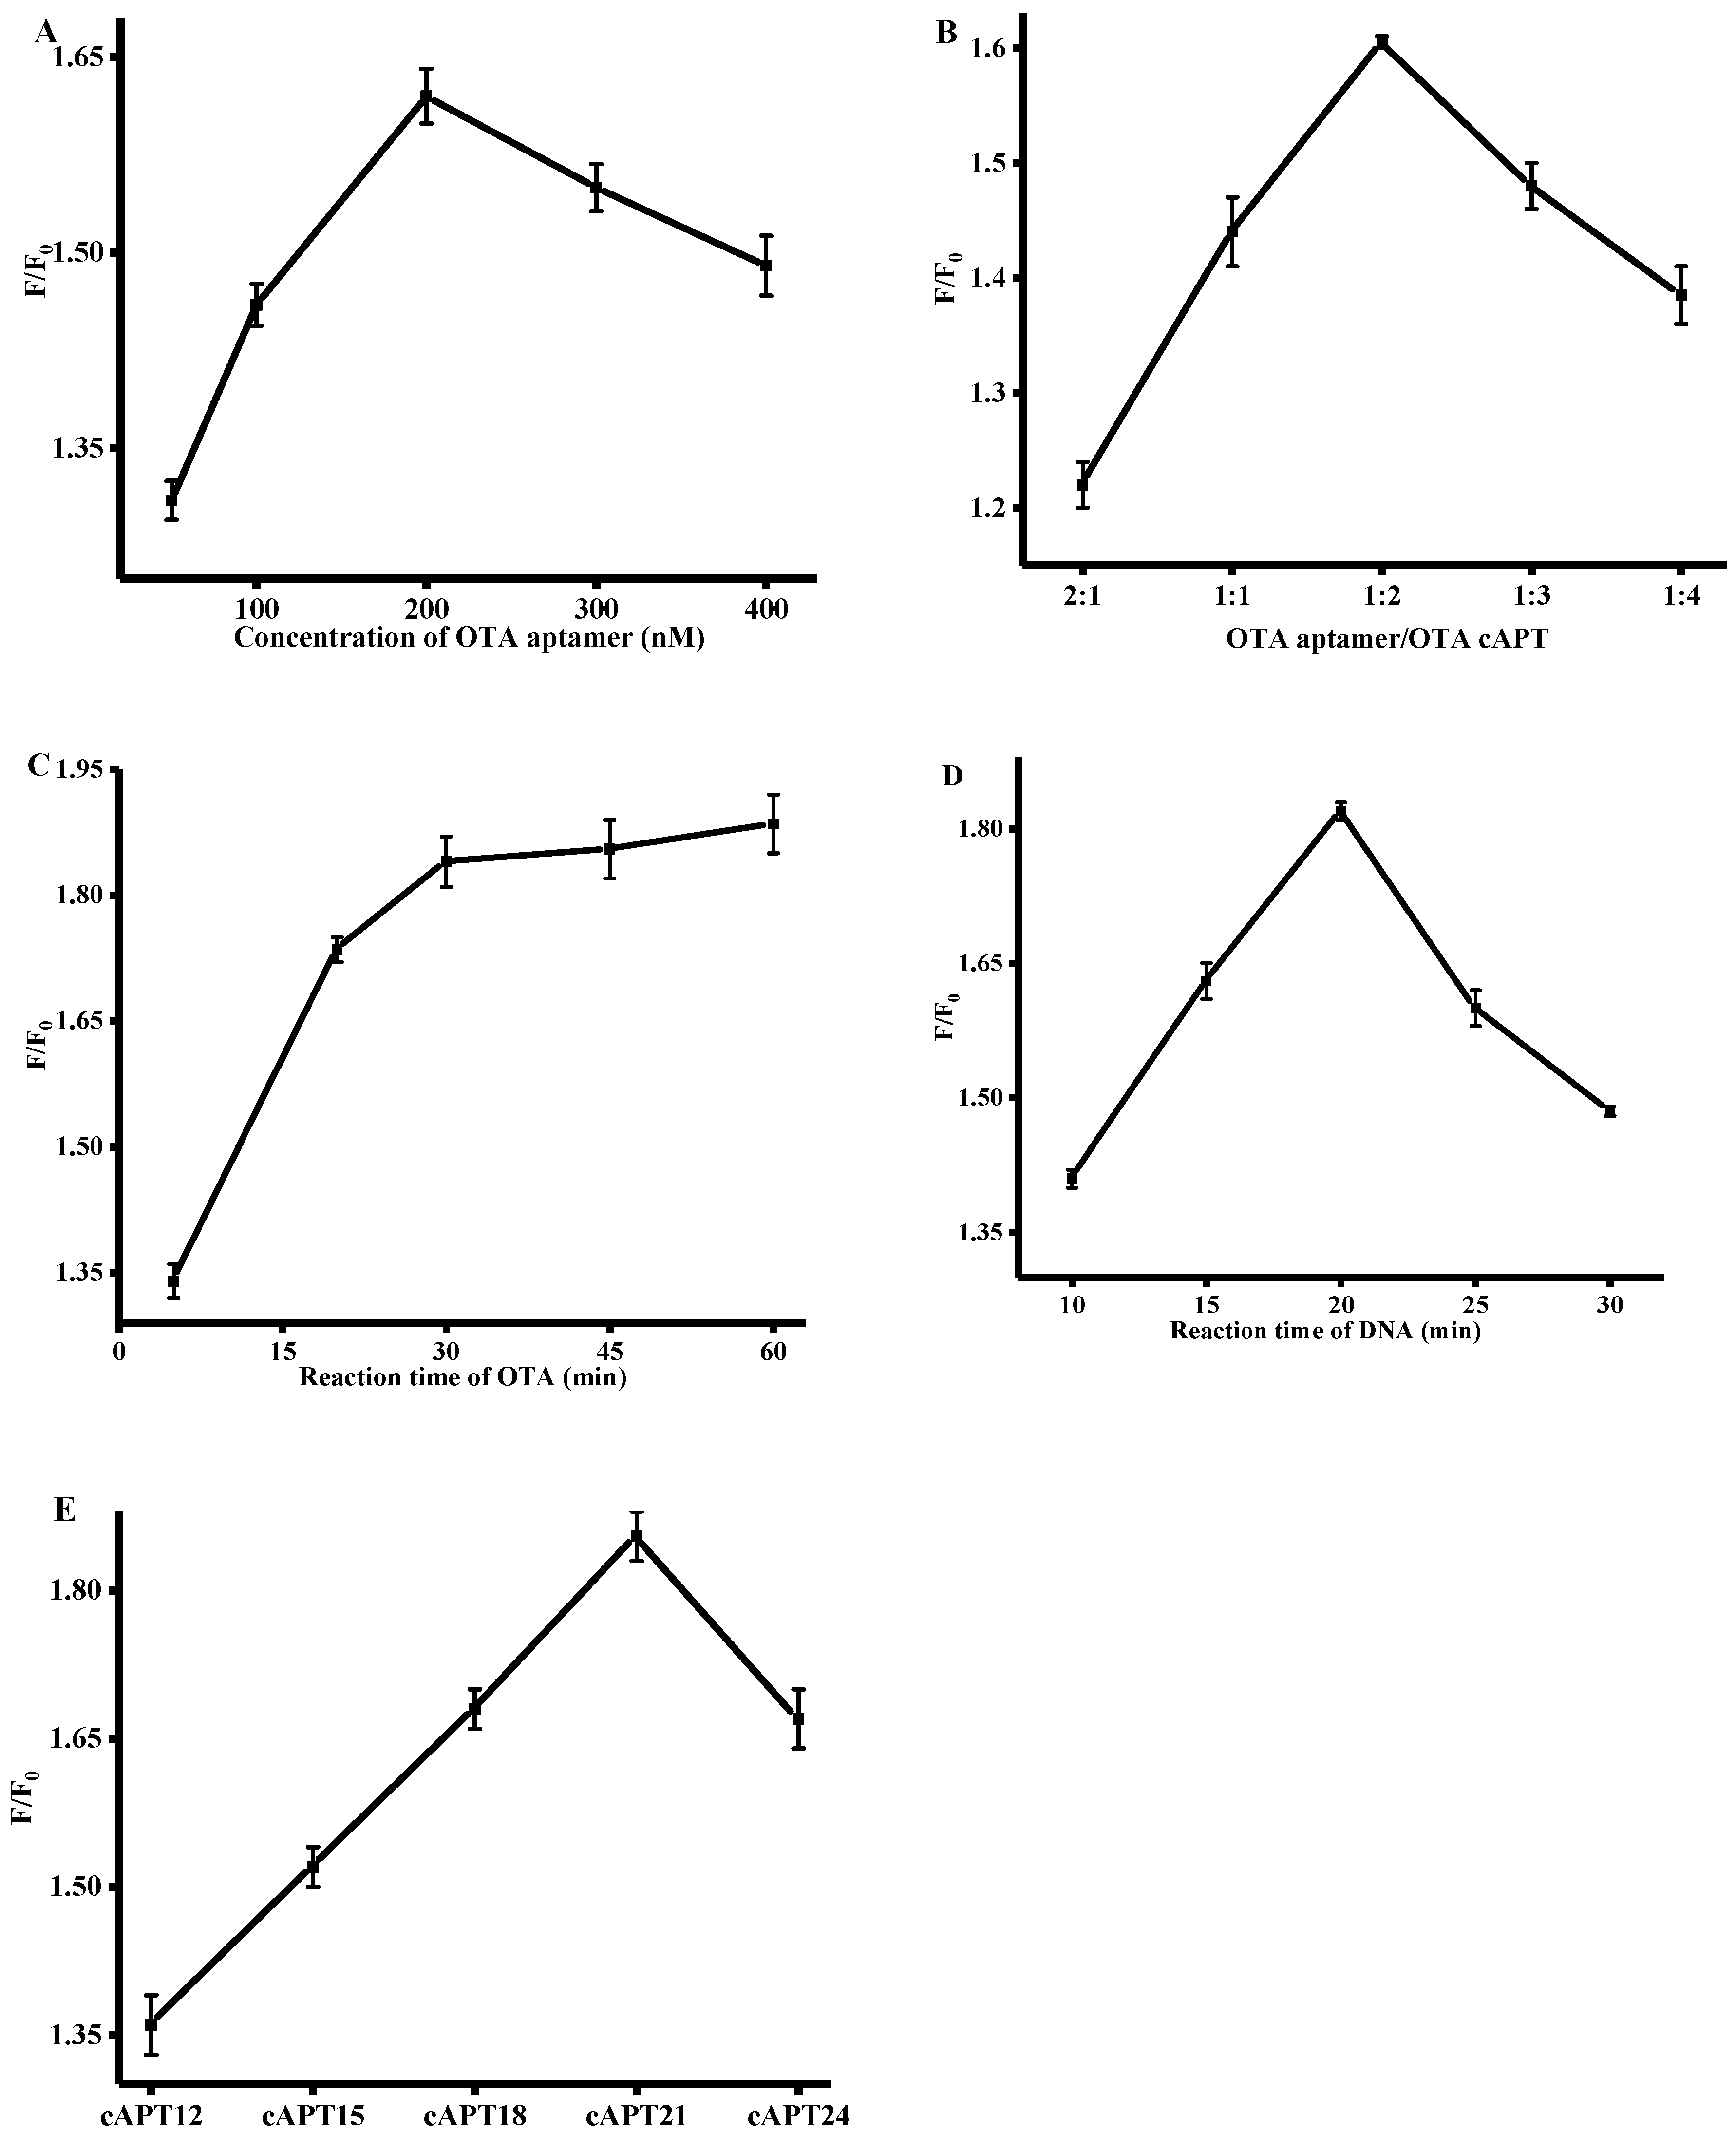
It is critical to investigate parameters that may affect the fluorescence signal during OTA detection. The concentration range of OTA aptamer from 50 nM to 400 nM was first optimized. As shown in Figure 2A, the best concentration of OTA aptamer was 200 nM. The molar ratio of OTA aptamer to OTA-cAPT was then investigated, and as shown in Figure 2B, the optimal molar ratio was 1:2. The optimal concentrations of OTA aptamer and OTA-cAPT were 200 nM and 400 nM. As indicated in Figure 2C, the fluorescent intensity increased with increasing reaction time between OTA and OTA aptamer, reaching a plateau after 30 min, at which the hybridization between aptamers and OTA reaches equilibrium and saturation point. Thus, 30 min was chosen as the OTA incubation time. Furthermore, as can be observed in Figure 2D, 20 min was a suitable incubation time for OTA aptamer and OTA cAPT as well as for OTA detection. Finally, the effect of the length of OTA-cAPT on fluorescence signal was studied, and as indicated in Figure 2E, cAPT21 was selected throughout the experiments.
2.4. Quantitative Detection of OTA
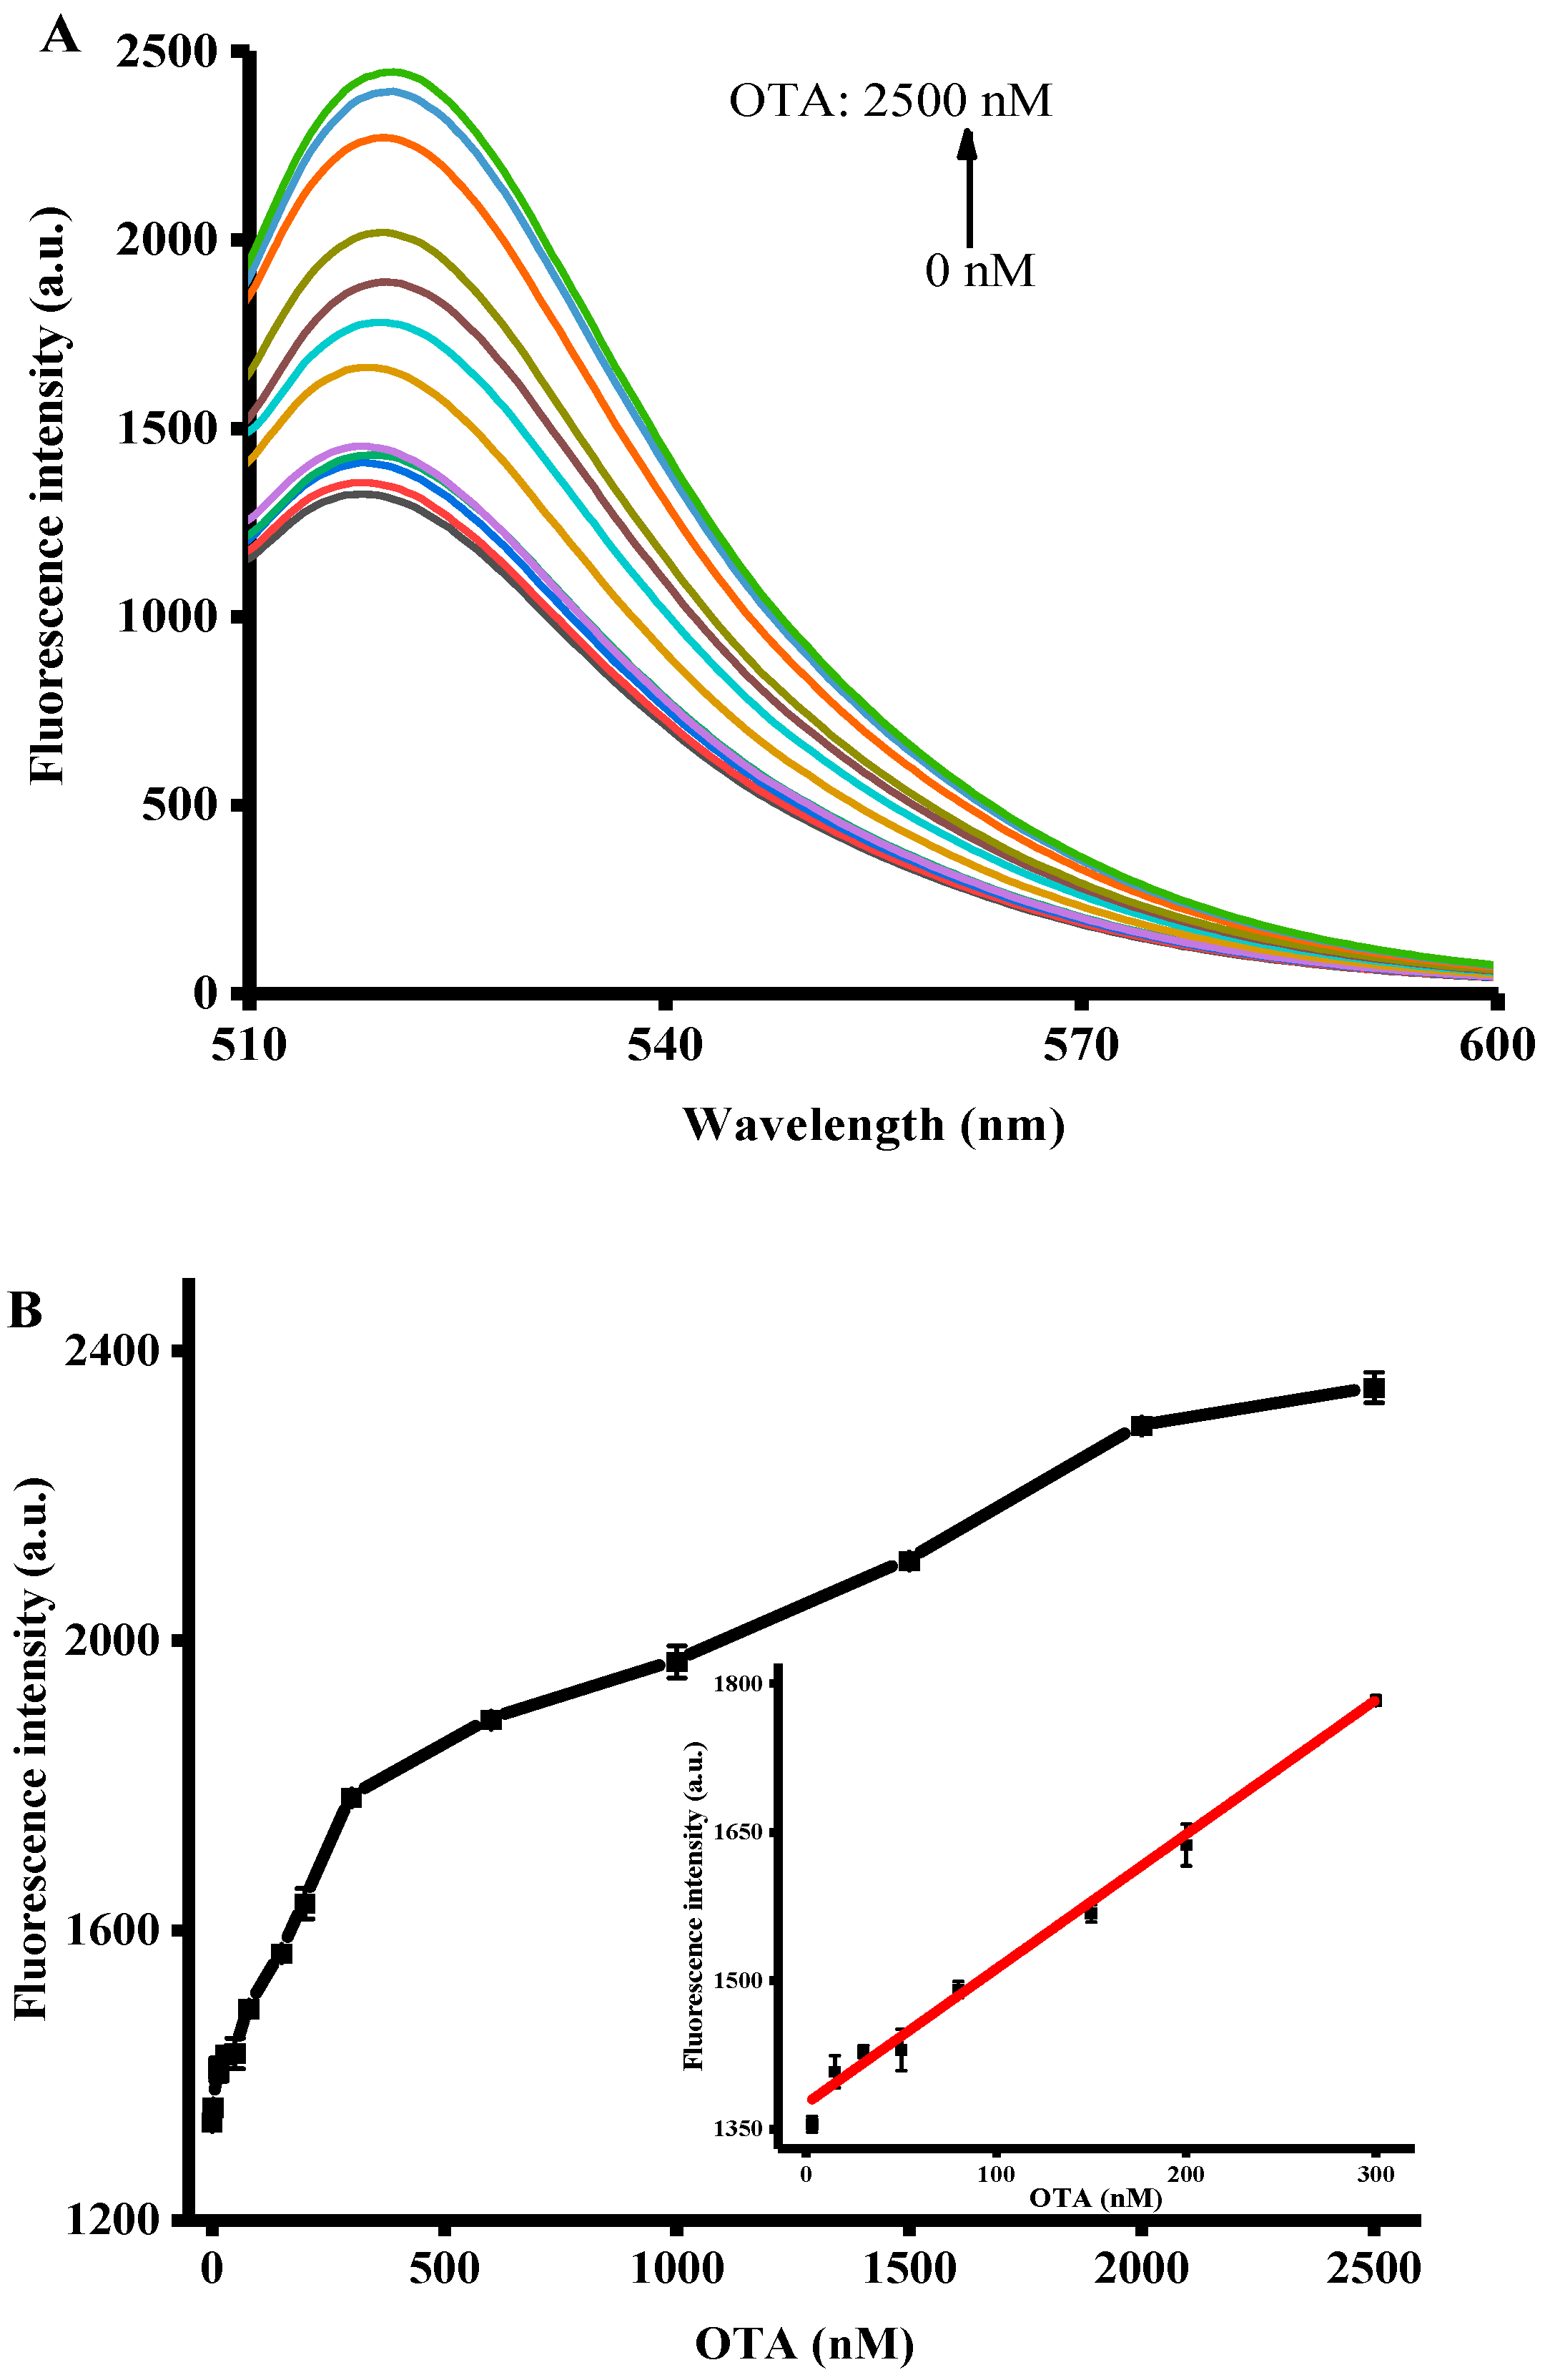
With the optimal conditions selected above, the detection of OTA in samples spiked with different concentrations of OTA was conducted. As shown in Figure 3A, the fluorescence intensity at 520 nm gradually increased with the increase of OTA concentration, from 0 to 2500 nM, and reached a plateau at 2000 nM. Figure 3B depicts the relationship between fluorescence intensity and OTA concentration. The inset of Figure 3B shows the calibration curve for fluorescence intensity versus OTA concentration. The curve has a good linear correlation at the concentration range of 3 to 300 nM. It has a linear regression equation of F = 1.361C + 1374.376 and a correlation coefficient of 0.99501 (where F represents the fluorescence intensity and C is the concentration of OTA). The calculated limit of detection for OTA was 1.3 nM, which is comparable to or better than those of other methods (Table 1). Therefore, we may conclude that the proposed assay can easily and successfully quantify OTA.
2.5. Selectivity of OTA Assay
The fluorescence signals in response to the presences of various molecules, including OTA, OTB, and AFB1, were examined to evaluate the selectivity of the assay. As illustrated in Figure 4, the fluorescence signal ratio of OTA was much stronger than other toxins, due to the specific binding between OTA and OTA aptamer. In addition, a variety of possible metal cations in red wine were also studied. The occurrence of these metal cations does not interfere with fluorescent signals. This result demonstrate that the proposed method has excellent selectivity for OTA. The method was further applied to detect OTA in real samples.
2.6. Detection of OTA in Red Wine Samples
The practical application of the method was assessed by spiked recovery experiments using red wine samples. The results are shown in Table 2. The recoveries of OTA from the samples spiked with three different concentrations of OTA were varied from 92.2% to 111.6%. The data indicates that the detection of OTA in real samples with complex matrices by the proposed assay is feasible and reliable.
3. Conclusions
In summary, a novel and quencher-free fluorescence approach based on FAM-labeled OTA aptamer probe was developed for detecting OTA. The detection principle relies on the high sensitivity, specificity, and affinity between OTA and OTA aptamer, as well as the quenching ability of guanine induced by PIET. The proposed method had a linear concentration range from 3 to 300 nM, and a detection limit of 1.3 nM. Furthermore, the method exhibited excellent specificity towards OTA compared with that towards other toxins, and was successfully applied to detect OTA in red wine with the recovery rates of 93.8% to 111.6%. Accordingly, by using other appropriate aptamers, this approach may be applied to detect various other targets in other fields, such as the environmental and food safety fields.
4. Materials and Methods
4.1. Reagents
Ochratoxin A (OTA) and ochratoxin B (OTB) were obtained from Pribolab Co., Ltd. (QingDao, China). Aflatoxin B1 (AFB1) was purchased from Yuanye Co., Ltd. (Shanghai, China). All DNA probes (OTA aptamer and OTA-cAPT) were synthesized by Sangon Biotechnology Co., Ltd. (Shanghai, China). The sequence of DNA probes is shown in Table 3. The DNA sequence was dissolved using TE buffer and stored at −20 °C for further use. Tris[Tris-(hydroxy-methyl) aminomethane], magnesium chloride (MgCl2), hydrochloric acid (HCl), zinc chloride (ZnCl2), cupric sulfate (CuSO4), sodium chloride (NaCl), and calcium chloride (CaCl2) were purchased from Sinopharm Chemical Reagent Co., Ltd. (Shanghai, China). All reagents were of analytical-reagent grade and used without further purification. Ultrapure water (18.2 MΩ·cm) was prepared from a Milli-Q water purification system (Millipore Corp, Bedford, MA, USA) throughout the experiments.
4.2. Apparatus
The measurement of fluorescent intensity was carried out on an F-2700 fluorescence spectrophotometer (Hitachi, Tokyo, Japan). The measurement was conducted at room temperature with an excitation wavelength of 490 nm and wavelengths ranging from 505 to 600 nm. The slit widths for both excitation and emission were set to 10 nm.
4.3. Optimization of Reaction Conditions
To achieve optimum experimental results, several related reaction factors, including the concentration of OTA aptamer, reaction time for OTA aptamer and OTA-cAPT, reaction time for OTA, concentration ratio of OTA aptamer:OTA-cAPT, and length of OTA-cAPT, were optimized. The concentration of OTA aptamer was 200 nM, reaction time for OTA was 10 to 30 min, and that for the DNA probe (OTA aptamer/OTA-cAPT) was 5 to 60 min. The selected concentration ratios of OTA-aptamer:OTA-cAPT were 2:1, 1:1, 1:2, 1:3, and 1:4. The lengths of OTA-cAPT were 12, 15, 18, 21, and 24 nt. The concentration of OTA was 2 μM.
4.4. Detection of OTA by Fluorescence
Under the optimal conditions, different concentrations of OTA were mixed with 10 mM Tris-HCl (pH = 7.5), 120 mM NaCl, 20 mM CaCl2, 40 mM MgCl2, and 200 nM OTA aptamer and then incubated in a 37 °C water bath for 30 min. After that, 400 nM OTA-cAPT was added to a final volume of 100 μL at room temperature, and the reaction time was allowed to take place for additional 20 min. The fluorescence intensity was recorded at the wavelength range of 505 to 600 nm.
4.5. Selectivity Assay
In the experiment to verify the specificity of the probe, OTB and AFB1 were used as controls. Firstly, 300 nM each of OTA, OTB, AFB1, and OTA, containing 100 nM Cu2+, Zn2+, Mg2+, Ca2+ were added into the reaction solution containing 10 mM Tris-HCl (pH = 7.5), 120 mM NaCl, 20 mM CaCl2, 40 mM MgCl2, and 200 nM OTA aptamer and then incubated at 37 °C for 30 min. Subsequently, 400 nM OTA-cAPT was added to a final volume of 100 μL at room temperature. After 20 min of reaction, their fluorescence intensities were measured.
4.6. Assay of Real Samples
To test the feasibility of the method in the detection of OTA in real samples, red wine, which was bought from a local supermarket, was used as a real sample. The red wine samples were first filtrated to remove wine sediment and then diluted by 20 fold prior to subsequent analysis. In the spiked recovery experiment, a given amount of OTA was spiked into the diluted red wine samples, which was then subjected to subsequent sample handling and fluorescent measurement described above.
Author Contributions
H.Z. performed the experiments; M.C. and X.X. conceived and designed the experiments; C.M. analyzed the data; M.C. and Z.H. wrote the paper; M.C. and X.X. contributed reagents/materials.
Funding
This research received no external funding.
Acknowledgments
This work was supported by State Key Laboratory of Chemo/Biosensing and Chemometrics, Hunan University (2017006), The Research Innovation Program for Graduates of Central South University (2018zzts384, 2018zzts399).
Conflicts of Interest
The authors declare no conflict of interest.
References
- Vanderme, K.J.; Steyn, P.S.; Fourie, L.; Scott, D.B.; Theron, J.J. Ochratoxin A, a toxic metabolite produced by Aspergillus ochraceus with. Nature 1965, 205, 1112–1113. [Google Scholar]
- Covarelli, L.; Beccari, G.; Marini, A.; Tosi, L. A review on the occurrence and control of ochratoxigenic fungal species and ochratoxin a in dehydrated grapes, non-fortified dessert wines and dried vine fruit in the mediterranean area. Food Control 2012, 21, 347–356. [Google Scholar] [CrossRef]
- Jodra, A.; Hervas, M.; Lopez, M.A.; Escarpa, A. Disposable electrochemical magneto immunosensor for simultaneous simplified calibration and determination of Ochratoxin a in coffee samples. Sens. Actuators B Chem. 2015, 221, 777–783. [Google Scholar] [CrossRef]
- Chen, J.; Fang, Z.; Liu, J.; Zeng, L. A simple and rapid biosensor for ochratoxin A based on a structure-switching signaling aptamer. Food Control 2012, 25, 555–560. [Google Scholar] [CrossRef]
- Zhang, Z.; Gan, F.; Xue, H.; Liu, Y.; Huang, D.; Khan, A.Z.; Chen, X.; Huang, K. Nephropathy and hepatopathy in weaned piglets provoked by natural ochratoxin A and involved mechanisms. Exp. Toxicol. Pathol. 2015, 68, 205–213. [Google Scholar] [CrossRef] [PubMed]
- Gaag, B.V.D.; Spath, S.; Dietrich, H.; Stigter, E.; Boonzaaijer, G.; Osenbruggen, T.V.; Koopal, K. Biosensors and multiple mycotoxin analysis. Food Control 2003, 14, 251–254. [Google Scholar] [CrossRef]
- Olsson, J.; Börjesson, T.; Lundstedt, T.; chnürer, J. Detection and quantification of ochratoxin A and deoxynivalenol in barley grains by GC-MS and electronic nose. Int. J. Food Microbiol. 2002, 72, 203–214. [Google Scholar] [CrossRef]
- Reinsch, M.; Töpfer, A.; Lehmann, A.; Nehls, I.; Panne, U. Determination of ochratoxin A in beer by LC-MS/MS ion trap detection. Food Chem. 2007, 100, 312–317. [Google Scholar] [CrossRef]
- Santos, E.; Varga, E. Immunoaffinity column clean-up and thin layer chromatography for determination of ochratoxin A in green coffee. Food Addit. Contam. 2002, 19, 447–458. [Google Scholar] [CrossRef]
- Tessini, C.; Mardones, C.; Baer, D.V.; Vega, M.; Herlitz, E.; Saelzer, R.; Silva, J.; Torres, O. Alternatives for sample pre-treatment and HPLC determination of ochratoxin A in red wine using fluorescence detection. Anal. Chim. Acta 2010, 660, 119–126. [Google Scholar] [CrossRef]
- Flajs, D.; Domijan, A.M.; Ivic, D.; Cvjetkovic, B.; Peraica, M. ELISA and HPLC analysis of ochratoxin A in red wines of Croatia. Food Control 2009, 20, 590–592. [Google Scholar] [CrossRef]
- Yu, F.Y.; Chi, T.F.; Liu, B.H.; Su, C.C. Development of a Sensitive Enzyme-Linked Immunosorbent Assay for the Determination of Ochratoxin A. J. Agric. Food Chem. 2005, 53, 6947–6953. [Google Scholar] [CrossRef] [PubMed]
- Zamfir, L.G.; Geana, I.; Bourigua, S.; Rotariu, L.; Bala, C.; Errachid, A.; Jaffrezic-Renault, N. Highly sensitive label-free immunosensor for ochratoxin A based on functionalized magnetic nanoparticles and EIS/SPR detection. Sens. Actuators B Chem. 2011, 59, 178–184. [Google Scholar]
- Klussmann, S. The Aptamer Handbook, Functional Oligonucleotides and Their Applications; Vch. Verlagsgesellschaft Mbh.: Berlin, Germany, 2006; pp. 363–416. [Google Scholar]
- Tombelli, S.; Minunni, M.; Mascini, M. Analytical applications of aptamers. Biosens. Bioelectron. 2005, 20, 2424–2434. [Google Scholar] [CrossRef]
- Wu, K.; Ma, C.; Zhao, H.; He, H.L.; Chen, H.C. Label-Free G-Quadruplex Aptamer Fluorescence Assay for Ochratoxin A Using a Thioflavin T Probe. Toxins 2018, 10, 198. [Google Scholar] [CrossRef] [PubMed]
- Wu, K.; Ma, C.; Deng, Z.; Fang, N.; Tang, Z.; Zhu, X.; Wang, K. Label-free and nicking enzyme-assisted fluorescence signal amplification for RNase H analysis based on a G-quadruplexe/thioflavin T complex. Talanta 2018, 182, 142–147. [Google Scholar] [CrossRef]
- Liu, H.S.; Ma, C.B.; Feng, N.; Chen, H.C.; He, H.L.; Wang, K.M.; Wang, J. A facile label-free G-quadruplex based fluorescent aptasensor method for rapid detection of ATP. Spectrochim. Acta A 2017, 175, 164–167. [Google Scholar] [CrossRef] [PubMed]
- Lu, S.; Wang, S.; Zhao, J.; Sun, J.; Yang, X. Fluorescence Light-Up Biosensor for MicroRNA Based on the Distance-Dependent Photoinduced Electron Transfer. Anal. Chem. 2017, 89, 8429–8436. [Google Scholar] [CrossRef]
- Tan, W.; Donovan, M.J.; Jiang, J. Aptamers from Cell-Based Selection for Bioanalytical Applications. Chem. Rev. 2013, 113, 2842–2862. [Google Scholar] [CrossRef] [Green Version]
- Khusbu, F.Y.; Zhou, X.; Chen, H.C.; Ma, C.B.; Wang, K.M. Thioflavin T as a fluorescence probe for biosensing applications. Trends Anal. Chem. 2018, 109, 1–18. [Google Scholar] [CrossRef]
- Xia, X.; He, Q.; Dong, Y.; Deng, R.; Li, J. Aptamer-based homogeneous analysis for food control. Curr. Anal. Chem. 2018, 14, 1–9. [Google Scholar] [CrossRef]
- Wu, K.; Ma, C.; Zhao, H.; Chen, M.; Deng, Z. Sensitive aptamer-based fluorescene assay for ochratoxin A based on RNase H signal amplification. Food Chem. 2019, 277, 273–278. [Google Scholar] [CrossRef] [PubMed]
- Xia, X.; Wang, H.; Yang, H.; Deng, S.; Deng, R.; Dong, Y.; He, Q. Dual-terminal stemmed aptamer beacon for label-free detection of aflatoxin B1 in broad bean paste and peanut oil via aggregation-induced emission. J. Agric. Food Chem. 2018, 66, 12431–12438. [Google Scholar] [CrossRef] [PubMed]
- Badie Bostan, H.; Danesh, N.M.; Karimi, G.; Ramezani, M.; Mousavi Shaegh, S.A.; Youssefi, K.; Charbgoo, F.; Abnous, K.; Taghdisi, S.M. Ultrasensitive detection of ochratoxin A using aptasensors. Biosens. Bioelectron. 2017, 98, 168–179. [Google Scholar] [CrossRef] [PubMed]
- Jiang, C.; Lan, L.; Yao, Y.; Zhao, F.; Ping, J. Recent progress in application of nanomateiral-enabled biosensors for ochratoxin A detection. Trends Anal Chem. 2018, 102, 236–249. [Google Scholar] [CrossRef]
- Lv, L.; Li, D.H.; Cui, C.B.; Zhao, Y.Y.; Guo, Z.J. Nuclease-aided target recycling signal amplification strategy for ochratoxin a monitoring. Biosens. Bioelectron. 2017, 87, 136–141. [Google Scholar] [CrossRef] [PubMed]
- Ma, C.B.; Wu, K.F.; Zhao, H.; Liu, H.S.; Wang, K.M.; Xia, K. Fluorometric aptamer-based determination of ochratoxin A based on the use of graphene oxide and RNase H-aided amplification. Microchim. Acta 2018, 185, 347. [Google Scholar] [CrossRef] [PubMed]
- Liu, H.S.; Ma, L.B.; Ma, C.B.; Du, J.Y.; Wang, M.L.; Wang, K.M. Quencher-Free Fluorescence Method for the Detection of Mercury(II) Based on Polymerase-Aided Photoinduced Electron Transfer Strategy. Sensors 2016, 16, 1945. [Google Scholar] [CrossRef]
- Wang, W.H.; Jin, Y.; Zhao, Y.; Yue, X.F.; Zhang, C.X. Single-labeled hairpin probe for highly specific and sensitive detection of lead (II) based on the fluorescence quenching of deoxyguanosine and G-quartet. Biosens. Bioelectron. 2013, 41, 137–142. [Google Scholar] [CrossRef]
- Wang, Y.; Yang, L.; Wang, Y.; Liu, W.; Li, B.; Jin, Y. A sensitive and real-time assay of restriction endonuclease activityand inhibition based on photo-induced electron transfer. Sens. Actuators B 2017, 252, 477–482. [Google Scholar]
- Cruzaguado, J.A.; Penner, G. Determination of ochratoxin a with a DNA aptamer. J. Agric. Food Chem. 2008, 56, 10456–10461. [Google Scholar] [CrossRef] [PubMed]
- Yin, X.; Wang, S.; Liu, X.; He, C.; Tang, Y.; Li, Q.; Dong, Y. Aptamer-based colorimetric biosensing of ochratoxin a in fortified white grape wine sample using unmodified gold nanoparticles. Anal. Sci. 2017, 26, 2724–2727. [Google Scholar] [CrossRef] [PubMed]
- Yu, X.H.; Lin, Y.H.; Wang, X.S.; Xu, L.J.; Wang, Z.W.; Fu, F.F. Exonuclease-assisted multicolor aptasensor for visual detection of ochratoxin A based on G-quadruplex-hemin DNAzyme-mediated etching of gold nanorod. Microchim. Acta 2018, 185, 259–267. [Google Scholar] [CrossRef] [PubMed]
- Song, C.X.; Hong, W.W.; Zhang, X.Y.; Lu, Y. Label-free and sensitive detection of ochratoxin a based on dsDNA-templated copper nanoparticles and exonuclease-catalyzed target recycling amplification. Analyst 2018, 143, 1829–1834. [Google Scholar] [CrossRef] [PubMed]
Scheme 1.
Schematic illustration of the fluorescent detection of ochratoxin A based on photoinduced electron transfer.
Scheme 1.
Schematic illustration of the fluorescent detection of ochratoxin A based on photoinduced electron transfer.

Figure 1.
Fluorescence emission spectra for FAM-labeled ochratoxin A (OTA) aptamer (curve A) and reaction products in the presence (curve B) or the absence of OTA (curve C). The concentrations of FAM-labeled OTA aptamer, OTA cAPT and OTA were 200 nM, 400 nM and 2 μM respectively.
Figure 1.
Fluorescence emission spectra for FAM-labeled ochratoxin A (OTA) aptamer (curve A) and reaction products in the presence (curve B) or the absence of OTA (curve C). The concentrations of FAM-labeled OTA aptamer, OTA cAPT and OTA were 200 nM, 400 nM and 2 μM respectively.

Figure 2.
Optimization of ochratoxin A (OTA) detection conditions: (A) Concentration of OTA aptamer; (B) Concentration ratio of OTA aptamer to OTA cAPT; (C) reaction time for OTA; (D) reaction time for DNA probe; and (E) the length of OTA cAPT. F0 and F represent the fluorescence intensities in the absence and presence of OTA, respectively. Error bars were estimated from three replicate measurements.

Figure 3.
(A) Fluorescence spectra for ochratoxin A OTA at different concentrations. (B) Relationship between fluorescence intensity and OTA concentration. Error bars were estimated from three replicate measurements.
Figure 3.
(A) Fluorescence spectra for ochratoxin A OTA at different concentrations. (B) Relationship between fluorescence intensity and OTA concentration. Error bars were estimated from three replicate measurements.

Figure 4.
Selectivity of the proposed assay towards ochratoxin A (OTA), ochratoxin B (OTB), aflatoxin B1, OTA+Cu2+, OTA+Ca2+, OTA+Mg2+, OTA+Ca2+. F0, and F represent the fluorescence intensities in the absence and presence of OTA, respectively. Error bars are standard deviations of three experiments.


Table 1.
Comparison of different methods for OTA detection using aptasensors.
| Method | LOD (nM) | Dynamic Range (nM) | Reference |
|---|---|---|---|
| Colorimetric | 20 | 20–625 | [33] |
| Colorimetric | 10 | 10–200 | [34] |
| Electrochemical | 0.31 | 0.31–6.25 | [13] |
| Fluorescent | 9.8 | 10–100 | [27] |
| Fluorescent | 12.5 | 0–250 | [35] |
| Fluorescent | 2 | 2–200 | [4] |
| Fluorescent | 1.3 | 3–300 | This work |
Table 2.
Recovery experiments of determination of ochratoxin A (OTA) in red wine samples.
| Sample Number | Added (nM) | Detected (nM) | Recovery (%) |
|---|---|---|---|
| 1 | 30 | 31.45 ± 2.35 | 104.8 |
| 2 | 80 | 75.05 ± 5.51 | 93.8 |
| 3 | 150 | 138.26 ± 1.84 | 92.2 |
| 4 | 200 | 223.14 ± 1.47 | 111.6 |
Table 3.
Synthesized oligonucleotides (5′-3′) used in the experiment.
| DNA Probe | Sequences (5′-3′) |
|---|---|
| OTA aptamer | GATCGGGTGTGGGTGGCGTAAAGGGAGCATCGGACA |
| cAPT12 | CCA CAC CCG ATC GGGG |
| cAPT15 | CACCCACACCCGATCGGGG |
| cAPT18 | CGCCACCCACACCCGATCGGGG |
| cAPT21 | TTACGCCACCCACACCCGATCGGGG |
| cAPT24 | CCTTTACGCCACCCACACCCGATCGGGG |
© 2019 by the authors. Licensee MDPI, Basel, Switzerland. This article is an open access article distributed under the terms and conditions of the Creative Commons Attribution (CC BY) license (http://creativecommons.org/licenses/by/4.0/).
Share and Cite
MDPI and ACS Style
Zhao, H.; Xiang, X.; Chen, M.; Ma, C. Aptamer-Based Fluorometric Ochratoxin A Assay Based on Photoinduced Electron Transfer. Toxins 2019, 11, 65. https://0-doi-org.brum.beds.ac.uk/10.3390/toxins11020065
AMA Style
Zhao H, Xiang X, Chen M, Ma C. Aptamer-Based Fluorometric Ochratoxin A Assay Based on Photoinduced Electron Transfer. Toxins. 2019; 11(2):65. https://0-doi-org.brum.beds.ac.uk/10.3390/toxins11020065
Chicago/Turabian StyleZhao, Han, Xinying Xiang, Mingjian Chen, and Changbei Ma. 2019. "Aptamer-Based Fluorometric Ochratoxin A Assay Based on Photoinduced Electron Transfer" Toxins 11, no. 2: 65. https://0-doi-org.brum.beds.ac.uk/10.3390/toxins11020065
Note that from the first issue of 2016, this journal uses article numbers instead of page numbers. See further details here.