Article

Transcriptomic Insights into Benzenamine Effects on the Development, Aflatoxin Biosynthesis, and Virulence of Aspergillus flavus

State Key Laboratory of Food Nutrition and Safety, Key Laboratory of Food Nutrition and Safety, Ministry of Education, College of Food Engineering and Biotechnology, Tianjin University of Science and Technology, Tianjin 300457, China
*
Author to whom correspondence should be addressed.
Submission received: 28 December 2018 / Revised: 24 January 2019 / Accepted: 25 January 2019 / Published: 27 January 2019

Abstract

:
Aspergillus flavus is a soilborne pathogenic fungus that poses a serious public health threat due to it contamination of food with carcinogenic aflatoxins. Our previous studies have demonstrated that benzenamine displayed strong inhibitory effects on the mycelial growth of A. flavus. In this study, we systematically investigated the inhibitory effects of benzenamine on the development, aflatoxin biosynthesis, and virulence in A. flavus, as well as the underlying mechanism. The results indicated that benzenamine exhibited great capacity to combat A. flavus at a concentration of 100 µL/L, leading to significantly decreased aflatoxin accumulation and colonization capacity in maize. The transcriptional profile revealed that 3589 genes show altered mRNA levels in the A. flavus after treatment with benzenamine, including 1890 down-regulated and 1699 up-regulated genes. Most of the differentially expressed genes participated in the biosynthesis and metabolism of amino acid, purine metabolism, and protein processing in endoplasmic reticulum. Additionally, the results brought us to a suggestion that benzenamine affects the development, aflatoxin biosynthesis, and pathogenicity of A. flavus via down-regulating related genes by depressing the expression of the global regulatory factor leaA. Overall, this study indicates that benzenamine have tremendous potential to act as a fumigant against pathogenic A. flavus. Furthermore, this work offers valuable information regarding the underlying antifungal mechanism of benzenamine against A. flavus at the level of transcription, and these potential targets may be conducive in developing new strategies for preventing aflatoxin contamination.
Key Contribution: Fumigation with benzenamine has significant inhibitory effects on the development, aflatoxin biosynthesis, and virulence of Aspergillus flavus by regulating the expression of a series of genes. This study demonstrates that benzenamine has the potential for development as a commercial antimicrobial fumigant product, and the RNA-Seq data resulting from this study can facilitate finding new potential targets for controlling A. flavus.

1. Introduction

Aspergillus flavus, an opportunistic pathogen of both humans and plants, produces an abundance of diverse secondary metabolites, including aflatoxins. Aflatoxins are the most important mycotoxin due to their common occurrence among the serious threats that are posed to humans and animals. About 18 different types of aflatoxin are now known [1]. Among these, aflatoxin B1 is regarded as the most potent natural carcinogen and it is classified as a Group I carcinogen by the International Agency for Research on Cancer (IARC) [2]. It is estimated that up to 28% of all hepatocellular carcinoma cases worldwide may be caused by aflatoxins [3].
A. flavus is the primary etiological agent of aflatoxin contamination of agricultural commodities, such as corn and peanut [4]. The Food and Agriculture Organization (FAO) forecasts that approximately 2595 million tonnes of cereals will be produced and 2649 million tonnes will be consumed in 2018 [5]. In addition, cereal losses due to other factors, including climate-related natural disasters and conflict, have increased the prevalence of undernourishment. The estimated number of undernourished people increased to nearly 821 million in 2017 [6]. Therefore, preventing aflatoxin contamination is necessary in addressing the problem of food shortage and food safety.
To minimize the harmful effects of aflatoxins, several strategies have been developed to control toxigenic fungus growth and aflatoxin production. Volatiles, such as aldehyde, acetate esters, and alcohols of plant and microbial origin, have been shown to strongly inhibit toxigenic fungus growth and aflatoxin formation [7,8,9,10]. Fumigation with natural volatiles is an ideal method in controlling A. flavus, as it ensures that food is protected from pathogenic fungi with reduced or no organoleptic changes [11]. Furthermore, volatiles are easily volatilized at ambient temperature. This characteristic gives volatile compounds a great advantage from the point of view of application practicality and homogeneity [12]. Among these volatiles, ethers, such as dimethyl disulfide and dimethyl sulfide, have been proved to be effective agents for combating pathogens [13,14]. Previously, we demonstrated that benzenamine has great capacity for controlling the growth of A. flavus [15]. However, the inhibitory effects have not yet been studied in depth. It is not clear whether aflatoxin production is affected, and the underlying mechanisms are not known.
The genomes of several species of Aspergillus have recently been sequenced and analyzed, and the regulation of aflatoxin biosynthesis and development in A. flavus has been well studied [16]. The biosynthetic pathway of aflatoxins has been essentially clarified [17]. In addition, the functions of several global regulatory genes, such as laeA and veA, which are involved in fungal secondary metabolism and development, have been characterized [18,19]. High-throughput sequencing technologies are currently revolutionizing the field of biology and RNA sequencing (RNA-Seq) has been applied to study a range of eukaryotic transcriptomes, with less sampling bias, higher resolution, and much broader expression range coverage [20,21].
In this study, we are interested in revealing the antimicrobial activity of benzenamine against A. flavus. The RNA-Seq approach was applied to systematically investigate the mechanism of benzenamine-induced regulation of the development, aflatoxin biosynthesis, and virulence of A. flavus. This work will be meaningful for further understanding the interactions of volatiles with A. flavus and the regulation of aflatoxin biosynthesis, and the results should be of interest to those that are studying the management of A. flavus contamination in agricultural products.

2. Results and Discussion

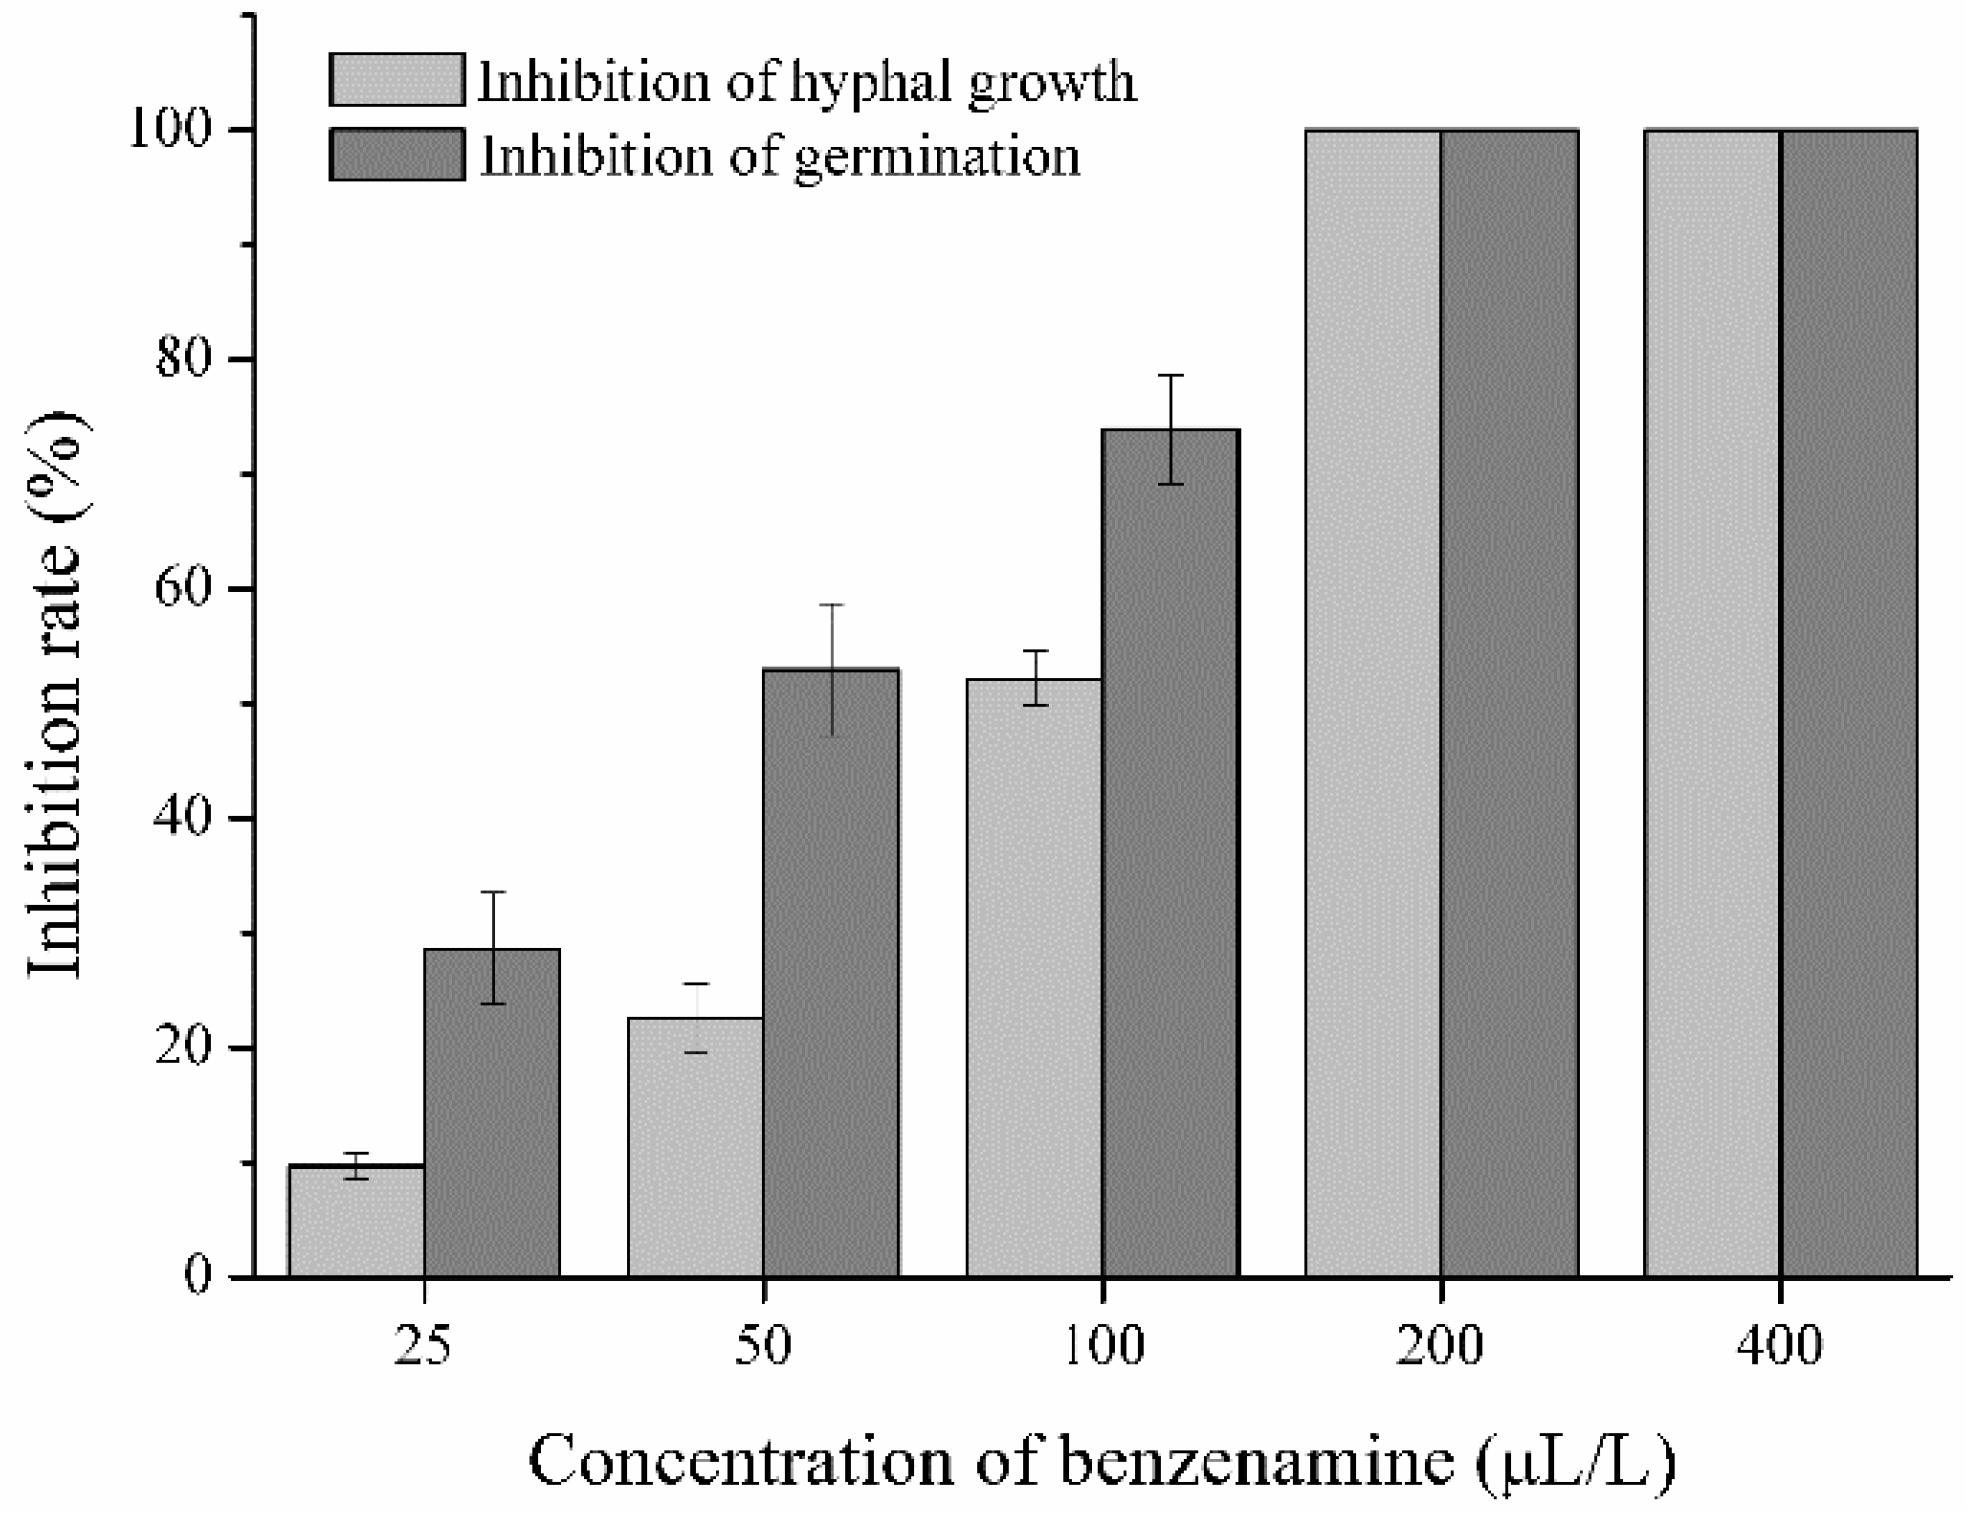
2.1. Antagonistic Activity of Benzenamine against A. flavus

Fungal colony diameter, aflatoxin production, and colonization of maize were quantified to define the inhibitory effect of benzenamine in the development, toxigenicity, and virulence of A. flavus. As shown in Figure 1, benzenamine exerted inhibitory effects on the mycelial growth and spore germination of A. flavus at the tested concentrations. Increasing concentrations of benzenamine (from 25 to 400 μL/L) resulted in a significant increase in growth inhibition (from 9.67 to 100%). Untreated mycelia grew to a diameter of 4.60 cm by three days post-inoculation, and conidia germinated completely within 9 h. The inhibition of hyphal growth and conidial germination of A. flavus resulting from treatment with 100 µL/L of benzenamine was 52.19% and 73.96%, respectively. Additionally, the minimum inhibitory concentration (MIC) of benzenamine against A. flavus was found to be 200 μL/L. The growth and conidial germination of A. flavus were completely inhibited at this concentration. Interestingly, we noted that exposing A. flavus to benzenamine for three days inhibited the fungus, but it renewed its growth after being transferred into fresh Potato Dextrose Agar (PDA) plates. This phenomenon clearly indicates that benzenamine suppressed A. flavus growth but did not kill A. flavus.
Subsequently, 100 μL/L of benzenamine with moderate bioactivity was applied to further investigate the inhibitory effect of benzenamine on the toxigenicity and virulence of A. flavus. Figure 2 shows the effect of benzamine treatment on aflatoxin B1 production. The concentration of aflatoxin B1 was 83.14 ng/g in control groups (CG), whereas no aflatoxin B1 (<0.03 ng/g) was detected in A. flavus that was treated with benzenamine (EG—experimental group). The results for maize that was colonized by A. flavus are shown in Figure 3. In untreated maize kernels (CG), inoculation with A. flavus caused the complete colonization (3.28 × 10⁶ conidia/mL) within five days. In the treatments exposing infected kernels to 100 μL/L of benzenamine (EG), no visible symptoms were observed, and the number of conidia sharply decreased to 0.25 × 10⁶ conidia/mL. The results of the antifungal ability experiment clearly indicate that benzenamine displays strong inhibitory effects on the development, aflatoxin biosynthesis, and fungal virulence of A. flavus.

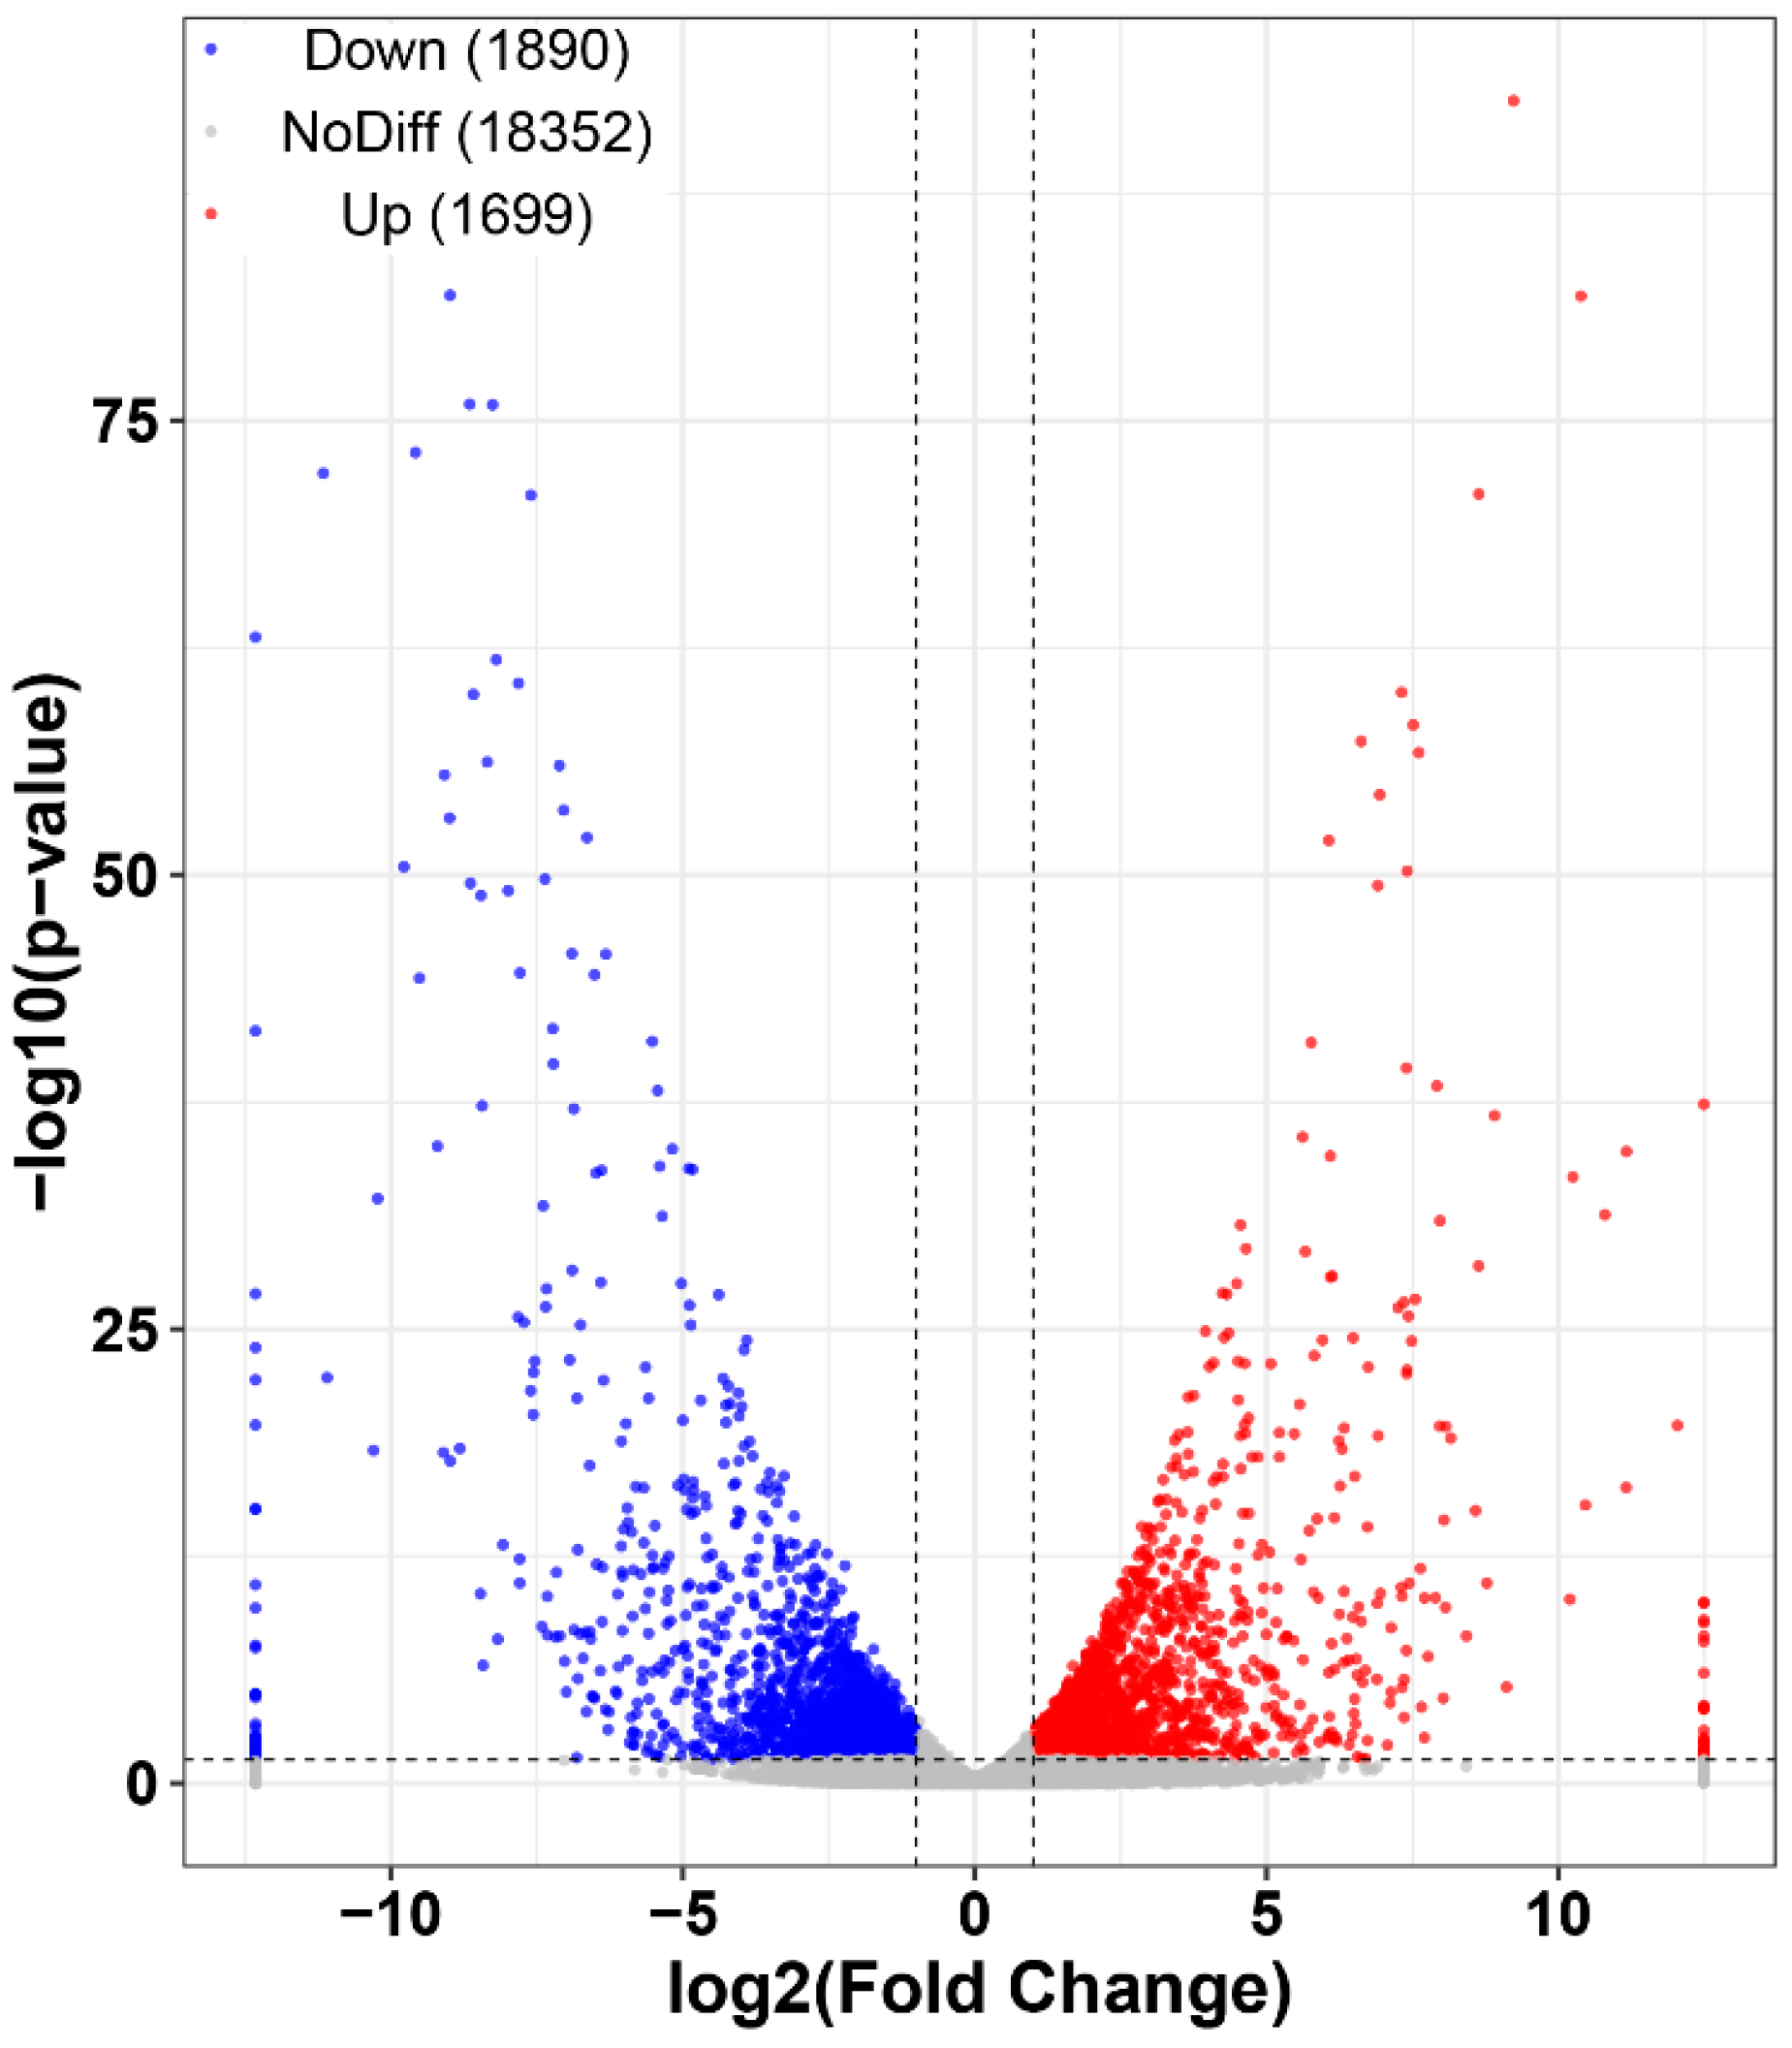
2.2. Transcriptome Overview

To identify A. flavus genes that were differentially regulated during continuous exposure to benzenamine, a transcriptome analysis of A. flavus with three biological replicates was performed using the Illumina platform. Raw sequencing data can have issues regarding low quality, which can significantly distort analytical results and lead to erroneous conclusions. Therefore, quality control steps were performed to ensure that RNA-Seq data were of high quality. The clean reads were obtained by trimming the raw data containing adapters, poor-quality bases (<Q20), and a sequence length smaller than 50 nucleotides (Table S1). After the assembly of clean data, a total of 23,639 unigenes were obtained, with a mean length of 1437 bp (Table S2).

2.3. Annotation and Analysis of All Unigenes

To understand the transcriptome of A. flavus, all of the unigenes were aligned against several databases using BLASTx (E-value ≤ 10–5), including NR (NCBI non-redundant protein sequences), GO (Gene Ontology), KEGG (Kyoto Encyclopedia of Genes and Genome), eggNOG (evolutionary genealogy of genes: Non-supervised Orthologous Groups), and Swiss-Prot. The results are summarized in Table S3. A total of 14,684 unigenes were matched to known proteins in the NR database, although the genome of A. flavus is estimated to contain 13,485 genes [22]. This may be due to the variety in the transcripts from processes, such as alternative splicing and posttranscriptional regulation [23]. The results indicate that more unigenes have the potential for translation into functional proteins, which serves to improve the annotation of the A. flavus genome.

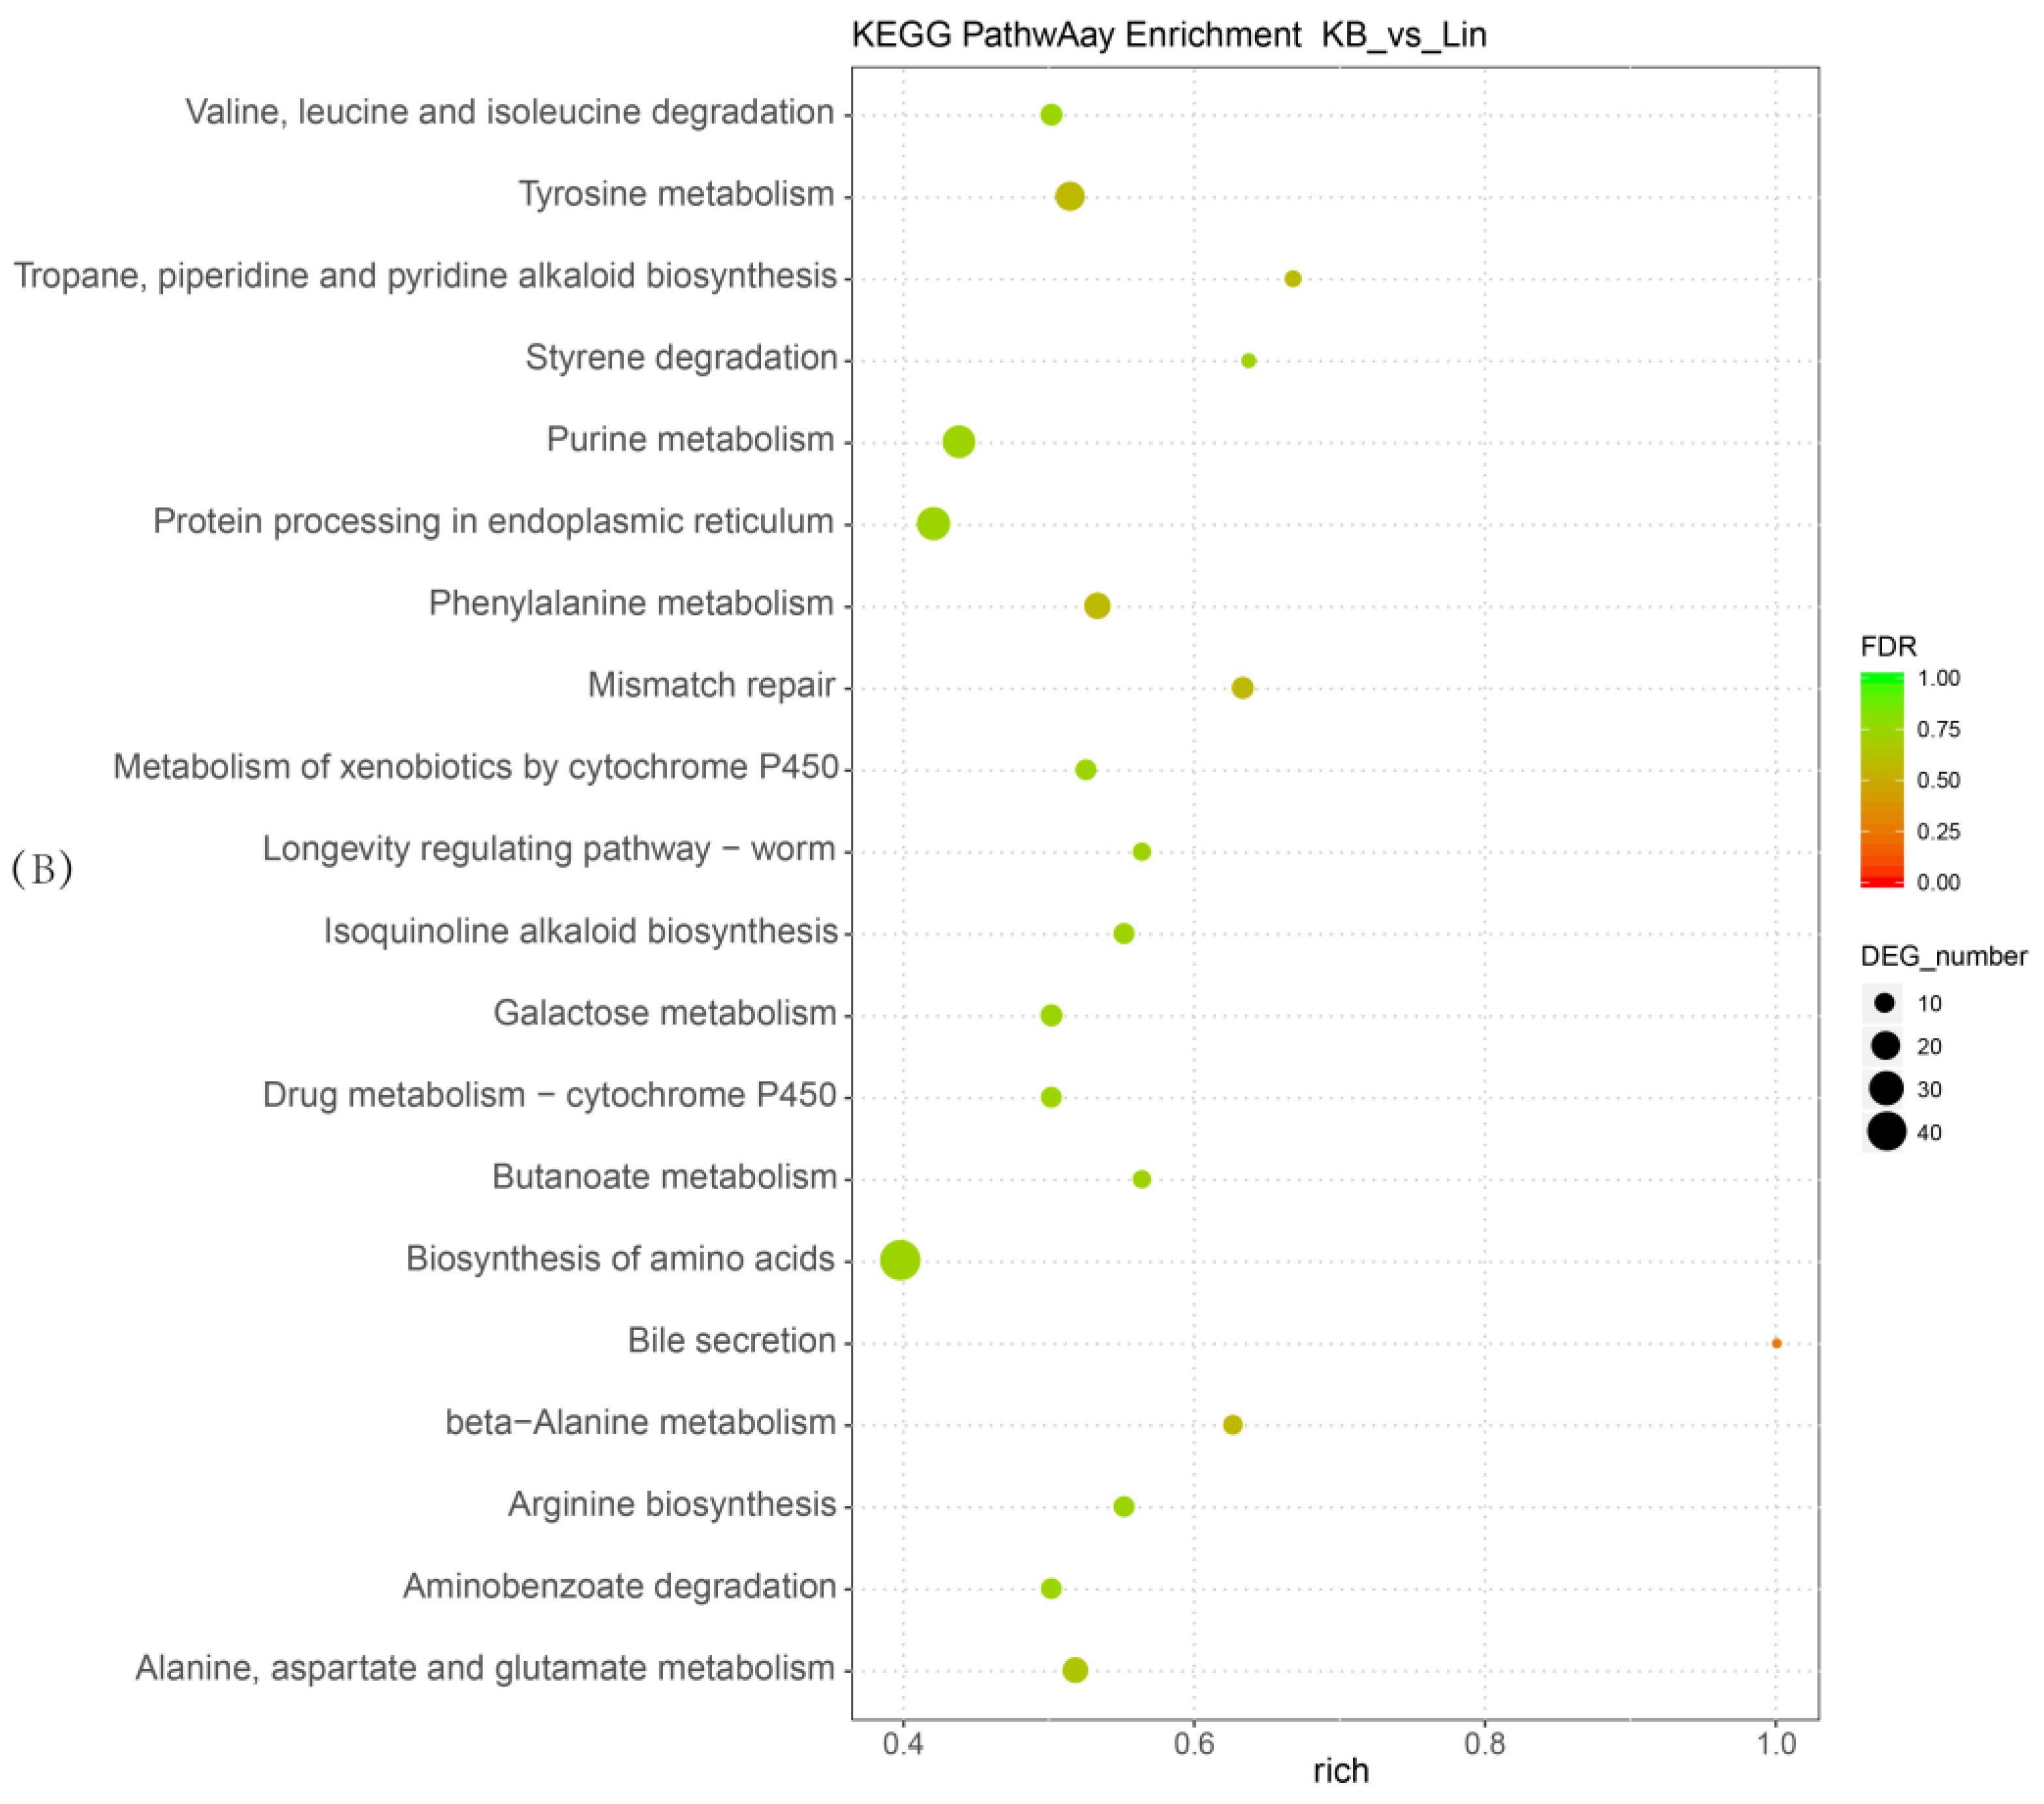
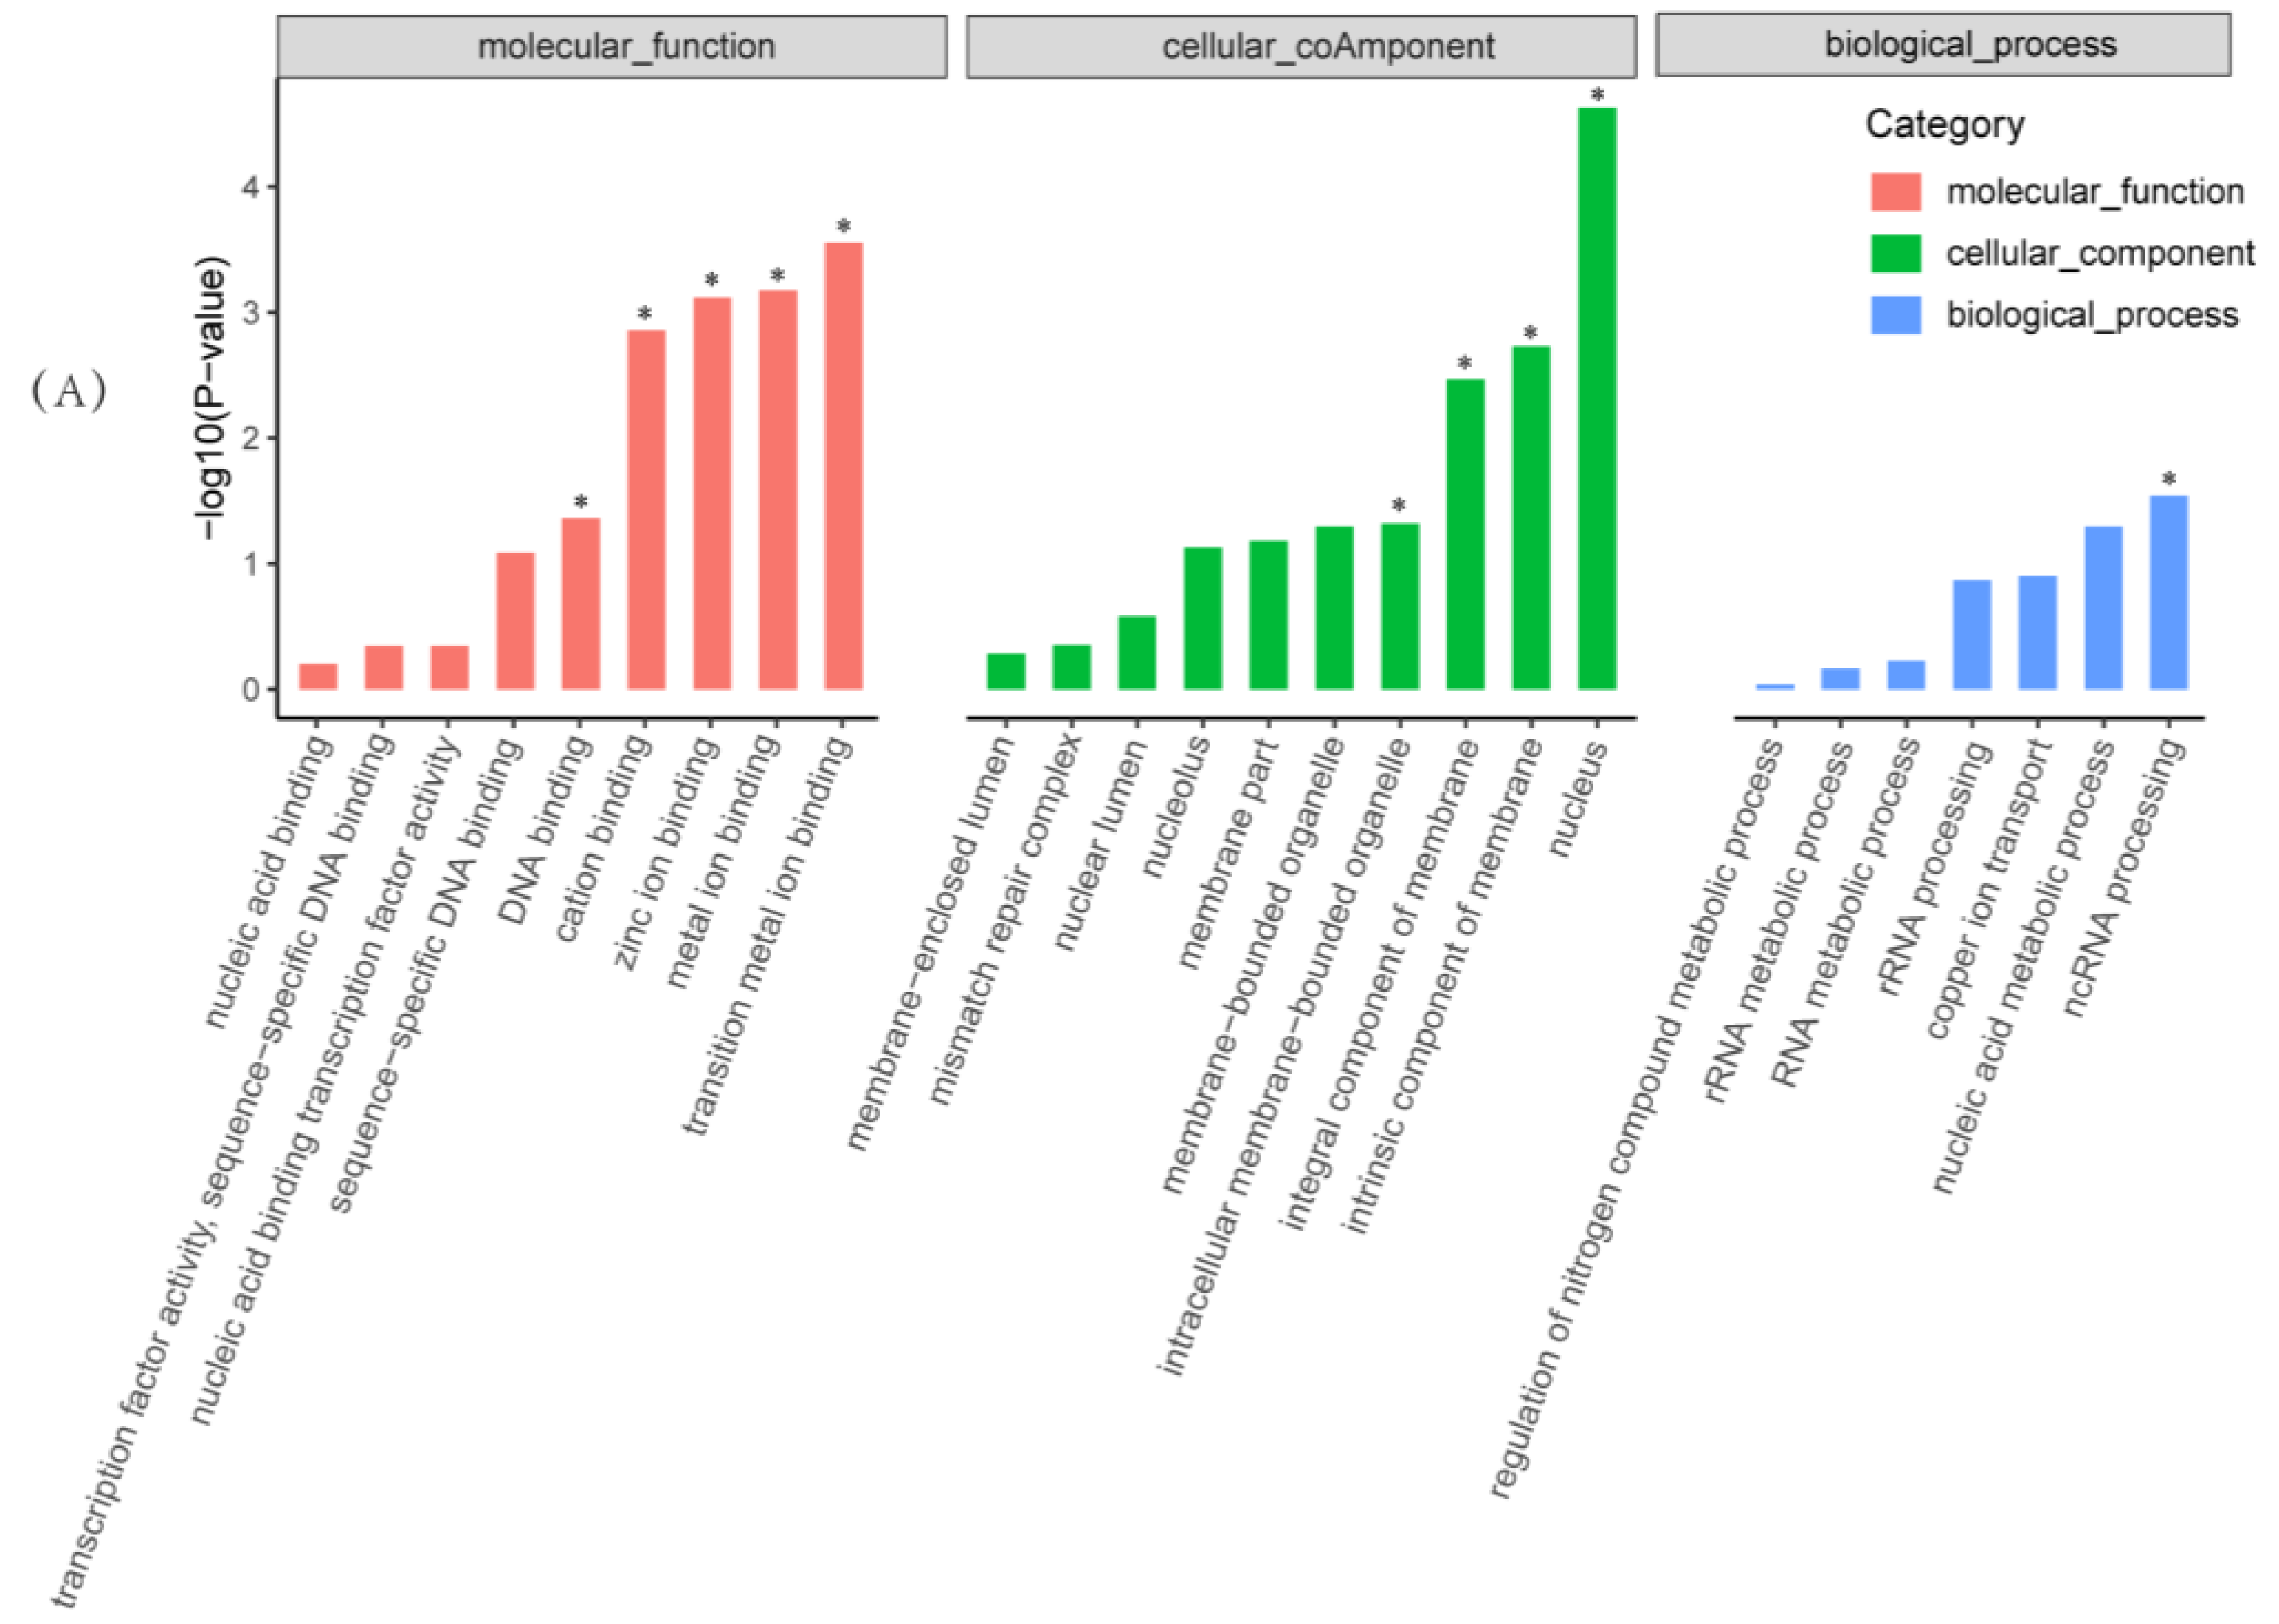
2.4. Functional and Pathway Enrichment Analysis of Differentially Expressed Genes

Out of the 23,639 unigenes, 3589 showed differential accumulation of mRNAs. Among all differentially expressed genes (DEGs), 1890 genes (accounting for 52.66% of all DEGs) were significantly downregulated and 1699 genes (accounting for 47.34% of all DEGs) were upregulated compared with the untreated samples (Figure 4, Table S4). All DEGs were subjected to GO and KEGG enrichment analyses. A total of 2539 DEGs were mapped to 2836 GO terms. Among these, 1773, 653, and 410 GO terms belong to the biological process, molecular function, and cellular component categories, respectively. As shown in Figure 5A, transition metal ion binding, metal ion binding, zinc ion binding, cation binding, and DNA binding are significant enrichment terms that belong to the molecular function category. The significant functional terms in the cellular component category are related to the nucleus, the intrinsic/integral component of the membrane, and intracellular membrane-bounded organelles. Additionally, ncRNA processing and the nucleic acid metabolic process are the most abundant in the biological process category. According to the KEGG pathway database, significantly enriched pathways include the biosynthesis and metabolism of amino acids (tyrosine metabolism; phenylalanine metabolism; alanine, aspartate, and glutamate metabolism; etc.), purine metabolism, protein processing in the endoplasmic reticulum, and mismatch repair, amongst others (Figure 5B). Thus, the RNA-Seq results indicate that benzenamine exerts complex regulatory effects on A. flavus. Next, the genes that are involved in the development, aflatoxin biosynthesis, and virulence of A. flavus were further analyzed.

2.5. Analysis of DEGs Involved in Development

To elucidate the effects of benzenamine on the development of A. flavus, DEGs that are related to the cell wall, cell membrane, conidia, transcription factors, and others were analyzed in our work (Table 1).

2.5.1. DEGs Involved in the Cell Wall

The cell wall provides fungi with a protective barrier against environmental stresses, and it is essential for the survival of the fungus during development and reproduction [24]. It has been reported that the cell wall is an important molecular target of antifungal compounds [25]. Numerous DEGs that are involved in the cell wall were found in this study (Table 1).
α-1,3-Glucan and β-1,3-Glucan play critical roles in maintaining the normal morphology of the fungal cell wall. Ags1 encodes a synthase that mediates the synthesis of α-1,3-glucan [26]. The enzyme β-1,3-glucan synthase, encoded by fks1, is an essential and unique structural component of β-1,3-Glucan [27]. In the current work, ags1 and fks1 were significantly downregulated by benzenamine. Chitin is an important structural polysaccharide of the cell wall, and chitin synthesis is directly governed by chitin synthase [28]. The transcription of chitin synthase genes chs6 and chs8 was moderately downregulated. Chitinase is conducive to fungal cell separation during their reproduction period. The downregulation of the glucanase gene crh11 was also found, and this could lead to fungal reproduction disorder [29].
Glycosylphosphatidyl-inositol (GPI)-anchored proteins are one of the major cell wall components. GPI-anchored proteins are essential for the normal function of glucan assembly [30]. The genes that are responsible for GPI-anchored protein biosynthesis are potential targets of antifungal reagents. The RNA-Seq data show that cfmA (GPI-anchored CFEM domain protein) and afuA (GPI-anchored membrane protein) had reduced expression in our study. In addition, the regulatory subunit of the rho family of GTPases is essential to the cell wall integrity signaling pathway. It has been proved that the deletion of the rho protein results in cytoplasmic leakage [25]. Interestingly, the GTP-binding proteins rho2 and rho4 had 2.68- and 2.48-fold increases in expression, respectively. This phenomenon may be a defensive response of cells to overcome external stimulation [31].

2.5.2. DEGs Involved in the Cell Membrane

The cell membrane plays important roles in the maintenance of osmotic pressure and normal physiological function; thus, it is another important target of the antimicrobial substance [32]. Ergosterol is an important and specific component of the fungal cell membrane, and it is essential for fungal growth and development [33]. Ergosterol is considered to be crucial in regulating cell membrane fluidity, permeability, and membrane-bound enzyme activities, as well as in substance transportation [34]. Furthermore, ergosterol can stimulate the growth and proliferation of fungi [35]. As shown in Table 1, eight ergosterol biosynthesis genes displayed significant expression. Of these eight, seven DEGs were downregulated, exhibiting fold changes that ranged between 2.35- and 82.03-fold. The erg7 gene encodes lanosterol synthase and experienced the biggest reduction. However, the erg3 gene was upregulated by 11.64-fold. It was reported that the last reactions in ergosterol biosynthesis are catalyzed by erg3/erg4/erg5, and these enzymes catalyze the conversion of episterol into ergosterol [36]. Therefore, increased expression of erg3 may be considered to be a compensation response to the downregulation of erg4/erg5.

2.5.3. DEGs Involved in Conidia

Asexual sporulation is fundamental to the ecology and lifestyle of fungi. The ability to produce conidia is a key factor contributing to the fecundity, propagation, and fitness of A. flavus. The formation and maturation of conidia is primarily governed by the brlA-abaA-wetA regulatory cascade [37,38]. In the current study, the brlA, abaA, and wetA genes were significantly downregulated to different degrees, directly leading to lower levels of conidia formation. In addition, the transcription of the hydrophobin genes rodA and rodB was remarkably downregulated (Table 1). The formation of rodlets, physical resistance, and immunological inertia of the conidia is partly due to the presence of a hydrophobic layer that is composed of a protein from the hydrophobin family [39]. These identified DEGs indicate that benzenamine hinders the normal formation and physiological state of A. flavus conidia.

2.5.4. DEGs Involved in Transcription Factors

Numerous transcription factor-encoding genes that are related to fungal development were differentially expressed in A. flavus after exposure to benzenamine. Most of the transcription factors, such as the secondary metabolism regulator laeA, C2H2 finger domain transcription factor sebA, and Ca2+ regulator and membrane fusion protein fig1, were downregulated to varying extents, whereas some transcription factors were upregulated, including the C2H2-like transcription factor mtfA and the developmental and secondary metabolism regulator veA. Among these, laeA and veA are the most important regulatory genes in Aspergillus spp. A complicated network of global regulators governs the development and secondary metabolism in Aspergillus spp. by including laeA and veA [19]. LaeA was first identified in Aspergillus nidulans, and it has been extensively studied. Numerous developmental genes are regulated by laeA, such as knh1, encoding a GPI-anchored protein involved in cell wall biosynthesis; stuA, encoding a cell pattern formation-associated protein that is related to conidiophore development; and, hydrophobic proteins encoded by rodA/B [40]. VeA also has the ability to regulate developmental genes, such as the downregulation of the asexual development-associated transcription factors brlA and abaA, which are required for the formation of conidia [38,41]. A heterotrimeric complex that is formed by the proteins encoded by laeA, veA, and velB has been reported to regulate sporulation and secondary metabolism [42]. In addition, it was reported that laeA and veA negatively affect each other’s transcription [19,43].
The transcriptomic results reveal that benzenamine exerted different effects on the expression of laeA and veA in the current work. The gene laeA was significantly downregulated by 3.57-fold, whereas veA was upregulated by 2.67-fold. This phenomenon may be due to the opposing regulatory effects of laeA and veA. The results indicate that benzenamine may suppress the development of A. flavus through its adverse effects on key processes, such as cell wall synthesis and conidia production, by regulating the expression of laeA and veA. This is also consistent with the above analysis results. In addition, the gene cytC, which encodes an apoptogenic factor, was significantly upregulated (5.03-fold). We hypothesize that cytC may be regulated by laeA or veA. However, up to now, regulation by laeA or veA of genes that are related to apoptosis has not been described, and we will investigate this inference in our future work.

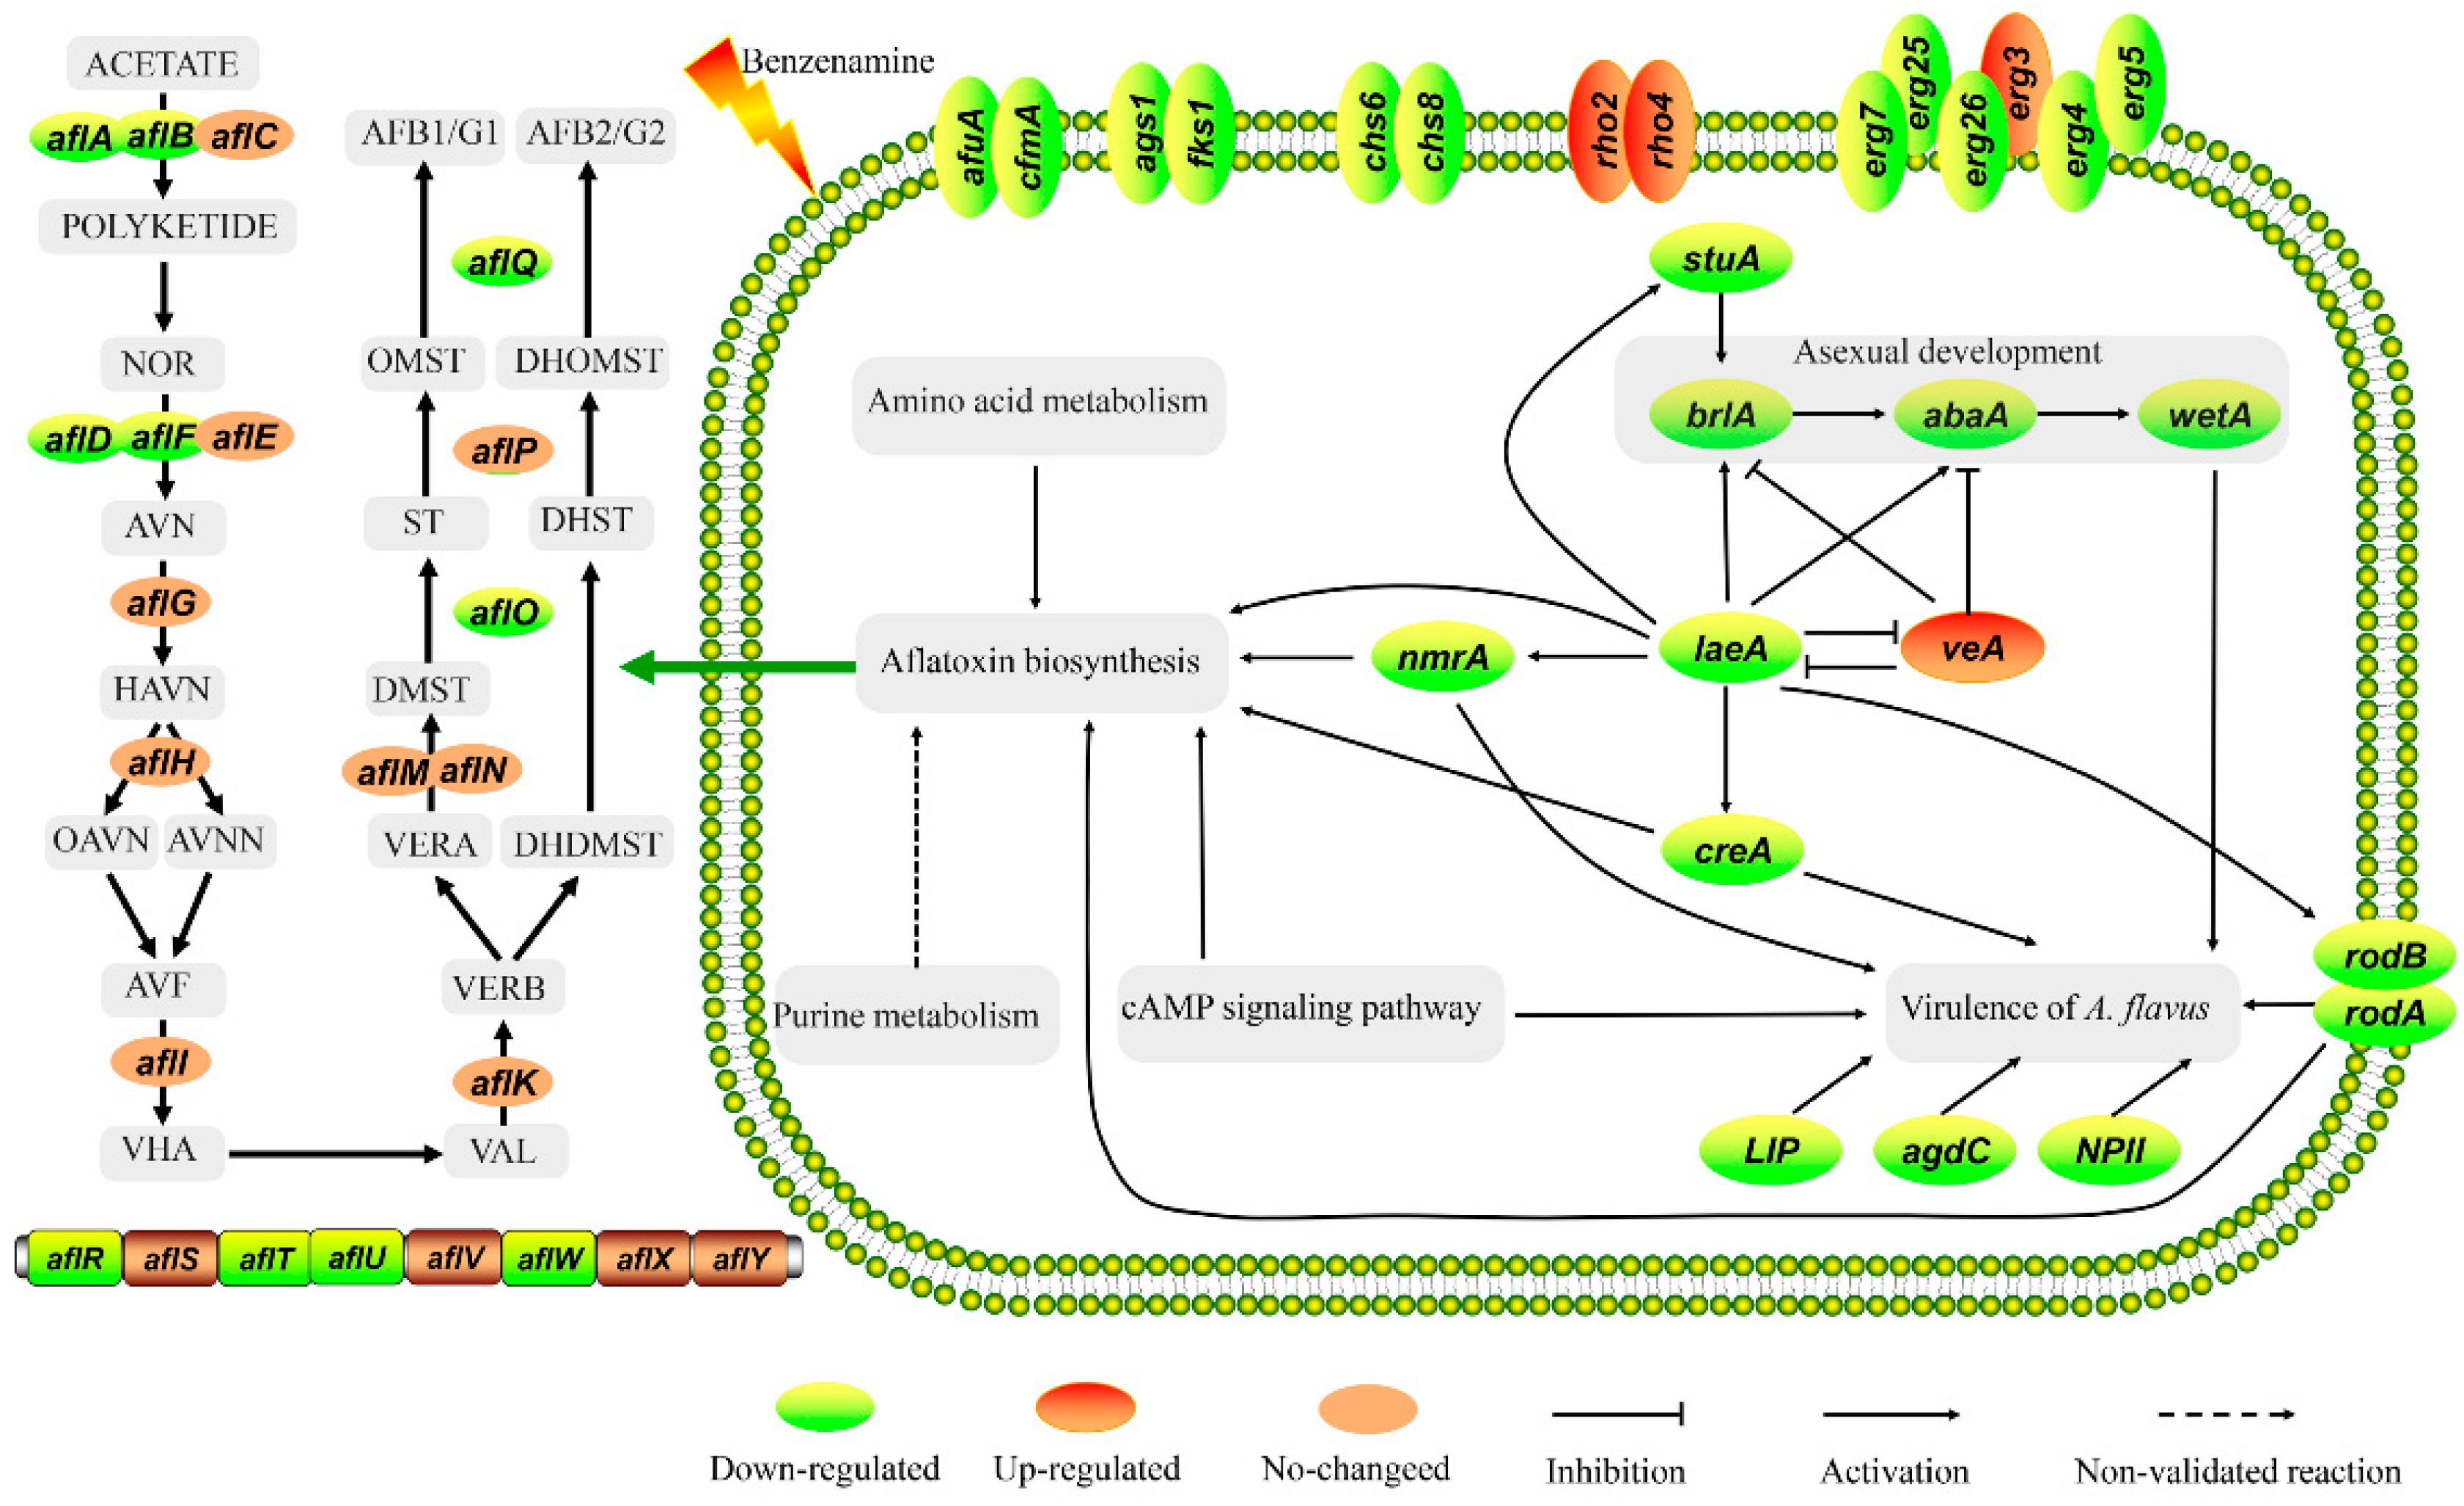
2.6. Analysis of DEGs Involved in Aflatoxin Biosynthesis

2.6.1. DEGs Involved in Aflatoxin Biosynthesis

To evaluate the regulatory roles of benzenamine on aflatoxin biosynthesis, the expression levels of genes that are involved in aflatoxin biosynthesis were analyzed. The biosynthetic pathways of aflatoxin have been well described [44,45]. A total of 10 genes that are involved in the aflatoxin biosynthesis, especially aflA, aflB, aflD, aflT, and aflU, were downregulated by benzenamine (Table 2). Two fatty acid synthases, aflA and aflB, are related to the early stage of aflatoxin biosynthesis, and they are capable of converting acetate to norsolorinic acid (NOR), which is a stable aflatoxin precursor [46,47]. On the other hand, there was no significant difference in the expression of aflC, which has an equivalent function. The expression level of aflD was reported to play a significant role in aflatoxin biosynthesis. The gene aflD encodes a norsolorinic acid ketoreductase that converts NOR to averantin (AVN) [48]. Additionally, aflE and aflF, homologous to aflD, are predicted to catalyze NOR to AVN [47,49]. The expression of aflF was downregulated by 3.13-fold, and aflE showed no significant difference in expression. AflT encodes a transmembrane protein and it is located at the end of the gene cluster for aflatoxin biosynthesis [50]. It was reported that aflT is not essential for the production and secretion of aflatoxin, and the expression of aflT is not regulated by the transcription regulator genes aflR and aflS, but by fadA, which encodes a G alpha protein-dependent signaling pathway [51]. Furthermore, aflR encodes a specific zinc-finger DNA-binding protein, which is an important regulatory gene that is required for transcriptional activation of most genes in aflatoxin biosynthesis [47,52]. The downregulation of aflR by benzenamine could cause changes in other aflatoxin biosynthesis pathway genes. However, the expression level of another regulatory gene, aflS, did not display any obvious changes. Our data clearly demonstrate that the aflatoxin production of A. flavus treated by benzenamine is directly reduced by downregulating the expression levels of aflatoxin biosynthesis genes.

2.6.2. DEGs Involved in Carbon/Nitrogen Metabolism

It has been reported that aflatoxin production is influenced by nutrition factors, such as carbon and nitrogen sources [53,54]. Several DEGs that are involved in carbon and nitrogen metabolism were found in our data. Carbon catabolite repression (CCR) is a regulatory phenomenon that is hierarchically implemented to organize carbohydrate utilization, which is required for the regulation of growth and secondary metabolism in fungi [55,56]. CreA, which is a global regulator of CCR, encodes a zinc finger of a Cys2/His2 class protein and mediates various alternative carbon-utilizing systems [57,58]. The deletion of creA induces a strong reduction of aflatoxin synthesis. Additionally, cell wall homeostasis and conidial differentiation are regulated by creA [54,59]. The expression levels of the creA transcript in A. flavus after exposure to benzenamine were significantly lower than in the control. It is supposed that creA regulates gene expression by binding to consensus binding sites in the promoters of target genes, and this consensus binding site has been found in most aflatoxin gene promoter regions [60,61]. It appears likely that the downregulation of creA by benzenamine also contributes to the depression of aflatoxin production.
Nitrogen source is another important nutritional factor that is linked with aflatoxin biosynthesis [62,63]. Microorganisms can use a wide range of nitrogen sources, and different nitrogen sources may have different effects on aflatoxin production [53]. For example, it has been reported that glutamine and tyrosine favor aflatoxin production in A. flavus, while tryptophan does not [64,65]. Nitrogen utilization is often mediated by nitrogen metabolite repression (NMR) [66]. The gene nmrA negatively regulates several genes that are involved in NMR and it appears to be involved in the development and aflatoxin biosynthesis in A. flavus. Furthermore, the absence of nmrA results in reduced aflatoxin production [67]. The results of RNA-Seq in our study show that the expression of nmrAL1, which encodes nmrA-like family domain-containing protein 1, was significantly decreased. Additionally, gad1 and gfa1, which are involved in the glutamine metabolic process, were downregulated by benzenamine.

2.6.3. Other Related DEGs

Previous reports have demonstrated that pathway-specific regulators, as well as a complicated network of global regulators, govern multiple secondary metabolite gene clusters [19,43]. The expression of aflatoxin biosynthesis cluster genes is also modified by the global regulator laeA. The deletion of laeA blocks the production of aflatoxin by downregulating the expression of early aflatoxin biosynthesis genes and the pathway-specific transcriptional regulator aflR [18]. In addition, conidial development and aflatoxin formation are tightly coordinated in A. flavus [43]. The loss of conidial hydrophobicity in the laeA deletion mutant is considered to be capable of influencing the formation and stability of vesicles, thereby reducing aflatoxin biosynthesis [18,68]. Additionally, the loss of laeA may downregulate the expression of nmrA, and this regulation of nmrA contributes to reduced aflatoxin biosynthesis [67]. Our data agree with those indicating comprehensive regulation in A. flavus by laeA.
The cAMP/PKA signaling pathway regulates fungal morphogenesis and metabolism, including mycotoxin biosynthesis [69,70,71,72]. Previous papers have shown that cAMP signaling plays an important role in hyphal growth, conidiation, and production of DON [73,74]. It was reported that decreasing levels of cAMP block aflatoxin biosynthesis in A. flavus [75,76]. In the current work, all three DEGs in the cAMP signaling pathway were downregulated by magnitudes that ranged from 2.02- to 4.30-fold. The results indicate that the downregulation of the cAMP pathway genes by benzenamine is likely to negatively regulate aflatoxin biosynthesis in A. flavus. Additionally, of interest, most of the genes that are involved in purine metabolism were significantly downregulated by benzenamine, which implies that this process might have a role in aflatoxin synthesis.
The RNA-Seq data indicate that benzenamine not only directly reduces the production of aflatoxin by downregulating the aflatoxin biosynthesis pathway genes and pathway-specific regulatory genes, but it also indirectly blocks aflatoxin synthesis by mediating nutrient metabolism, signaling pathways, and the expression of the global transcription regulator.

2.7. Analysis of DEGs Involved in the Virulence of A. flavus

2.7.1. DEGs Involved in Hydrolases

Extracellular hydrolases, such as glucosidase, proteases, and lipases, are critical for A. flavus to colonize its hosts [49,77,78]. A. flavus is able to degrade complex organic substrates, obtain nutrients for growth, macerate, and then invade host tissues [79]. The decreased abundance of hydrolases increases the difficulty for mycelia to penetrate and colonize hosts [40]. Several A. flavus hydrolytic enzymes, including α-glucosidase, lipase, and neutral protease, were downregulated to different degrees, according to our results (Table 3). Additionally, cutinase transcription factors ctf1A/B showed significantly downregulated transcription. However, of interest, there was no significant difference in the expression of cutinase in A. flavus after exposure to benzenamine.

2.7.2. DEGs Involved in the Development and Metabolism of A. flavus

The virulence of A. flavus has been proved to be multifactorial, and it is also tightly coordinated with development, sporulation, and metabolism [80]. The cell wall is critical for the virulence of fungal pathogenicity [25]. Cell wall components, such as polysaccharides and proteins, are considered to be virulence factors and they contribute to colonization of the host [81,82]. The loss of cell wall integrity might influence the colonization by A. flavus of the host [75]. Several genes that are involved in the cell wall were downregulated in our study. Therefore, benzenamine might reduce the virulence of A. flavus by damaging its cell wall integrity.
Aspergillus species have the ability to produce a large quantity of asexual spores that spread through conidia [83]. Conidia are abundantly suspended in the air and environment, and they can remain viable for a long period of time [84,85]. These conidia will form a short germ tube and germinate when they colonize in hosts [86]. The formation and germination of conidia is critical for successful colonization. The expression of stuA, which encodes a cell pattern formation-associated protein that is involved in conidiophore development, was downregulated by benzenamine. Additionally, in Aspergillus, conidial hydrophobicity plays an important role in the infection of host tissues. The insoluble hydrophobic rodlet layer that is enveloped in the surface of A. flavus conidia contributes to the strengthening of the dispersal capacity and survival in a hostile environment, and the rodlet layer comprises the hydrophobic rodA protein that covalently binds to the conidial cell wall via GPI remnants [39,87]. Previous studies have reported that decreased conidial hydrophobicity accompanies reduced pathogenicity [88]. Our data demonstrate that hydrophobins rodA and rodB were also significantly decreased in abundance. The results indicate that conidial hydrophobins may be possible targets for preventing A. flavus infection in maize, which is in agreement with the above statement.
Carbon and nitrogen nutrients are required for the growth and secondary metabolism of fungi, and the effect of these nutrients on the virulence of A. flavus was reported recently. CreA and nmrA play important roles in the invasive virulence of A. flavus. The deletion of creA causes a defect in its capacity to effectively infect the host due to a reduction in conidial quantity and hydrophobicity [54]. Similarly, the loss of nmrA decreases the virulence of A. flavus, compromising its ability to produce conidia and colonize the host [67]. Thus, according to our data, benzenamine might reduce the pathogenicity of A. flavus by decreasing the expression of creA and nmrA.
In addition, the global regulator laeA and cAMP signaling have been reported to regulate the virulence of A. flavus. Previous studies reported that the deletion of laeA decreases the ability to colonize seeds [40,43]. In laeA mutant strains, the expression of several genes that are vital for pathogenicity (such as lipase, α-amylase, nmrA, and rodA) is downregulated, which might result in reduced fungal virulence [18,67]. The involvement of the cAMP signaling pathway in the regulation of fungal virulence has been reported [89,90]. The loss of genes in the cAMP signaling pathway, such as acyA and cpk1, considerably reduces the virulence of pathogenic fungi by repressing conidial production [74,76,91]. In the present study, our data demonstrate that benzenamine could decrease the virulence of pathogenic A. flavus by regulating laeA transcription and the cAMP signaling pathway.

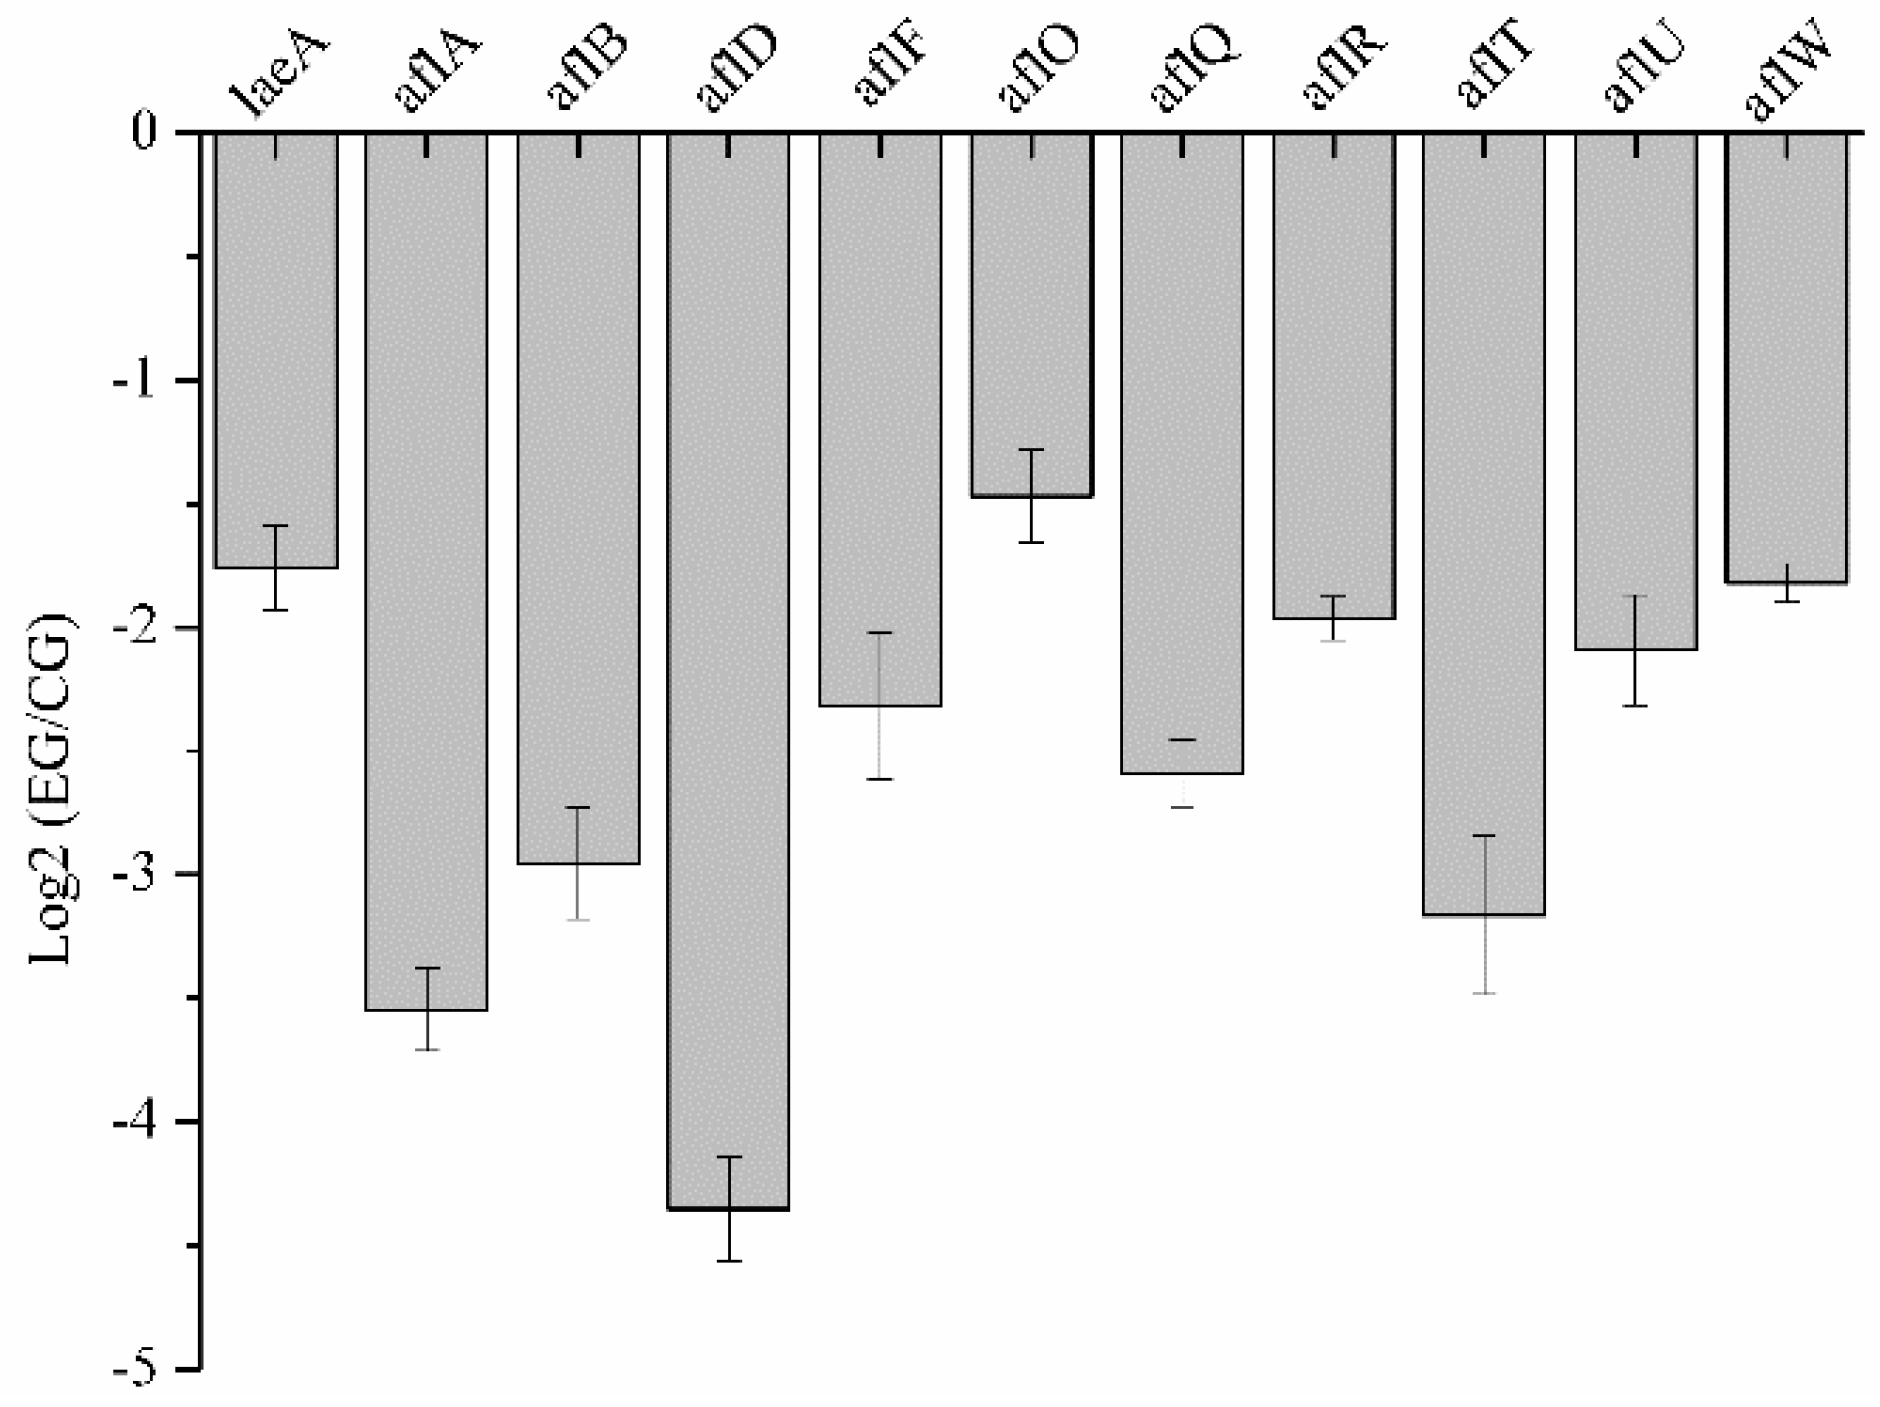
2.8. Validation of RNA-Seq Data by qRT-PCR

The qRT-PCR experiment was used to validate the RNA-Seq data in our study. DEGs that are involved in aflatoxin synthesis and the important global regulatory factor laeA were chosen for qRT-PCR validation. The differential gene expression profiles between the control group (CG) and experimental group (EG) are shown in Figure 6. The results show that these genes have expression patterns that are consistent with the RNA-Seq data, indicating the reliability of the transcriptome analysis in the current work. Overall, in order to elucidate the regulatory molecular events following A. flavus exposure to benzenamine, a hypothetical molecular mode of action is proposed on the basis of our data (Figure 7).

3. Conclusions

The current work demonstrates that benzenamine exerts strong inhibitory effects on the development, aflatoxin production, and pathogenicity of A. flavus, and the results provide fundamental information in understanding the fungal response to benzenamine at the transcriptional level. Based on the transcriptional profile, thousands of genes are downregulated in A. flavus after treatment with benzenamine, including genes that are associated with growth, differentiation, and aflatoxin biosynthesis in A. flavus, and we conclude that benzenamine inactivates A. flavus by suppressing the expression of related genes by downregulating the regulatory factor laeA. These enriched DEGs could be exploited in order to develop genetic strategies to reduce contamination by pathogenic A. flavus.

4. Materials and Methods

4.1. Microorganisms

A. flavus used in this study was obtained from the China Center of Industrial Culture Collection (CICC NO. 2219). The strain was cultured on PDA (200 g/L potato infusion, 20 g/L dextrose, and 20 g/L agar) in Petri Dishes at 28 °C for three days. Conidia were washed with sterile distilled water containing 0.05% (v/v) Tween 80, and their density was adjusted by a hemocytometer to a final concentration of approximately 1 × 10⁶ conidia/mL.

4.2. Antifungal Assays

4.2.1. Inhibition of Hyphal Growth of A. flavus

To study the efficacy of benzenamine against mycelial growth, a setup of two inverse face-to-face Petri Dishes was applied according to Wu et al. [14]. The system consists of two 6 cm lidless Petri Dishes. The upper plate contained 5 mL of PDA inoculated with a 6 mm diameter A. flavus agar plug in the center, and the lower plate contained benzenamine at different concentrations (25, 50, 100, 200, 400 µL/L). The two dishes were sealed with a double layer of parafilm and then incubated at 28 °C for three days. The treatments consisted of three replicates, and each experiment was performed in triplicate. The inhibition rate of mycelial growth was calculated using the following Equation:
Inhibition rate (%) = (Rc − Rt)/Rc × 100%
where Rc is the colony diameter of the control and Rt is the colony diameter of the treatment.

4.2.2. Inhibition of Conidial Germination of A. flavus

In this assay, face-to-face Petri Dishes, as described above, were applied. The top dishes, which contained a sterile filter-paper dipped in benzenamine, were attached face-to-face to a PDA plate spread with a 100 μL conidial suspension of A. flavus. The setup was then incubated at 28 °C for 9 h. Conidial germination was evaluated by examining no less than 100 conidia per Petri Dish. Conidia were considered to be germinated when the germ tube measured at least twice its length [92]. The treatments consisted of three replicates, and each experiment was performed in triplicate. Inhibition of germination was calculated according to the formula:
Inhibition of germination (%) = (Gc − Gt)/Gc × 100%
where Gc is the germination rate of the control and Gt is the germination rate of the fungus exposed to benzenamine.

4.3. Determination of Aflatoxin B1

Aflatoxin B1 content was detected with an ELISA kit in this study. A. flavus was treated with 100 µL/L of benzenamine for five days at 28 °C. Aflatoxin B1 extraction was carried out following the procedure that was described by Bavaro et al. [93]. Briefly, five fungal agar plugs (6 mm diameter) were extracted with 25 mL of 80% methanol. The extraction solution was centrifuged at 4500 rpm for 10 min and the supernatant was measured using an ELISA kit (Huaan Magnech Bio-Tech Co., Ltd., Beijing, China), according to the manufacturer’s instructions. The linear range was between 0.03–2 ng/g for AFB1 (R2 = 0.9983). The limit of detection (LOD) was 0.03 ng/g and the limit of quantification (LOQ) was 0.08 ng/g. The average spiked recovery rate was 100 ± 20%, with the coefficient of variation (CV) being less than 10%.

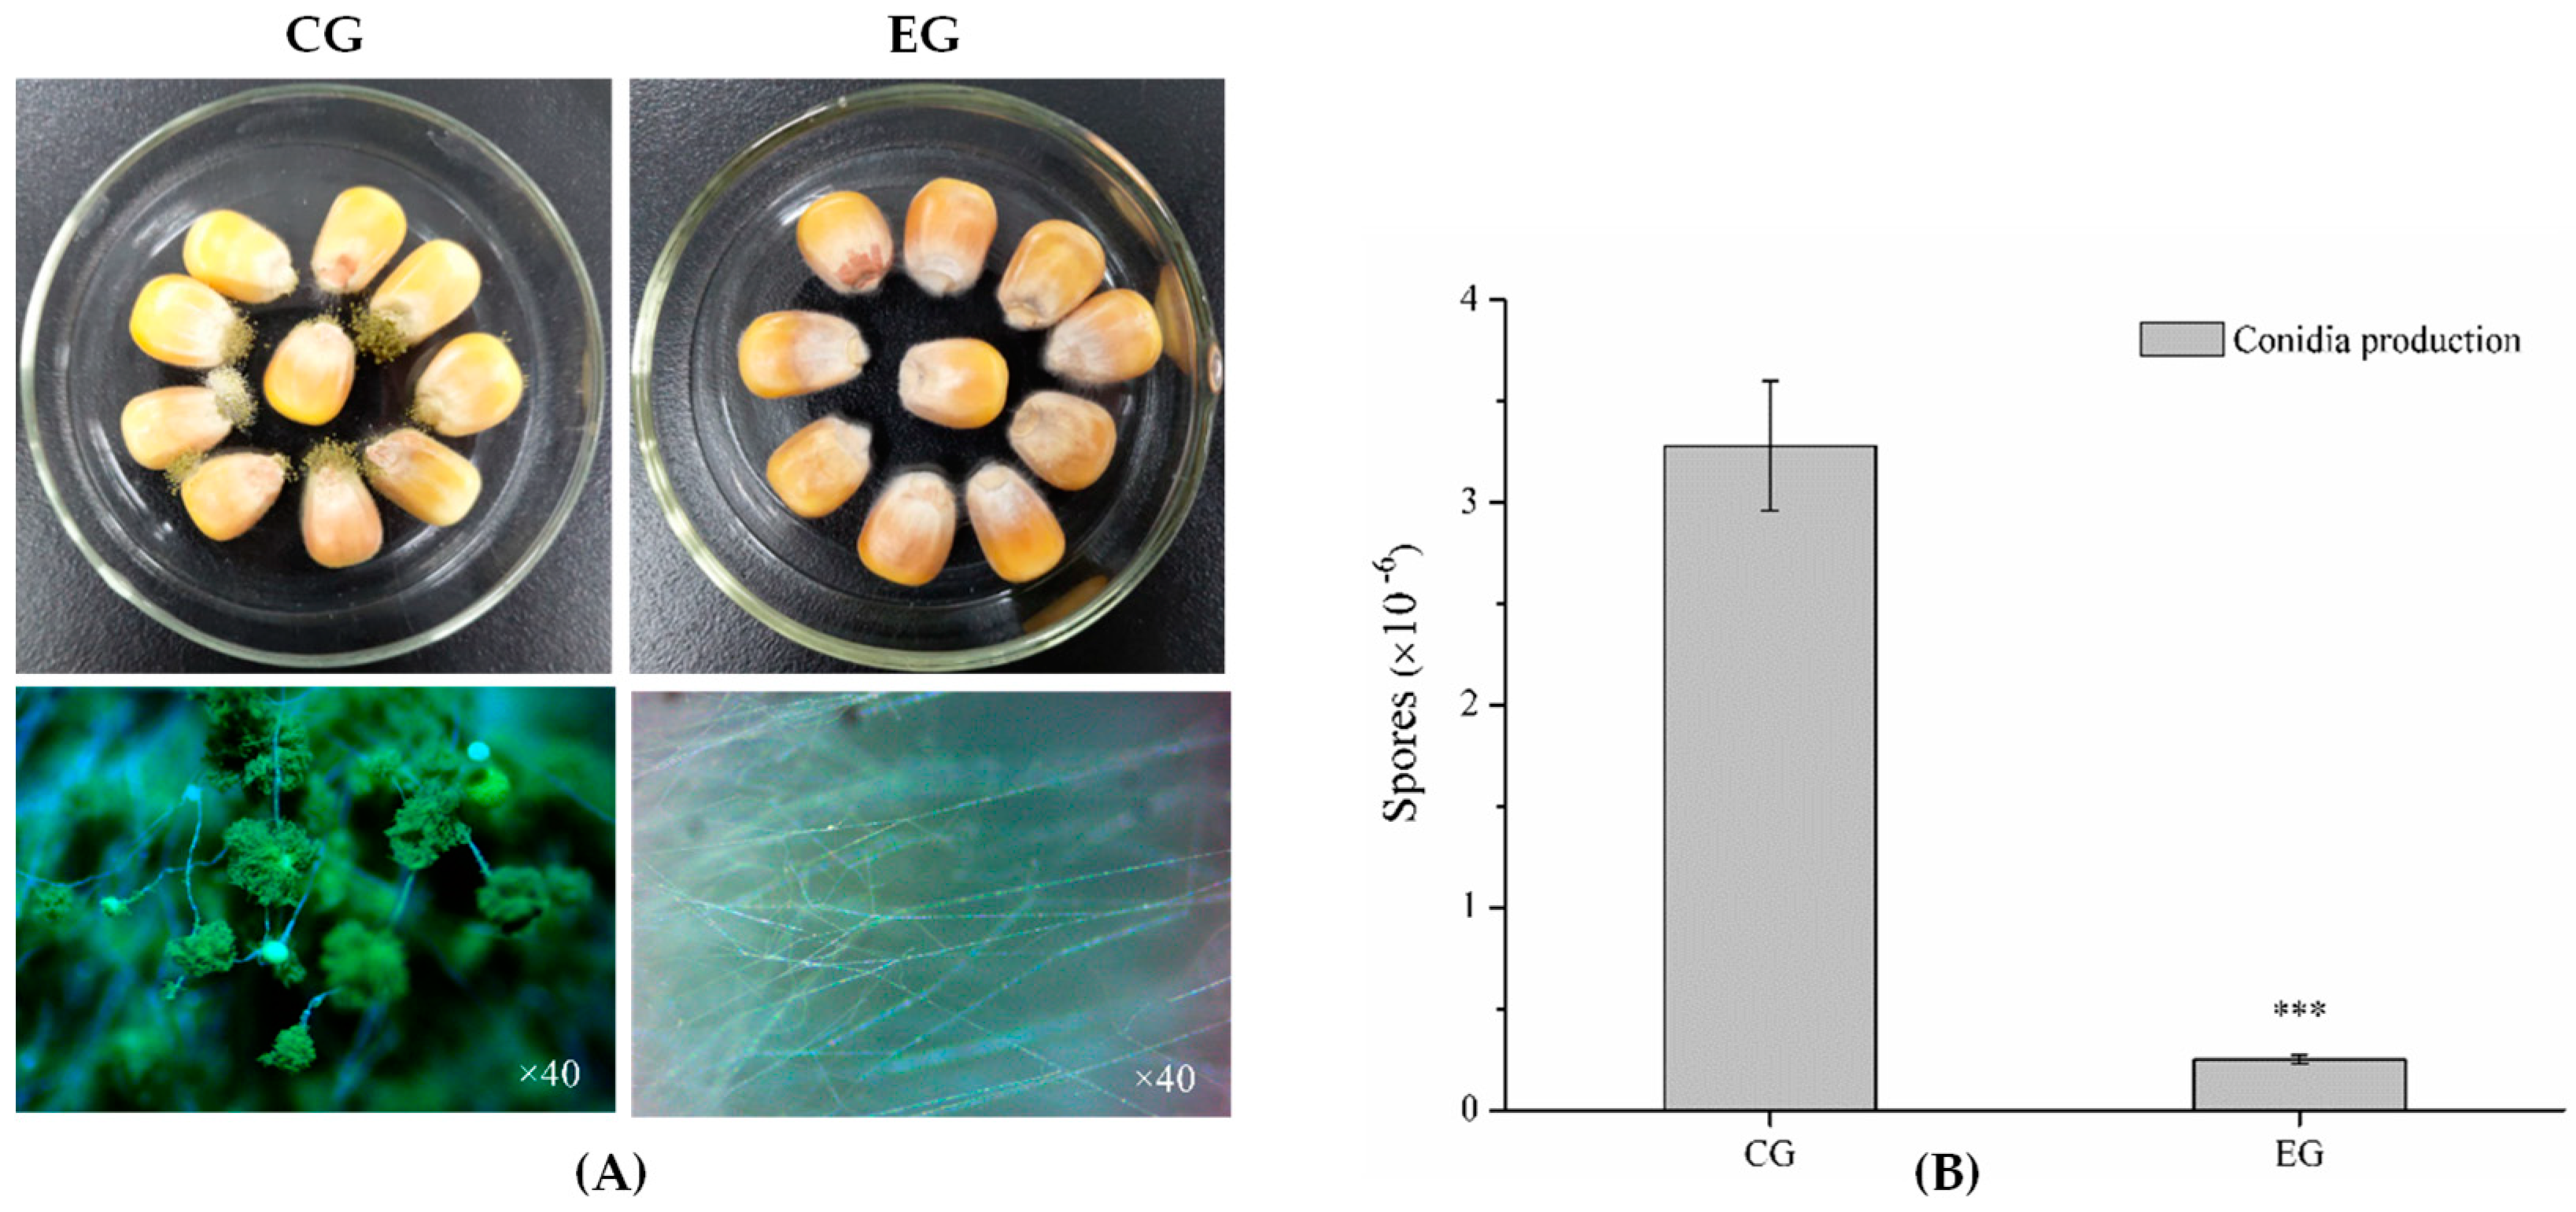
4.4. Virulence of A. flavus in Maize

Undamaged maize kernels were surface sanitized with 0.1% hypochlorite and then rinsed with sterile water three times. The maize kernels inoculated with the conidial suspension (1 × 10⁶ conidia/mL) of A. flavus were placed in a lidless plate, and then 100 μL/L of benzenamine was distributed evenly on the inner surface of the plate in the form of small droplets (0.5 μL). The two dishes were sealed and incubated at 28 °C for five days, after which the fungal colonization of maize kernels was observed on each plate and the colonized kernels were harvested in 100 mL conical flasks with 20 mL of sterile 0.05% Tween 80 water solution. Spores were counted by a hemocytometer.

4.5. Preparation of cDNA Libraries and Illumina Sequencing

The conidial suspension of A. flavus was spread on PDA medium that was overlaid with sterile cellophane and then sequentially exposed to 100 µL/L of benzenamine for five days at 28 °C. The cellophane membrane with mycelia from the whole plate was scraped off with a knife and then immediately frozen in liquid nitrogen for RNA extraction. Total RNA was isolated using Trizol Reagent (Invitrogen Life Technologies, Carlsbad, CA, USA), according to the manufacturer’s instructions. The concentration and quality of RNA for each sample were determined by a NanoDrop 2000 spectrophotometer (Thermo Scientific, Wilmington, DE, USA), and the integrity of RNA was checked using an Agilent 2100 Bioanalyzer (Agilent Technologies, Palo Alto, CA, USA).
The mRNA was enriched from total RNA using poly-T oligo-attached magnetic beads and then cleaved into short fragments using divalent cations under an elevated temperature in an Illumina proprietary fragmentation buffer. The cleaved mRNA fragments were copied into first-strand cDNA using random oligonucleotides and Super Script II, followed by second-strand cDNA synthesis using DNA Polymerase I and RNase H. The remaining overhangs were converted into blunt ends via exonuclease/polymerase activities, and the enzymes were then removed. After adenylation of the 3′ ends of the DNA fragments, Illumina PE adapter oligonucleotides were ligated to prepare for hybridization. The adaptor-modified fragments were purified with the AMPure XP system (Beckman Coulter, Beverly, CA, USA) in order to preferentially select 200 bp in length. DNA fragments with ligated adaptor molecules on both ends were enriched using the Illumina PCR Primer Cocktail in a 15-cycle PCR reaction. The products were purified with the AMPure XP system and then quantified using the Agilent high-sensitivity DNA assay on a Bioanalyzer 2100 system (Agilent Technologies, Palo Alto, CA, USA). The sequencing library was then sequenced with the Hiseq 2500 platform (Illumina, San Diego, CA, USA) by Shanghai Personal Biotechnology Cp. Ltd.

4.6. De Novo Transcriptome Assembly and Annotation

De novo transcriptome analysis was performed according to Diao et al. [94]. Briefly, the quality control analysis on raw data was done by using FastQC (Version 0.11.7, Babraham bioinformatics, Cambridge, UK, 2018). Subsequently, the clean reads were obtained by removing adaptors and low-quality reads with Cutadapt [95]. The clean reads were then assembled de novo using the Trinity platform (http://trinityrnaseq.sourceforge.net/). The longest transcripts of each gene were regarded as unigenes. All of the unigenes were assigned to five databases using BLASTx (E-value ≤ 10−5), including NR (NCBI non-redundant protein sequences), GO (Gene Ontology), KEGG (Kyoto Encyclopedia of Genes and Genome), eggNOG (evolutionary genealogy of genes: Non-supervised Orthologous Groups), and Swiss-Prot.

4.7. Identification and Analysis of DEGs

The levels of gene expression were estimated as normalized FPKM (fragments per kilobase of transcript per million mapped reads) using RSEM (RNA-seq by expectation-maximization) [96]. Differential expression analysis was performed with DESeq (Version 1.20.0, Bioconductor, New York, NY, USA, 2018) and genes with a fold change >2 and corrected p-value < 0.05 were set as the threshold for significantly differential expression. Finally, GO functional annotation and KEGG pathway enrichment analysis were performed to uncover the functions of DEGs.

4.8. qRT-PCR Analysis

To validate the reliability of A. flavus gene expression data obtained by RNA-Seq, qRT-PCR was conducted for 10 genes that were involved in aflatoxin biosynthesis and the global regulatory gene laeA. The primers are listed in Table S5; the β-tubulin gene was selected as the endogenous reference gene. Total RNA extraction was performed as described above, and cDNA was synthesized with a Takara RNA PCR Kit (Takara, Dalian, China). qRT-PCR was performed using an Mx3000p instrument (Stratagene, La Jolla, CA, USA) with a final volume of 20 μL containing 10 μL of SYBR premix ExTaq, 0.5 μL of each forward and reverse primer (10 mM), 2 μL of cDNA template, 0.4 μL of ROX Reference Dye, and 6.6 μL of RNase-free water. The comparative 2−ΔΔCT method was employed to calculate relative gene expression [97].

4.9. Availability of Supporting Data

The raw data that was generated in this study has been deposited in the NCBI’s Sequence Read Archive (SRA) database with the accession number SRP181717 (BioProject ID: PRJNA516725).

4.10. Statistical Analyses

Statistical analyses were performed with SPSS for Windows version 20.0 (SPSS Inc., Chicago, IL, USA, 2011). The data were evaluated by Student’s t-test or one-way ANOVA followed by LSD according to the experimental design. p < 0.05 was considered to be statistically significant.

Supplementary Materials

The following are available online at https://0-www-mdpi-com.brum.beds.ac.uk/2072-6651/11/2/70/s1, Table S1: Statistics on filtering of RNA-Seq Data, Table S2: Summary of transcripts and unigenes in this study, Table S3: Summary of annotation results, Table S4: Summary of differentially expressed genes, Table S5: List of primers used in this study.

Author Contributions

Conceptualization, C.W., L.L. and M.Y.; Performing the experiments, M.Y., S.L. and J.Z.; Data processing, M.Y. and H.L.; Writing and approving the manuscript, M.Y., Q.G., Z.L., S.W. and C.W.

Funding

This research was funded by the Key Technologies R & D Program of Tianjin [Grant number 16YFZCNC00700]; National Natural Science Foundation of China [Grant number 31701668]; Natural Science Foundation of Tianjin City [Grant number 17JCQNJC14300].

Conflicts of Interest

The authors declare no conflict of interest.

References

  1. Peng, Z.; Chen, L.; Zhu, Y.; Huang, Y.; Hu, X.; Wu, Q.; Nussler, A.K.; Liu, L.; Yang, W. Current major degradation methods for aflatoxins: A review. Trends Food Sci. Technol. 2018. [Google Scholar] [CrossRef]
  2. Sangare, L.; Zhao, Y.; Folly, Y.M.E.; Chang, J.; Liu, J.; Xing, F.; Zhou, L.; Wang, Y.; Liu, Y. Aflatoxin B1 degradation by a pseudomonas strain. Toxins 2015, 7, 3538–3539. [Google Scholar] [CrossRef]
  3. Liu, Y.; Wu, F. Global burden of aflatoxin-induced hepatocellular carcinoma: A risk assessment. Environ. Health Persp. 2010, 118, 818–824. [Google Scholar] [CrossRef] [PubMed]
  4. Fountain, J. Resistance to Aspergillus flavus in maize and peanut: Molecular biology, breeding, environmental stress and future perspectives. Crop. J. 2015, 3, 229–237. [Google Scholar] [CrossRef]
  5. Food and Agriculture Organization. FAO Cereal Supply and Demand Brief. 2018. Available online: http://www.fao.org/worldfoodsituation/csdb/en/ (accessed on 6 December 2018).
  6. Food and Agriculture Organization. The State of Food Security and Nutrition in the World 2018; FAO: Rome, Italy, 2018. [Google Scholar]
  7. Cleveland, T.E.; Carter-Wientjes, C.H.; De Lucca, A.J.; Boue, S.M. Effect of soybean volatile compounds on Aspergillus flavus growth and aflatoxin production. J. Food Sci. 2009, 74, 83–87. [Google Scholar] [CrossRef] [PubMed]
  8. De Lucca, A.J.; Carter-Wientjes, C.H.; Boue, S.; Bhatnagar, D. Volatile trans-2-hexenal, a soybean aldehyde, inhibits Aspergillus flavus growth and aflatoxin production in corn. J. Food Sci. 2011, 76, 381–386. [Google Scholar] [CrossRef] [PubMed]
  9. Wright, M.S.; Greene-McDowelle, D.M.; Zeringue, H.J., Jr.; Bhatnagar, D.; Cleveland, T.E. Effects of volatile aldehydes from Aspergillus-resistant varieties of corn on Aspergillus parasiticus growth and aflatoxin biosynthesis. Toxicon 2000, 38, 1215–1223. [Google Scholar] [CrossRef]
  10. Liang, D.; Xing, F.; Selvaraj, J.N.; Liu, X.; Wang, L.; Hua, H.; Liu, Y. Inhibitory effect of cinnamaldehyde, citral, and eugenol on aflatoxin biosynthetic gene expression and aflatoxin B1 biosynthesis in Aspergillus flavus. J. Food Sci. 2015, 80, 2917–2924. [Google Scholar] [CrossRef]
  11. Mercier, J.; Jiménez, J.I. Control of fungal decay of apples and peaches by the biofumigant fungus Muscodor albus. Postharvest Biol. Biotechnol. 2004, 31, 1–8. [Google Scholar] [CrossRef]
  12. Passone, M.A.; Etcheverry, M. Antifungal impact of volatile fractions of Peumus boldus and Lippia turbinata on Aspergillus section Flavi and residual levels of these oils in irradiated peanut. Int. J. Food Microbiol. 2014, 168, 17–23. [Google Scholar] [CrossRef]
  13. Li, Q.; Ning, P.; Zheng, L.; Huang, J.; Li, G.; Hsiang, T. Fumigant activity of volatiles of Streptomyces globisporus JK-1 against Penicillium italicum on Citrus microcarpa. Postharvest Biol. Technol. 2010, 58, 157–165. [Google Scholar] [CrossRef]
  14. Wu, Y.; Yuan, J.; E, Y.; Raza, W.; Shen, Q.; Huang, Q. Effects of volatile organic compounds from Streptomyces albulus NJZJSA2 on growth of two fungal pathogens. J. Basic Microbiol. 2015, 55, 1104–1117. [Google Scholar] [CrossRef]
  15. Yang, M.; Lu, L.; Pang, J.; Hu, Y.; Guo, Q.; Li, Z.; Wu, S.; Liu, H.; Wang, C. Biocontrol activity of volatile organic compounds from Streptomyces alboflavus TD-1 against Aspergillus flavus growth and aflatoxin production. J. Microbiol. Accept.
  16. Payne, G.A.; Nierman, W.C.; Wortman, J.R.; Pritchard, B.L.; Brown, D.; Dean, R.A.; Bhatnagar, D.; Cleveland, T.E.; Machida, M.; Yu, J. Whole genome comparison of Aspergillus flavus and A. oryzae. Med. Mycol. 2006, 44, 9–11. [Google Scholar] [CrossRef] [PubMed]
  17. Yao, G.; Yue, Y.; Fu, Y.; Fang, Z.; Xu, Z.; Ma, G.; Wang, S. Exploration of the regulatory mechanism of secondary metabolism by comparative transcriptomics in Aspergillus flavus. Front. Microbiol. 2018, 9. [Google Scholar] [CrossRef]
  18. Chang, P.K.; Scharfenstein, L.L.; Ehrlich, K.C.; Wei, Q.; Bhatnagar, D.; Ingber, B.F. Effects of laeA deletion on Aspergillus flavus conidial development and hydrophobicity may contribute to loss of aflatoxin production. Fungal. Bio. 2012, 116, 298–307. [Google Scholar] [CrossRef]
  19. Amaike, S.; Keller, N.P. Distinct roles for VeA and LaeA in development and pathogenesis of Aspergillus flavus. Eukaryot. Cell 2009, 8, 1051–1060. [Google Scholar] [CrossRef] [PubMed]
  20. Ozsolak, F.; Milos, P.M. RNA sequencing: Advances, challenges and opportunities. Nat. Rev. Genet. 2011, 12, 87–98. [Google Scholar] [CrossRef] [PubMed]
  21. He, B.; Ma, L.; Hu, Z.; Li, H.; Ai, M.; Long, C.; Zeng, B. Deep sequencing analysis of transcriptomes in Aspergillus oryzae in response to salinity stress. Appl. Microbiol. Biotechnol. 2018, 102, 897–906. [Google Scholar] [CrossRef] [PubMed]
  22. Chang, P.K.; Scharfenstein, L.L.; Mack, B.; Yu, J.; Ehrlich, K.C. Transcriptomic profiles of Aspergillus flavus CA42, a strain that produces small sclerotia, by decanal treatment and after recovery. Fungal Genet. Biol. 2014, 68, 39–47. [Google Scholar] [CrossRef] [PubMed]
  23. Lara-Pezzi, E.; Desco, M.; Gatto, A.; Gómez-Gaviro, M.V. Neurogenesis: Regulation by alternative splicing and related posttranscriptional processes. Neuroscientist 2017, 23, 466–477. [Google Scholar] [CrossRef]
  24. Lee, M.J.; Sheppard, D.C. Recent advances in the understanding of the Aspergillus fumigatus cell wall. J. Microbiol. 2016, 54, 232–242. [Google Scholar] [CrossRef] [PubMed]
  25. Dichtl, K.; Helmschrott, C.; Dirr, F.; Wagener, J. Deciphering cell wall integrity signalling in Aspergillus fumigatus: Identification and functional characterization of cell wall stress sensors and relevant Rho GTPases. Mol. Microbiol. 2012, 83, 506–519. [Google Scholar] [CrossRef] [PubMed]
  26. Henry, C.; Latgé, J.P.; Beauvais, A. α1, 3 glucans are dispensable in Aspergillus fumigatus. Eukaryot. Cell. 2012, 11, 26–29. [Google Scholar] [CrossRef] [PubMed]
  27. Meetei, P.A.; Rathore, R.S.; Prabhu, N.P.; Vindal, V. In silico screening for identification of novel β-1, 3-glucan synthase inhibitors using pharmacophore and 3D-QSAR methodologies. Springerplus 2016, 5, 965. [Google Scholar] [CrossRef] [PubMed]
  28. Henar, M.V.; Durán, A.; Roncero, C. Chitin synthases in yeast and fungi. Exs 1999, 87, 55–69. [Google Scholar]
  29. Wang, Y.; Feng, K.; Yang, H.; Zhang, Z.; Yuan, Y.; Yue, T. Effect of cinnamaldehyde and citral combination on transcriptional profile, growth, oxidative damage and patulin biosynthesis of Penicillium expansum. Front. Microbiol. 2018, 9, 597. [Google Scholar] [CrossRef]
  30. Kitagaki, H.; Wu, H.; Shimoi, H.; Ito, K. Two homologous genes, DCW1 (YKL046c) and DFG5, are essential for cell growth and encode glycosylphosphatidylinositol (GPI)-anchored membrane proteins required for cell wall biogenesis in Saccharomyces cerevisiae. Mol. Microbiol. 2002, 46, 1011–1022. [Google Scholar] [CrossRef]
  31. Parveen, M.; Hasan, M.K.; Takahashi, J.; Murata, Y.; Kitagawa, E.; Kodama, O.; Iwahashi, H. Response of Saccharomyces cerevisiae to a monoterpene: Evaluation of antifungal potential by DNA microarray analysis. J. Antimicrob. Chemother. 2004, 54, 46–55. [Google Scholar] [CrossRef]
  32. Henriques, S.T.; Craik, D.J. Importance of the cell membrane on the mechanism of action of cyclotides. ACS Chem. Biol. 2012, 7, 626–636. [Google Scholar] [CrossRef]
  33. Hu, Z.; He, B.; Ma, L.; Sun, Y.; Niu, Y.; Zeng, B. Recent advances in ergosterol biosynthesis and regulation mechanisms in Saccharomyces cerevisiae. Indian J. Microbiol. 2017, 57, 270–277. [Google Scholar] [CrossRef] [PubMed]
  34. OuYang, Q.; Tao, N.; Jing, G. Transcriptional profiling analysis of Penicillium digitatum, the causal agent of citrus green mold, unravels an inhibited ergosterol biosynthesis pathway in response to citral. BMC Genom. 2016, 17, 599. [Google Scholar] [CrossRef] [PubMed]
  35. Malik, P.; Chaudhry, N.; S. Kitawat, B.; Kumar, R.; K. Mukherjee, T. Relationship of azole resistance with the structural alteration of the target sites: Novel synthetic compounds for better antifungal activities. Nat. Prod. J. 2014, 4, 131–139. [Google Scholar] [CrossRef]
  36. Klug, L.; Daum, G. Yeast lipid metabolism at a glance. FEMS Yeast Res. 2014, 14, 369–388. [Google Scholar] [CrossRef] [PubMed] [Green Version]
  37. Wu, M.Y.; Mead, M.E.; Kim, S.C.; Rokas, A.; Yu, J.H. WetA bridges cellular and chemical development in Aspergillus flavus. PLoS ONE 2017, 12, e0179571. [Google Scholar] [CrossRef] [PubMed]
  38. Wu, M.Y.; Mead, M.E.; Lee, M.K.; Loss, E.M.O.; Kim, S.C.; Rokas, A.; Yu, J.H. Systematic dissection of the evolutionarily conserved WetA developmental regulator across a genus of Filamentous Fungi. mBio 2018, 9, e01130-18. [Google Scholar] [CrossRef]
  39. Valsecchi, I.; Dupres, V.; Stephen-Victor, E.; Guijarro, J.I.; Gibbons, J.; Beau, R.; Bayry, J.; Coppee, J.Y.; Lafont, F.; Latge, J.P.; et al. Role of Hydrophobins in Aspergillus fumigatus. J. Fungi 2017, 4, 2. [Google Scholar] [CrossRef]
  40. Lv, Y.; Lv, A.; Zhai, H.; Zhang, S.; Li, L.; Cai, J.; Hu, Y. Insight into the global regulation of laeA in Aspergillus flavus based on proteomic profiling. Int. J. Food Microbiol. 2018, 284, 11–21. [Google Scholar] [CrossRef]
  41. 43 Cary, J.W.; Han, Z.; Yin, Y.; Lohmar, J.M.; Shantappa, S.; Harris-Coward, P.Y.; Mack, B.; Ehrlich, K.C.; Wei, Q.; Arroyo-Manzanares, N.; et al. Transcriptome analysis of Aspergillus flavus reveals veA-dependent regulation of secondary metabolite gene clusters, including the novel aflavarin cluster. Eukaryot. Cell 2015, 14, 983–997. [Google Scholar] [CrossRef]
  42. Bayram, O.; Krappmann, S.; Ni, M.; Bok, J.W.; Helmstaedt, K.; Valerius, O.; Braus-Stromeyer, S.; Kwon, N.J.; Keller, N.P.; Yu, J.H.; et al. VelB/VeA/LaeA complex coordinates light signal with fungal development and secondary metabolism. Science 2008, 320, 1504–1506. [Google Scholar] [CrossRef]
  43. Kale, S.P.; Milde, L.; Trapp, M.K.; Frisvad, J.C.; Keller, N.P.; Bok, J.W. Requirement of LaeA for secondary metabolism and sclerotial production in Aspergillus flavus. Fungal Genet. Biol. 2008, 45, 1422–1429. [Google Scholar] [CrossRef] [PubMed]
  44. Gacem, M.A.; El Hadj-Khelil, A.O. Toxicology, biosynthesis, bio-control of aflatoxin and new methods of detection. Asian Pac. J. Trop Biomed. 2016, 6, 808–814. [Google Scholar] [CrossRef] [Green Version]
  45. Theumer, M.G.; Henneb, Y.; Khoury, L.; Snini, S.P.; Tadrist, S.; Canlet, C.; Puel, O.; Oswald, I.P.; Audebert, M. Genotoxicity of aflatoxins and their precursors in human cells. Toxicol. Lett. 2018, 287, 100–107. [Google Scholar] [CrossRef] [PubMed]
  46. Bennett, J.W.; Lee, L.S.; Vinnett, C. The correlation of aflatoxin and norsolorinic acid production. J. Am. Oil Chem. Soc. 1971, 48, 368. [Google Scholar] [CrossRef]
  47. Yu, J. Current understanding on aflatoxin biosynthesis and future perspective in reducing aflatoxin contamination. Toxins 2012, 4, 1024–1057. [Google Scholar] [CrossRef] [PubMed]
  48. Trail, F.; Chang, P.K.; Cary, J.; Linz, J.E. Structural and functional analysis of the nor-1 gene involved in the biosynthesis of aflatoxins by Aspergillus parasiticus. Appl. Environ. Microb. 1994, 60, 4078–4085. [Google Scholar] [CrossRef]
  49. Zhang, F.; Zhong, H.; Han, X.; Guo, Z.; Yang, W.; Liu, Y.; Yang, K.; Zhuang, Z.; Wang, S. Proteomic profile of Aspergillus flavus in response to water activity. Fungal Biol. 2015, 119, 114–124. [Google Scholar] [CrossRef] [PubMed]
  50. Zhang, F.; Guo, Z.; Zhong, H.; Wang, S.; Yang, W.; Liu, Y.; Wang, S. RNA-Seq-based transcriptome analysis of aflatoxigenic Aspergillus flavus in response to water activity. Toxins 2014, 6, 3187–3207. [Google Scholar] [CrossRef] [PubMed]
  51. Chang, P.K.; Yu, J.; Yu, J.H. aflT, a MFS transporter-encoding gene located in the aflatoxin gene cluster, does not have a significant role in aflatoxin secretion. Fungal Genet. Biol. 2004, 41, 911–920. [Google Scholar] [CrossRef] [PubMed]
  52. Ehrlich, K.C.; Montalbano, B.G.; Cary, J.W. Binding of the C6-zinc cluster protein, AFLR, to the promoters of aflatoxin pathway biosynthesis genes in Aspergillus parasiticus. Gene 1999, 230, 249–257. [Google Scholar] [CrossRef]
  53. Wang, B.; Han, X.; Bai, Y.; Lin, Z.; Qiu, M.; Nie, X.; Wang, S.; Zhang, F.; Zhuang, Z.; Yuan, J.; et al. Effects of nitrogen metabolism on growth and aflatoxin biosynthesis in Aspergillus flavus. J. Hazard. Mater. 2017, 324, 691–700. [Google Scholar] [CrossRef] [PubMed]
  54. Fasoyin, O.E.; Wang, B.; Qiu, M.; Han, X.; Chung, K.R.; Wang, S. Carbon catabolite repression gene creA regulates morphology, aflatoxin biosynthesis and virulence in Aspergillus flavus. Fungal Genet. Biol. 2018, 115, 41–51. [Google Scholar] [CrossRef] [PubMed]
  55. OBrian, G.R.; Fakhoury, A.M.; Payne, G.A. Identification of genes differentially expressed during aflatoxin biosynthesis in Aspergillus flavus and Aspergillus parasiticus. Fungal Genet. Biol. 2003, 39, 118–127. [Google Scholar] [CrossRef]
  56. Adnan, M.; Zheng, W.; Islam, W.; Arif, M.; Abubakar, Y.; Wang, Z.; Lu, G. Carbon catabolite repression in filamentous fungi. Int. J. Mol. Sci. 2017, 19, 48. [Google Scholar] [CrossRef] [PubMed]
  57. Ries, L.N.; Beattie, S.R.; Espeso, E.A.; Cramer, R.A.; Goldman, G.H. Diverse regulation of the CreA carbon catabolite repressor in Aspergillus nidulans. Genetics 2016, 203, 335–352. [Google Scholar] [CrossRef] [PubMed]
  58. Alam, M.A.; Kelly, J.M. Proteins interacting with CreA and CreB in the carbon catabolite repression network in Aspergillus nidulans. Curr. Genet. 2017, 63, 669–683. [Google Scholar] [CrossRef] [PubMed]
  59. Beattie, S.R.; Mark, K.M.; Thammahong, A.; Ries, L.N.A.; Dhingra, S.; Caffrey-Carr, A.K.; Cheng, C.; Black, C.C.; Bowyer, P.; Bromley, M.J.; et al. Filamentous fungal carbon catabolite repression supports metabolic plasticity and stress responses essential for disease progression. PLoS Pathog. 2017, 13, e1006340. [Google Scholar] [CrossRef]
  60. Cubero, B.; Scazzocchio, C. Two different, adjacent and divergent zinc finger binding sites are necessary for CREA-mediated carbon catabolite repression in the proline gene cluster of Aspergillus nidulans. EMBO J. 1994, 13, 407–415. [Google Scholar] [CrossRef]
  61. Zhao, X.; Zhi, Q.Q.; Li, J.Y.; Keller, N.; He, Z.M. The antioxidant gallic acid inhibits aflatoxin formation in Aspergillus flavus by modulating transcription factors FarB and CreA. Toxins 2018, 10, 270. [Google Scholar] [CrossRef]
  62. Georgianna, D.R.; Payne, G.A. Genetic regulation of aflatoxin biosynthesis: From gene to genome. Fungal Genet. Biol. 2009, 46, 113–125. [Google Scholar] [CrossRef]
  63. Tudzynski, B. Nitrogen regulation of fungal secondary metabolism in fungi. Front. Microbiol. 2014, 5, 656. [Google Scholar] [CrossRef] [PubMed]
  64. Wilkinson, J.R.; Yu, J.; Bland, J.M.; Nierman, W.C.; Bhatnagar, D.; Cleveland, T.E. Amino acid supplementation reveals differential regulation of aflatoxin biosynthesis in Aspergillus flavus NRRL 3357 and Aspergillus parasiticus SRRC 143. Appl. Microbiol. Biotechnol. 2007, 74, 1308–1319. [Google Scholar] [CrossRef]
  65. Şenyuva, H.Z.; Gilbert, J.; Öztürkoǧlu, S.; Özcan, S.; Gürel, N. Changes in free amino acid and sugar levels of dried figs during aflatoxin B1 production by Aspergillus flavus and Aspergillus parasiticus. J. Agric. Food Chem. 2008, 56, 9661–9666. [Google Scholar] [CrossRef] [PubMed]
  66. Narendja, F.; Goller, S.P.; Wolschek, M.; Strauss, J. Nitrate and the GATA factor AreA are necessary for in vivo binding of NirA, the pathway-specific transcriptional activator of Aspergillus nidulans. Mol. Microbiol. 2002, 44, 573–583. [Google Scholar] [CrossRef] [PubMed]
  67. Han, X.; Qiu, M.; Wang, B.; Yin, W.B.; Nie, X.; Qin, Q.; Ren, S.; Yang, K.; Zhang, F.; Zhuang, Z.; et al. Functional analysis of the nitrogen metabolite repression regulator gene nmrA in Aspergillus flavus. Front. Microbiol. 2016, 7, 1794. [Google Scholar] [CrossRef] [PubMed]
  68. Chanda, A.; Roze, L.V.; Kang, S.; Artymovich, K.A.; Hicks, G.R.; Raikhel, N.V.; Calvo, A.M.; Linz, J.E. A key role for vesicles in fungal secondary metabolism. Proc. Natl. Acad. Sci. USA 2009, 106, 19533–19538. [Google Scholar] [CrossRef] [PubMed] [Green Version]
  69. Fillinger, S.; Chaveroche, M.K.; Shimizu, K.; Keller, N.; Enfert, C. cAMP and ras signalling independently control spore germination in the filamentous fungus Aspergillus nidulans. Mol. Microbiol. 2002, 44, 1001–1016. [Google Scholar] [CrossRef]
  70. Xue, C.; Hsueh, Y.P.; Chen, L.; Heitman, J. The RGS protein Crg2 regulates both pheromone and cAMP signalling in Cryptococcus neoformans. Mol. Microbiol. 2008, 70, 379–395. [Google Scholar] [CrossRef]
  71. Choi, Y.E.; Xu, J.R. The cAMP signaling pathway in Fusarium verticillioides is important for conidiation, plant infection, and stress responses but not fumonisin production. Mol. Plant-Microbe Interact. 2010, 23, 522–533. [Google Scholar] [CrossRef]
  72. Zhang, H.; Liu, K.; Zhang, X.; Tang, W.; Wang, J.; Guo, M.; Zhao, Q.; Zheng, X.; Wang, P.; Zhang, Z. Two phosphodiesterase genes, PDEL and PDEH, regulate development and pathogenicity by modulating intracellular cyclic AMP levels in Magnaporthe oryzae. PLoS ONE 2011, 6, e17241. [Google Scholar] [CrossRef]
  73. Jiang, C.; Zhang, C.; Wu, C.; Sun, P.; Hou, R.; Liu, H.; Wang, C.; Xu, J.R. TRI6 and TRI10 play different roles in the regulation of deoxynivalenol (DON) production by cAMP signalling in Fusarium graminearum. Environ. Microbiol. 2016, 18, 3689–3701. [Google Scholar] [CrossRef] [PubMed]
  74. Hu, S.; Zhou, X.; Gu, X.; Cao, S.; Wang, C.; Xu, J.R. The cAMP-PKA pathway regulates growth, sexual and asexual differentiation, and pathogenesis in Fusarium graminearum. Mol. Plant-Microbe Interact. 2014, 27, 557–566. [Google Scholar] [CrossRef] [PubMed]
  75. Liu, Y.; Yang, K.; Qin, Q.; Lin, G.; Hu, T.; Xu, Z.; Wang, S. G protein α subunit GpaB is required for asexual development, aflatoxin biosynthesis and pathogenicity by regulating cAMP signaling in Aspergillus flavus. Toxins 2018, 10, 117. [Google Scholar] [CrossRef]
  76. Yang, K.; Qin, Q.; Liu, Y.; Zhang, L.; Liang, L.; Lan, H.; Chen, C.; You, Y.; Zhang, F.; Wang, S. Adenylate cyclase AcyA regulates development, aflatoxin biosynthesis and fungal virulence in Aspergillus flavus. Front. Cell Infect. Microbiol. 2016, 6, 190. [Google Scholar] [CrossRef] [PubMed]
  77. Chen, Z.Y.; Brown, R.L.; Damann, K.E.; Cleveland, T.E. Characterization of an alkaline protease excreted by Aspergillus flavus and its function in fungal infection of corn kernels. Phytopathology 1999, 89, S15. [Google Scholar]
  78. Luo, M.; Brown, R.L.; Chen, Z.Y.; Cleveland, T.E. Host genes involved in the interaction between Aspergillus flavus and maize. Toxin Rev. 2009, 28, 118–128. [Google Scholar] [CrossRef]
  79. Mellon, J.E.; Cotty, P.J.; Dowd, M.K. Aspergillus flavus hydrolases: Their roles in pathogenesis and substrate utilization. Appl. Microbiol. Biotechnol. 2007, 77, 497–504. [Google Scholar] [CrossRef]
  80. Amaike, S.; Keller, N.P. Aspergillus flavus. Annu. Rev. Phytopathol. 2011, 49, 107–133. [Google Scholar] [CrossRef]
  81. Rementeria, A.; Lopez-Molina, N.; Ludwig, A.; Vivanco, A.B.; Bikandi, J.; Pontpon, J.; Garaizar, J. Genes and molecules involved in Aspergillus fumigatus virulence. Rev. Iberoam. Micol. 2005, 22, 1–23. [Google Scholar] [CrossRef]
  82. Valiante, V.; Macheleidt, J.; Föge, M.; Brakhage, A.A. The Aspergillus fumigatus cell wall integrity signaling pathway: Drug target, compensatory pathways, and virulence. Front. Microbiol. 2015, 6, 325. [Google Scholar] [CrossRef]
  83. Mah, J.H.; Yu, J.H. Upstream and downstream regulation of asexual development in Aspergillus fumigatus. Eukaryot. Cell 2006, 5, 1585–1595. [Google Scholar] [CrossRef]
  84. Lamarre, C.; Sokol, S.; Debeaupuis, J.P.; Henry, C.; Lacroix, C.; Glaser, P.; Coppee, J.Y.; Francois, J.M.; Latge, J.P. Transcriptomic analysis of the exit from dormancy of Aspergillus fumigatus conidia. BMC Genom. 2008, 9, 417. [Google Scholar] [CrossRef] [PubMed]
  85. Novodvorska, M.; Stratford, M.; Blythe, M.J.; Wilson, R.; Beniston, R.G.; Archer, D.B. Metabolic activity in dormant conidia of Aspergillus niger and developmental changes during conidial outgrowth. Fungal Genet. Biol. 2016, 94, 23–31. [Google Scholar] [CrossRef] [PubMed]
  86. Shankar, J.; Tiwari, S.; Shishodia, S.K.; Gangwar, M.; Hoda, S.; Thakur, R.; Vijayaraghavan, P. Molecular insights into development and virulence determinants of Aspergilli: A proteomic perspective. Front. Cell. Infect. Microbiol. 2018, 8. [Google Scholar] [CrossRef] [PubMed]
  87. Aimanianda, V.; Bayry, J.; Bozza, S.; Kniemeyer, O.; Perruccio, K.; Elluru, S.R.; Clavaud, C.; Paris, S.; Brakhage, A.A.; Kaveri, S.V.; et al. Surface hydrophobin prevents immune recognition of airborne fungal spores. Nature 2009, 460, 1117–1121. [Google Scholar] [CrossRef] [PubMed]
  88. Dagenais, T.R.; Giles, S.S.; Aimanianda, V.; Latgé, J.P.; Hull, C.M.; Keller, N.P. Aspergillus fumigatus LaeA-mediated phagocytosis is associated with a decreased hydrophobin layer. Infect. Immun. 2010, 78, 823–829. [Google Scholar] [CrossRef]
  89. D’Souza, C.A.; Heitman, J. Conserved cAMP signaling cascades regulate fungal development and virulence. Fems Microbiol. Rev. 2001, 25, 349–364. [Google Scholar] [CrossRef] [Green Version]
  90. Lee, N.; D’Souza, C.A.; Kronstad, J.W. Of smuts, blasts, mildews, and blights: cAMP signaling in phytopathogenic fungi. Annu. Rev. Phytopathol. 2003, 41, 399–427. [Google Scholar] [CrossRef]
  91. Krijgsheld, P.; Bleichrodt, R.V.; Van Veluw, G.J.; Wang, F.; Müller, W.H.; Dijksterhuis, J.; Wösten, H.A.B. Development in Aspergillus. Stud. Mycol. 2013, 74, 1–29. [Google Scholar] [CrossRef]
  92. Li, H.X.; Xiao, C.L. Characterization of fludioxonil-resistant and pyrimethanil-resistant phenotypes of Penicillium expansum from apple. Phytopathology 2008, 98, 427–435. [Google Scholar] [CrossRef]
  93. Bavaro, S.L.; D’Antuono, I.; Cozzi, G.; Haidukowski, M.; Cardinali, A.; Logrieco, A.F. Inhibition of aflatoxin B1 production by verbascoside and other olive polyphenols. World Mycotoxin. J. 2016, 9, 545–553. [Google Scholar] [CrossRef]
  94. Diao, J.; Liu, H.; Hu, F.; Li, L.; Wang, X.; Gai, C.; Yu, X.; Fan, Y.; Xu, L.; Ye, H. Transcriptome analysis of immune response in fat greenling (Hexagrammos otakii) against Vibrio harveyi infection. Fish Shellfish Immunol. 2018. [Google Scholar] [CrossRef] [PubMed]
  95. Martin, M. Cutadapt removes adapter sequences from high-throughput sequencing reads. EMBnet. J. 2011, 17, 10–12. [Google Scholar] [CrossRef]
  96. Zhu, Y.; Xu, J.; Sun, C.; Zhou, S.; Xu, H.; Nelson, D.R.; Qian, J.; Song, J.; Luo, H.; Xiang, L.; et al. Chromosome-level genome map provides insights into diverse defense mechanisms in the medicinal fungus Ganoderma sinense. Sci. Rep. 2015, 5, 11087. [Google Scholar] [CrossRef] [PubMed]
  97. Livak, K.J.; Schmittgen, T.D. Analysis of relative gene expression data using real-time quantitative PCR and the 2-ΔΔCT method. Methods 2001, 25, 402–408. [Google Scholar] [CrossRef] [PubMed]
Figure 1. Effects of benzenamine on the hyphal growth and spore germination of Aspergillus flavus. The applied concentrations of benzenamine were 25, 50, 100, 200, and 400 µL/L. Results are presented as the mean ± SD.
Toxins 11 00070 g001
Figure 2. Effects of 100 µL/L of benzenamine on aflatoxin production. (A) Morphological characterization of Aspergillus flavus in the absence (CG) and presence (EG) of benzenamine. (B) Aflatoxin B1 accumulation by Aspergillus flavus in the absence (CG) and presence (EG) of benzenamine. The results are presented as mean ± SD. Asterisks indicate a significant difference between groups (*** p < 0.001), N. D. denotes not detected (<0.03 ng/g).
Toxins 11 00070 g002
Figure 3. Effects of 100 µL/L of benzenamine on Aspergillus flavus infection in maize. (A) CG: maize inoculated with Aspergillus flavus at five days post-inoculation; EG: maize inoculated with Aspergillus flavus exposed to benzenamine for five days. (B) The production of Aspergillus flavus conidia on maize in CG and EG. Results are presented as the mean ± SD. Asterisks indicate a significant difference between groups (*** p < 0.001).
Toxins 11 00070 g003
Figure 4. Number of genes showed up-regulated and down-regulated expression in experimental group (EG) vs. control group (CG).
Toxins 11 00070 g004
Figure 5. Gene Ontology (GO) functional classification and Kyoto Encyclopedia of Genes and Genome (KEGG) pathway enrichment of differentially expressed genes when Aspergillus flavus was treated with benzenamine. (A) Functional categories at three developmental stages based on GO enrichment analysis of differentially expressed genes (DEGs), and the asterisk means significant enrichment (* corrected p-value <0.05). (B) KEGG pathway enrichment analysis of DEGs.
Toxins 11 00070 g005aToxins 11 00070 g005b
Figure 6. Quantitative real-time PCR validation of aflatoxin biosynthesis genes and laeA after treatment with benzenamine. CG, control group; EG, experimental group. Results are presented as mean ± SD. Log2 (EG/CG) ≤ −1 indicates downregulated expression.
Toxins 11 00070 g006
Figure 7. A schematic diagram for the proposed mechanism of benzenamine against Aspergillus flavus.
Toxins 11 00070 g007
Table 1. Transcript abundance of genes involved in Aspergillus flavus development.
Gene IDGene NameLog2
(EG/CG) *
p-ValueFunction
Cell wall
TRINITY_DN6715_c0_g1crh11−3.988.95 × 10−8cell wall glucanase
TRINITY_DN10780_c1_g3ags1−2.241.53 × 10−5Alpha-1,3-glucan synthase
TRINITY_DN17727_c0_g1fks1−1.388.42 × 10−3beta-1,3 -glucan synthase
TRINITY_DN9747_c0_g1rho21.422.71 × 10−4GTP-binding protein
TRINITY_DN9087_c0_g1rho41.315.24 × 10−3GTP-binding protein
TRINITY_DN11443_c2_g2cfmA−1.513.20 × 10−4GPI-anchored CFEM domain protein A
TRINITY_DN11909_c4_g1afuA−1.752.47 × 10−3GPI-anchored membrane protein
TRINITY_DN9375_c0_g1chs6−1.021.65 × 10−3Chitin synthase
TRINITY_DN10195_c0_g1chs8−1.311.13 × 10−3Chitin synthase
Cell membrane
TRINITY_DN8232_c0_g1erg33.581.91 × 10−2C-5 sterol desaturase
TRINITY_DN10457_c0_g1erg4−2.878.85 × 10−6C6 transcription factor
TRINITY_DN7343_c0_g1erg5−1.805.19 × 10−3Cytochrome P450
TRINITY_DN6009_c0_g1erg6−1.234.12 × 10−224-C-methyltransferase
TRINITY_DN9690_c0_g1erg7−6.366.64 × 10−21Lanosterol synthase
TRINITY_DN11958_c0_g2erg13−1.342.89 × 10−2Hydroxymethylglutaryl-CoA synthase
TRINITY_DN10380_c0_g1erg25−1.641.37 × 10−2Methylsterol monooxygenase
TRINITY_DN15242_c0_g1erg26−1.591.48 × 10−3Sterol-4-alpha-carboxylate 3-dehydrogenase
Conidia
TRINITY_DN11281_c0_g1brlA−1.278.69 × 10−4C2H2 type master regulator of conidiophore development
TRINITY_DN11770_c0_g1wetA−3.991.85 × 10−21developmental regulatory protein
TRINITY_DN9659_c0_g1abaA−3.171.23 × 10−12Conidiophore development regulator
TRINITY_DN11518_c0_g4rodA−9.106.30 × 10−19Conidial hydrophobin
TRINITY_DN15172_c0_g1rodB−6.944.97 × 10−23Conidial hydrophobin
TRINITY_DN11879_c4_g1stuA−1.547.43 × 10−6Cell pattern formation-associated protein
Transcription regulator
TRINITY_DN9345_c0_g1laeA−1.825.63 × 10−5Secondary metabolism regulator
TRINITY_DN11910_c4_g1veA1.422.68 × 10−3Developmental and secondary metabolism regulator
TRINITY_DN8021_c0_g1fig1−2.594.64 × 10−3Ca2+ regulator and membrane fusion protein
TRINITY_DN10388_c0_g1sebA−2.442.36 × 10−4C2H2 finger domain transcription factor
TRINITY_DN12068_c7_g5mtfA1.062.65 × 10−2C2H2 finger domain transcription factor
TRINITY_DN12136_c0_g2hir3−1.571.24 × 10−3Histone transcription regulator
Developmental signal
TRINITY_DN7900_c0_g1fluG−2.253.28 × 10−5Extracellular developmental signal biosynthesis protein
Apoptosis
TRINITY_DN12180_c5_g1cycA2.335.30 × 10−5Cytochrome c
G-protein
TRINITY_DN10123_c0_g1gblP−1.901.37 × 10−6Nucleotide-binding protein subunit beta-like protein
TRINITY_DN9739_c0_g1gna12−2.162.48 × 10−6G-protein alpha subunit
(*): CG, control group; EG, experimental group. Log2 (EG/CG) ≥1 indicate up-regulated expression and Log2 (EG/CG) ≤−1 indicate down-regulated expression.
Table 2. Transcript abundance of genes that are involved in aflatoxin biosynthesis.
Gene IDGene NameLog2
(EG/CG) *
p-ValueFunction
Aflatoxin biosynthesis
TRINITY_DN9945_c0_g1aflA−3.425.80 × 10−10Fatty acid synthase alpha subunit
TRINITY_DN6952_c0_g1aflB−3.324.61 × 10−2Fatty acid synthase subunit beta
TRINITY_DN61_c0_g1aflD−4.962.64 × 10−8Norsolorinic acid ketoreductase
TRINITY_DN12173_c2_g2aflF−1.654.36 × 10−2Norsolorinic acid ketoreductase
TRINITY_DN10698_c0_g2aflO−1.835.63 × 10−3O-methyltransferase
TRINITY_DN10938_c0_g1aflQ−1.492.16 × 10−4Oxidoreductase
TRINITY_DN10167_c0_g1aflR−1.861.68 × 10−2Aflatoxin biosynthesis regulatory protein
TRINITY_DN9418_c0_g1aflT−2.724.27 × 10−2Transmembrane protein
TRINITY_DN399_c0_g1aflU−3.242.31 × 10−8P450 monooxygenase
TRINITY_DN10373_c0_g1aflW−1.601.37 × 10−2FAD-binding monooxygenase
Carbon metabolism
TRINITY_DN7925_c1_g1creA−1.149.62 × 10−5DNA-binding protein
TRINITY_DN10031_c0_g1mexAM1.551.84 × 10−2Oxidoreductase
TRINITY_DN10394_c0_g1pot11.901.45 × 10−6Acetyl-CoA C-acyltransferase
TRINITY_DN11110_c0_g1rntA1.885.21 × 10−6Guanyl-specific ribonuclease
TRINITY_DN11497_c0_g1ppoA−1.837.67 × 10−6Linoleate 8R-dioxygenase like protein
TRINITY_DN12116_c3_g3ppoC−2.799.25 × 10−4Fatty acid oxygenase
Nitrogen metabolism
TRINITY_DN5952_c0_g1nmrAL1−1.602.14 × 10−4NmrA-like family domain-containing protein 1
TRINITY_DN11972_c8_g2gdh-1−2.421.52 × 10−9Specific glutamate dehydrogenase
TRINITY_DN11667_c1_g3glt1−2.404.57 × 10−5Putative glutamate synthase
TRINITY_DN11707_c0_g1niiA−1.734.23 × 10−8Nitrite reductase
TRINITY_DN10046_c0_g1nirA−1.932.28 × 10−4Nitrogen assimilation transcription factor
TRINITY_DN13321_c0_g1ddc1.361.02 × 10−2Aromatic-L-amino-acid decarboxylase
TRINITY_DN9125_c0_g1aat2−3.661.66 × 10−2Aspartate aminotransferase
TRINITY_DN19445_c0_g1melO−3.408.11 × 10−8Tyrosinase
TRINITY_DN10664_c0_g1orsC−1.064.78 × 10−2Tyrosinase-like protein
TRINITY_DN11859_c0_g1gad1−4.381.27 × 10−27Glutamate decarboxylase
TRINITY_DN11916_c1_g2gfa1−1.462.29 × 10−4Glutamine--fructose-6-phosphate aminotransferase
TRINITY_DN12169_c4_g1sch91.862.72 × 10−4Serine/threonine-protein kinase
Purine metabolism
TRINITY_DN12187_c1_g2ade17−1.586.35 × 10−5Bifunctional purine biosynthesis protein
TRINITY_DN8936_c0_g1uaY−3.712.76 × 10−4Positive regulator of purine utilization
TRINITY_DN9209_c0_g1uapC−3.111.58 × 10−9Purine permease
TRINITY_DN9614_c0_g1fcy2−2.363.47 × 10−4Purine-cytosine permease
TRINITY_DN10376_c0_g2pol12−2.283.34 × 10−2DNA polymerase alpha subunit B
TRINITY_DN8807_c0_g1hxA−1.162.02 × 10−3Xanthine dehydrogenase
cAMP signaling pathway
TRINITY_DN10852_c0_g2ATP12A−2.108.03 × 10−3ATPase alpha 1 subunit
TRINITY_DN11913_c3_g2pld1−1.558.45 × 10−5Phospholipase D1
TRINITY_DN11065_c0_g2pka-C3−1.021.11 × 10−2cAMP-dependent protein kinase
(*): CG, control group; EG, experimental group. Log2 (EG/CG) ≥ 1 indicate up-regulated expression and Log2 (EG/CG) ≤ −1 indicate down-regulated expression.
Table 3. Transcript abundance of genes that are involved in virulence of Aspergillus flavus.
Gene IDGene NameLog2
(EG/CG) *
p-ValueFunction
Hydrolase
TRINITY_DN11687_c2_g1mal1−3.396.39 × 10−10Alpha-glucosidase
TRINITY_DN18434_c0_g1mal2−2.862.02 × 10−3Alpha-glucosidase
TRINITY_DN9284_c0_g1agdC−2.165.88 × 10−6Alpha -glucosidase
TRINITY_DN4002_c0_g1lip−3.412.15 × 10−3Lipase
TRINITY_DN11096_c0_g3NPII−7.812.84 × 10−61Neutral protease
TRINITY_DN10289_c0_g1ctf1B−2.772.89 × 10−2Cutinase transcription factor 1 beta
TRINITY_DN11791_c0_g4ctf1A−1.594.29 × 10−2Cutinase transcription factor 1 alpha
TRINITY_DN8062_c0_g1abfA−2.712.69 × 10−3Alpha-L-arabinofuranosidase A
TRINITY_DN12177_c2_g1dvrA1.031.97 × 10−2C2H2 finger domain transcription factor
(*): CG, control group; EG, experimental group. Log2 (EG/CG) ≥1 indicate up-regulated expression and Log2 (EG/CG) ≤−1 indicate down-regulated expression.

