Quercetin Inhibits the Proliferation and Aflatoxins Biosynthesis of Aspergillus flavus

1
Key Laboratory of Feed Biotechnology, Ministry of Agriculture and Rural Affairs, Feed Research Institute, Chinese Academy of Agricultural Sciences, Beijing 100081, China
2
National Engineering Research Center of Biological Feed, Beijing 100081, China
3
State Key Laboratory of Food Nutrition and Safety, Key Laboratory of Industrial Fermentation Microbiology of Ministry of Education & Tianjin Key Laboratory of Industrial Microbiology, College of Biotechnology, Tianjin University of Science and Technology, Tianjin 300457, China
*
Authors to whom correspondence should be addressed.
†
These authors contributed equally to this work.
Toxins 2019, 11(3), 154; https://0-doi-org.brum.beds.ac.uk/10.3390/toxins11030154
Submission received: 13 February 2019
/
Revised: 3 March 2019
/
Accepted: 5 March 2019
/
Published: 9 March 2019
(This article belongs to the Section Mycotoxins)
Abstract
:In this work of quercetin’s anti-proliferation action on A. flavus, we revealed that quercetin can effectively hamper the proliferation of A. flavus in dose-effect and time-effect relationships. We tested whether quercetin induced apoptosis in A. flavus via various detection methods, such as phosphatidylserine externalization and Hoechst 33342 staining. The results showed that quercetin had no effect on phosphatidylserine externalization and cell nucleus in A. flavus. Simultaneously, quercetin reduced the levels of reactive oxygen species (ROS). For a better understanding of the molecular mechanism of the A. flavus response to quercetin, the RNA-Seq was used to explore the transcriptomic profiles of A. flavus. According to transcriptome sequencing data, quercetin inhibits the proliferation and aflatoxin biosynthesis by regulating the expression of development-related genes and aflatoxin production-related genes. These results will provide some theoretical basis for quercetin as an anti-mildew agent resource.
Key Contribution: Quercetin could not induce apoptosis in A. flavus. Quercetin inhibits the proliferation by regulating growth and conidial development-related genes and disrupts ribosomal protein without interfering with nucleolar integrit. Quercetin inhibits the aflatoxins biosynthesis by regulating aflS gene.
1. Introduction
Aspergillus flavus is a saprophytic filamentous fungus that produces aflatoxins (AF), which are mutagenic, teratogenic and carcinogenic toxins for humans and animals [1,2,3,4]. Currently, there is a large amount of natural products, synthetic compounds, and extracts from diverse organisms for inhibitors of A. flavus growth, and aflatoxin biosynthesis that were investigated for application in food and feed preservation due to their low impact on the environment and human health [5,6,7,8,9,10].
The addition of anti-mildew agent is one of the important measures to prevent mildew pollution. Natural anti-mildew agent is a more ideal choice. Quercetin (3,3′,4′,5,7-pentahydroxy-flavone) is a natural resource found in many plants, fruits and vegetables [11]. Due to its anti-oxidant [12], anti-inflammatory [13], anti-cancer [5], antiviral, antibacterial [11], and anti-proliferative activity [5,11] and so on, it has been chemically synthesized and commercially sold. Previous studies revealed that quercetin could inhibit the proliferation and AF biosynthesis of A. flavus [6]. However, the molecular mechanisms are still not well-clarified. In this work, we hope to reveal the potential mechanism by which quercetin inhibits the proliferation and AF biosynthesis of A. flavus. It provides a theoretical basis for quercetin as an anti-mildew agent.
2. Results
2.1. Quercetin Inhibited the Proliferation of A. flavus
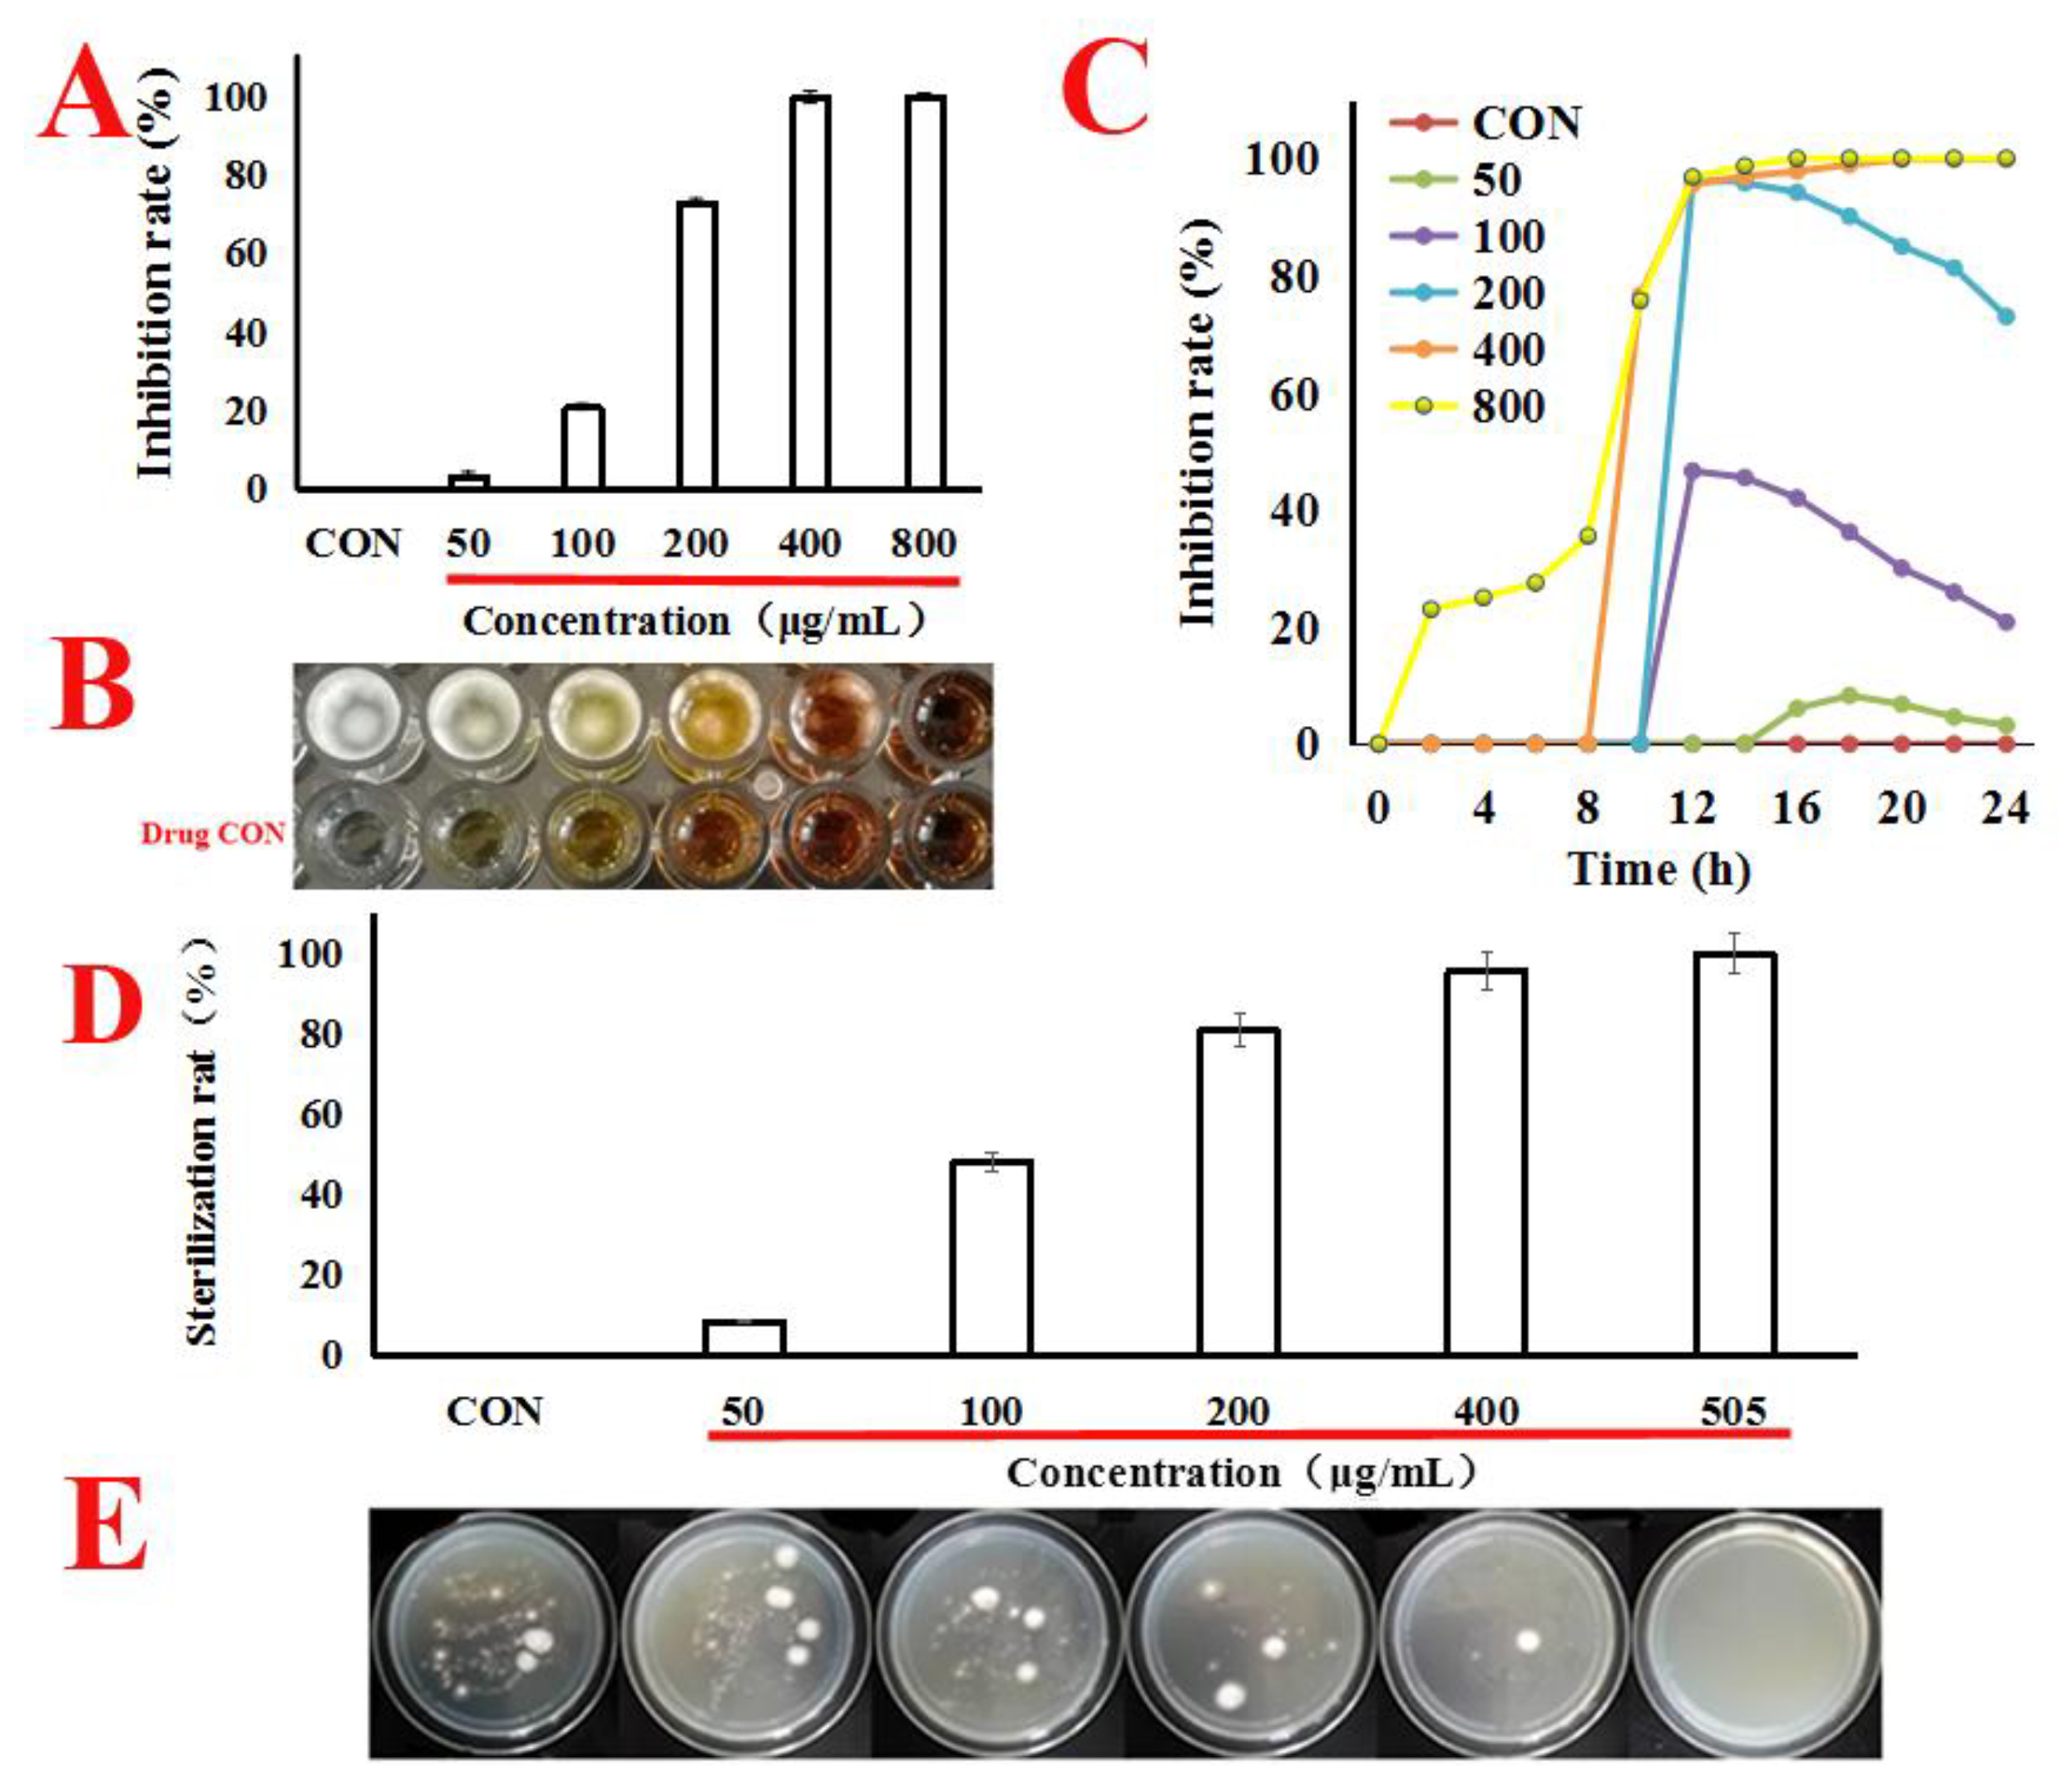
In our works, as shown in Figure 1A–C, quercetin caused a markedly dose-effect and time-effect reduction in A. flavus cells viability, with the MIC value at 505 μg/mL. Next, we attempted to estimate the minimum bactericidal concentration (MBC) value; under the concentration of MIC (505 μg/mL), the single colony was not found in the potato dextrose agar (PDA) plates. It can be seen from this that when the concentration of MIC was 505 μg/mL, the spore survival rate was zero. Therefore, the MBC value was the same as the MIC (Figure 1D,E). Therefore, we conclude that quercetin might inhibit the proliferation of A. f lavus.
2.2. Morphological Changes of A. flavus
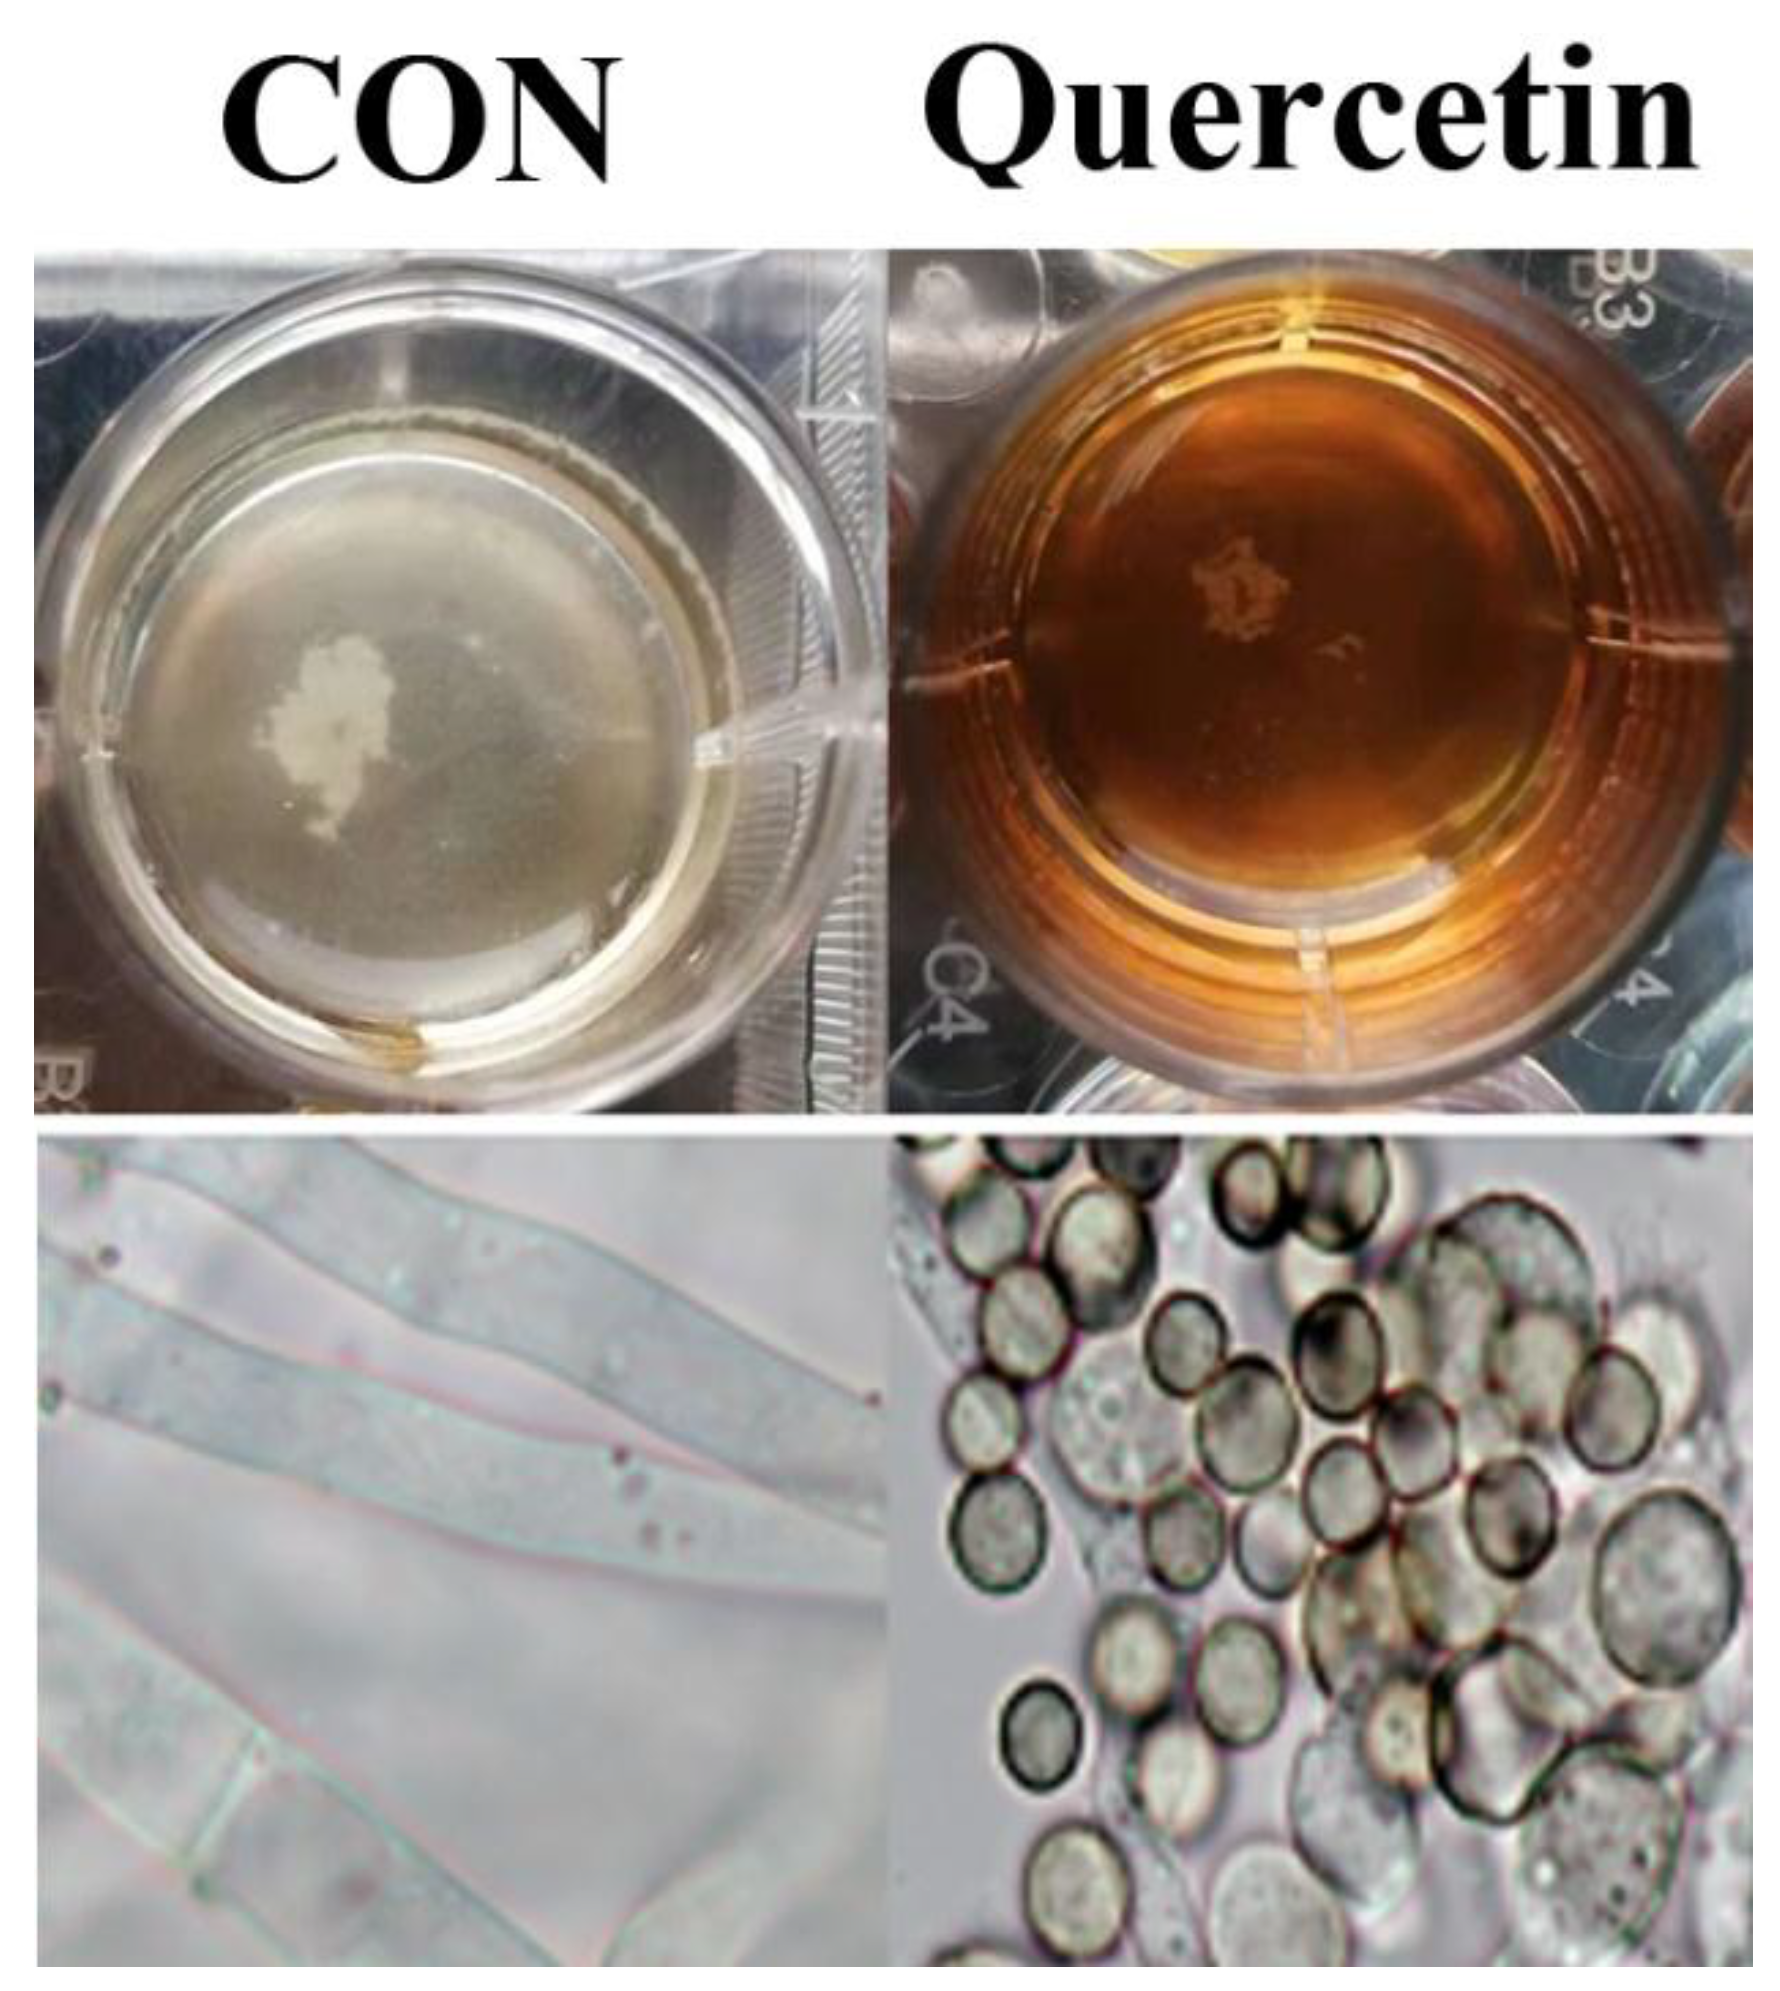
Spore (107 CFU/mL) were treated with quercetin (200 μg/mL). After 24 h, A. flavus cells were harvested. The morphological changes of A. flavus were observed with the aid of a microscope with a 100-fold oil mirror. The result is shown in Figure 2. Compared with the control group, the mycelia of A. flavus were significantly degraded in the quercetin treated group.
2.3. Cell Apoptosis
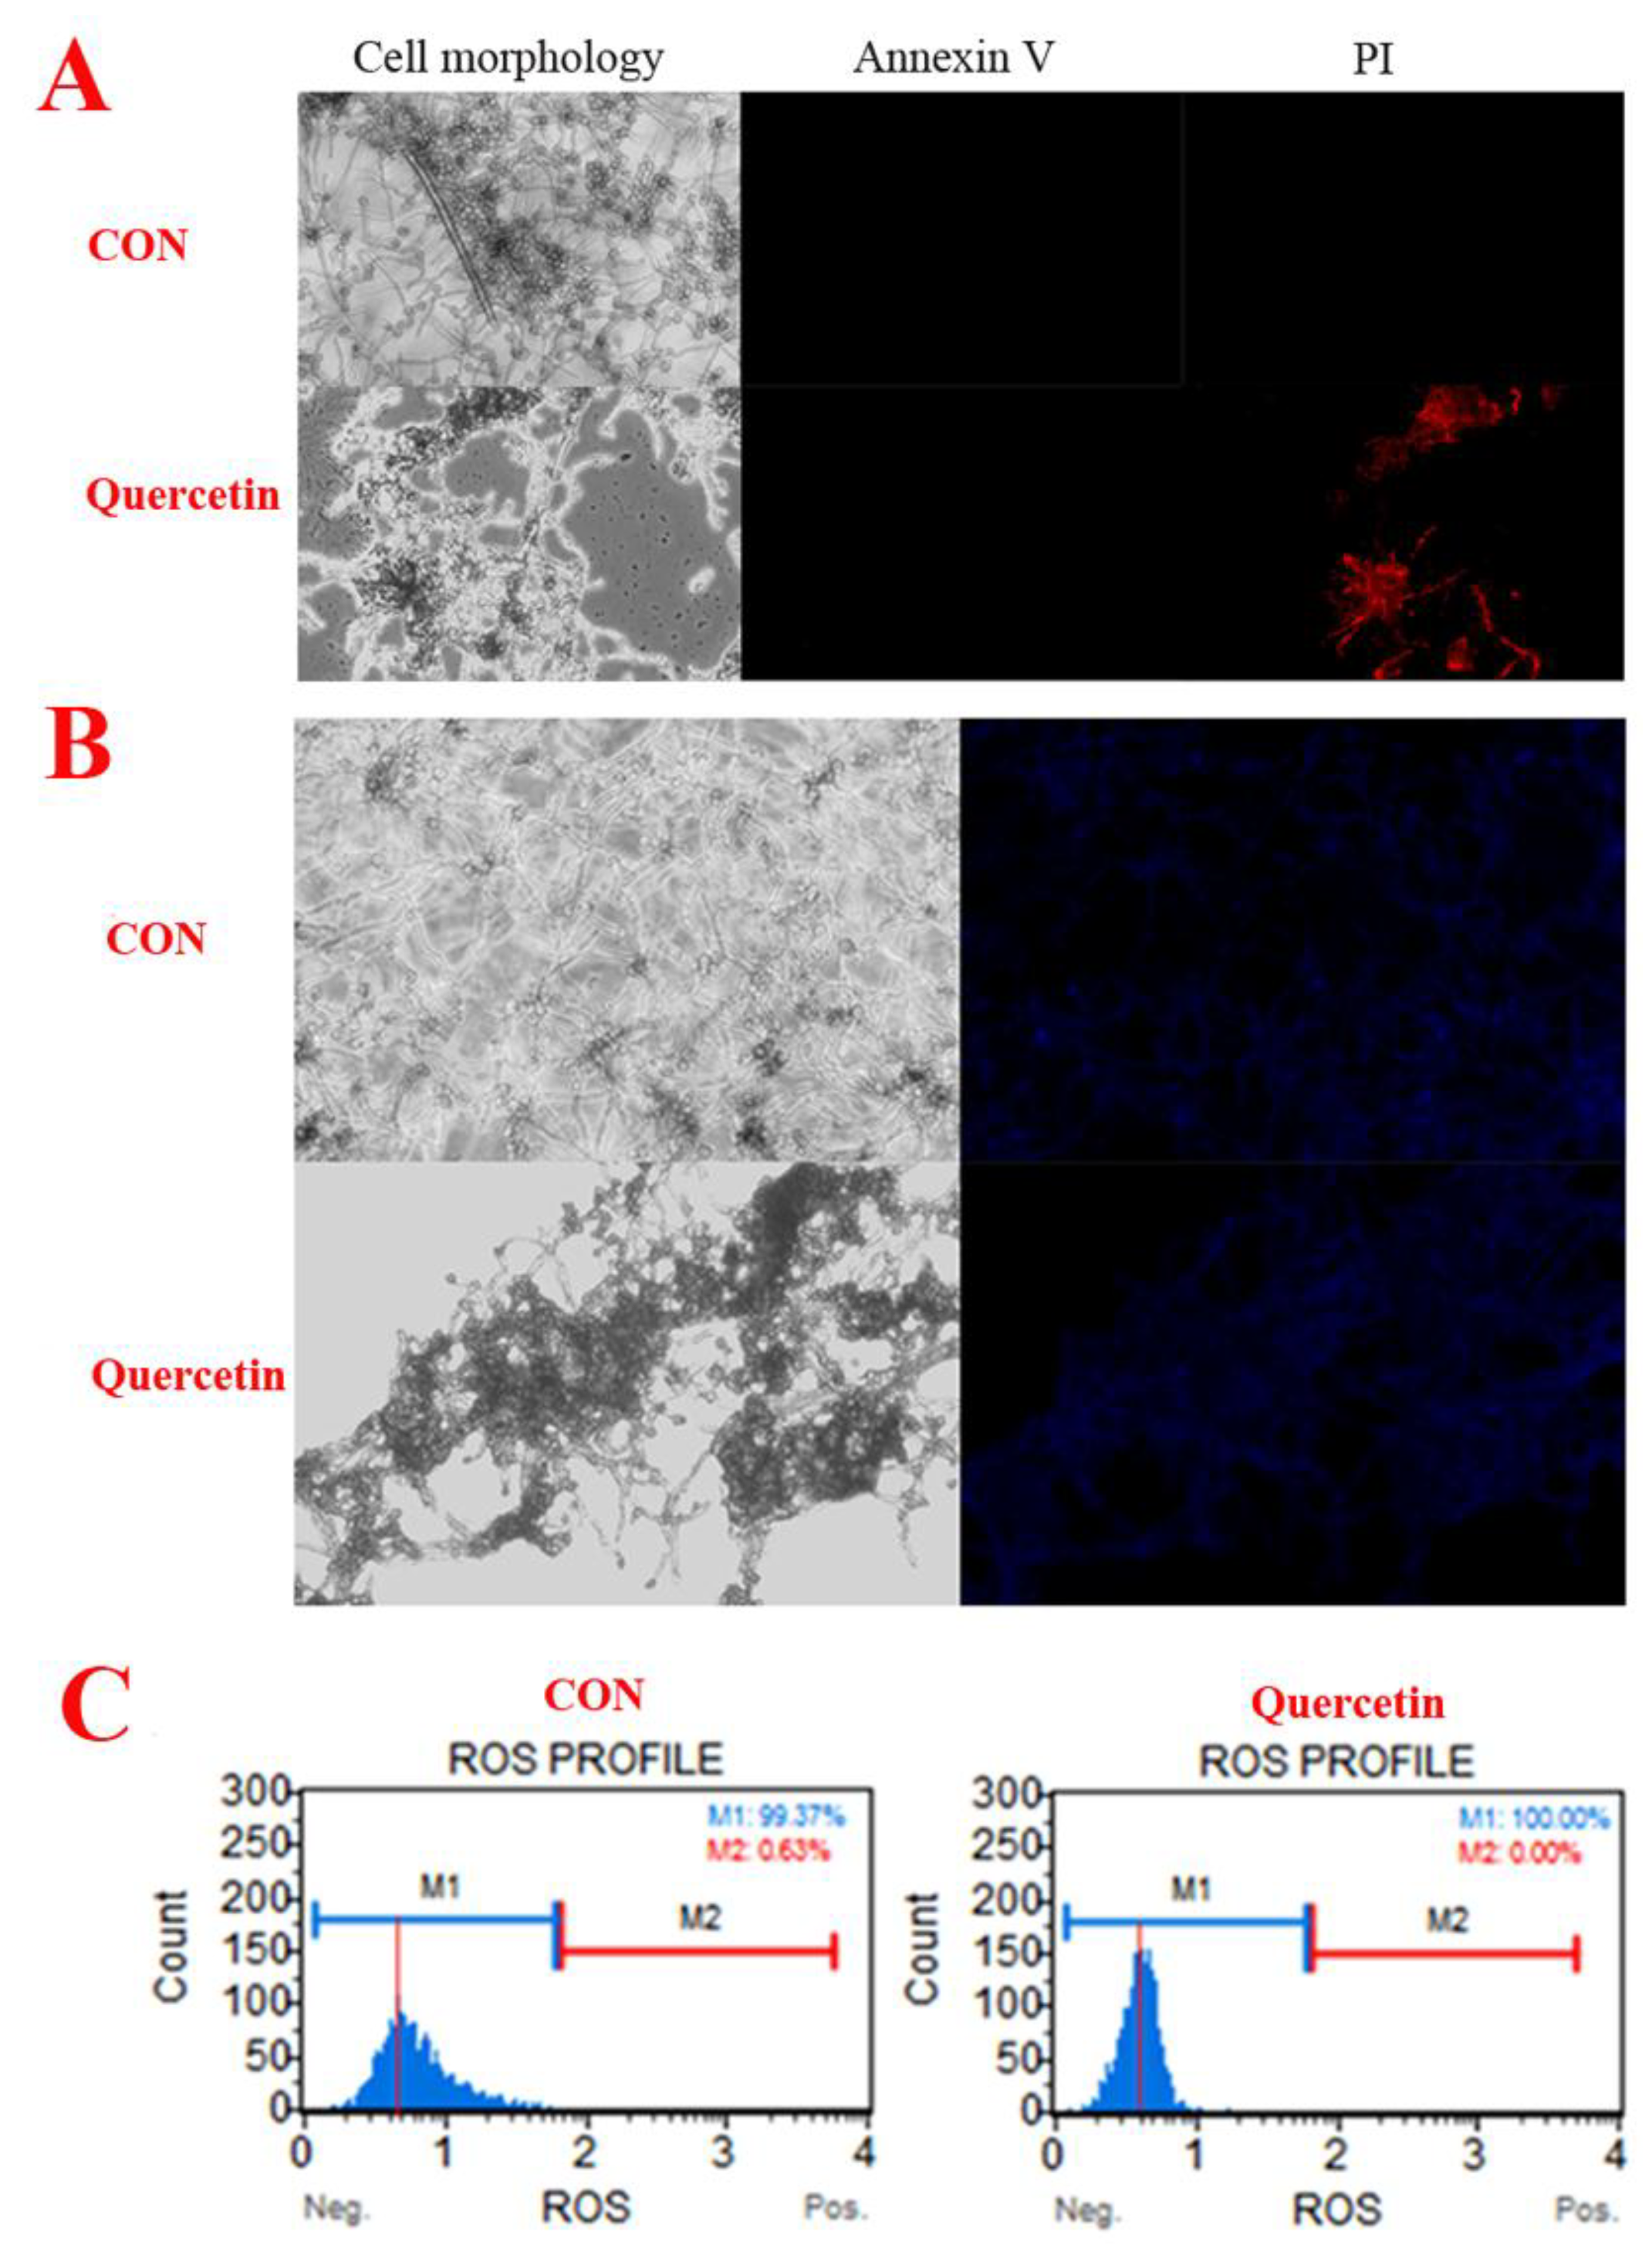
We used annexin-V-FITC/propidium iodide (PI) double staining to differentiate intact cells from non-apoptotic cells (annexin-V negative and PI negative), early apoptotic cells (annexin-V positive and PI negative), late apoptotic cells (annexin-V positive and PI positive), and dead (necrotic) cells (PI positive) and to examine apoptosis more deeply [14]. As shown in Figure 3A, only the quercetin-treated group produced dead (necrotic) cells. The observations suggested that A. flavus cells have died via necrosis but not through the apoptotic pathway. In addition, compared with the control group, quercetin did not cause changes in the nuclear integrity of A. flavus (Figure 3B). Generation of ROS happens at the onset of apoptosis [5,15]. However, in our work, quercetin did not cause reactive oxygen species to rise, but caused reactive oxygen species to decrease (Figure 3C). This further indicates that quercetin does not induce the death of A. flavus through apoptotic pathway. In conclusion, these results demonstrated that quercetin does not induce apoptosis in A. flavus.
2.4. RNA-Seq Data
The transcriptome of A. flavus was put together from scratch with paired-end raw reads brought forth by the Illumina HiSeq2500 instrument. After redundancy and short reads had been weeded out, the clean reads in the QT group and CK group were 50561156 and 51441686, respectively (Table S1). The Illumina guidelines were used to sequence data for every sample found to have Q30 as its quality score. The GC counts for the QT group and the CK group were 52.39% and 52.33%, respectively (Table S1). Also, 45577031 (90.14%) and 46843066 (89.88%) clean reads that we got from the two groups effectively matched the value for the A. flavus genome. 89.42% of the reads were individually mapped to the genome for the QT group and 89.68% for CK group (Table S1) according to the statistics. Moreover, 0.46% and 0.46% of the reads were multiply mapped to the genome for the CK group and the QT group, respectively (Table S1). These results showed that the sequencing quality was suitable for the unigenes of subsequent annotation analysis.
2.5. Identification and Functional Annotation
From the FPKM (Reads Per Kilobase of exon model per Million mapped reads) values, we identified 665 differentially expressed genes (log2[fold change] = log2[QT/CK] > 1, Probability > 0.8) between the QT and CK groups. Of these, 340 genes up-regulated and 325 genes down-regulated following exposure to quercetin (Table S2). We carried out a GO functional enrichment analysis of these differently expressed genes. The results demonstrated that these genes played a role in structural constituent of ribosome, structural molecule activity, electron carrier activity, rRNA binding, cis-trans isomerase activity, translation, cellular protein metabolic process, protein metabolic process, cellular biosynthetic process, biosynthetic process, organic substance biosynthetic process, cellular metabolic process, cellular macromolecule biosynthetic process, gene expression, macromolecule biosynthetic process, organic substance metabolic process, primary metabolic process, cellular macromolecule metabolic process, cellular process, organonitrogen compound biosynthetic process, purine nucleoside triphosphate biosynthetic process, purine ribonucleoside triphosphate biosynthetic process, ribosome, ribonucleoprotein complex, non-membrane-bounded organelle, intracellular non-membrane-bounded organelle, cytoplasmic part, macromolecular complex, cytoplasm, cell, cell part, intracellular part, intracellular, organelle, intracellular organelle, ribosomal subunit, small ribosomal subunit, or proton-transporting ATP synthase complex (Table S3). KEGG (Kyoto Encyclopedia of Genes and Genomes) metabolic pathway enrichment analysis shown that these genes were primarily involved in the ribosome, Oxidative phosphorylation, Huntington’s disease, Parkinson’s disease and Alzheimmer’s disease (Table S3). Our analysis of KEGG metabolic pathway enrichment showed that these genes played a role in the ribosome, Huntington’s disease, Oxidative phosphorylation, Parkinson’s disease and Alzheimer’s disease (Table S4).
2.6. Expression Analysis of Conidial Development- and A. flavus Growth-Related Genes in Response to Quercetin
To elucidate the effects of quercetin on the regulation of conidia and mycelia, based on the differentially expression genes (Table S2) of A. flavus in the CK and QT groups, we found that some genes that played a role in conidial and mycelial development were down-regulated when quercetin was used (Table 1), including sexual development transcription factor NsdD (AFLA_020210), sexual development transcription factor SteA (AFLA_048650), G protein complex alpha subunit GpaB (AFLA_018540), APSES transcription factor StuA (AFLA_046990), conidiation-specific protein Con-10 (AFLA_083110) and conidiation-specific family protein (AFLA_044790).
Ribosomal proteins (RPs) are needed for all types of cells to grow and survive [16,17]. In our study, the analysis of KEGG metabolic pathway enrichment demonstrated that the ribosome was the most deregulated metabolic pathway in A. flavus that underwent treatment with quercetin, as shown in Table 2, 65 of differentially expressed genes were significant regulated, including 60 genes down-regulated (RPS6, RPS12, RPS13, RPS14, RPS15, RPS16, RPS17, RPS18, RPS19, RPS2, RPS20, RPS21, RPS22, RPS23, RPS24, RPS25, RPS26, RPS28, RPS4, RPS5, RPS8, RPS9, RPP0, RPP1, RPP2, RPL1, RPL11, RPL12, RPL13, RPL14, RPL15, RPL16, RPL18, RPL2, RPL20, RPL21, RPL23, RPL24, RPL25, RPL26, RPL27, RPL28, RPL3, RPL30, RPL31, RPL32, RPL33, RPL34, RPL35, RPL36, RPL37, RPL38, RPL42, RPL43, RPL5, RPL6, RPL7 or RPL8 ) and 5 genes up-regulated (RPL17, RPL19, RPL22, RPL32 or RPL9). Interestingly, all the 5 up-regulated genes were a protein component of the 60S large ribosomal subunit.
2.7. Expression Analysis of A. flavus AF Biosynthesis-Related Genes in Response to Quercetin
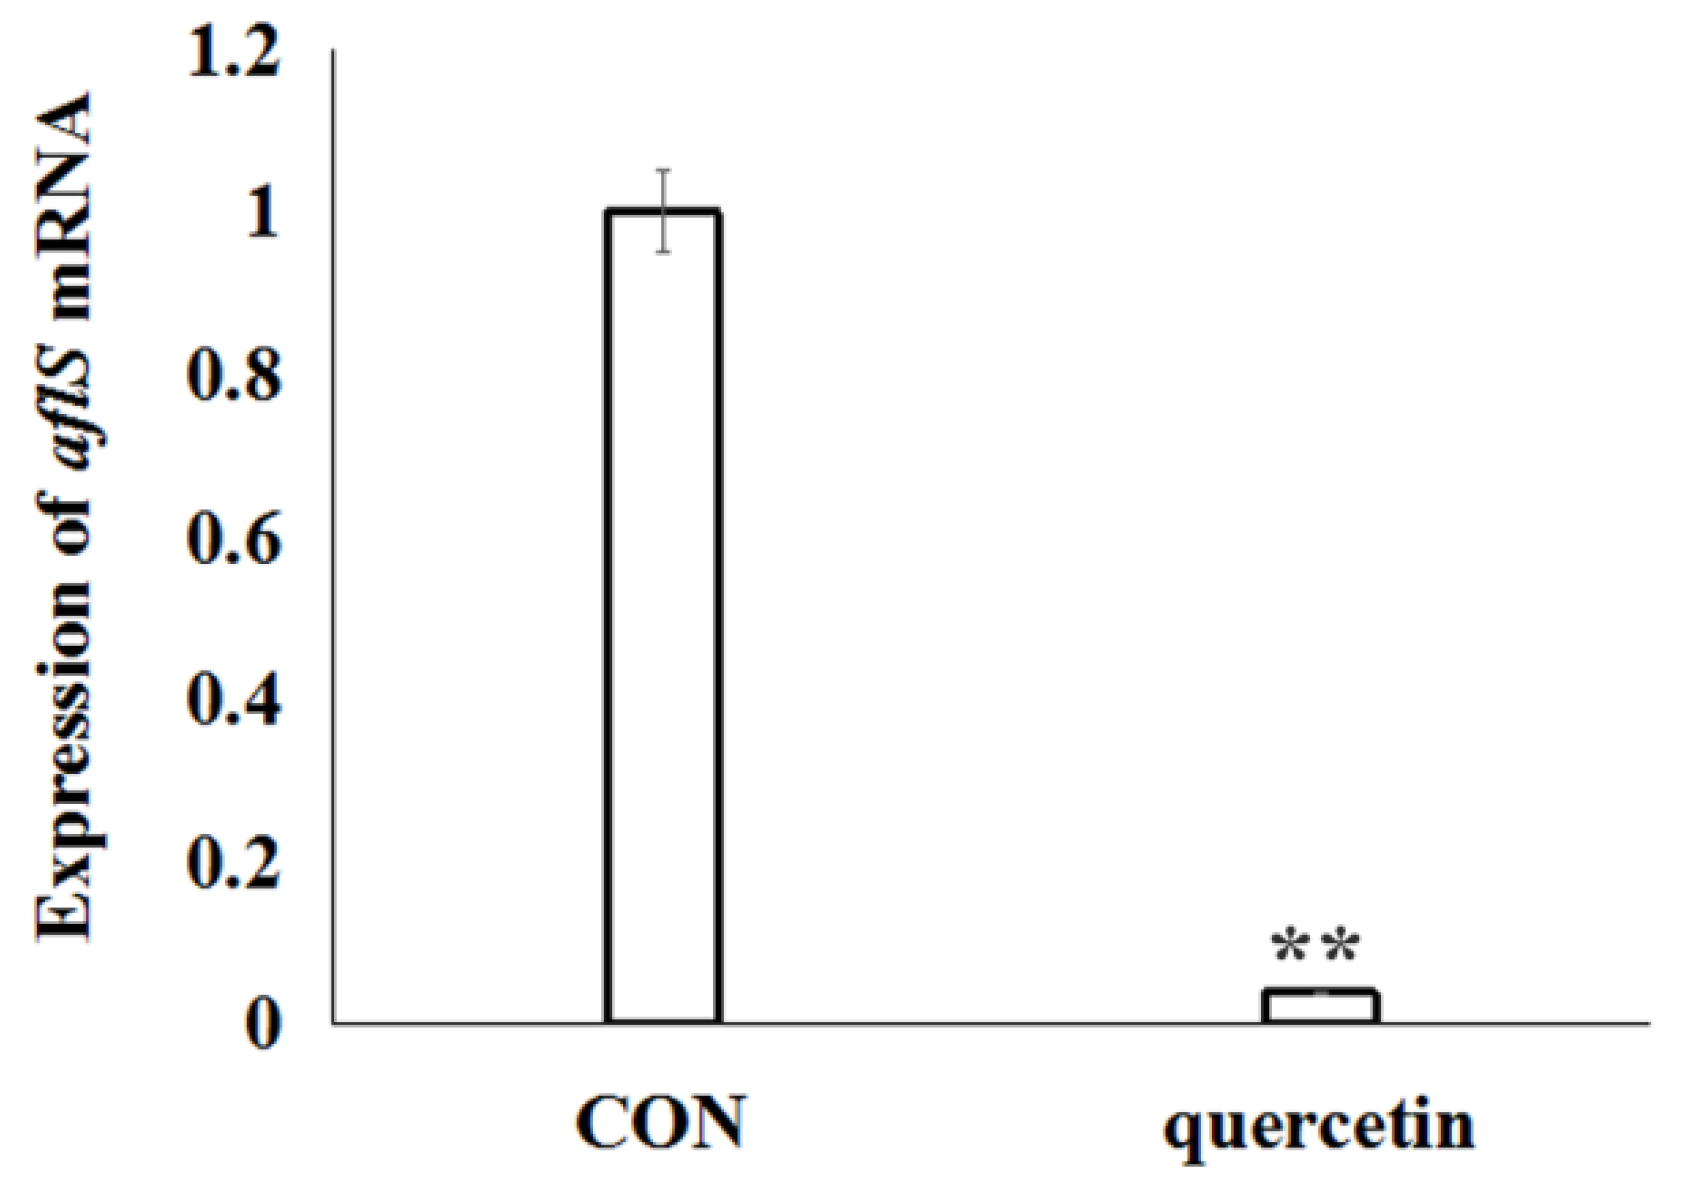
To elucidate the effects of quercetin on the regulation of aflatoxin biosynthesis, based on the analysis of differentially expressed genes data of A. flavus in the CK and QT groups (Table S2), the transcription regulator gene aflS (AFLA_139340) was significantly down-regulated. Further, aflS gene was validated by real-time RT-PCR analysis. The data confirmed the significant down-regulated of gene aflS (Figure 4), which was consistent with transcriptome data (Table S2).
3. Discussion
Quercetin is one of the natural flavonoids that play a crucial role in antibacterial activity [11]. Studies of flavonoid molecules of structure activity relationship have demonstrated that the oxygen atoms at position 4 in the C ring and the hydroxyl at positions 5 and 7 in the A ring constitute the primary group of antibacterial activity; next to them is the hydroxyl at position 3 in the C ring for antibacterial activity of such compounds. The hydroxyl at positions 3′ and 4′ in the B ring also shows some antibacterial activity [11]. Quercetin includes the oxygen atoms at position 4 in the C ring and the hydroxyl at position 5, 7, 3, 3′ and 4′. Previous studies have shown that quercetin can inhibit the proliferation of A. flavus [6]. However, in our work, we found that quercetin not only inhibited the growth of A. flavus, but also killed A. flavus, with a minimum inhibitory concentration of 505 μg/mL, and a minimum fungicidal concentration of 505 μg/mL (Figure 1). In addition, quercetin inhibits the growth of A. flavus in a dose-effect and time-effect relationship (Figure 1C).
Apoptosis is a kind of physiological programmed cell death and is different from necrosis [18]. One important mechanism referred to the function of antifungal drugs is the activation of the apoptotic pathway [7,19,20]. Antifungal agents trigger morphological features characteristic of apoptosis including PS externalization, nuclear condensation and ROS generation and so on, when they induce apoptosis on fungi [7,18,19,20]. However, in our works, the results of Annexin V-FITC/PI staining shown only the quercetin-treated group produced dead (necrotic) cells (Figure 3A). Subsequently, the morphological features characteristics of nuclear condensation was observed, we found that compared with the control group, quercetin did not cause changes in the nuclear integrity of A. flavus (Figure 3B). In addition, generation of ROS happens at the onset of apoptosis [5,15], in our work, quercetin did not cause reactive oxygen species to rise, but caused reactive oxygen species to decrease (Figure 3C). This result is contrary to the PS externalization morphological features characteristics of apoptosis. From the above, we concluded that quercetin might not induce apoptosis in A. flavus. How does quercetin inhibit the growth of A. flavus? We used transcriptome sequencing to reveal its possible mechanism. In our work, the mechanism by which quercetin inhibits A. flavus proliferation and aflatoxin biosynthesis was investigated adopting an RNA-seq analysis.
Based on our transcriptome data, we found that some genes that played a role in conidial and mycelial development were down-regulated when quercetin was used (Table 1), including sexual development transcription factor NsdD (AFLA_020210), sexual development transcription factor SteA (AFLA_048650), G protein complex alpha subunit GpaB (AFLA_018540), APSES transcription factor StuA (AFLA_046990), conidiation-specific protein Con-10 (AFLA_083110) and conidiation-specific family protein (AFLA_044790). When the development of A. flavus is inhibited, the sexual development transcription factor NsdD (AFLA_020210) [9] and SteA (AFLA_048650) were significantly down-regulated. Concurrently, transcriptions of conidia-specific genes, such as conidiation-specific family protein (AFLA_044790) and Con-10 (AFLA_083110) were significantly down-regulated [21]. The APSES transcription factor StuA that affects the orderly differentiation and spatial organization of cell types of the conidiospore [8] is encoded by transcription of the stuA gene (AFLA_046990), and the G protein complex alpha subunit GpaB (AFLA_018540) was significantly decreased. During aflatoxin biosynthesis, AflR is essential for expression of most of the genes in the aflatoxin genes cluster [6], which AflS (AFLA_139340) was reported to interact with activating AflR to give play to its regulatory effect [22]. As is known to all that fungal growth was closely related to biosynthesis of secondary metabolism [2,23]. APSES transcription factor StuA to be required for fungal conidial and mycelium growth [8,24]. Down-regulation of APSES transcription factor StuA inhibited the aflatoxin biosynthesis [24]. In our works, the transcription regulator genes aflS were significantly down-regulated (Table S2 and Figure 4). In addition, the redox state in the mycelia of A. flavus has been proved to be closely related to aflatoxin production [6]. Quercetin reduced the ROS level in the A. flavus (Figure 3C). So, quercetin may reduce the production of aflatoxin by lowering levels of ROS.
Ribosomal proteins (RPs) are needed for all types of cells to grow and survive [16,17]. In eukaryotic cells, the ribosome is made up of two subunits, a large subunit (60S) and a small subunit (40S) [16,25,26]. The small subunit (40S) is the t-RNA binding, decoding, and mRNA passage site [27,28]. The large subunit (60S) afforded a GTPase binding platform, polypeptide exit tunnel and peptidyl transfer [25,26]. In this study, the analysis of KEGG metabolic pathway enrichment demonstrated that the ribosome was the most deregulated metabolic pathway in A. flavus that underwent treatment with quercetin, including RPS6, RPS12, RPS13, RPS14, RPS15, RPS16, RPS17, RPS18, RPS19, RPS2, RPS20, RPS21, RPS22, RPS23, RPS24, RPS25, RPS26, RPS28, RPS4, RPS5, RPS8, RPS9, RPP0, RPP1, RPP2, RPL1, RPL11, RPL12, RPL13, RPL14, RPL15, RPL16, RPL17, RPL18, RPL19, RPL2, RPL20, RPL21, RPL22, RPL23, RPL24, RPL25, RPL26, RPL27, RPL28, RPL3, RPL30, RPL31, RPL32, RPL33, RPL34, RPL35, RPL36, RPL37, RPL38, RPL42, RPL43, RPL5, RPL6, RPL7, RPL8 or RPL9 that regulates ribosomal proteins (Table 2) without interfering with nucleolar integrity (Figure 3B). RPP0 binds permanently to the 60S subunit, and it is a necessary protein for ribosome function and structure because its exclusion would kill the cell [27]. RPP0 inhibits cell proliferation when it is down-expressed [26]. The 60S large ribosomal subunit has RPL23 as a protein component. Interestingly, RPL23 reportedly causes growth inhibition and has anti-tumor effects in gastric cancer, SKM-1 and K562 cells, when it is suppressed [28,29]. RPL27 and RPL30 have possess antimicrobial properties against Streptococcus uberis, Streptococcus pyogenes and Enterococcus faecium [30]. The 60S large ribosomal subunit has RPL17 as a protein component. Previous studies have shown that the over-expression of RPL17 inhibits cell growth and proliferation, while not affecting cell apoptosis [31]. Over-expression of RPL19 is implicated in lower prostate cancer survival. On the contrary, the role of RPL19 in promoting tumor formation was confirmed using transient and stable knockdown of RPL19 mRNA [32,33]. RPL22 is a protein component of the 60S large ribosomal subunit. Overexpression of RPL22/eL22 leads to the increase of p53, p21 and MDM2 protein levels, which RPL22/eL22 can suppress cancer cell proliferation and growth in a p53-dependent fashion [34]. Down-regulation of ribosomal protein L34 (RPL34) could hamper the multiplication of esophageal cancer cells [35,36]. Down-expression of RPL6 and RPS13 inhibit cell proliferation and cell cycle progression in gastric cancer cells [37,38]. Over-expression of RPL9 inhibits rabies virus replication [39]. The function of some ribosomal proteins is still unknown, which requires further study.
4. Materials and Methods
4.1. Reagents
The quercetin (purity > 98.0%) was bought from the National Institutes for Food and Drug Control (Beijing, China). Muse® Oxidative Stress Assay Kit was bought from Merckmillipore (Billerica, MA, USA). Hoechst 33342 and Annexin V-FITC Kit were bought from Beyotime (Shanghai, China).
4.2. Fungus Strain and Cultivation
A. flavus (CGMCC3.6434) was bought from the China General Microbiological Culture Collection Center (CGMCC, Beijing, China). The A. flavus was cultured at 28 °C in a potato dextrose agar (PDA) and preserved in a refrigerator at 4 °C.
4.3. Anti-Proliferative Activity
Colorimetric 3-(4,5-dimethylthiazol-2-yl)-2,5-diphenyltetra-azolium bromide (MTT) assay was applied to measure the proliferation of A. flavus. Spore (107 CFU/mL) was inoculated into Sabouraud’s Glucose Broth Medium at 200 mL/well in 96-well microtiter plates. Two-fold consecutive dilutions of quercetin (0, 50, 100, 200, 400, 800 μg/mL) were made to wells inhabited by spore. After incubating for 24 h at 30 °C, each concentration was assayed in triplicate (n = 3). 24 h later, 10 μL of the MTT (5 mg/mL) reagent was put in each well and the plates were left to incubate at 30 °C for 4 h. Then, the reaction was ended by the addition of DMSO (100 μL), and the plate was agitated a little to redissolve the formed crystals. The absorbance of each well was assessed with a Multiskan Sky microplate reader (Thermo Scientific, Waltham, MA, USA). The results appeared as the inhibition ratio of cell multiplication calculated as [(A − B)/A] × 100% (A and B are the average numbers of viable cells of the control and samples, respectively).
In addition, the dose-effect and time-effect relationship experiments of quercetin on the proliferation of A. flavus were determined. Spore (107 CFU/mL) was inoculated into Sabouraud’s Glucose Broth Medium at 200 μL/well in 96-well microtiter plates. Various concentrations (0, 50, 100, 200, 400, 800 μg/mL) of quercetin were put in wells inhabited by spore. The light absorption value at 600 nm was detected every two hours using Multiskan Sky microplate reader (Thermo Scientific, Waltham, MA, USA).
Minimum bactericidal concentration (MBC) refers to the least concentration of bactericide required to kill 99.9% of bacteria inoculums. Briefly, after the anti-proliferative activity assay, the A. flavus solution was sucked out of the 96-well plate, centrifuged at 8000 rpm for 5 min, washed with quercetin, and then suspended the A. flavus with 0.9% normal saline. The washed A. flavus was then coated onto PDA plates, and the single colony was cultured at 30 °C for counting. The results appeared as the inhibition ratio of cell proliferation calculated as [(A − B)/A] × 100% (A and B are the average numbers of viable cells of the control and samples, respectively).
4.4. Morphological Changes of A. flavus
Spores (107 CFU/mL) were treated with quercetin (200 μg/mL). After 24 h, A. flavus cells were observed with a CX31 microscope with 100-fold oil mirror (Olympus, Tokyo, Japan).
4.5. Phosphatidylserine (PS) Externalization
Spores (107 CFU/mL) were treated with quercetin (200 μg/mL). After 24 h, A. flavus cells were harvested and stained for 30 min with fluoresced in isothio-cyanate (FITC)-Annexin V and propidium iodide (PI) at room temperature in the dark, in line with the manufacturer’s recommendations (Beyotime, Shanghai, China). The cells were analyzed by Axio Vert A1 fluorescence microscope (Carl Zeiss, Jena, Germany).
4.6. Hochest 33342
Spore (107 CFU/mL) were treated with quercetin (200 μg/mL). After 24 h, A. flavus cells were harvested and stained for 30 min with fluoresced Hoechst 33342 in the dark at 37 °C, according to the manufacturer’s recommendations (Beyotime, Shanghai, China). The cells were analyzed using Axio Vert A1 fluorescence microscope (Carl Zeiss, Jena, Germany).
4.7. Measurement of Reactive Oxygen Species
Spores (107 CFU/mL) were treated with quercetin (200 μg/mL). After 24 h, A. flavus cells were harvested. The A. flavus cell walls were digested with 1.5% nailase (Solarbio, Beijing, China) and 1.5% Lyticase (Sigma, St Louis, MO, USA) and 1.5% cellulase (Onozuka, Tokyo, Japan) at 30 °C on a rotary shaker (80 rpm) for 3 h. They were washed twice in PBS and filtered through five layers of sterile lens paper to eliminate mycelial debris; then the protoplasts were obtained. According to the recommendations of the manufacturer, prepare cell samples in 1× assay buffer at 1 × 10⁶ CFU/mL, and then 10 μL of prepared cells were add to 190 μL of oxidative stress working solution. Incubate at 37 °C for 30 min. the cells were analyzed using Muse® Cell Analyzer (Merck, MA, USA).
4.8. cDNA Preparation and Illumina Sequencing
Construction of library and RNA-Seq were performed at Realbio Technology (Shanghai, China). Total RNA from quercetin-untreated (CK) and quercetin-treated (QT) groups was isolated with TRIzol Reagent (Invitrogen, Shanghai, China) following the recommendations of the manufacturer. The integrity and total concentration of RNA were assessed with a NanoDrop (Implen, Westlake Village, CA, USA), a Qubit® Fluorometer 2.0, and an Agilent 2100 Bioanalyzer (Agilent Technologies, Santa Clara, CA, USA) instruments. The mRNA was separated with the use of oligo (dT)-attached magnetic beads. The separated mRNA and the fragmentation buffer were mixed and cut into tiny fragments using divalent cations under high temperatures. The cDNA was synthesized with these cleaved RNA fragments as templates. Afterward, the short fragments and the adapters were connected. The fragments found suitable were picked as templates for the amplification of PCR. During the QC steps, Agilent 2100 Bioanaylzer (Agilent Technologies, Santa Clara, CA, USA) and ABI StepOnePlus Real-Time PCR System (Applied Biosystems, Waltham, MA, USA) were exploited for the qualification and quantification of the sample library. Lastly, the library was carried out with an Illumina HiSeq 2500 (Illumina, San Diego, CA, USA).
4.9. RNA-Seq and Enrichment Analysis of Differentially Expressed Genes
Raw data (raw reads) based on fastq format were initially processed with the use of in-house perl scripts. Clean data (clean reads) were procured by eliminating reads containing adapter and poly-N as well as reads of low quality from the raw data. The Q20, Q30, GC content, as well as level of sequence duplication of the clean data, were calculated. Analysis of downstream used clean data with high quality. Sequenced clean reads were mapped against predicted transcripts of the A. flavus NRRL 3357 genome1 (http://0-www-ncbi-nlm-nih-gov.brum.beds.ac.uk/genome/?term=aspergil-lus+flavus) using TopHat V2.1.1 and Bowtie v2.2.5 [40], and only unique matches were allowed. The FPKM (Fragments Per Kb of exon per Million reads) method was used to calculate and normalize the expression levels of the gene [41]. The genes expressed differentially were analyzed with the R edge R package V3.6.2 [35], and both a twofold change cut-off and an adjusted p-value of ≤0.05 were put in place as thresholds. Enrichment analysis of differential expression was carried out with the use of the GO-TermFinder v0.86 [42]. GO terms (including molecular function, cellular component, and biological process) and the Kyoto Encyclopedia of Genes and Genomes (KEGG) pathways were recognized as well enriched among genes expressed differentially when their p-values were ≤0.05.
4.10. Validation of RNA-Seq Analysis by Quantitative Real-Time PCR (qRT-PCR)
The totality of RNA was then separated by use of Trizol reagent (Invitrogen, Carlsbad, CA, USA). Briefly, the qRT-PCR conditions were thus: 95 °C for 10 min and 40 cycles of 95 °C for 15 s and 60 °C for 60 s. The fold or percentage of change in the relative expression of the mRNA of the target gene was assessed by the 2−ΔΔCt approach. The gene-specific primers are listed in Table S5.
4.11. Statistical Analysis
Data were expressed as mean ± standard deviation. Statistical analysis was carried with a one-way analysis of variance test for multiple comparisons. Differences between comparisons were deemed statistically significant at p < 0.05. SPSS software version 17.0 (SPSS Inc., Chicago, IL, USA) was deployed for analysis of data.
Supplementary Materials
The following are available online at https://0-www-mdpi-com.brum.beds.ac.uk/2072-6651/11/3/154/s1, Table S1: Summary of Transcriptome Sequencing Data. Table S2: Differentially expressed genes (log2[fold change] = log2[QT/CK] > 1, Probability > 0.8). Table S3: GO Ontology (GO) functional enrichment analysis of differently expressed genes when A. flavus was treated with quercetin. Table S4: KEGG metabolic pathway enrichment analysis of differentially expressed genes when A. flavus was treated with quercetin. Table S5: Primers used for RT-PCR.
Author Contributions
X.-M.L. and P.-L.Y. conceived and designed the experiments; X.-M.L., Z.-Y.L., Y.-D.W. and J.-Q.W. performed the experiments; X.-M.L. and Z.-Y.L. analyzed the data; X.-M.L. and P.-L.Y. wrote the paper.
Funding
This research was funded by the National Key Research and Development Program of China (Grant No. 2016YFE0113300), the China Postdoctoral Science Foundation (Grant No. 2016M591306), the Agricultural Science and Technology Innovation Program (Grant No. ASTIP-FRI07) and the Fundamental Research Funds for Central Non-profit Scientific Institution (Grant No. 1610382018003) and the Foundation of Key Laboratory of Industrial Fermentation Microbiology of Ministry of Education and Tianjin Key Lab of Industrial Microbiology (Tianjin University of Science & Technology) (Grant No. 2017KF002).
Conflicts of Interest
The authors declare no conflict of interest.
References
- Cary, J.W.; Han, Z.; Yin, Y.; Lohmarc, J.M.; Shantappa, S.; YHarris-Coward, P. Transcriptome analysis of Aspergillus flavus reveals veA-dependent regulation of secondary metabolite gene clusters, including the novel aflavarin cluster. Eukaryot. Cell. 2015, 14, 983–997. [Google Scholar] [CrossRef] [PubMed]
- Amaike, S.; Kelle, N.P. Aspergillus flavus. Annu. Rev. Phytopathol. 2011, 49, 107–133. [Google Scholar] [CrossRef] [PubMed]
- Alshannaq, A.F.; Gibbons, J.G.; Lee, M.K.; Han, K.H.; Hong, S.B.; Yu, J.H. Controlling aflatoxin contamination and propagation of Aspergillus flavus by a soy-fermenting Aspergillus oryzae strain. Sci. Rep. 2018, 8, 16871. [Google Scholar] [CrossRef] [PubMed]
- Caceres, I.; Snini, S.P.; Puel, O.; Mathieu, F. Streptomyces roseolus, A promising biocontrol agent against Aspergillus flavus, the main Aflatoxin B₁producer. Toxins 2018, 30, 10. [Google Scholar] [CrossRef] [PubMed]
- Li, X.M.; Liu, J.; Pan, F.F.; Shi, D.D.; Wen, Z.G.; Yang, P.L. Quercetin and aconitine synergistically induces the human cervical carcinoma HeLa cell apoptosis via endoplasmic reticulum (ER) stress pathway. PLoS ONE 2018, 13, e0191062. [Google Scholar] [CrossRef] [PubMed]
- Wang, M.Y.; Zhang, H.; Yang, J.; Hu, L.B.; MO, H.Z. Inhibition Effect of Quercetin on Aflatoxin B1 Production. Mod. Food Sci. Technol. 2014, 30, 56–62. [Google Scholar]
- Wang, X.Y.; Wang, Y.Z.; Zhou, Y.G.; Wei, X.L. Farnesol induces apoptosis-like cell death in the pathogenic fungus Aspergillus flavus. Mycologia 2014, 106, 881–888. [Google Scholar] [CrossRef] [PubMed]
- Wang, H.M.; Lei, Y.; Yan, L.Y.; Cheng, K.; Dai, X.F.; Wan, L.Y. Deep sequencing analysis of transcriptomes in Aspergillus flavus in response to resveratrol. BMC Microbiol. 2015, 15, 182. [Google Scholar] [CrossRef]
- Lv, C.; Wang, P.; Ma, L.X.; Zheng, M.M.; Liu, Y.; Xing, F.G. Large-scale comparative analysis of Eugenol-Induced/Repressed genes expression in Aspergillus flavus using RNA-seq. Front. Microbiol. 2018, 9, 1116. [Google Scholar] [CrossRef] [PubMed]
- Lin, J.Q.; Zhao, X.X.; Zhi, Q.Q.; Zhao, M.; He, Z.M. Transcriptomic profiling of Aspergillus flavus in response to 5-azacytidine. Fungal Genet. Biol. 2013, 56, 78–86. [Google Scholar] [CrossRef]
- Li, X.M.; Luo, X.G.; Si, C.L.; Wang, N.; Zhou, H.; He, J.F. Antibacterial active compounds from Hypericum ascyron L. induce bacterial cell death through apoptosis pathway. Eur. J. Med. Chem. 2015, 96, 436–444. [Google Scholar] [CrossRef] [PubMed]
- De Souza, R.F.; de Giovani, W.F. Antioxidant properties of complexes of flavonoids with metal ions. Redox Rep. 2004, 9, 97–104. [Google Scholar] [CrossRef]
- Yoon, J.S.; Chae, M.K.; Lee, S.Y.; Lee, E.J. Anti-inflammatory effect of quercetin in a whole orbital tissue culture of Graves’ orbitopathy. Br. J. Ophthalmol. 2012, 96, 1117–1121. [Google Scholar] [CrossRef] [PubMed]
- Rieger, A.M.; Nelson, K.L.; Konowalchuk, J.D.; Barreda, D.R. Modified annexin V/propidium iodide apoptosis assay for accurate assessment of cell death. J. Vis. Exp. 2011, 50, 2597. [Google Scholar] [CrossRef] [PubMed]
- Smith, H.O.; Tiffany, M.F.; Qualls, C.R.; Key, C.R. The rising incidence of adenocarcinoma relative to squamous cell carcinoma of the uterine cervix in the United States-a 24-year population-based study. Gynecol. Oncol. 2000, 78, 97–105. [Google Scholar] [CrossRef]
- Chang, T.W.; Chen, C.C.; Chen, K.Y.; Su, J.H.; Chang, J.H.; Chang, M.C. Ribosomal phosphoprotein P0 interacts with GCIP and overexpression of P0 is associated with cellular proliferation in breast and liver carcinoma cells. Oncogene 2008, 27, 332–338. [Google Scholar] [CrossRef] [PubMed]
- Akanuma, G.; Nanamiya, H.; Natori, Y.; Yano, K.; Suzuki, S.; Omata, S. Inactivation of ribosomal protein genes in Bacillus subtilis reveals importance of each ribosomal protein for cell proliferation and cell differentiation. J. Bacteriol. 2012, 194, 6282–6291. [Google Scholar] [CrossRef]
- Elmore, S. Apoptosis: A Review of Programmed Cell Death. Toxicol. Pathol. 2007, 35, 495–516. [Google Scholar] [CrossRef]
- Ito, S.; Ihara, T.; Tamura, H.; Tanaka, S.; Ikeda, T.; Kajihara, H. A-tomatine, the major saponin in tomato, induces programmed cell death mediated by reactive oxygen species in the fungal pathogen Fusarium oxysporum. FEBS. Lett. 2007, 581, 3217–3222. [Google Scholar] [CrossRef]
- Shi, M.; Chen, L.; Wang, X.W.; Zhang, T.; Zhao, P.B.; Song, X.Y. Antimicrobial peptaibols from Trichoderma pseudokoningii induce programmed cell death in plant fungal pathogens. Microbiology 2012, 158, 166–175. [Google Scholar] [CrossRef]
- Wang, H.M.; Lei, Y.; Yan, L.Y.; Wan, L.Y.; Ren, X.P.; Chen, S.L. Functional genomic analysis of Aspergillus flavus interacting with resistant and susceptible peanut. Toxins 2016, 8, 46. [Google Scholar] [CrossRef] [PubMed]
- Chang, P.K. The Aspergillus parasiticus protein AFLJ interacts with the aflatoxin pathway-specific regulator AFLR. Mol. Genet. Genom. 2003, 268, 711–719. [Google Scholar]
- Calvo, A.M.; Cary, J.W. Association of fungal secondary metabolism and sclerotial biology. Front. Microbiol. 2015, 6, 62. [Google Scholar] [CrossRef] [PubMed]
- Yao, G.S.; Yue, Y.W.; Fu, Y.S.; Fang, Z.; Xu, Z.L.; Ma, G.L. Exploration of the regulatory mechanism of secondary metabolism by comparative transcriptomics in Aspergillus flavus. Front. Microbiol. 2018, 9, 1568–1583. [Google Scholar]
- Benvenuto, M.; Sileri, P.; Rossi, P.; Masuelli, L.; Fantini, M.; Nanni, M. Natural humoral immune response to ribosomal P0 protein in colorectal cancer patients. J. Trans. Med. 2015, 13, 101. [Google Scholar] [CrossRef] [PubMed]
- Remacha, M.; Jimenez-Diaz, A.; Santos, C.; Briones, E.; Zambrano, R.; Rodriguez-Gabriel, M.A. Proteins P1, P2, and P0, components of the eukaryotic ribosome stalk. New structural and functional aspects. Biochem. Cell Biol. 1995, 73, 959–968. [Google Scholar] [CrossRef]
- Zhang, Y.F.; Zhang, B.C.; Zhang, A.R.; Wu, T.T.; Liu, J.; Yu, L.F.; Wang, W.-X.; Gao, J.-F.; Fang, D.-C.; Rao, Z.-G. Co-transduction of ribosomal protein L23 enhances the therapeutic efficacy of adenoviral-mediated p53 gene transfer in human gastric cancer. Oncol. Rep. 2013, 30, 1989–1995. [Google Scholar] [CrossRef]
- Qi, Y.K.; Li, X.; Chang, C.K.; Xu, F.; He, Q.; Zhao, Y.S. Ribosomal protein L23 negatively regulates cellular apoptosis via the RPL23/Miz-1/c-Myc circuit in higher-risk myelodysplastic syndrome. Sci. Rep. 2016, 7, 2323. [Google Scholar] [CrossRef]
- Pidutti, P.; Federici, F.; Brandi, J.; Manna, L.; Rizzi, E.; Marini, U. Purification and characterization of ribosomal proteins L27 and L30 having antimicrobial activity produced by the Lactobacillus salivarius SGL03. J. Appl. Microbiol. 2017, 124, 398–407. [Google Scholar] [CrossRef]
- Smolock, E.M.; Korshunov, V.A.; Glazko, G.; Qiu, X.; Gerloff, J.; Berk, B.C. Ribosomal Protein L17, RpL17, is an Inhibitor of Vascular Smooth Muscle Growth and Carotid Intima Formation. Circulation 2012, 126, 2418–2427. [Google Scholar] [CrossRef] [Green Version]
- Mina, H.; Kim, H.R.; Kim, I. Ribosomal protein L19 overexpression activates the unfolded protein response and sensitizes MCF7 breast cancer cells to endoplasmic reticulum stress-induced cell death. Biochem. Biophs. Res. Commun. 2014, 450, 673–678. [Google Scholar]
- Bee, A.; Brewer, D.; Beesley, C.; Dodson, A.; Forootan, S.; Dickinson, T. SiRNA knockdown of ribosomal protein gene RPL19 abrogates the aggressive phenotype of human prostate cancer. PLoS ONE 2011, 6, e22672. [Google Scholar] [CrossRef]
- Cao, B.; Fang, Z.L.; Liao, P.; Zhou, X.; Xiong, J.P.; Zeng, S. Cancer-mutated ribosome protein L22 (RPL22/eL22) suppresses cancer cell survival by blocking p53-MDM2 circuit. Oncotarget 2017, 8, 90651–90661. [Google Scholar] [CrossRef] [PubMed] [Green Version]
- Fan, H.J.; Li, J.; Jia, Y.X.; Wu, J.J.; Yuan, L.; Li, M.J. Silencing of ribosomal protein L34 (RPL34) inhibits the proliferation and invasion of esophageal cancer cells. Oncol. Res. 2017, 25, 1061–1068. [Google Scholar] [CrossRef] [PubMed]
- Wei, F.; Ding, L.J.; Wei, Z.T.; Zhang, Y.D.; Li, Y.; Luo, Q.H. Ribosomal protein L34 promotes the proliferation, invasion and metastasis of pancreatic cancer cells. Oncotarget 2016, 7, 85259–85272. [Google Scholar] [CrossRef] [PubMed] [Green Version]
- Wu, Q.; Gou, Y.; Wang, Q.; Jin, H.; Cui, L.; Zhang, Y. Downregulation of RPL6 by siRNA inhibits proliferation and cell cycle progression of human gastric cancer cell lines. PLoS ONE 2011, 6, e26401. [Google Scholar] [CrossRef]
- Guo, X.; Shi, Y.; Gou, Y.; Li, J.; Han, S.; Zhang, Y. Human ribosomal protein S13 promotes gastric cancer growth through down-regulating p27(Kip1). J. Cell Mol. Med. 2011, 15, 296–306. [Google Scholar] [CrossRef]
- Li, Y.; Dong, W.; Shi, Y.; Deng, F.; Chen, X.; Wan, C.; Zhou, M.; Zhao, L.; Fu, Z.F.; Peng, G. Rabies virus phosphoprotein interacts with ribosomal protein L9 and affects rabies virus replication. Virology 2016, 488, 216–224. [Google Scholar] [CrossRef] [Green Version]
- Langmead, B.; Salzberg, S.L. Fast gapped-read alignment with Bowtie 2. Nat. Methods 2012, 9, 357. [Google Scholar] [CrossRef]
- Mortazavi, A.; Williams, B.A.; McCue, K.; Schaeffer, L.; Word, B. Mapping and quantifying mammalian transcriptomes by RNA-Seq. Nat. Methods 2008, 7, 621–628. [Google Scholar] [CrossRef]
- Robinson, M.D.; McCarthy, D.J.; Smyth, G.K. edgeR: A Bioconductor package for differential expression analysis of digital gene expression data. Bioinformatics 2010, 26, 139–140. [Google Scholar] [CrossRef] [PubMed]
- Kanehisa, M.; Araki, M.; Goto, S.; Hattori, M.; Hirakawa, M.; Itoh, M. KEGG for linking genomes to life and the environment. Nucleic Acids Res. 2008, 36, D480–D484. [Google Scholar] [CrossRef] [PubMed]
Figure 1.
Quercetin inhibits the proliferation of A. f lavus. (A,B) A. flavus cells were treated with quercetin from 50 μg/mL to 800 μg/mL for 24 h at 30 °C. MIC value was calculated using SPSS 17.0. CON (untreated whih quercetin). (C) A. flavus cells were treated with quercetin from 50 μg/mL to 800 μg/mL for 24 h at 30 °C. For each treatment, the growth of A. f lavus was determined by automated absorbance measurements at 600 nm, detected absorption value every hour. (D,E) A. flavus cells were treated with quercetin (50, 100, 200, 400 and 505 μg/mL) for 24 h at 30 °C, the A. flavus solution was sucked out of the 96-well plate, centrifuged at 8000 rpm for 5 min, washed with quercetin, and then suspended the A. flavus with 0.9% normal saline. The washed A. flavus was then coated onto potato dextrose agar (PDA) plates, and the single colony was cultured for counting. All data were expressed as mean ± standard deviation (n = 3).

Figure 2.
Morphological changes of A. flavus. A. flavus cells were treated with quercetin at 200 μg/mL for 24 h at 30 °C, and then the morphological changes of A. flavus were observed by the light microscope with a 100-fold oil mirror. CON (untreated with quercetin).
Figure 2.
Morphological changes of A. flavus. A. flavus cells were treated with quercetin at 200 μg/mL for 24 h at 30 °C, and then the morphological changes of A. flavus were observed by the light microscope with a 100-fold oil mirror. CON (untreated with quercetin).

Figure 3.
Quercetin induces A. flavus apoptosis. (A) Phosphatidylserine externalization, Spores (107 CFU/mL) were treated with quercetin at 200 μg/mL. After 24 h, A. flavus cells were harvested and double-stained for 30 min with Annexin V-FITC/PI, to test for apoptosis. The cells were analyzed by a fluorescence microscope (20×). (B) Hochest 33342. Spores (107 CFU/mL) were treated with quercetin for 24 h at 200 μg/mL, and then A. flavus cells were stained with Hochest 33342, a blue fluorescent dye to stain DNA, to test for nuclear. The cells were analyzed by a fluorescence microscope (20×). (C) Reactive oxygen species. Spores (107 CFU/mL) were treated with quercetin for 24 h at 200 μg/mL, and then A. flavus cells were stained and analyzed by using Muse® Cell Analyzer. A. flavus cells untreated with quercetin were used as the control.

Figure 4.
Relative lives of aflS mRNA from A. flavus exposed to quercetin for 24 h. The expression of aflS was quantified by SYBR quantitative polymerase chain reaction (qPCR) assay. A. flavus cells untreated with quercetin were used as the control. Data are presented with mean ± standard deviation (n = 5). ** p < 0.01, compared with the control group.


Table 1.
Transcriptional activity of genes involved in A. flavus development.
| Gene ID | Gene Length | Means-CK | Means-QT | log2(Fold Change) | Probability | Description |
|---|---|---|---|---|---|---|
| AFLA_020210 | 1362 | 370.1433333 | 64.65666667 | −2.517213007 | 0.885380738 | sexual development transcription factor NsdD |
| AFLA_048650 | 2100 | 156.1633333 | 38.95 | −2.00336052 | 0.844491613 | sexual development transcription factor SteA |
| AFLA_018540 | 1068 | 67.02666667 | 14.44666667 | −2.213998536 | 0.81499661 | G protein complex alpha subunit GpaB |
| AFLA_046990 | 2370 | 200.3033333 | 75.34333333 | −1.410634662 | 0.8049291 | APSES transcription factor StuA |
| AFLA_083110 | 255 | 766.0933333 | 24.60333333 | −4.960594472 | 0.950709 | conidiation-specific protein Con-10 |
| AFLA_044790 | 309 | 525.2933333 | 124.2433333 | −2.079954833 | 0.873234869 | conidiation-specific family protein |
CK, untreated with quercetin; QT, treated with quercetin.
Table 2.
Ribosomal protein of differentially expressed genes when A. flavus was treated with quercetin.
Table 2.
Ribosomal protein of differentially expressed genes when A. flavus was treated with quercetin.
| NO. | Gene Name | Means-CK | Means-QT | log2(Fold Change) | Up-Down-Regulation (QT/CK) | Description |
|---|---|---|---|---|---|---|
| 1 | AFLA_047870 | 2358.77 | 2.84 | −1.920818 | Down | 40S ribosomal protein S1 |
| 2 | AFLA_034340 | 976.7166667 | 6.739345 | −2.16111509 | Down | 40S ribosomal protein S10b |
| 3 | AFLA_050800 | 723.8966667 | 1.4697534 | −1.69897 | Down | 40S ribosomal protein S12 |
| 4 | AFLA_075030 | 802.26 | 9.62712 | −1.92081875 | Down | 40S ribosomal protein S13 |
| 5 | AFLA_044170 | 765.6133333 | 3.8280665 | −2.30102999 | Down | 40S ribosomal protein S14 |
| 6 | AFLA_044530 | 2185.433333 | 34.966928 | −1.795880017 | Down | 40S ribosomal protein S15 |
| 7 | AFLA_044110 | 763.1666667 | 9.9211671 | −1.886056647 | Down | 40S ribosomal protein S16 |
| 8 | AFLA_125890 | 2183.286667 | 43.66574 | −1.69897 | Down | 40S ribosomal protein S17 |
| 9 | AFLA_009000 | 1360.496667 | 34.012425 | −1.602059991 | Down | 40S ribosomal protein S18 |
| 10 | AFLA_050650 | 898.7666667 | 20.6716341 | −1.638272164 | Down | 40S ribosomal protein S19 |
| 11 | AFLA_117990 | 651.8966667 | 23.4682812 | −1.443697016 | Down | 40S ribosomal protein S2 |
| 12 | AFLA_043150 | 1318.843333 | 44.840662 | −1.468521082 | Down | 40S ribosomal protein S20 |
| 13 | AFLA_092120 | 8890.06 | 515.62348 | −1.236572001 | Down | 40S ribosomal protein S21 |
| 14 | AFLA_083740 | 680.39 | 6.8039 | −2.067506415 | Down | 40S ribosomal protein S22 |
| 15 | AFLA_021730 | 846.6866667 | 3.3867468 | −2.399868277 | Down | 40S ribosomal protein S23 |
| 16 | AFLA_071320 | 1901.14 | 7.60456 | −2.397940008 | Down | 40S ribosomal protein S24 |
| 17 | AFLA_083050 | 5390.12 | 29.64566 | −2.259637311 | Down | 40S ribosomal protein S25 |
| 17 | AFLA_127800 | 4272.09 | 26.059749 | −2.214670164 | Down | 40S ribosomal protein S26 |
| 18 | AFLA_083470 | 140.9033333 | 2.5362594 | −1.744727494 | Down | 40S ribosomal protein S28 |
| 19 | AFLA_101020 | 1328.043333 | 55.77806 | −1.37675071 | Down | 40S ribosomal protein S4 |
| 20 | AFLA_084620 | 1535.576667 | 16.89347 | −1.958607314 | Down | 40S ribosomal protein S5 |
| 21 | AFLA_026830 | 2783.25 | 125.24625 | −1.346787486 | Down | 40S ribosomal protein S6 |
| 22 | AFLA_029020 | 3209.673333 | 8954.783333 | −1.48148606 | Down | 40S ribosomal protein S8 |
| 23 | AFLA_101160 | 832.2533333 | 1.747731999 | −2.677780753 | Down | 40S ribosomal protein S9 |
| 24 | AFLA_030140 | 259.6833333 | 929.63 | 1.839903203 | Down | 60S acidic ribosomal protein P0 |
| 25 | AFLA_127860 | 264.4766667 | 10.05011333 | −1.420216403 | Down | 60S acidic ribosomal protein P1 |
| 26 | AFLA_044520 | 984.8466667 | 2.659086 | −2.568636235 | Down | 60S acidic ribosomal protein P2 |
| 27 | AFLA_068000 | 765.0433333 | 1.606590999 | −2.677780705 | Down | 60S ribosomal protein L1 |
| 28 | AFLA_112090 | 1100.716667 | 7.1546583 | −2.187086643 | Down | 60S ribosomal protein L11 |
| 29 | AFLA_080140 | 1298.606667 | 37.659593 | −1.537602002 | Down | 60S ribosomal protein L12 |
| 30 | AFLA_115110 | 943.4 | 9.24532 | −2.008773924 | Down | 60S ribosomal protein L13 |
| 31 | AFLA_056250 | 879.56 | 22.86856 | −1.585026652 | Down | 60S ribosomal protein L14 |
| 32 | AFLA_029260 | 633.1733333 | 16.14591999 | −1.593459819 | Down | 60S ribosomal protein L15, putative |
| 33 | AFLA_050000 | 1516.85 | 32.612275 | −1.66756154 | Down | 60S ribosomal protein L16 |
| 34 | AFLA_041990 | 1251.423333 | 4533.676667 | 1.857111595 | Up | 60S ribosomal protein L17 |
| 35 | AFLA_047440 | 2671.72 | 35.266704 | −1.879426068 | Down | 60S ribosomal protein L18 |
| 36 | AFLA_046970 | 2952.823333 | 8912.88 | 1.593796639 | Up | 60S ribosomal protein L19 |
| 37 | AFLA_048810 | 2272.563333 | 163.6245599 | −1.136677139 | Down | 60S ribosomal protein L2 |
| 38 | AFLA_029450 | 670.29 | 7.37319 | −1.958607314 | Down | 60S ribosomal protein L20 |
| 39 | AFLA_101150 | 2427.973333 | 41.2755466 | −1.769551078 | Down | 60S ribosomal protein L21 |
| 40 | AFLA_079880 | 233.58 | 1312.223333 | 2.490024624 | Up | 60S ribosomal protein L22 |
| 41 | AFLA_092370 | 1086.093333 | 13.25033866 | −1.913640169 | Down | 60S ribosomal protein L23 |
| 42 | AFLA_092370 | 1387.563333 | 70.76572998 | −1.292429823 | Down | 60S ribosomal protein L24 |
| 43 | AFLA_048140 | 2383.7 | 165.66715 | −1.155522824 | Down | 60S ribosomal protein L25 |
| 44 | AFLA_110470 | 188.4966667 | 9.481382335 | −1.298432014 | Down | 60S ribosomal protein L25, putative |
| 45 | AFLA_060150 | 2232.186667 | 13.39312 | −2.221848749 | Down | 60S ribosomal protein L26 |
| 46 | AFLA_127220 | 862.0833333 | 13.44849999 | −1.806875401 | Down | 60S ribosomal protein L27 |
| 47 | AFLA_054760 | 1163.723333 | 8.0296909 | −2.161150909 | Down | 60S ribosomal protein L28 |
| 48 | AFLA_103770 | 1127.98 | 10.039022 | −2.050609993 | Down | 60S ribosomal protein L28 |
| 49 | AFLA_134740 | 1447.586667 | 50.66553335 | −1.455931955 | Down | 60S ribosomal protein L3 |
| 50 | AFLA_045790 | 2011.47 | 43.246605 | −1.66756154 | Down | 60S ribosomal protein L30 |
| 51 | AFLA_045790 | 1371.076667 | 4046.166667 | −1.561246503 | Down | 60S ribosomal protein L31 |
| 52 | AFLA_003480 | 11,949.94667 | 33,519.81333 | 1.488009936 | Up | 60S ribosomal protein L32 |
| 53 | AFLA_086630 | 1485.253333 | 2.673455999 | −2.744727494 | Down | 60S ribosomal protein L33 |
| 54 | AFLA_086630 | 2061.426667 | 18.55284 | −2.04575749 | Down | 60S ribosomal protein L34 |
| 55 | AFLA_086630 | 1270.083333 | 5.715374999 | −2.346787486 | Down | 60S ribosomal protein L35 |
| 56 | AFLA_112390 | 832.9033333 | 4.164516667 | −2.301029995 | Down | 60S ribosomal protein L36 |
| 57 | AFLA_112390 | 3332.77 | 39.99324 | −1.920818753 | Down | 60S ribosomal protein L37 |
| 58 | AFLA_112390 | 1112.88 | 14.244864 | −1.89279003 | Down | 60S ribosomal protein L38 |
| 59 | AFLA_112390 | 1971.986667 | 29.77699867 | −1.821023052 | Down | 60S ribosomal protein L42 |
| 60 | AFLA_112390 | 3816.61 | 106.483419 | −1.554395796 | Down | 60S ribosomal protein L43 |
| 61 | AFLA_018700 | 1022.05 | 17.885875 | −1.732828271 | Down | 60S ribosomal protein L5 |
| 62 | AFLA_068420 | 3303.43 | 87.540895 | −1.576754126 | Down | 60S ribosomal protein L6 |
| 63 | AFLA_041710 | 1208.193333 | 5.255640998 | −2.361510743 | Down | 60S ribosomal protein L7 |
| 64 | AFLA_033980 | 1874.96 | 88.12312 | −1.327902142 | Down | 60S ribosomal protein L8 |
| 65 | AFLA_088370 | 686.0866667 | 3323.653333 | 2.276307178 | Up | 60S ribosomal protein L9 |
© 2019 by the authors. Licensee MDPI, Basel, Switzerland. This article is an open access article distributed under the terms and conditions of the Creative Commons Attribution (CC BY) license (http://creativecommons.org/licenses/by/4.0/).
Share and Cite
MDPI and ACS Style
Li, X.-M.; Li, Z.-Y.; Wang, Y.-D.; Wang, J.-Q.; Yang, P.-L. Quercetin Inhibits the Proliferation and Aflatoxins Biosynthesis of Aspergillus flavus. Toxins 2019, 11, 154. https://0-doi-org.brum.beds.ac.uk/10.3390/toxins11030154
AMA Style
Li X-M, Li Z-Y, Wang Y-D, Wang J-Q, Yang P-L. Quercetin Inhibits the Proliferation and Aflatoxins Biosynthesis of Aspergillus flavus. Toxins. 2019; 11(3):154. https://0-doi-org.brum.beds.ac.uk/10.3390/toxins11030154
Chicago/Turabian StyleLi, Xiu-Mei, Zhong-Yuan Li, Ya-Dong Wang, Jin-Quan Wang, and Pei-Long Yang. 2019. "Quercetin Inhibits the Proliferation and Aflatoxins Biosynthesis of Aspergillus flavus" Toxins 11, no. 3: 154. https://0-doi-org.brum.beds.ac.uk/10.3390/toxins11030154
Note that from the first issue of 2016, this journal uses article numbers instead of page numbers. See further details here.