Multi LC-MS/MS and LC-HRMS Methods for Determination of 24 Mycotoxins including Major Phase I and II Biomarker Metabolites in Biological Matrices from Pigs and Broiler Chickens

 , , ,
, , ,  and
and
Abstract
:1. Introduction
2. Results and Discussion
2.1. Method Development
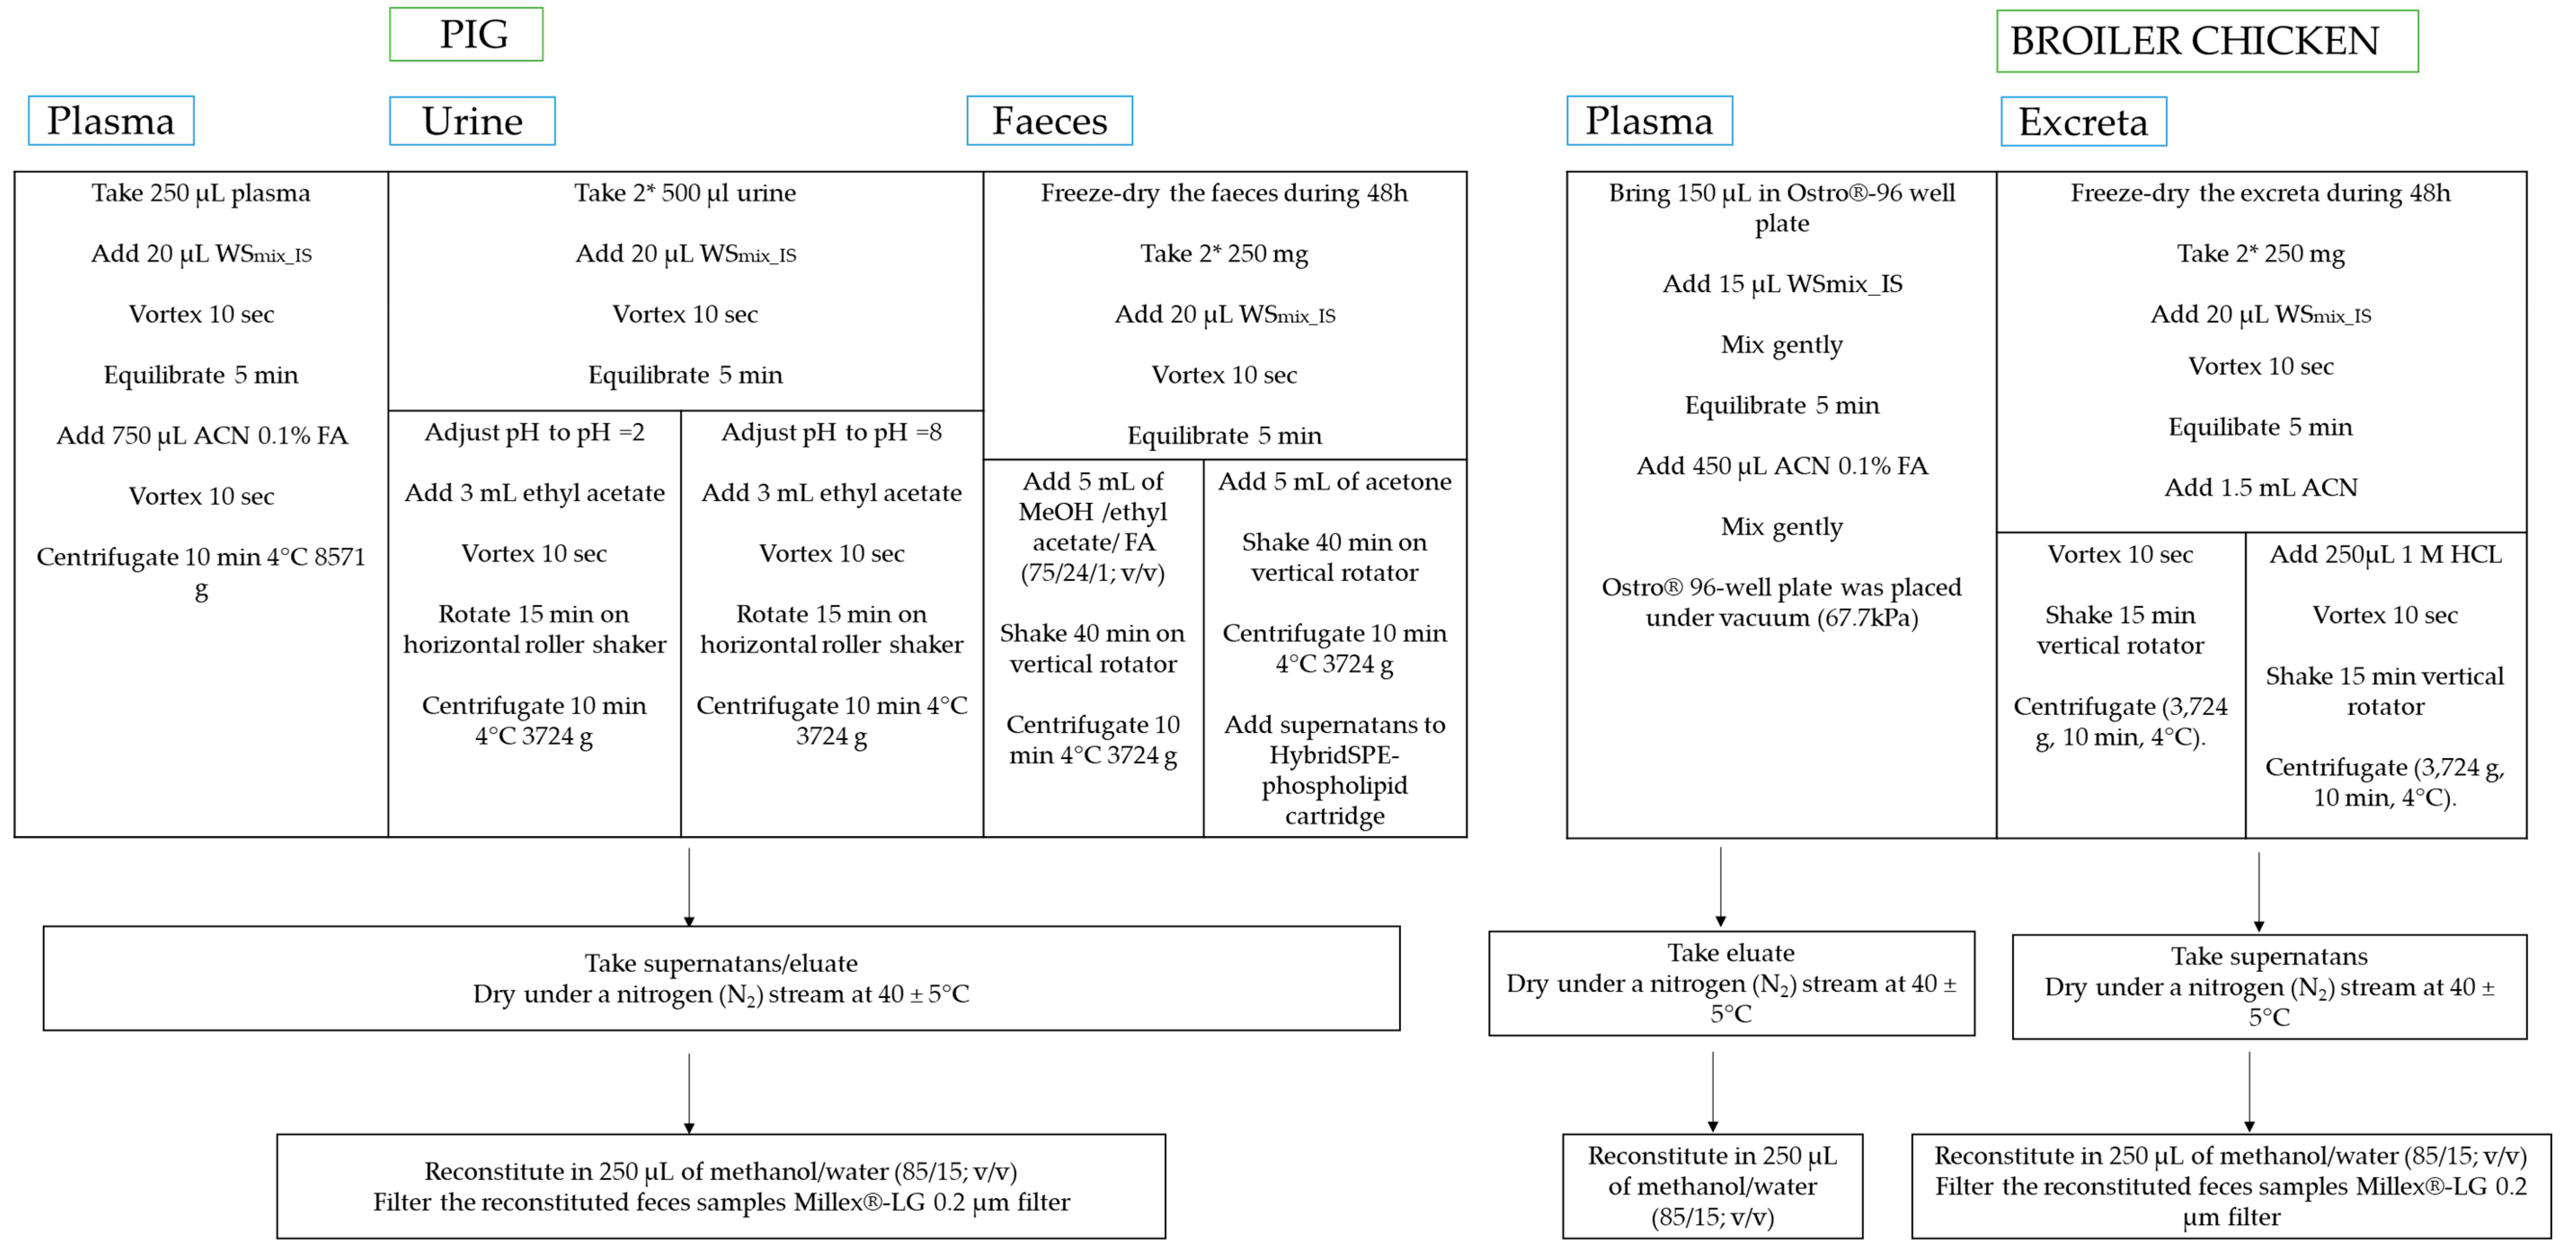
2.1.1. Sample Preparation and Extraction
Pig and Chicken Plasma
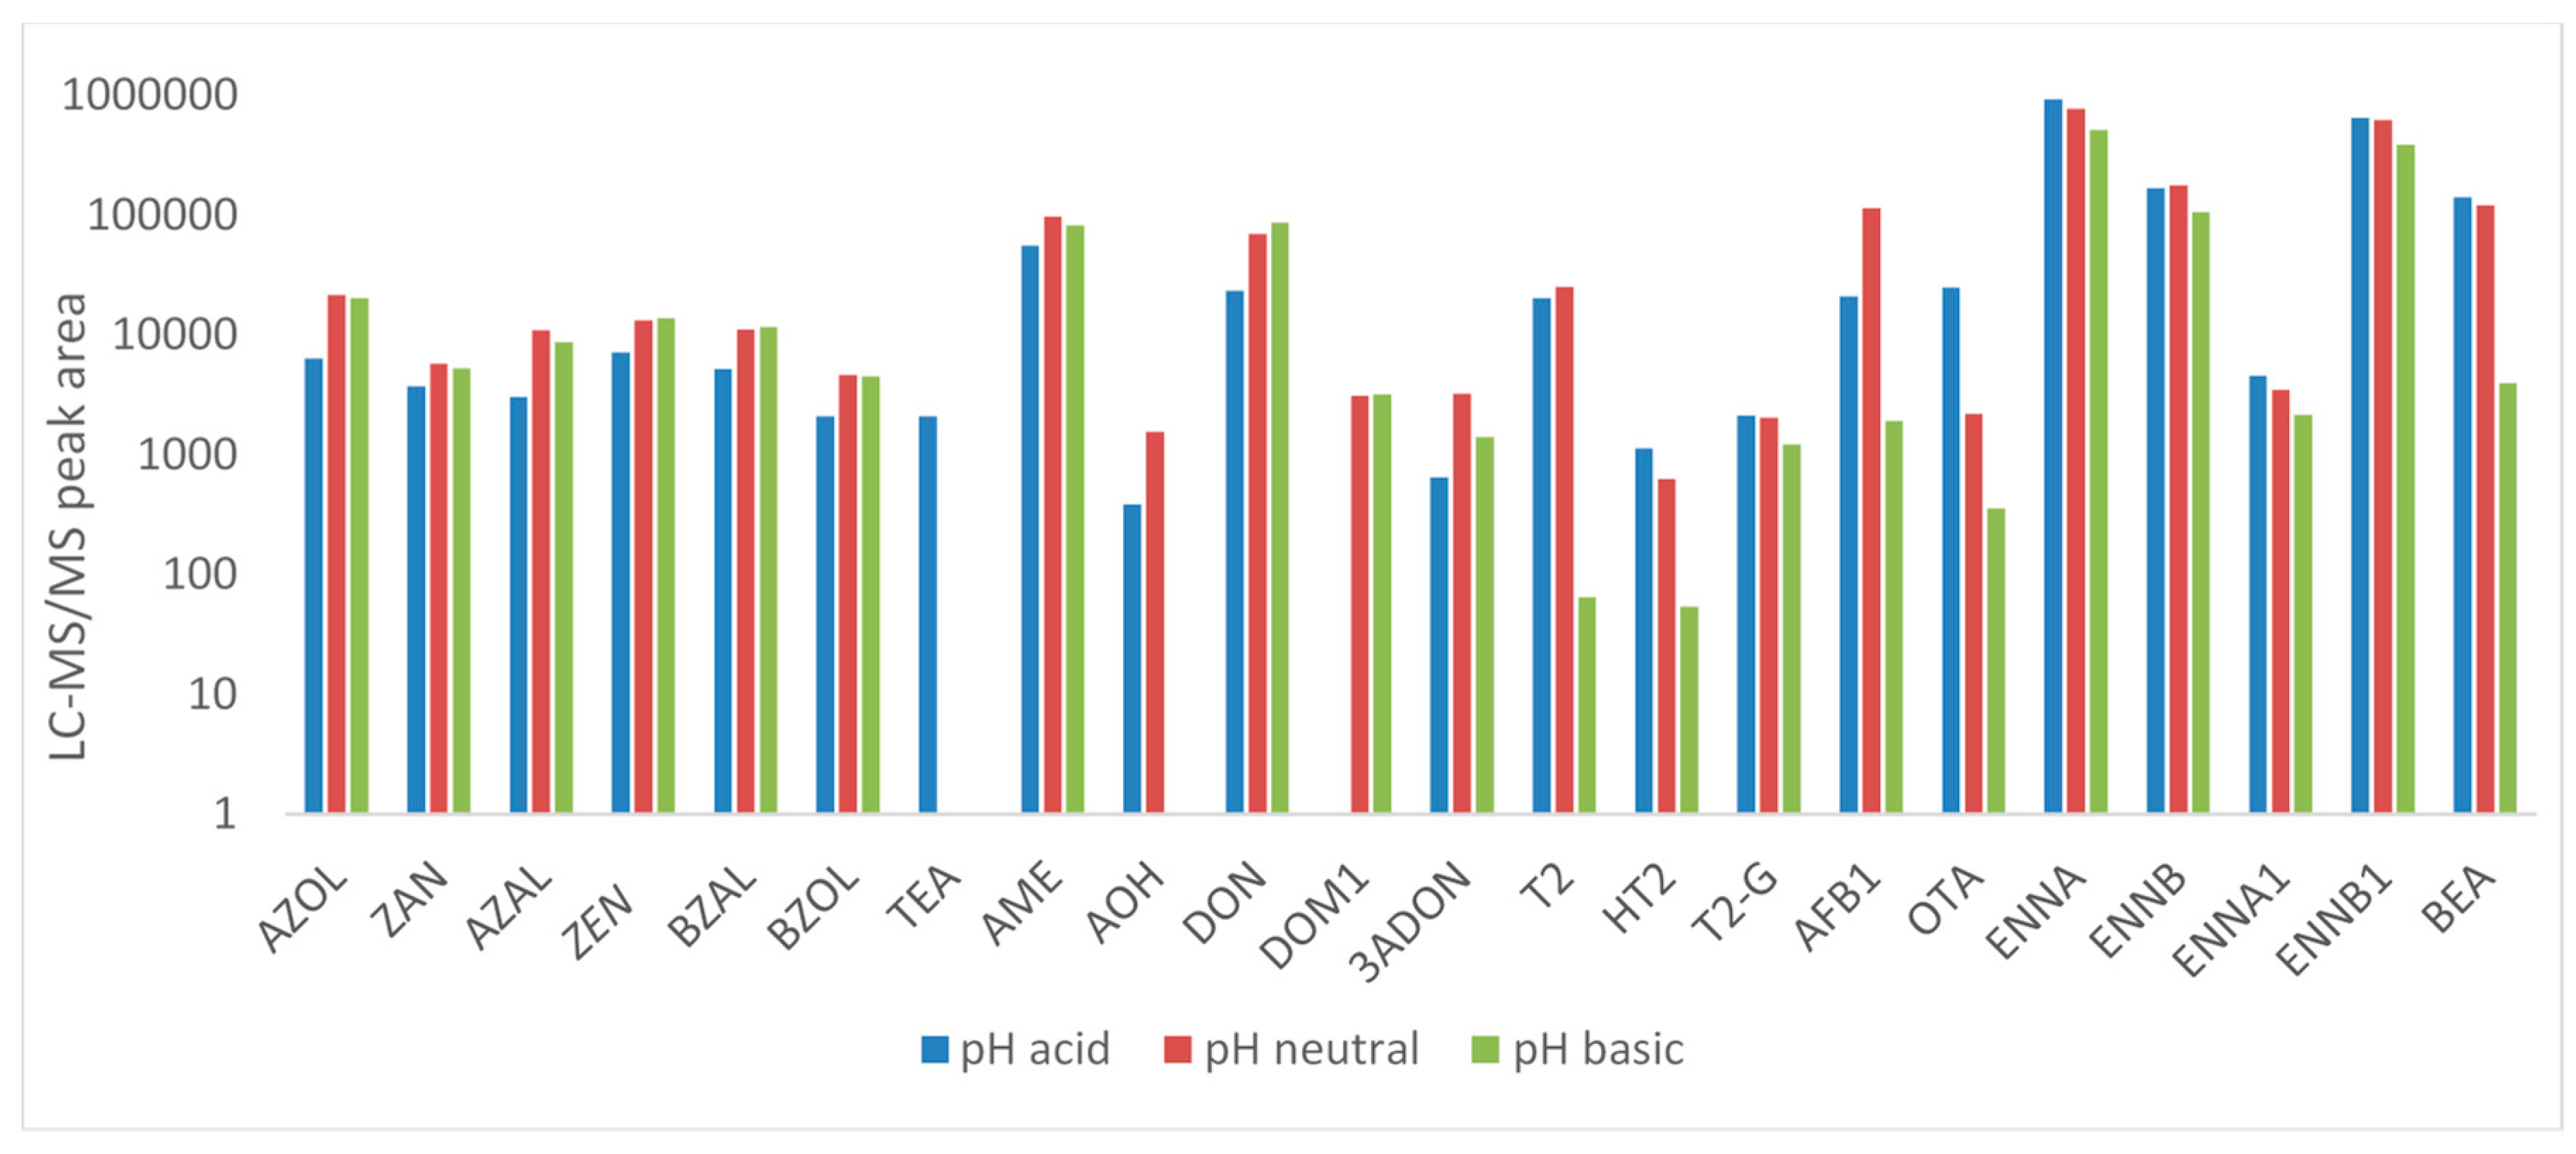
Pig Urine
Chicken Excreta
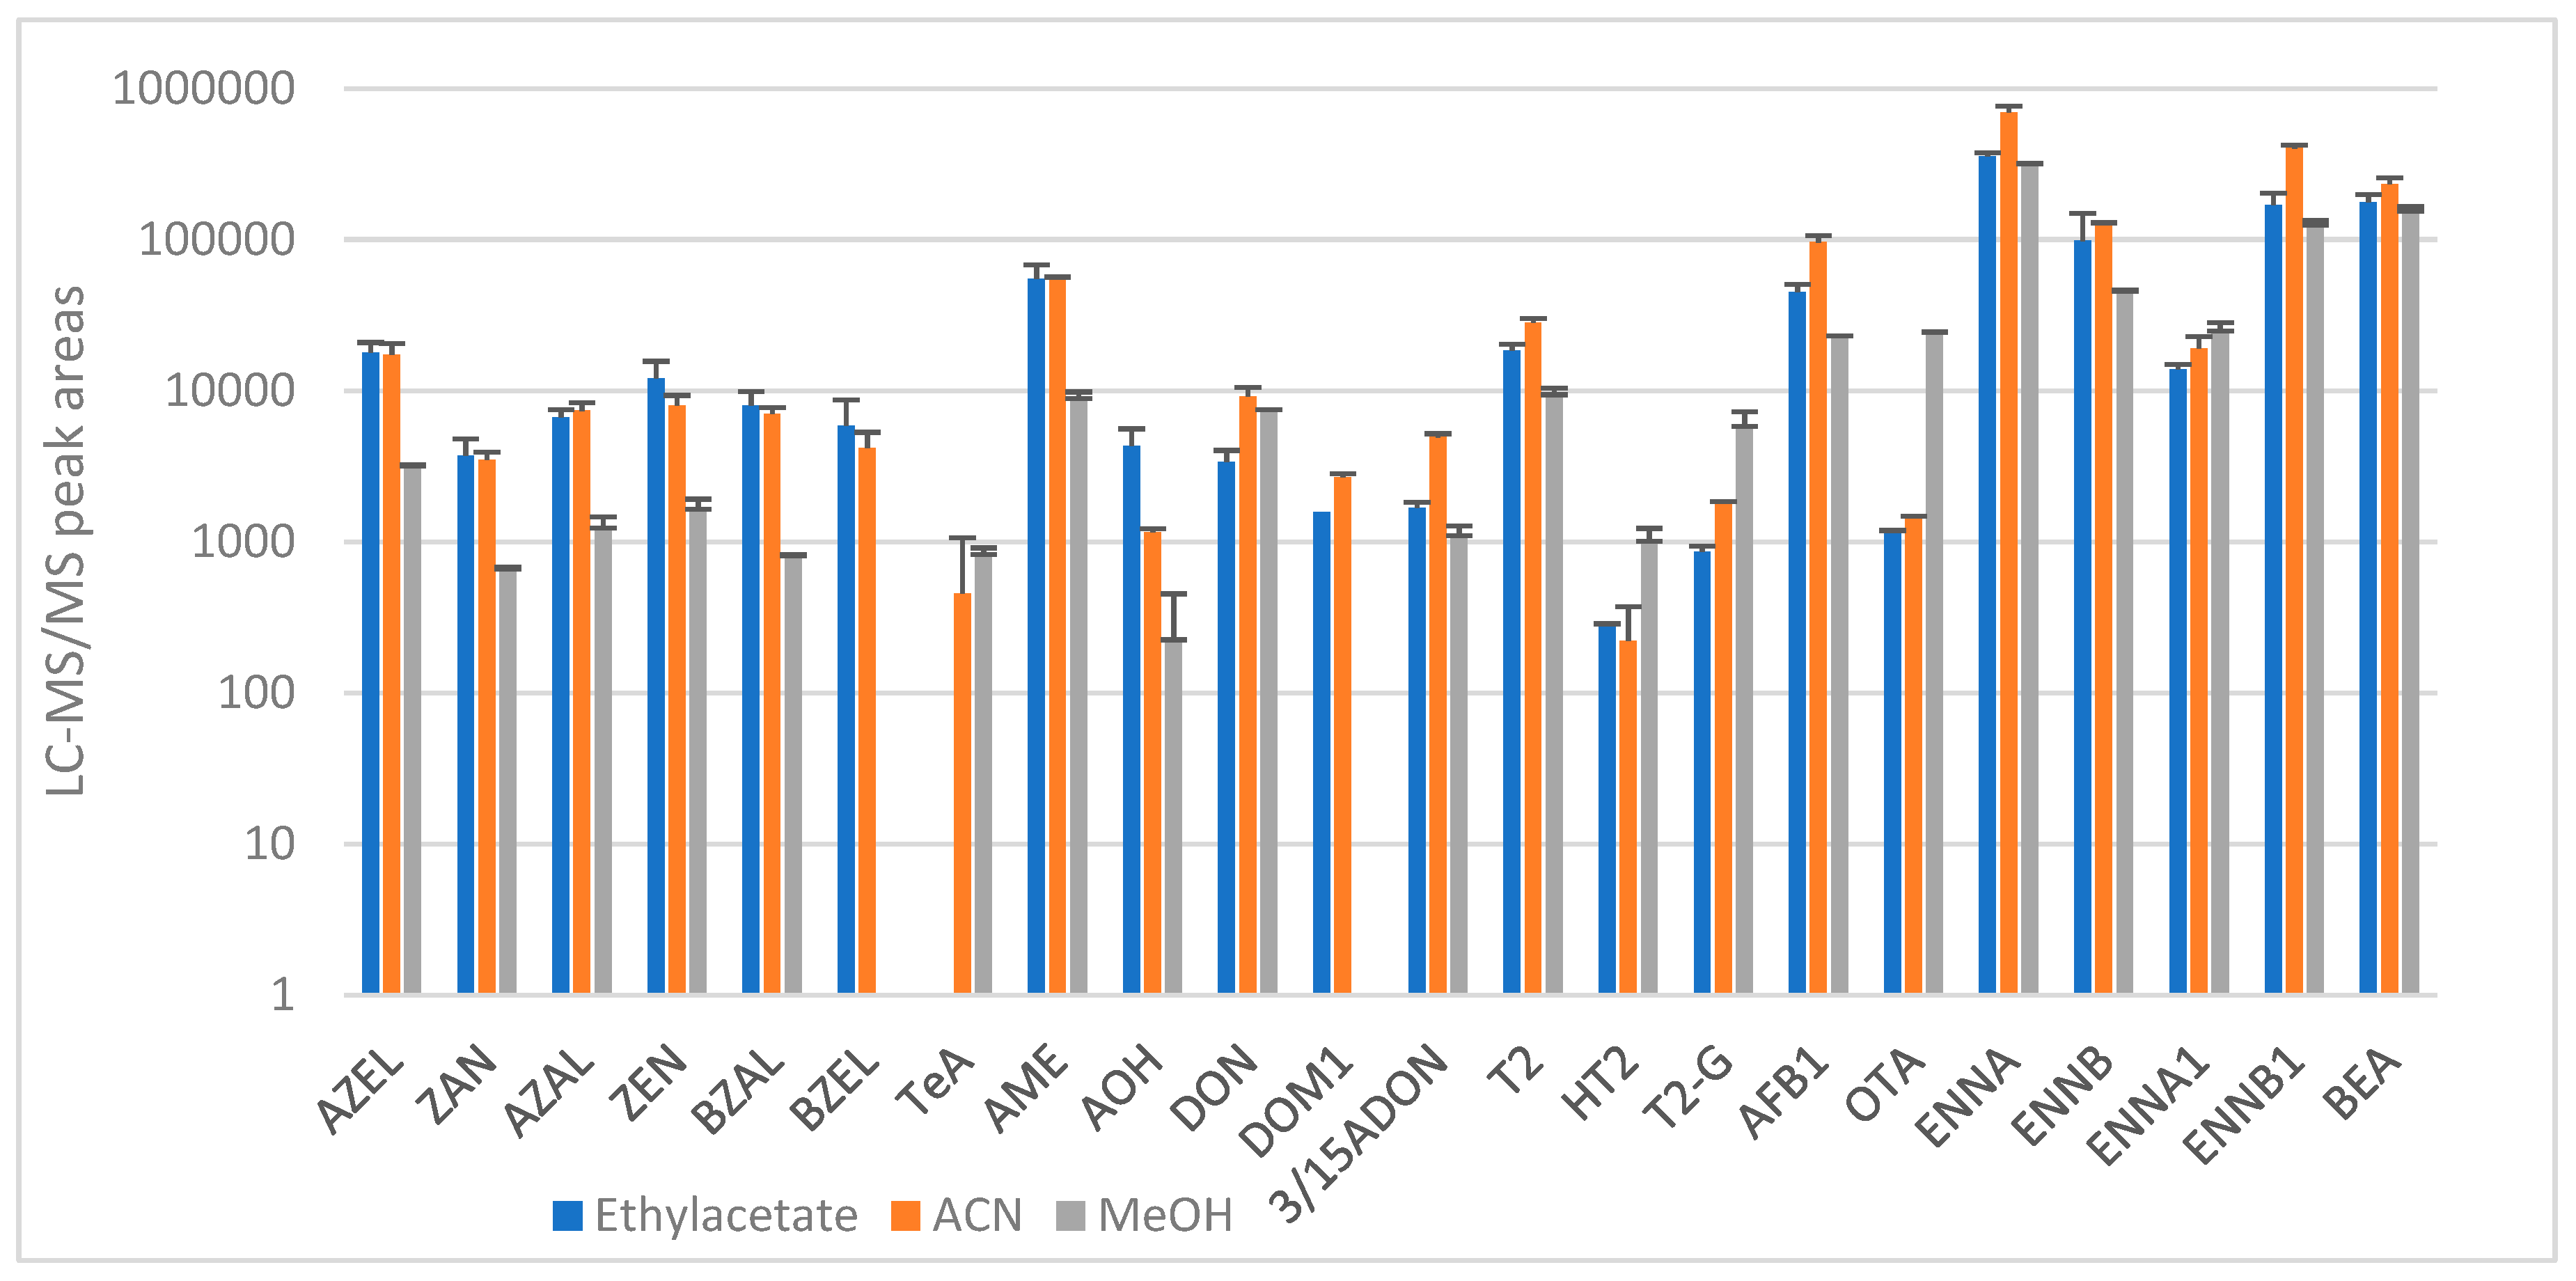
Pig Feces
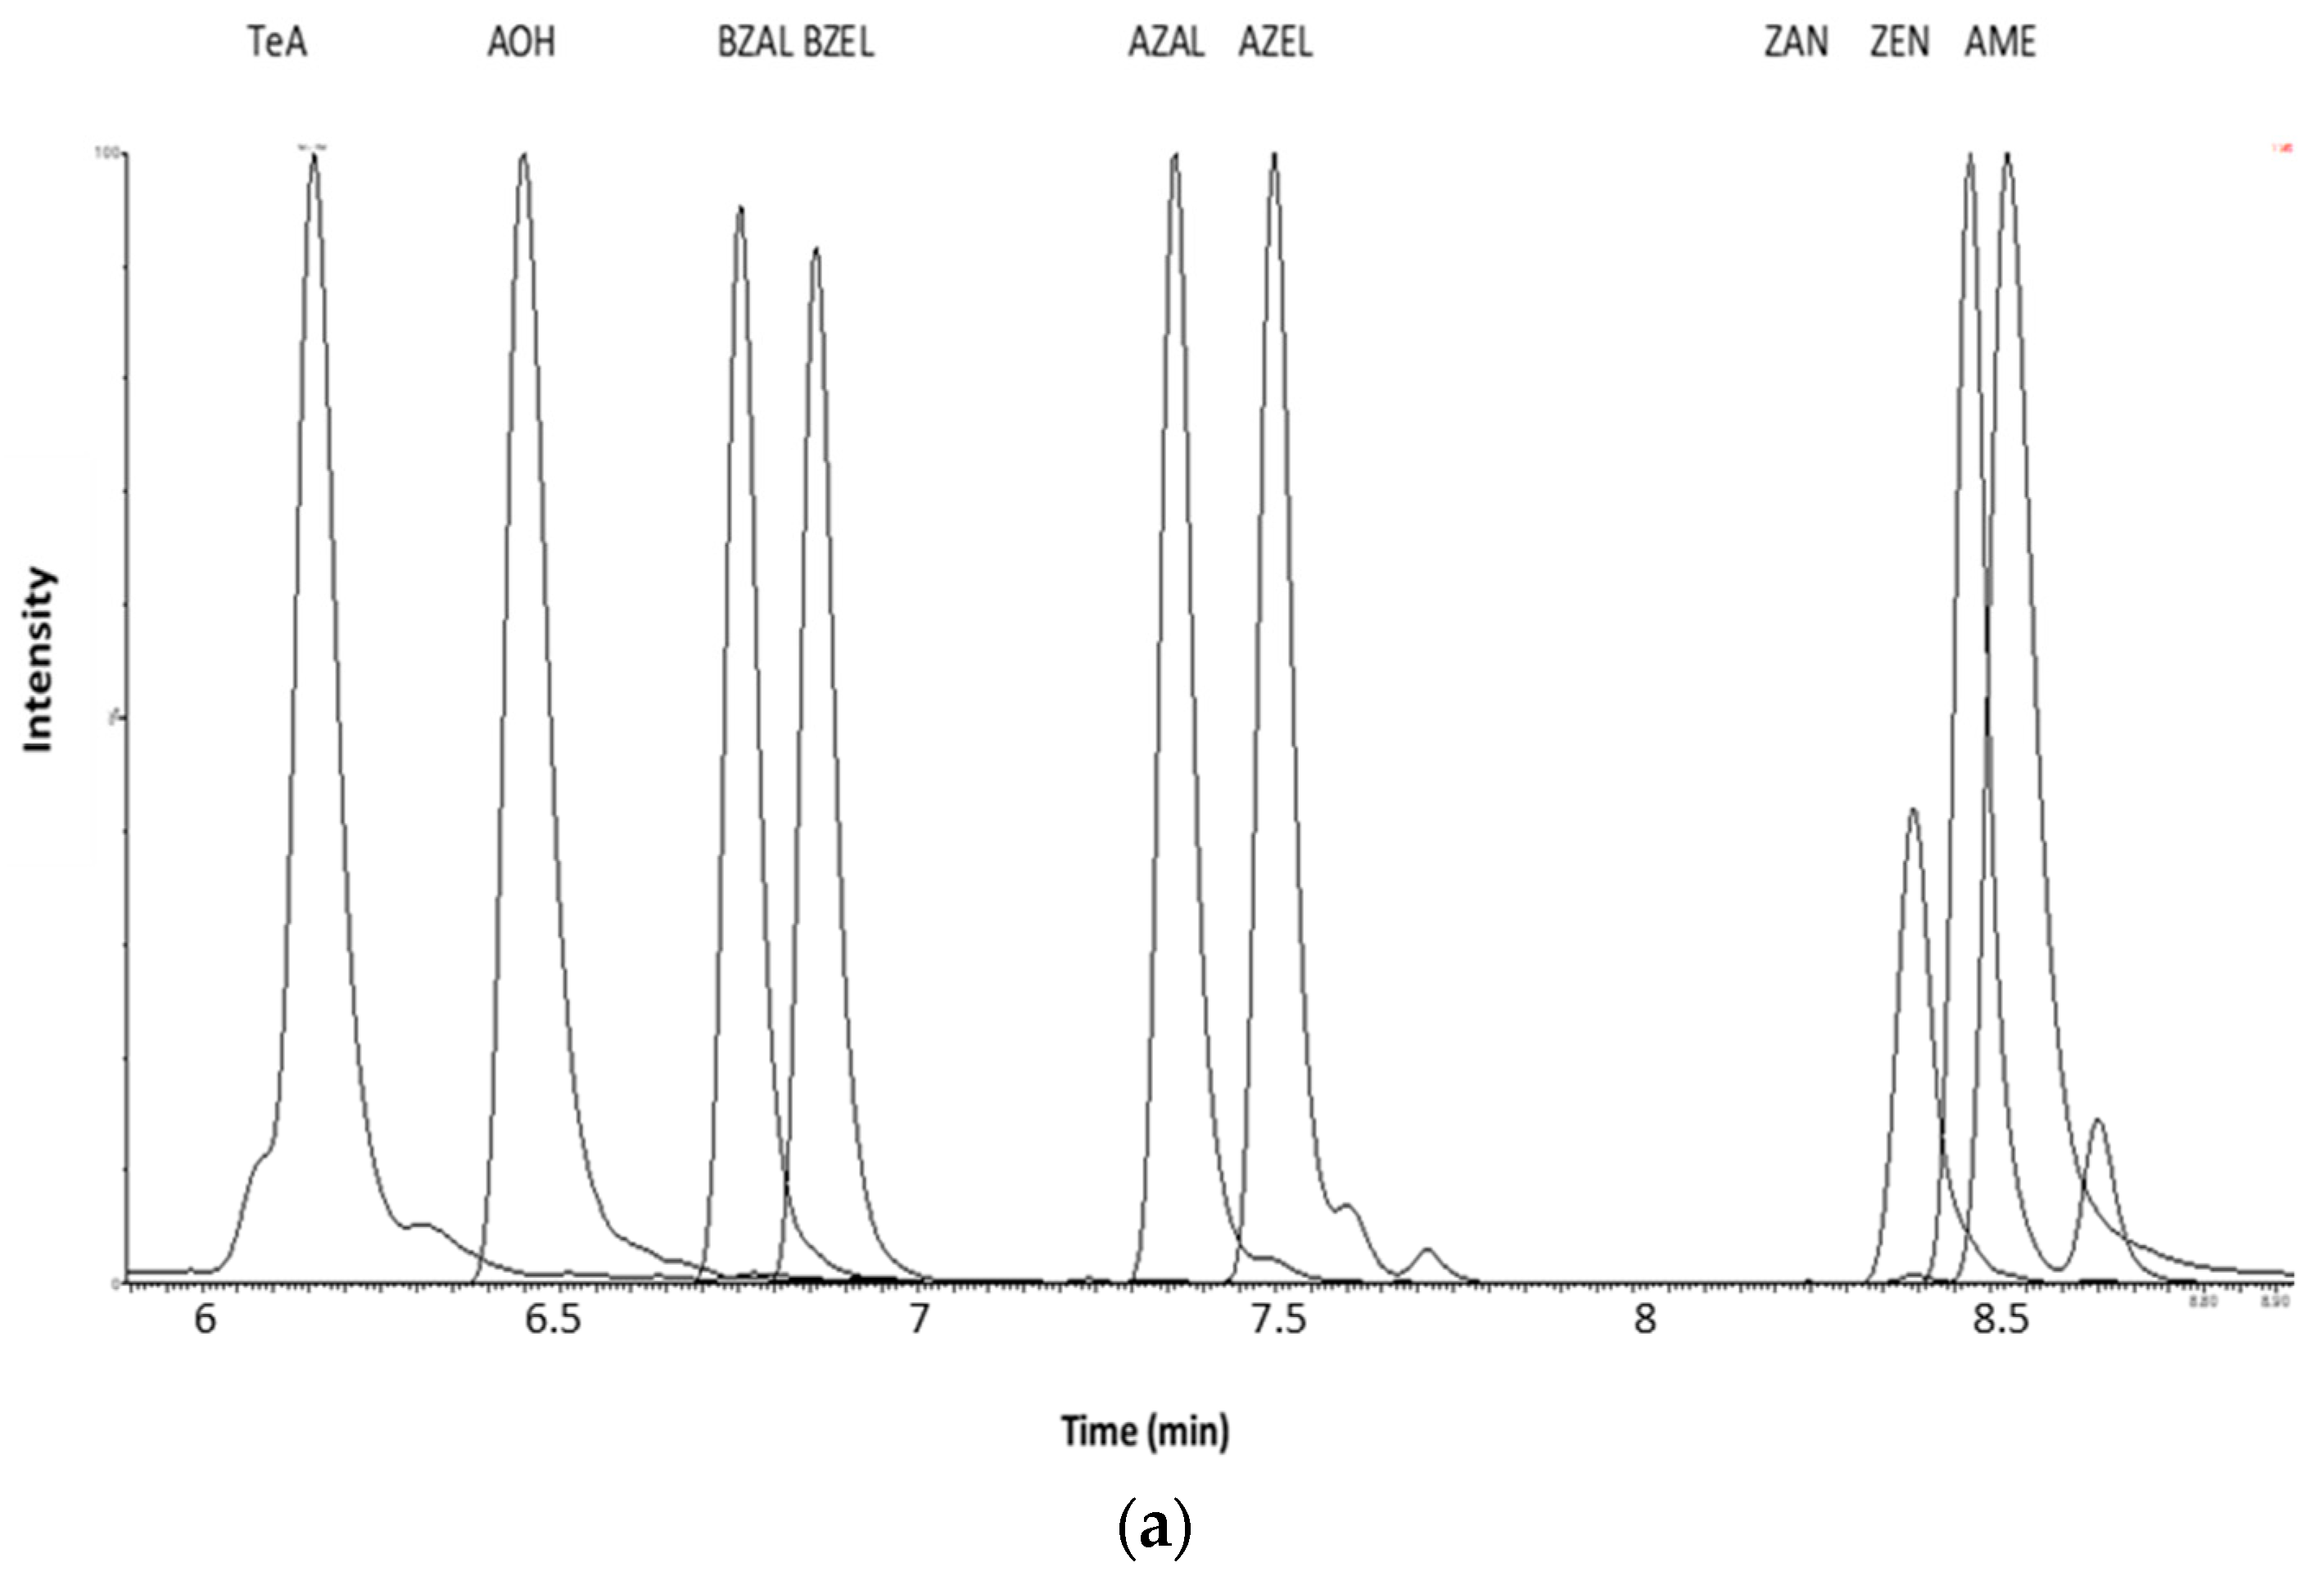
2.1.2. Optimization of LC-MS/MS and HRMS Parameters
2.2. Method Validation
2.3. Biological Samples: Toxicokinetic Study
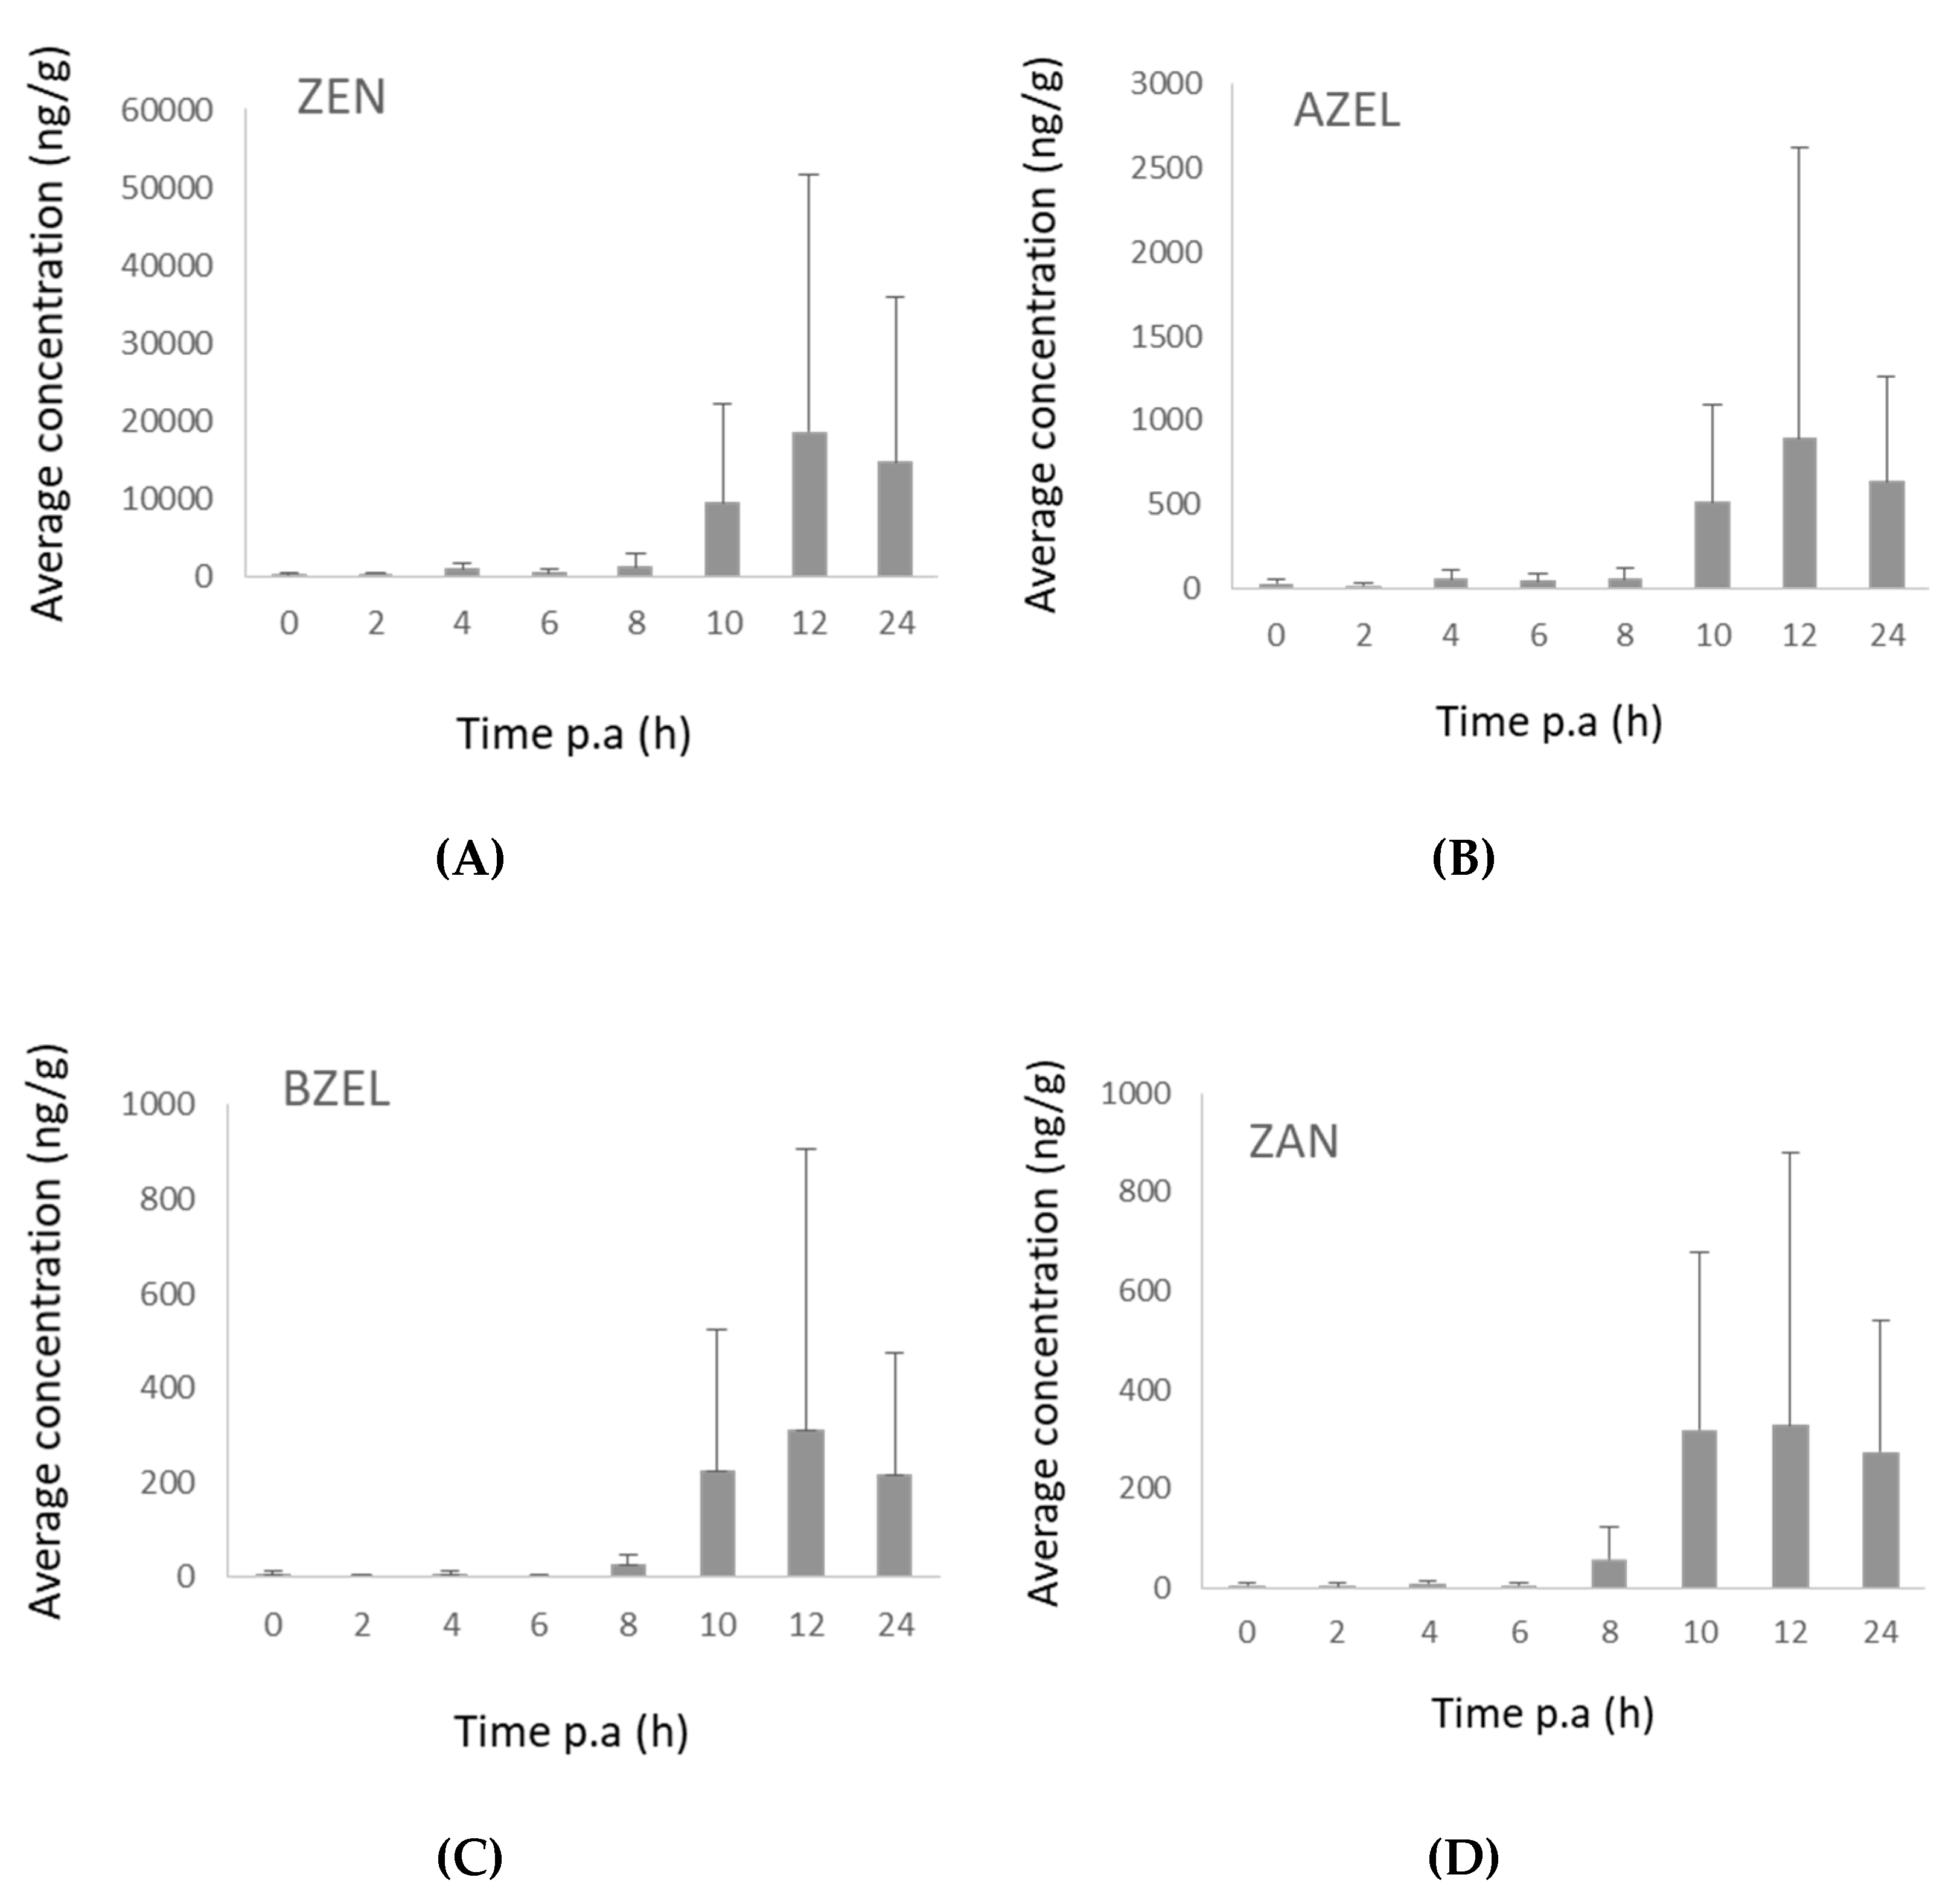
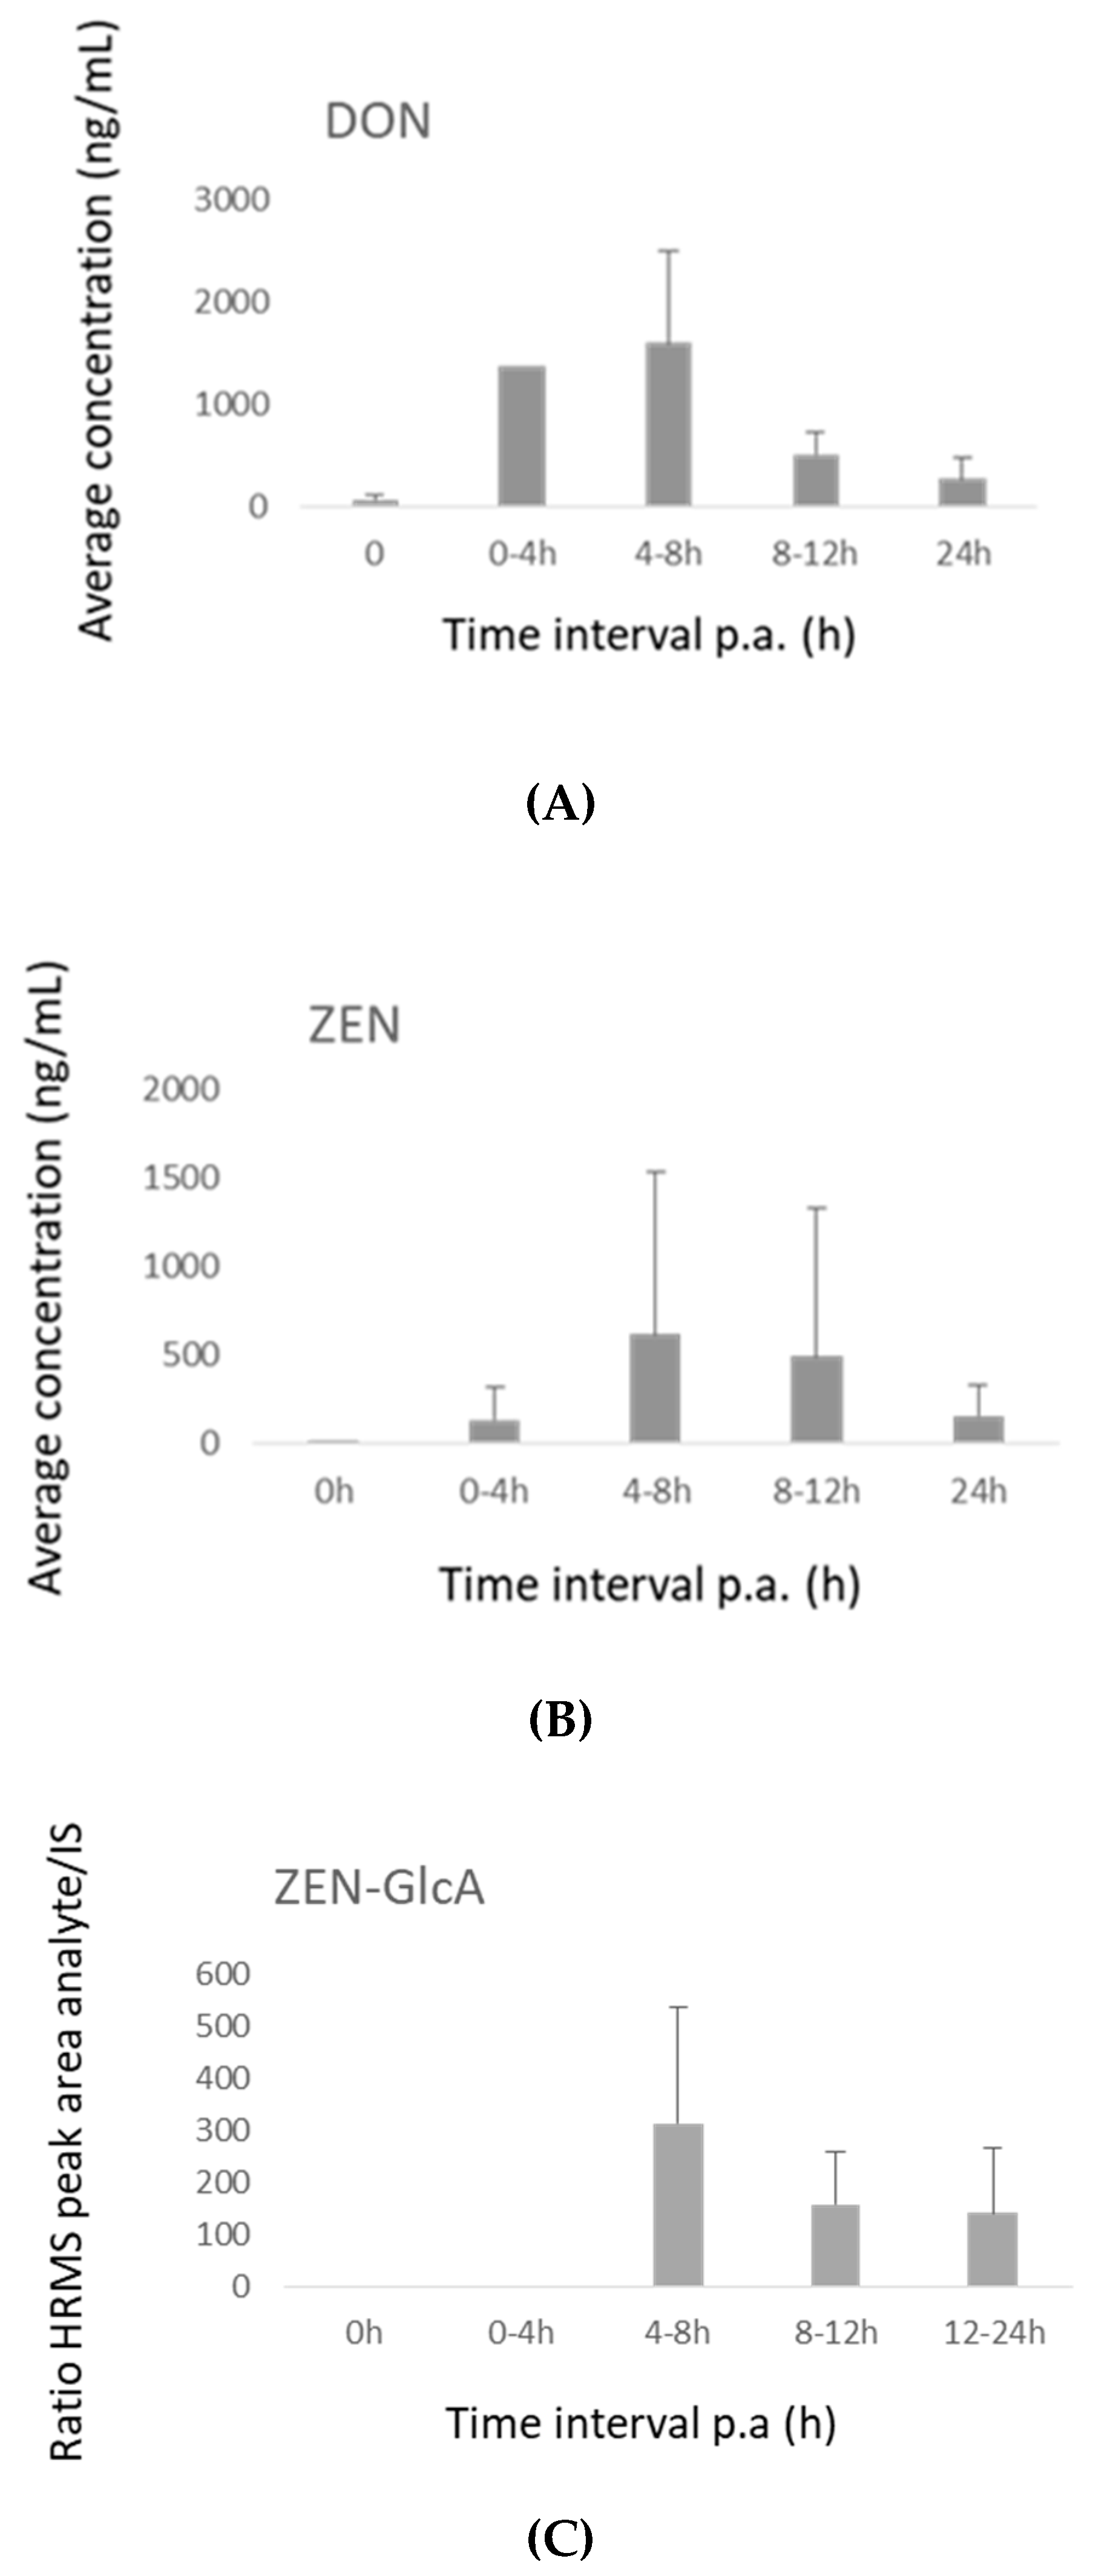
2.3.1. Pigs
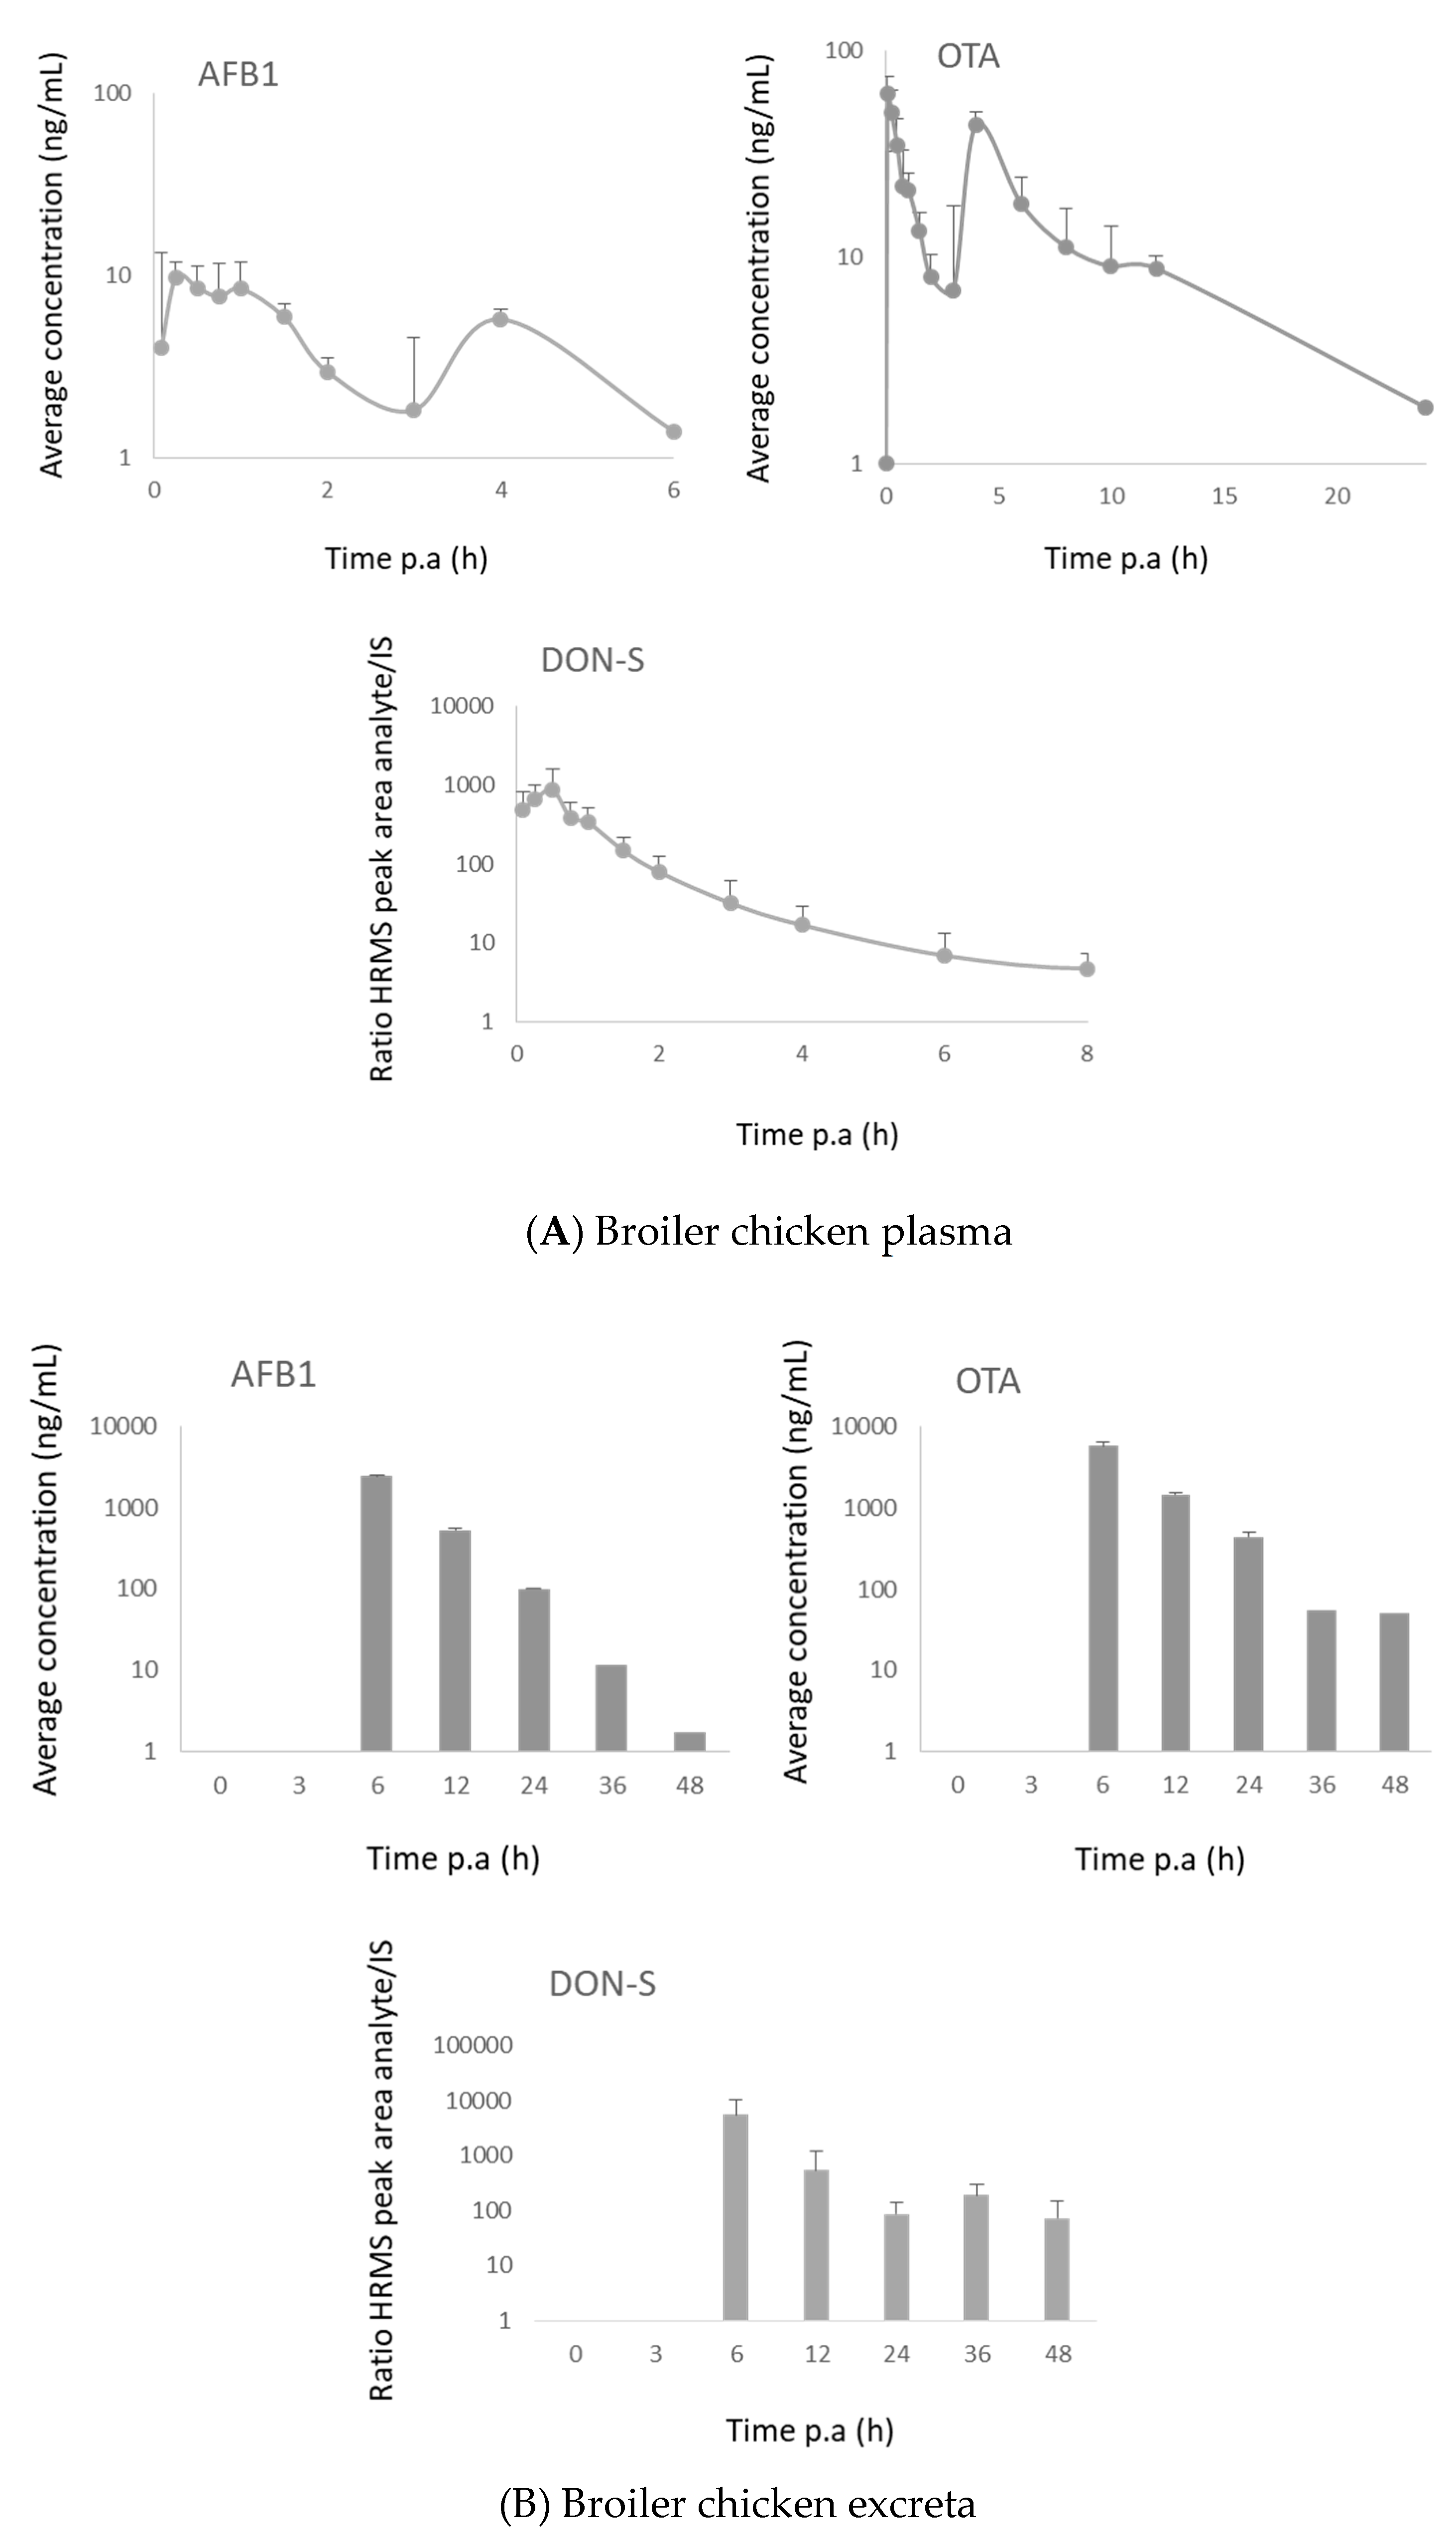
2.3.2. Broiler Chickens
2.4. Screening Study
3. Conclusions
4. Materials and Methods
4.1. Chemicals, Products and Reagents
4.2. Preparation of Standard Solutions
4.3. Biological Samples
4.4. Sample Pre-Treatment
4.4.1. Pig Plasma
4.4.2. Pig Urine
4.4.3. Pig Feces
4.4.4. Broiler Chicken Plasma
4.4.5. Broiler Chicken Excreta
4.5. Chromatography
4.6. Mass Spectrometry
4.6.1. LC-MS/MS
4.6.2. LC-HRMS
4.7. Method Validation
4.7.1. Linearity
4.7.2. Precision and Accuracy
4.7.3. Limit of Quantification (LOQ)
4.7.4. Carry Over
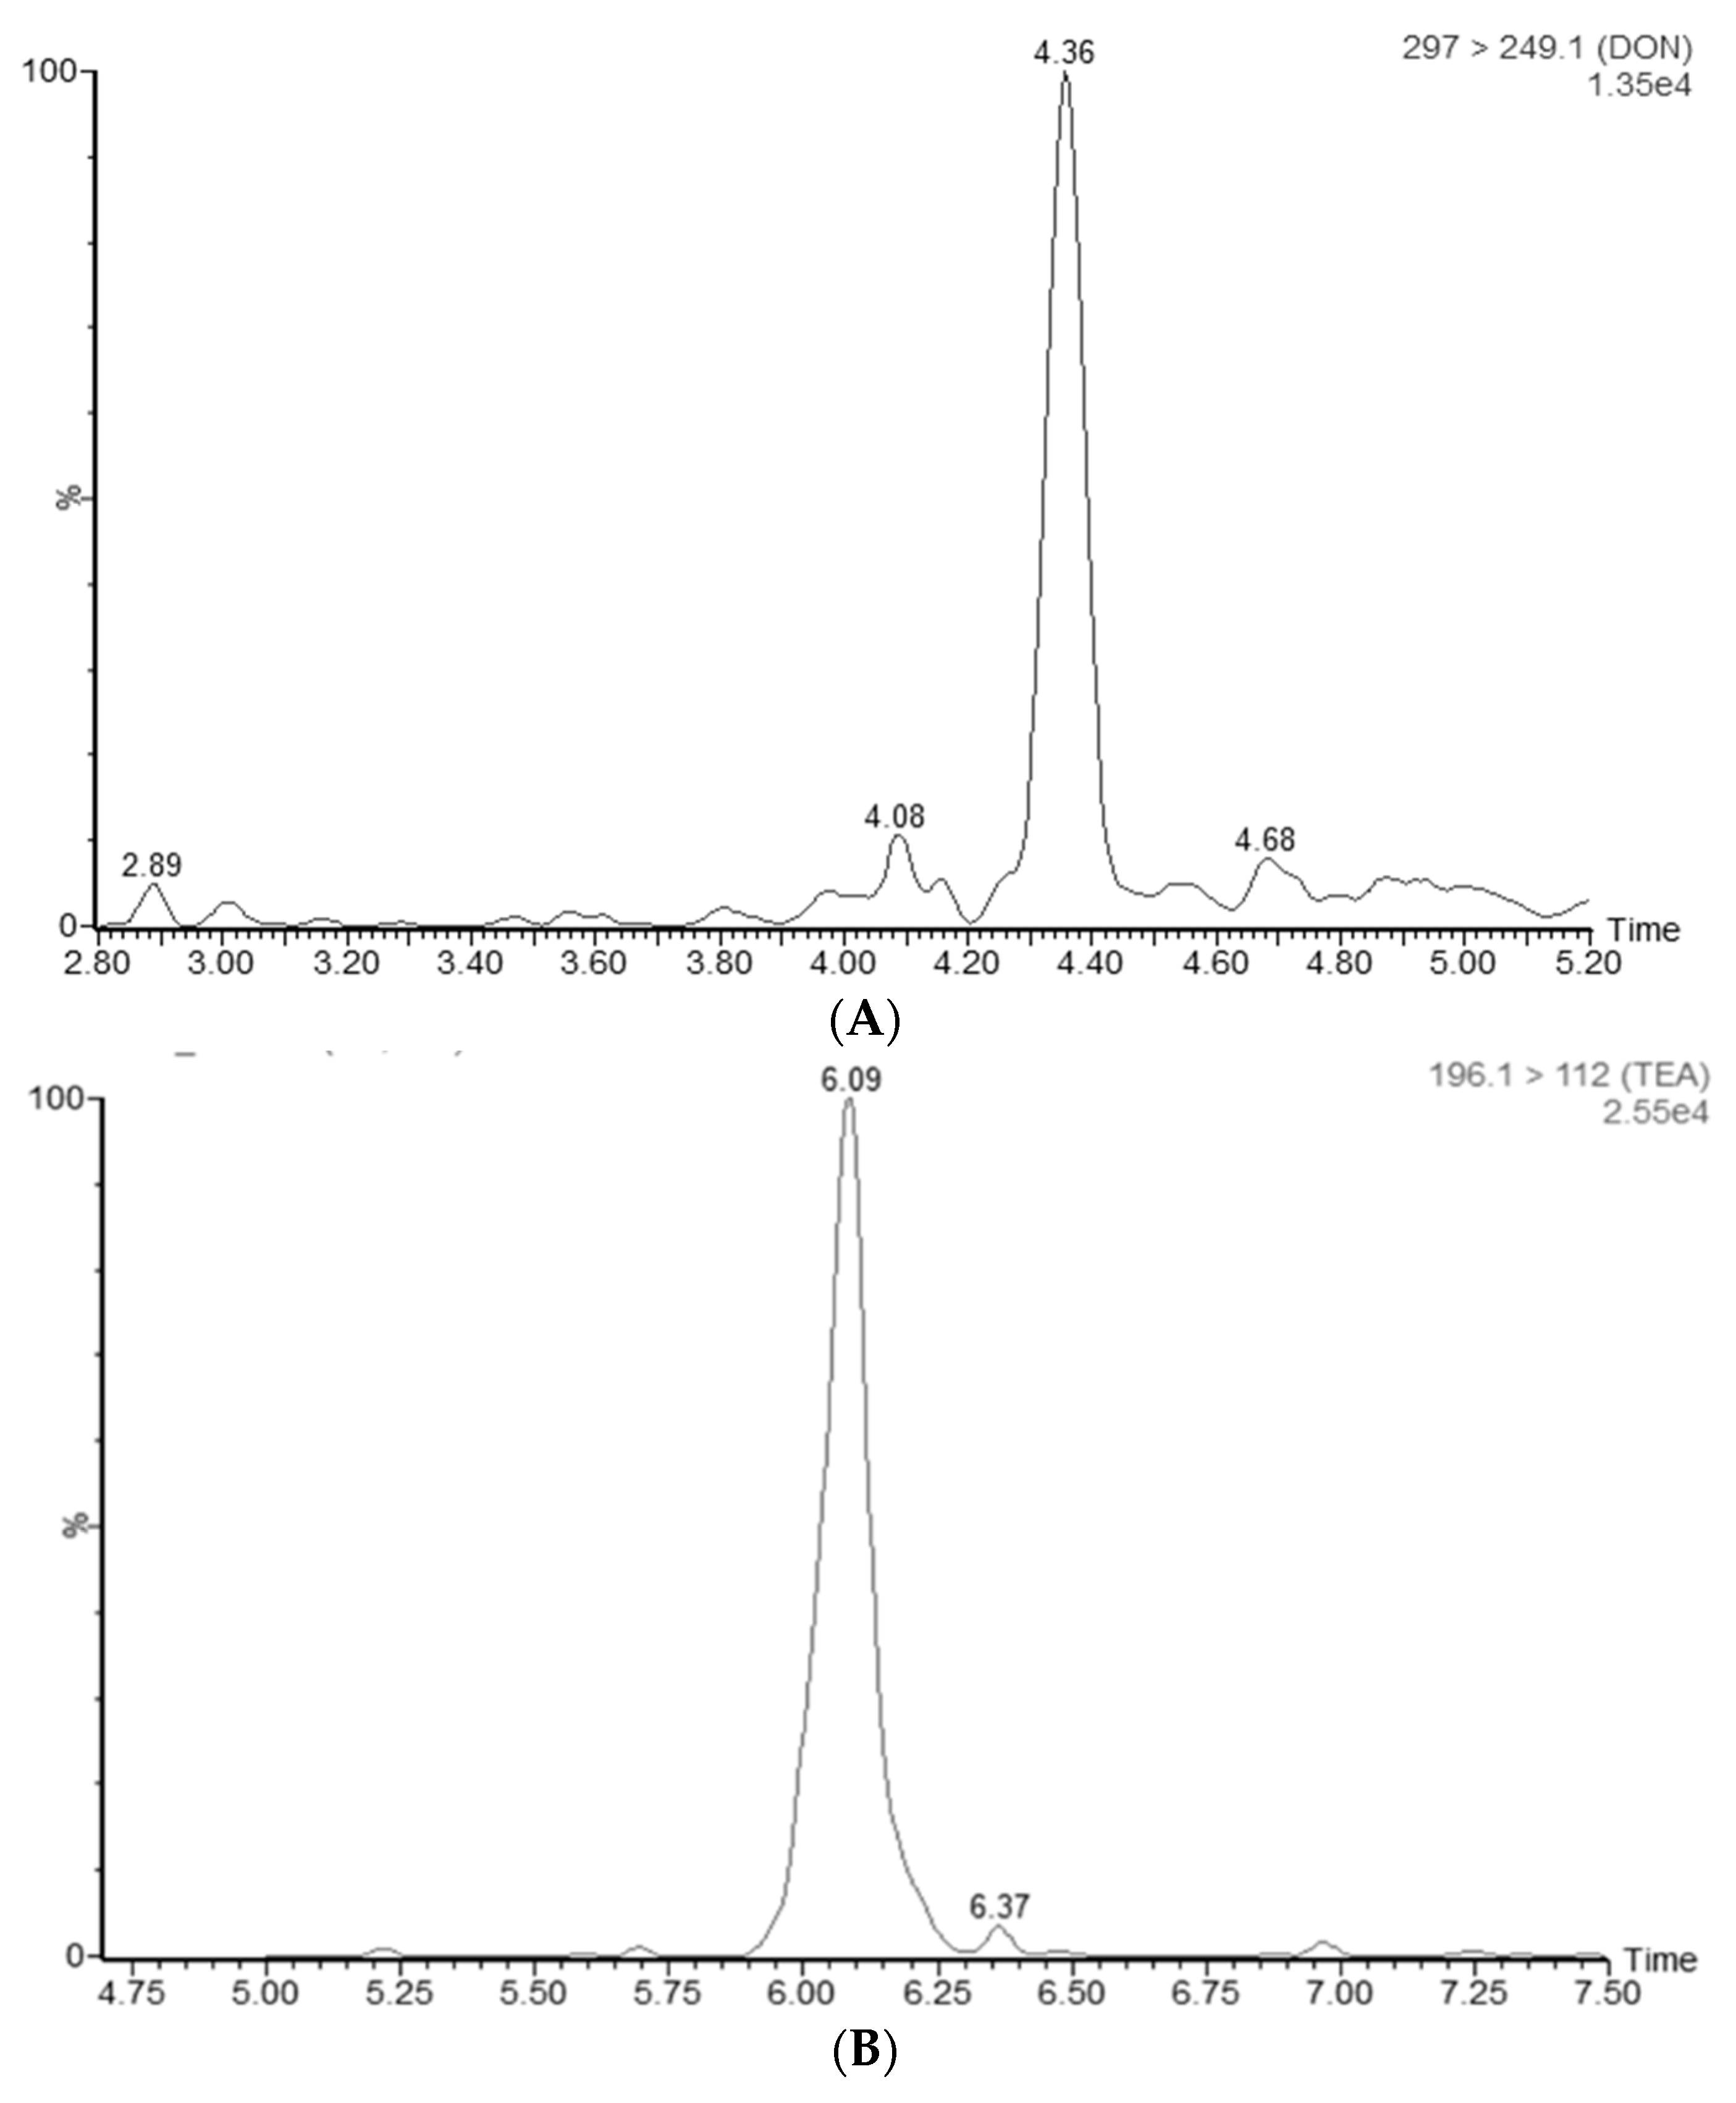
4.7.5. Specificity
4.7.6. Extraction Recovery and Matrix Effects
RE = 100 × (Area Spiked/Area SpikedExtract)
Supplementary Materials
Author Contributions
Funding
Acknowledgments
Conflicts of Interest
References
- Kovalsky, P.; Kos, G.; Nährer, K.; Schwab, C.; Jenkins, T.; Schatzmayr, G.; Sulyok, M.; Krska, R. Co-occurrence of regulated, masked and emerging mycotoxins and secondary metabolites in finished feed and maize–An extensive survey. Toxins 2016, 8, 363. [Google Scholar] [CrossRef] [PubMed]
- European Parliament and the Council of the EU Directive of The European Parliament and of the Council of 7 May 2002 on undesirable substances in animal feed 2002/32. Off. J. Eur. Communities 2002, L140, 1–15.
- European Commission Commission Recommendation 2006/576/EC of 17 August 2006 on the presence of deoxynivalenol, zearalenone, ochratoxin A, T-2 and HT-2 and fumonisins in products intended for animal feeding. Off. J. Eur. Union 2006, L229, 7–9.
- Fraeyman, S.; Croubels, S.; Devreese, M.; Antonissen, G. Emerging fusarium and alternaria mycotoxins: Occurrence, toxicity and toxicokinetics. Toxins 2017, 9, 228. [Google Scholar] [CrossRef] [PubMed]
- Heyndrickx, E.; Sioen, I.; Huybrechts, B.; Callebaut, A.; De Henauw, S.; De Saeger, S. Human biomonitoring of multiple mycotoxins in the Belgian population: Results of the BIOMYCO study. Environ. Int. 2015, 84, 82–89. [Google Scholar] [CrossRef] [PubMed]
- Boonen, J.; Malysheva, S.V.; Taevernier, L.; Diana Di Mavungu, J.; De Saeger, S.; De Spiegeleer, B. Human skin penetration of selected model mycotoxins. Toxicology 2012, 301, 21–32. [Google Scholar] [CrossRef]
- Niculita-Hirzel, H.; Hantier, G.; Storti, F.; Plateel, G.; Roger, T. Frequent occupational exposure to Fusarium mycotoxins of workers in the swiss grain industry. Toxins 2016, 8, 370. [Google Scholar] [CrossRef]
- Broekaert, N.; Devreese, M.; De Mil, T.; Fraeyman, S.; Antonissen, G.; De Baere, S.; De Backer, P.; Vermeulen, A.; Croubels, S. Oral Bioavailability, Hydrolysis, and Comparative Toxicokinetics of 3-Acetyldeoxynivalenol and 15-Acetyldeoxynivalenol in Broiler Chickens and Pigs. J. Agric. Food Chem. 2015, 63, 8734–8742. [Google Scholar] [CrossRef] [PubMed]
- Broekaert, N.; Devreese, M.; van Bergen, T.; Schauvliege, S.; De Boevre, M.; De Saeger, S.; Vanhaecke, L.; Berthiller, F.; Michlmayr, H.; Malachová, A.; et al. In vivo contribution of deoxynivalenol-3-β-d-glucoside to deoxynivalenol exposure in broiler chickens and pigs: Oral bioavailability, hydrolysis and toxicokinetics. Arch. Toxicol. 2017, 91, 699–712. [Google Scholar] [CrossRef] [PubMed]
- Freire, L.; Sant’Ana, A.S. Modified mycotoxins: An updated review on their formation, detection, occurrence, and toxic effects. Food Chem. Toxicol. 2018, 111, 189–205. [Google Scholar] [CrossRef] [PubMed]
- Sherif, S.O.; Salama, E.E.; Abdel-Wahhab, M.A. Mycotoxins and child health: The need for health risk assessment. Int. J. Hyg. Environ. Health 2009, 212, 347–368. [Google Scholar] [CrossRef] [PubMed]
- Crews, H.; Alink, G.; Andersen, R.; Braesco, V.; Holst, B.; Maiani, G.; Ovesen, L.; Scotter, M.; Solfrizzo, M.; van den Berg, R.; et al. A critical assessment of some biomarker approaches linked with dietary intake. Br. J. Nutr. 2001, 86 (Suppl. 1), S5–S35. [Google Scholar] [CrossRef] [PubMed] [Green Version]
- Baldwin, T.; Riley, R.; Zitomer, N.; Voss, K.; Coulombe, R., Jr.; Pestka, J.; Williams, D.; Glenn, A. The current state of mycotoxin biomarker development in humans and animals and the potential for application to plant systems. World Mycotoxin J. 2011, 4, 257–270. [Google Scholar] [CrossRef]
- Efsa Statement on the establishment of guidelines for the assessment of additives from the functional group ‘substances for reduction of the contamination of feed by mycotoxins’ 1 EFSA Panel on Additives and Products or Substances used in Animal Feed (FEEDA. EFSA J. 2010, 8, 1–8. [CrossRef]
- Broekaert, N.; Devreese, M.; De Mil, T.; Fraeyman, S.; De Baere, S.; De Saeger, S.; De Backer, P.; Croubels, S. Development and validation of an LC-MS/MS method for the toxicokinetic study of deoxynivalenol and its acetylated derivatives in chicken and pig plasma. J. Chromatogr. B Anal. Technol. Biomed. Life Sci. 2014, 971, 43–51. [Google Scholar] [CrossRef]
- Nagl, V.; Woechtl, B.; Schwartz-Zimmermann, H.E.; Hennig-Pauka, I.; Moll, W.D.; Adam, G.; Berthiller, F. Metabolism of the masked mycotoxin deoxynivalenol-3-glucoside in pigs. Toxicol. Lett. 2014, 229, 190–197. [Google Scholar] [CrossRef] [Green Version]
- Schwartz-Zimmermann, H.E.; Fruhmann, P.; Dänicke, S.; Wiesenberger, G.; Caha, S.; Weber, J.; Berthiller, F. Metabolism of deoxynivalenol and deepoxy-deoxynivalenol in broiler chickens, pullets, roosters and turkeys. Toxins 2015, 7, 4706–4729. [Google Scholar] [CrossRef]
- Dänicke, S.; Valenta, H.; Döll, S. On the toxicokinetics and the metabolism of deoxynivalenol (don) in the pig. Arch. Anim. Nutr. 2007, 58, 169–180. [Google Scholar] [CrossRef]
- Binder, S.B.; Schwartz-Zimmermann, H.E.; Varga, E.; Bichl, G.; Michlmayr, H.; Adam, G.; Berthiller, F. Metabolism of zearalenone and its major modified forms in pigs. Toxins 2017, 9, 56. [Google Scholar] [CrossRef]
- De Baere, S.; Osselaere, A.; Devreese, M.; Vanhaecke, L.; De Backer, P.; Croubels, S. Development of a liquid-chromatography tandem mass spectrometry and ultra-high-performance liquid chromatography high-resolution mass spectrometry method for the quantitative determination of zearalenone and its major metabolites in chicken and pig plasma. Anal. Chim. Acta 2012, 756, 37–48. [Google Scholar] [CrossRef]
- Devreese, M.; De Baere, S.; De Backer, P.; Croubels, S. Quantitative determination of the Fusarium mycotoxins beauvericin, enniatin A, A1, B and B1 in pig plasma using high performance liquid chromatography-tandem mass spectrometry. Talanta 2013, 106, 212–219. [Google Scholar] [CrossRef] [PubMed]
- Fraeyman, S.; Devreese, M.; Antonissen, G.; De Baere, S.; Rychlik, M.; Croubels, S. Comparative Oral Bioavailability, Toxicokinetics, and Biotransformation of Enniatin B1 and Enniatin B in Broiler Chickens. J. Agric. Food Chem. 2016, 64, 7259–7264. [Google Scholar] [CrossRef]
- Broekaert, N.; Devreese, M.; De Boevre, M.; De Saeger, S.; Croubels, S. T-2 Toxin-3α-glucoside in Broiler Chickens: Toxicokinetics, Absolute Oral Bioavailability, and in Vivo Hydrolysis. J. Agric. Food Chem. 2017, 65, 4797–4803. [Google Scholar] [CrossRef] [PubMed]
- Yoshizawa, T.; Swanson, S.P.; Mirocha, C.J. T-2 metabolites in the excreta of broiler chickens administered 3H-labeled T-2 toxin. Appl. Environ. Microbiol. 1980, 39, 1172–1177. [Google Scholar] [PubMed]
- Sun, Y.-X.; Yao, X.; Shi, S.N.; Zhang, G.J.; Xu, L.X.; Liu, Y.J.; Fang, B.H. Toxicokinetics of T-2 toxin and its major metabolites in broiler chickens after intravenous and oral administration. J. Vet. Pharmacol. Ther. 2015, 38, 80–85. [Google Scholar] [CrossRef] [PubMed]
- Di Gregorio, M.C.; Jager, A.V.; Costa, A.A.; Bordin, K.; Rottinhghaus, G.E.; Petta, T.; Souto, P.C.M.C.; Budiño, F.E.L.; Oliveira, C.A.F. Determination of Aflatoxin B1 -Lysine in Pig Serum and Plasma by Liquid Chromatography–Tandem Mass Spectrometry. J. Anal. Toxicol. 2016, 236–241. [Google Scholar] [CrossRef] [PubMed]
- Fraeyman, S.; Devreese, M.; Broekaert, N.; De Mil, T.; Antonissen, G.; De Baere, S.; De Backer, P.; Rychlik, M.; Croubels, S. Quantitative Determination of Tenuazonic Acid in Pig and Broiler Chicken Plasma by LC-MS/MS and Its Comparative Toxicokinetics. J. Agric. Food Chem. 2015, 63, 8560–8567. [Google Scholar] [CrossRef]
- Song, S.; Ediage, E.N.; Wu, A.; De Saeger, S. Development and application of salting-out assisted liquid/liquid extraction for multi-mycotoxin biomarkers analysis in pig urine with high performance liquid chromatography/tandem mass spectrometry. J. Chromatogr. A 2013, 1292, 111–120. [Google Scholar] [CrossRef] [PubMed] [Green Version]
- Thanner, S.; Czeglédi, L.; Schwartz-Zimmermann, H.E.; Berthiller, F.; Gutzwiller, A. Urinary deoxynivalenol (DON) and zearalenone (ZEA) as biomarkers of DON and ZEA exposure of pigs. Mycotoxin Res. 2016, 32, 69–75. [Google Scholar] [CrossRef]
- Razzazi-Fazeli, E.; Böhm, J.; Jarukamjorn, K.; Zentek, J. Simultaneous determination of major B-trichothecenes and the de-epoxy-metabolite of deoxynivalenol in pig urine and maize using high-performance liquid chromatography-mass spectrometry. J. Chromatogr. B Anal. Technol. Biomed. Life Sci. 2003, 796, 21–33. [Google Scholar] [CrossRef]
- Thieu, N.Q.; Pettersson, H. Zearalenone, deoxynivalenol and aflatoxin B1 and their metabolites in pig urine as biomarkers for mycotoxin exposure. Mycotoxin Res. 2009, 25, 59–66. [Google Scholar] [CrossRef] [PubMed]
- Solfrizzo, M.; Gambacorta, L.; Lattanzio, V.M.T.; Powers, S.; Visconti, A. Simultaneous LC-MS/MS determination of aflatoxin M 1, ochratoxin A, deoxynivalenol, de-epoxydeoxynivalenol, α and β-zearalenols and fumonisin B 1 in urine as a multi-biomarker method to assess exposure to mycotoxins. Anal. Bioanal. Chem. 2011, 401, 2831–2841. [Google Scholar] [CrossRef] [PubMed]
- Gambacorta, S.; Solfrizzo, H.; Visconti, A.; Powers, S.; Cossalter, A.M.; Pinton, P.; Oswald, I.P. Validation study on urinary biomarkers of exposure for aflatoxin B1, ochratoxin A, fumonisin B1, deoxynivalenol and zearalenone in piglets. World Mycotoxin J. 2013, 6, 299–308. [Google Scholar] [CrossRef]
- Devreese, M.; De Baere, S.; De Backer, P.; Croubels, S. Quantitative determination of several toxicological important mycotoxins in pig plasma using multi-mycotoxin and analyte-specific high performance liquid chromatography-tandem mass spectrometric methods. J. Chromatogr. A 2012, 1257, 74–80. [Google Scholar] [CrossRef] [PubMed]
- De Baere, S.; Goossens, J.; Osselaere, A.; Devreese, M.; Vandenbroucke, V.; De Backer, P.; Croubels, S. Quantitative determination of T-2 toxin, HT-2 toxin, deoxynivalenol and deepoxy-deoxynivalenol in animal body fluids using LC-MS/MS detection. J. Chromatogr. B Anal. Technol. Biomed. Life Sci. 2011, 879, 2403–2415. [Google Scholar] [CrossRef]
- Tolosa, J.; Font, G.; Mañes, J.; Ferrer, E. Multimycotoxin analysis in water and fish plasma by liquid chromatography-tandem mass spectrometry. Chemosphere 2016, 145, 402–408. [Google Scholar] [CrossRef] [PubMed]
- Brezina, U.; Valenta, H.; Rempe, I.; Kersten, S.; Humpf, H.U.; Dänicke, S. Development of a liquid chromatography tandem mass spectrometry method for the simultaneous determination of zearalenone, deoxynivalenol and their metabolites in pig serum. Mycotoxin Res. 2014, 30, 171–186. [Google Scholar] [CrossRef]
- Warth, B.; Petchkongkaew, A.; Sulyok, M.; Krska, R. Utilising an LC-MS/MS-based multi-biomarker approach to assess mycotoxin exposure in the Bangkok metropolitan area and surrounding provinces. Food Addit. Contam. Part A Chem. Anal. Control. Expo. Risk Assess. 2014, 31, 2040–2046. [Google Scholar] [CrossRef]
- Slobodchikova, I.; Vuckovic, D. Liquid chromatography—High resolution mass spectrometry method for monitoring of 17 mycotoxins in human plasma for exposure studies. J. Chromatogr. A 2018, 1548, 51–63. [Google Scholar] [CrossRef]
- Cao, X.; Li, X.; Li, J.; Niu, Y.; Shi, L.; Fang, Z.; Zhang, T.; Ding, H. Quantitative determination of carcinogenic mycotoxins in human and animal biological matrices and animal-derived foods using multi-mycotoxin and analyte-specific high performance liquid chromatography-tandem mass spectrometric methods. J. Chromatogr. B Anal. Technol. Biomed. Life Sci. 2018, 1073, 191–200. [Google Scholar] [CrossRef]
- Warth, B.; Sulyok, M.; Fruhmann, P.; Mikula, H.; Berthiller, F.; Schuhmacher, R.; Hametner, C.; Abia, W.A.; Adam, G.; Fröhlich, J.; et al. Development and validation of a rapid multi-biomarker liquid chromatography/tandem mass spectrometry method to assess human exposure to mycotoxins. Rapid Commun. Mass Spectrom. 2012, 26, 1533–1540. [Google Scholar] [CrossRef]
- Ivanova, L.; Uhlig, S.; Devreese, M.; Croubels, S.; Fæste, C.K. Biotransformation of the mycotoxin enniatin B1 in pigs: A comparative in vitro and in vivo approach. Food Chem. Toxicol. 2017, 105, 506–517. [Google Scholar] [CrossRef] [PubMed]
- Ferlazzo, A.M.; Bruschetta, G.; Di Pietro, P.; Medica, P.; Notti, A.; Rotondo, E. Phospholipid composition of plasma and erythrocyte membranes in animal species by 31P NMR. Vet. Res. Commun. 2011, 35, 521–530. [Google Scholar] [CrossRef] [PubMed]
- De Baere, S.; Croubels, S.; Novak, B.; Bichl, G.; Antonissen, G. Development and validation of a UPLC-MS/MS and UPLC-HR-MS method for the determination of fumonisin B1 and its hydrolysed metabolites and fumonisin b2 in broiler chicken plasma. Toxins 2018, 10, 62. [Google Scholar] [CrossRef] [PubMed]
- Wishart, D.; Arndt, D.; Pon, A.; Sajed, T.; Guo, A.C.; Djoumbou, Y.; Knox, C.; Wilson, M.; Liang, Y.; Grant, J.; et al. T3DB: The toxic exposome database. Nucleic Acids Res. 2015, 43, D928–D934. [Google Scholar] [CrossRef] [PubMed]
- el Khoury, A.E.; Atoui, A. Ochratoxin a: General overview and actual molecular status. Toxins 2010, 2, 461–493. [Google Scholar] [CrossRef] [PubMed]
- Walravens, J.; Mikula, H.; Rychlik, M.; Asam, S.; Ediage, E.N.; Di Mavungu, J.D.; Van Landschoot, A.; Vanhaecke, L.; De Saeger, S. Development and validation of an ultra-high-performance liquid chromatography tandem mass spectrometric method for the simultaneous determination of free and conjugated Alternaria toxins in cereal-based foodstuffs. J. Chromatogr. A 2014, 1372, 91–101. [Google Scholar] [CrossRef]
- Pfeiffer, E.; Hildebrand, A.; Mikula, H.; Metzler, M. Glucuronidation of zearalenone, zeranol and four metabolites in vitro: Formation of glucuronides by various microsomes and human UDP-glucuronosyltransferase isoforms. Mol. Nutr. Food Res. 2010, 54, 1468–1476. [Google Scholar] [CrossRef] [PubMed]
- Ringot, D.; Chango, A.; Schneider, Y.J.; Larondelle, Y. Toxicokinetics and toxicodynamics of ochratoxin A, an update. Chem. Biol. Interact. 2006, 159, 18–46. [Google Scholar] [CrossRef]
- Devreese, M.; Croubels, S.; De Baere, S.; Gehring, R.; Antonissen, G. Comparative Toxicokinetics and Plasma Protein Binding of Ochratoxin A in Four Avian Species. Agric Food Chem. 2018, 66, 2129–2135. [Google Scholar] [CrossRef] [PubMed]
- McCormick, S.P.; Price, N.P.J.; Kurtzman, C.P. Glucosylation and other biotransformations of T-2 toxin by yeasts of the trichomonascus clade. Appl. Environ. Microbiol. 2012, 78, 8694–8702. [Google Scholar] [CrossRef] [PubMed]
- McCormick, S.P.; Kato, T.; Maragos, C.M.; Busman, M.; Lattanzio, V.M.T.; Galaverna, G.; Dall-Asta, C.; Crich, D.; Price, N.P.J.; Kurtzman, C.P. Anomericity of T-2 toxin-glucoside: Masked mycotoxin in cereal crops. J. Agric. Food Chem. 2015, 63, 731–738. [Google Scholar] [CrossRef] [PubMed]
- Asam, S.; Liu, Y.; Konitzer, K.; Rychlik, M. Development of a stable isotope dilution assay for tenuazonic acid. J. Agric. Food Chem. 2011, 59, 2980–2987. [Google Scholar] [CrossRef] [PubMed]
- Hu, L.; Rychlik, M. Biosynthesis of 15N3-labeled enniatins and beauvericin and their application to stable isotope dilution assays. J. Agric. Food Chem. 2012, 60, 7129–7136. [Google Scholar] [CrossRef] [PubMed]
- Gasthuys, E.; Schauvliege, S.; van Bergen, T.; Millecam, J.; Cerasoli, I.; Martens, A.; Gasthuys, F.; Vandecasteele, T.; Cornillie, P.; Van den Broeck, W.; et al. Repetitive urine and blood sampling in neonatal and weaned piglets for pharmacokinetic and pharmacodynamic modelling in drug discovery: A pilot study. Lab. Anim. 2017, 51, 498–508. [Google Scholar] [CrossRef]
- Heitzman, R. Veterinary Drug Residues Residues in Food Producing Animals and Their Products: Reference Materials and Methods; Blackwell Scientific Publications: Oxford, UK, 1996; Volume 636, ISBN 0-8412-3419-1. [Google Scholar]
- European Commission Commission Decision 2002/657/Implementing Council Directive 96/23/EC concerning the performance of analytical methods and the interpretation of results. Off. J. Eur. Communities 2002, L221, 29. [CrossRef]
- EMA/CMVP/VICH Steering Committee VICH Topic GL49: Studies to Evaluate the Metabolism and Residues Kinetics of Veterinary Drugs in Human Food-Producing Animals: Validation of Analytical Methods Used in Residue Depletion Studies; European Medicine Agency: Brussels, Belgium, 2016; Volume 44.
- Knecht, J.; Stork, G. Percentage and logarithmic procedures for calculation of calibration curves. Fresenius Z. Anal. Chem. 1974, 270, 97–99. [Google Scholar] [CrossRef]
- Matuszewski, B.K.; Constanzer, M.L.; Chavez-Eng, C.M. Strategies for the assessment of matrix effect in quantitative bioanalytical methods based on HPLC-MS/MS. Anal. Chem. 2003, 75, 3019–3030. [Google Scholar] [CrossRef]


| Analyte | Linearity (n = 3 Different Days) | LOQ (ng/mL) | ||
|---|---|---|---|---|
| Linear Range (ng/mL) | r ± SD | g (%) ± SD | ||
| ZEN | 1–200 | 0.996 ± 0.003 | 12.9 ± 3.8 | 1.0 |
| AZEL | 1–200 | 0.995 ± 0.002 | 15.0 ± 1.2 | 1.0 |
| AZAL | 1–200 | 0.995± 0.003 | 15.2 ± 3.6 | 1.0 |
| BZAL | 1–200 | 0.996 ± 0.001 | 10.7 ± 2.0 | 1.0 |
| BZEL | 1–200 | 0.996 ± 0.002 | 14.9 ± 3.7 | 1.0 |
| ZAN | 1–200 | 0.997 ± 0.001 | 16.3 ± 3.1 | 1.0 |
| TEA | 1–200 | 0.998 ± 0.001 | 12.0 ± 4.9 | 1.0 |
| AOH | 1–200 | 0.997 ± 0.002 | 12.9 ± 5.2 | 1.0 |
| AME | 1–200 | 0.996± 0.004 | 13.1± 5.1 | 1.0 |
| DON | 1–200 | 0.998 ± 0.002 | 13.9 ± 4.4 | 1.0 |
| DOM-1 | 1–200 | 0.997 ± 0.003 | 16.9 ± 2.5 | 1.0 |
| 3/15 ADON | 1–200 | 0.998 ± 0.001 | 9.3 ± 3.1 | 1.0 |
| T2 | 1–200 | 0.998 ± 0.001 | 9.9 ± 1.6 | 1.0 |
| HT2 | 1–100 | 0.993 ± 0.002 | 17.5 ± 2.8 | 1.0 |
| T2G | 2–200 | 0.995 ± 0.003 | 14.4 ± 1.2 | 2.0 |
| AFB1 | 1–200 | 0.996 ± 0.002 | 12.7 ± 2.8 | 1.0 |
| AFM1 | 1–200 | 0.997 ± 0.002 | 13.8 ± 5.6 | 1.0 |
| OTA | 1–200 | 0.993 ±0.004 | 9.3 ± 2.9 | 1.0 |
| ENNA1 | 1–200 | 0.998 ± 0.001 | 9.0 ± 0.9 | 1.0 |
| ENNA | 1–50 | 0.995 ± 0.003 | 13.9 ± 3.2 | 1.0 |
| ENNB | 1–100 | 0.993 ± 0.002 | 9.3 ± 1.2 | 1.0 |
| ENNB1 | 1–100 | 0.998 ± 0.001 | 15.9 ± 2.3 | 1.0 |
| BEA | 1–100 | 0.998 ± 0.000 | 16.6 ± 4.5 | 1.0 |
| Within-Day Precision and Accuracy (n = 6) | Between-Day Precision and Accuracy (n = 3 × 3) | |||||||||||
|---|---|---|---|---|---|---|---|---|---|---|---|---|
| Analyte | Theoretical Concentration LOQ | Theoretical Concentration 10 ng/mL | Theoretical Concentration 100 ng/mL | Theoretical Concentration LOQ | Theoretical Concentration 10 ng/mL | Theoretical Concentration 100 ng/mL | ||||||
| Precision | Accuracy | Precision | Accuracy | Precision | Accuracy | Precision | Accuracy | Precision | Accuracy | Precision | Accuracy | |
| (RSD %) | (%) | (RSD %) | (%) | (RSD %) | (%) | (RSD %) | (%) | (RSD %) | (%) | (RSD %) | (%) | |
| ZEN | 12.1 | 6.5 | 7.3 | 1 | 5.4 | −1.5 | 13.4 | 2.7 | 7.5 | 2.4 | 5.7 | −2.2 |
| AZEL | 6.5 | 19.7 | 13 | 2.3 | 7.4 | 6.6 | 35.4 | −5.3 | 10.9 | −0.7 | 11.6 | 1.5 |
| AZAL | 17.4 | −14.5 | 7.7 | −1.4 | 4.4 | −0.4 | 20.9 | −3.3 | 8.2 | −5.2 | 8.1 | −4.9 |
| BZAL | 5.2 | 7 | 3.5 | 8.2 | 2.9 | 8.9 | 9.3 | 6.2 | 3.9 | 6.6 | 10.7 | 4.2 |
| BZEL | 13.0 | −9.2 | 5.1 | −1.8 | 6.1 | −2.4 | 15.9 | −1.8 | 8.1 | −4.9 | 6.6 | −5.3 |
| ZAN | 11.7 | −40.5 | 3.9 | 8.8 | 4.6 | 3.0 | 21.5 | −32.4 | 3.6 | 9.8 | 7.1 | 0.4 |
| TEA | 2.8 | 19.0 | 3.2 | 8.2 | 3.6 | 4.5 | 10.7 | 18.2 | 3.4 | 8.7 | 5.8 | 4.8 |
| AOH | 17.6 | −32.2 | 3.5 | 8.6 | 3.8 | −0.4 | 26.9 | −20.8 | 4.5 | 9.5 | 5.3 | −3.1 |
| AME | 14.1 | 10.1 | 7.7 | 2.4 | 4.8 | −12.3 | 18.7 | −5.3 | 7.0 | 4.8 | 5.9 | −11.9 |
| DON | 24.9 | −8.0 | 6.9 | 1.0 | 5.6 | −5.7 | 22.3 | 4.4 | 10.0 | 2.3 | 8 | −4.6 |
| DOM-1 | 17.5 | −0.4 | 15.0 | −3.3 | 5.9 | −6.9 | 14.7 | −2.0 | 14 | −2.7 | 7.9 | −7.3 |
| 3/15 ADON | 15.6 | 7.5 | 5.2 | 5.2 | 6.4 | −3.5 | 16.4 | 10.9 | 5.4 | 6.9 | 8.6 | −3.5 |
| T2 | 15.4 | 3.3 | 1.6 | 7.7 | 2.7 | 8.4 | 12.7 | 3.7 | 1.5 | 8.1 | 6.2 | 5.0 |
| HT2 | 21.1 | −29.8 | 6.5 | −14.0 | 9.9 | 5.8 | 30.5 | −21.4 | 10.0 | −11.5 | 5.7 | 2.1 |
| T2G | 10.8 | −3.8 | 7.8 | 6.9 | 7.0 | 1.3 | 23.8 | −2.6 | 9.5 | 4.1 | 13.8 | 6.6 |
| AFB1 | 13.1 | −14.3 | 3.0 | 3.9 | 4.9 | −2.0 | 16.4 | −16.9 | 3.6 | 4.5 | 6.3 | −2.8 |
| AFM1 | 11.2 | −38.8 | 10.6 | −19.5 | 8.8 | −15.6 | 28.0 | −28.5 | 18.8 | −7.1 | 20.2 | −5.4 |
| OTA | 7.5 | 13.4 | 8.7 | −13.3 | 4.5 | −12.3 | 14.4 | 2.5 | 7.2 | −12.5 | 9.2 | −8.0 |
| ENN A1 | 15.7 | −11.3 | 12.6 | −3.7 | 6.7 | 1.8 | 14.6 | −2.3 | 10.8 | −0.8 | 9.6 | −0.9 |
| ENNA | 19.4 | −1.0 | 9.4 | −14.1 | 11.7 | −14.7 | 41.7 | −11.2 | 13.8 | −6.8 | 13.5 | −5.6 |
| ENNB | 16.7 | −0.1 | 11.8 | 9.6 | 2.6 | 9.4 | 16.8 | −1.4 | 13.9 | −1.3 | 6.6 | 4.1 |
| ENNB1 | 7.6 | 16.1 | 3.9 | −0.1 | 3.5 | −3.9 | 31.8 | 1.6 | 8.7 | 5.5 | 3.2 | −3.2 |
| BEA | 13.3 | −2.9 | 3.2 | 6.9 | 3.2 | 7.4 | 29.7 | −6.3 | 2.3 | 7.2 | 11.9 | 8.5 |
| Name | Measured Form/Adduct | Precursor Ion (m/z) | Quantifier Ion (m/z) | Qualifier Ion (m/z) | Cone Voltage (V) | Collision Energy (eV) (a-b) | Retention Time (min) |
|---|---|---|---|---|---|---|---|
| ZEN | [M − H]− | 317.1 | 175.0 | 130.8 | 15 | 25-30 | 8.50 |
| ZAN | [M − H]− | 319.1 | 275.0 | 205.0 | 20 | 20-22 | 8.41 |
| BZEL | [M − H]− | 319.2 | 275.0 | 301.0 | 20 | 20-22 | 6.87 |
| BZAL | [M − H]− | 321.2 | 277.2 | 303.3 | 30 | 23-20 | 6.75 |
| AZEL | [M − H]− | 319.2 | 275.0 | 301.0 | 20 | 20-22 | 7.51 |
| AZAL | [M − H]− | 321.2 | 277.2 | 303.3 | 30 | 23-20 | 7.36 |
| TeA | [M − H]− | 196.1 | 112.0 | 139.0 | 55 | 23-23 | 6.06 |
| AOH | [M − H]− | 256.8 | 213.0 | 185.2 | 20 | 28-28 | 6.33 |
| AME | [M − H]− | 271.1 | 256.0 | 228.0 | 48 | 24-30 | 8.38 |
| [13C18]-zearalenone | [M − H]− | 335.3 | 185.1 | 169.1 | 15 | 28-40 | 8.50 |
| [13C615N]-tenuazonic acid | [M − H]− | 202.9 | 113.1 | 141.9 | 40 | 23-20 | 6.06 |
| Name | Measured Form/Adduct | Precursor Ion (m/z) | Quantifier Ion (m/z) | Qualifier Ion (m/z) | Cone Voltage (V) | Collision Energy (eV) (a-b) | Retention Time (min) |
|---|---|---|---|---|---|---|---|
| DON | [M + H]+ | 297.0 | 249.1 | 203.4 | 20 | 9-14 | 4.36 |
| DOM1 | [M + H]+ | 281.0 | 215.0 | 233.0 | 30 | 12-12 | 4.70 |
| 3/15-ADON | [M + H]+ | 339.2 | 213.1 | 230.9 | 25 | 12-8 | 5.02 |
| T2 | [M + NH4]+ | 484.0 | 215.2 | 304.8 | 26 | 18-15 | 8.24 |
| HT2 | [M + NH4]+ | 442.0 | 263.0 | 215.1 | 20 | 10-10 | 7.01 |
| T2-G | [M + NH4]+ | 646.0 | 245.0 | 215.3 | 35 | 20-22 | 7.20 |
| AFB1 | [M + H]+ | 313.0 | 285.1 | 241.1 | 35 | 23-34 | 5.63 |
| AFM1 | [M + H[+ | 328.9 | 272.9 | 229.0 | 30 | 20-35 | 5.18 |
| OTA | [M + H]+ | 404.0 | 238.9 | 220.8 | 35 | 20-32 | 9.23 |
| ENN A1 | [M + H]+ | 668.2 | 210.1 | 227.9 | 80 | 20-20 | 12.96 |
| ENN A | [M + Na]+ | 704.5 | 350.1 | 232.2 | 35 | 48-48 | 13.12 |
| ENN B | [M + H]+ | 640.1 | 213.8 | 527.2 | 80 | 22-21 | 12.69 |
| ENN B1 | [M + NH4]+ | 671.5 | 196.2 | 214.3 | 30 | 28-28 | 12.84 |
| BEA | [M + H]+ | 784.1 | 244.0 | 262.1 | 80 | 25-30 | 12.81 |
| FB2 | [M + H]+ | 706.10 | 318.2 | 336.2 | 60 | 35-42 | 10.07 |
| [13C15]-Deoxynivalenol | [M + H]+ | 312.0 | 263.0 | 245.0 | 20 | 10-10 | 4.37 |
| [13C17]-Aflatoxin B1 | [M + H]+ | 330.10 | 255.1 | 301.0 | 20 | 35-28 | 5.63 |
| [13C20]-Ochratoxin A | [M + H]+ | 424.0 | 250.0 | 377.1 | 20 | 25-15 | 9.23 |
| [13C24]-T2-toxin | [M + NH4]+ | 508.40 | 229.1 | 198.2 | 25 | 20-20 | 8.24 |
| [13C34]-Fumonisin B1 | [M + H]+ | 756.50 | 356.2 | 374.3 | 15 | 40-35 | 9.67 |
| [15N3]-Enniatin B | [M + H]+ | 643.30 | 197.1 | 215.30 | 80 | 18-18 | 12.69 |
© 2019 by the authors. Licensee MDPI, Basel, Switzerland. This article is an open access article distributed under the terms and conditions of the Creative Commons Attribution (CC BY) license (http://creativecommons.org/licenses/by/4.0/).
Share and Cite
Lauwers, M.; De Baere, S.; Letor, B.; Rychlik, M.; Croubels, S.; Devreese, M. Multi LC-MS/MS and LC-HRMS Methods for Determination of 24 Mycotoxins including Major Phase I and II Biomarker Metabolites in Biological Matrices from Pigs and Broiler Chickens. Toxins 2019, 11, 171. https://0-doi-org.brum.beds.ac.uk/10.3390/toxins11030171
Lauwers M, De Baere S, Letor B, Rychlik M, Croubels S, Devreese M. Multi LC-MS/MS and LC-HRMS Methods for Determination of 24 Mycotoxins including Major Phase I and II Biomarker Metabolites in Biological Matrices from Pigs and Broiler Chickens. Toxins. 2019; 11(3):171. https://0-doi-org.brum.beds.ac.uk/10.3390/toxins11030171
Chicago/Turabian StyleLauwers, Marianne, Siegrid De Baere, Ben Letor, Michael Rychlik, Siska Croubels, and Mathias Devreese. 2019. "Multi LC-MS/MS and LC-HRMS Methods for Determination of 24 Mycotoxins including Major Phase I and II Biomarker Metabolites in Biological Matrices from Pigs and Broiler Chickens" Toxins 11, no. 3: 171. https://0-doi-org.brum.beds.ac.uk/10.3390/toxins11030171