Development and Validation of a Liquid Chromatography High-Resolution Mass Spectrometry Method for the Simultaneous Determination of Mycotoxins and Phytoestrogens in Plant-Based Fish Feed and Exposed Fish


 and
and
Abstract
:1. Introduction
2. Results and Discussion
2.1. Fish Feed with Fixed Contents of Wheat Gluten, Soy Protein or Pea Protein
2.2. Exposure of Zebrafish and Salmon to Plant-Derived Aquafeeds
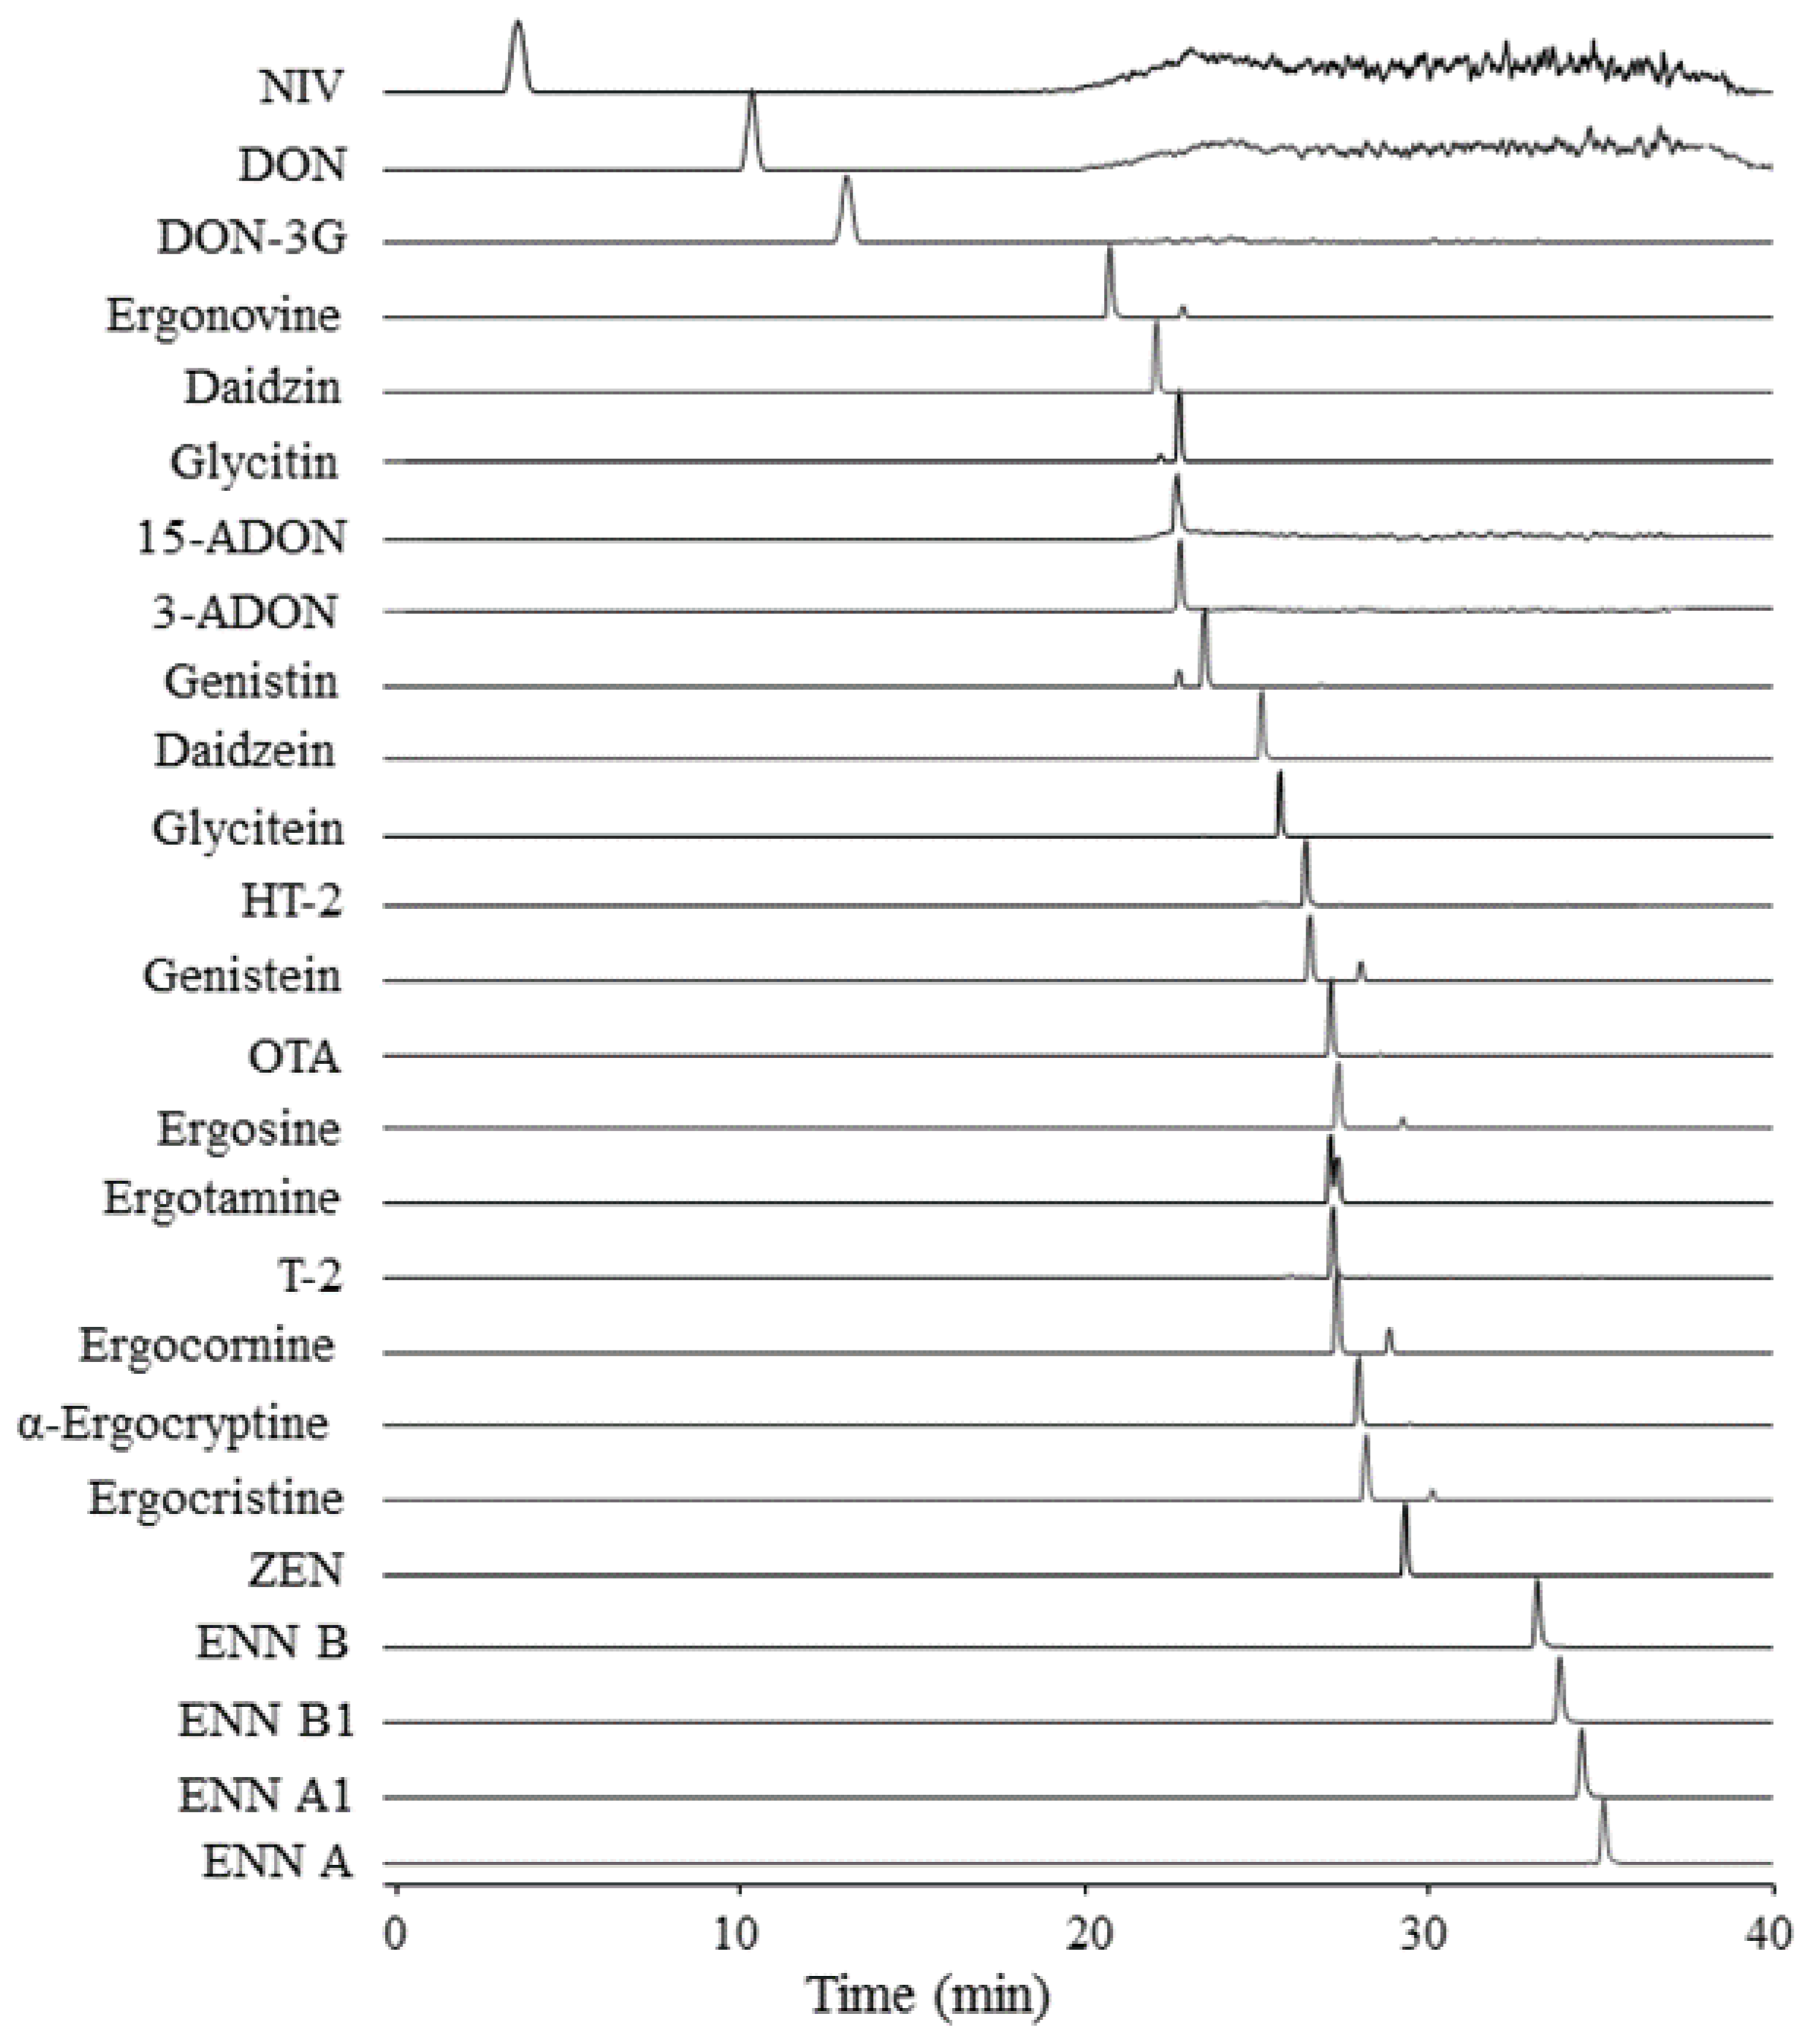
2.3. Characteristics of Targeted Analytes in Method
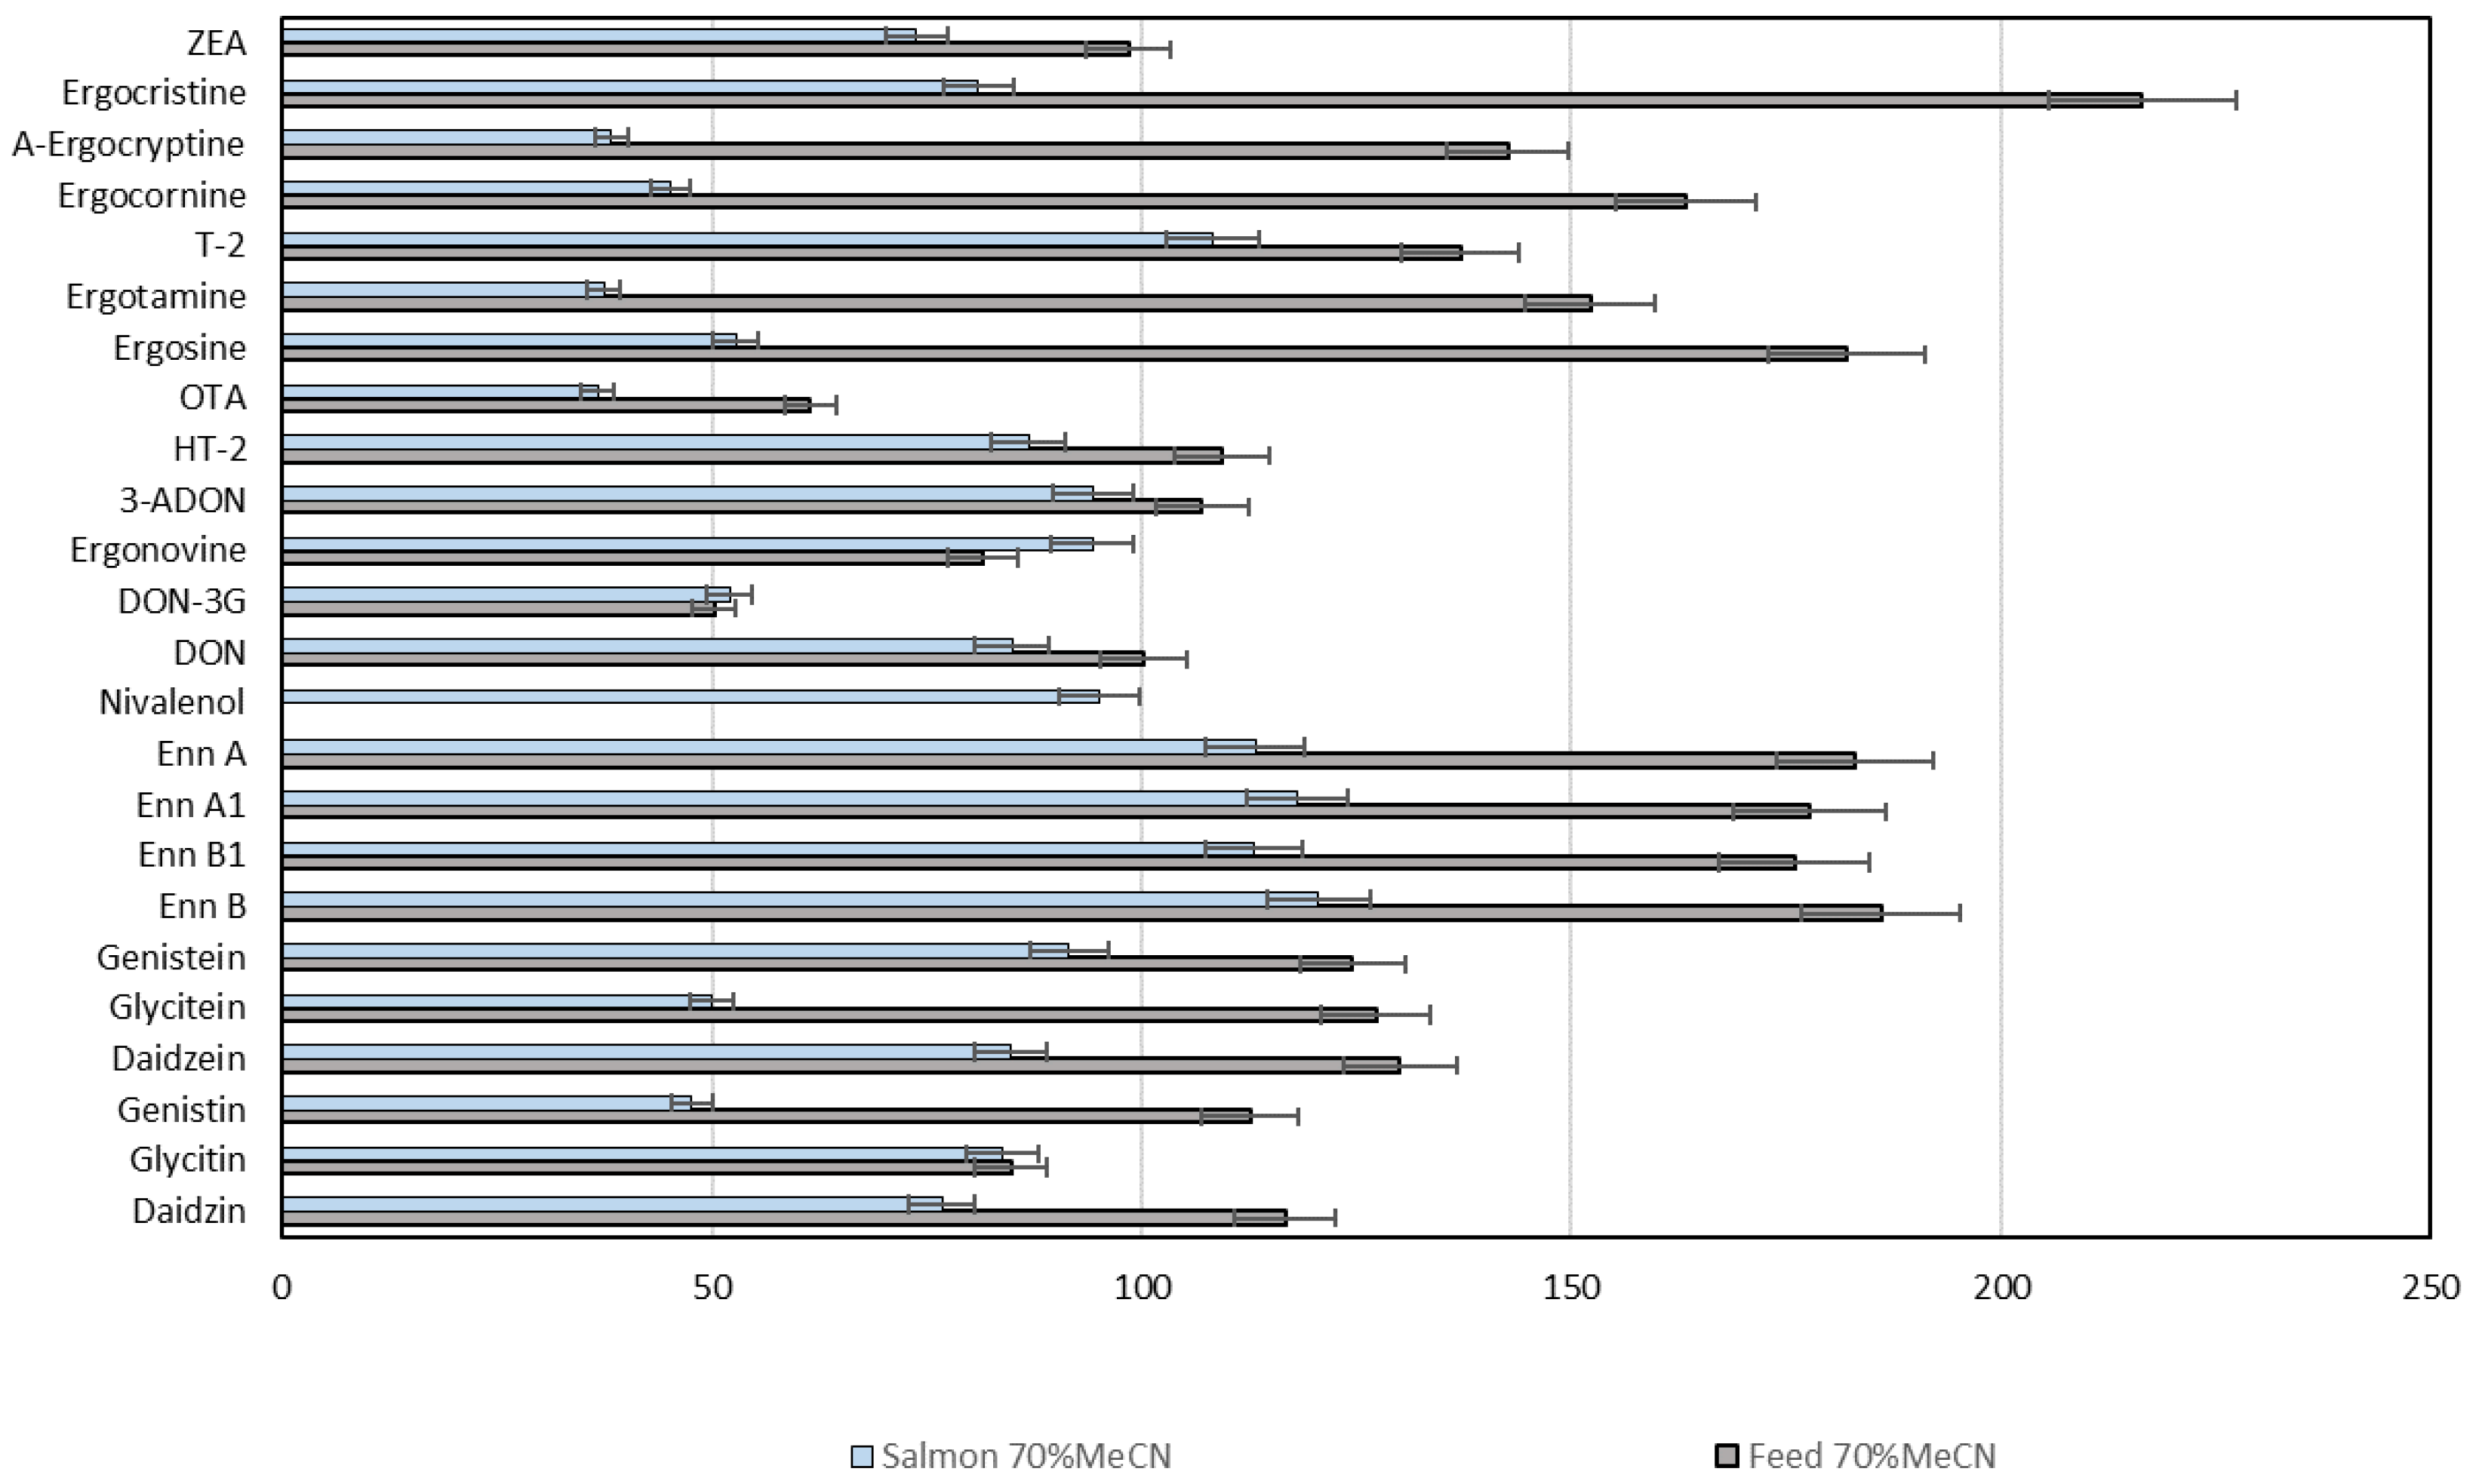
2.4. Optimisation of Sample Preparation
2.5. Performance of the Multi-Analyte LC-HRMS/MS Method
2.6. Mycotoxins and Phytoestrogens in Fish Feed, Zebrafish and Salmon Tissues
3. Conclusions
4. Materials and Methods
4.1. Chemicals
4.2. Preparation of Fish Diets
4.3. Feeding Studies in Zebrafish and On-Growing Salmon
4.3.1. Zebrafish
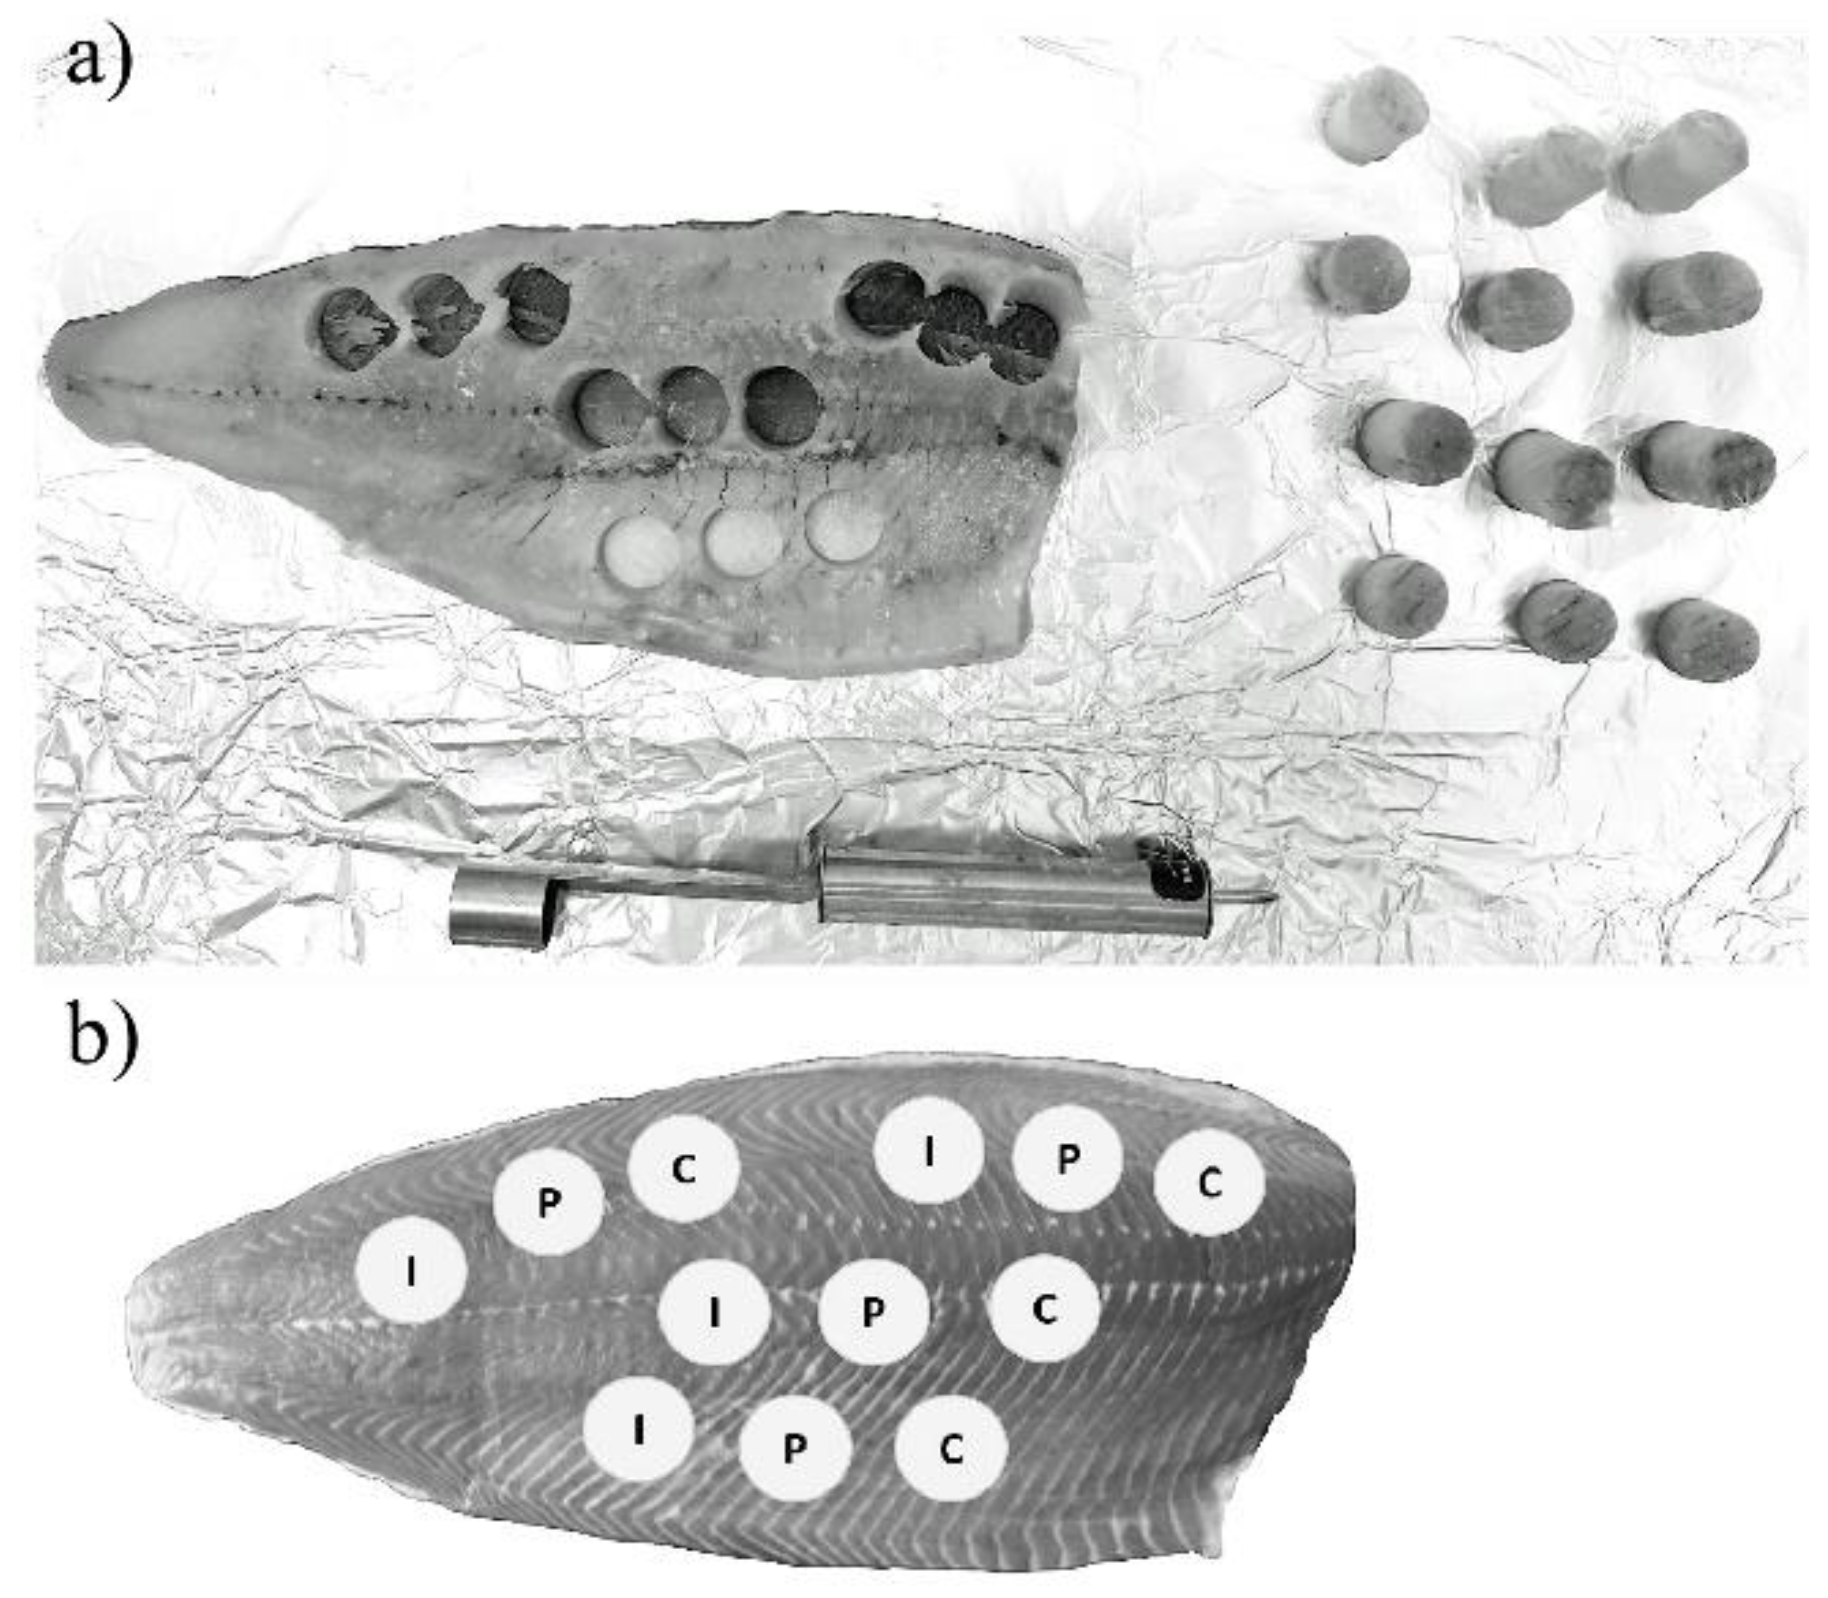
4.3.2. Salmon
4.4. Extraction of Fish Feed, Zebrafish and Salmon Samples
4.4.1. Fish Feed
4.4.2. Zebrafish
4.4.3. Salmon
4.5. Preparation of Matrix-Assisted Standard Calibration Curves
4.6. Development of the Multi-Analyte Liquid Chromatography High-Resolution Mass Spectrometry (LC-HRMS/MS) Method
4.7. Validation of the Multi-Analyte LC-HRMS/MS Method
4.8. Data Analysis
Supplementary Materials
Author Contributions
Funding
Acknowledgments
Conflicts of Interest
References
- FAO. The State of World Fisheries and Aquaculture 2018-Meeting the Sustainable Development Goals; FAO: Rome, Italy, 2018. [Google Scholar]
- Froehlich, H.E.; Runge, C.A.; Gentry, R.R.; Gaines, S.D.; Halpern, B.S. Comparative terrestrial feed and land use of an aquaculture-dominant world. Proc. Natl. Acad. Sci. USA 2018, 115, 5295. [Google Scholar] [CrossRef] [PubMed]
- Kraugerud, O.F.; Jørgensen, H.Y.; Svihus, B. Physical properties of extruded fish feed with inclusion of different plant (legumes, oilseeds, or cereals) meals. Anim. Feed Sci. Technol. 2011, 163, 244–254. [Google Scholar] [CrossRef]
- Francis, G.; Makkar, H.P.S.; Becker, K. Antinutritional factors present in plant-derived alternate fish feed ingredients and their effects in fish. Aquaculture 2001, 199, 197–227. [Google Scholar] [CrossRef]
- Hardy, R.W. Utilization of plant proteins in fish diets: Effects of global demand and supplies of fishmeal. Aquacult. Res. 2010, 41, 770–776. [Google Scholar] [CrossRef]
- Morken, T.; Kraugerud, O.F.; Sørensen, M.; Storebakken, T.; Hillestad, M.; Christiansen, R.; Øverland, M. Effects of feed processing conditions and acid salts on nutrient digestibility and physical quality of soy-based diets for Atlantic salmon (Salmo salar). Aquacult. Nutr. 2012, 18, 21–34. [Google Scholar] [CrossRef]
- Opstvedt, J.; Aksnes, A.; Hope, B.; Pike, I.H. Efficiency of feed utilization in Atlantic salmon (Salmo salar L.) fed diets with increasing substitution of fish meal with vegetable proteins. Aquaculture 2003, 221, 365–379. [Google Scholar] [CrossRef]
- Krogdahl, Å.; Penn, M.; Thorsen, J.; Refstie, S.; Bakke, A.M. Important antinutrients in plant feedstuffs for aquaculture: An update on recent findings regarding responses in salmonids. Aquacult. Res. 2010, 41, 333–344. [Google Scholar] [CrossRef]
- Bora, P. Anti-nutritional factors in foods and their effects. J. Acad. Ind. Res. 2014, 3, 285–290. [Google Scholar]
- Andersen, L.F.; Andreassen, Å.K.; Elvevoll, E.O.; Hemre, G.I.; Hjeltnes, B.; Hofshagen, M.; Iversen, P.O.; Krogdahl, Å.; Källqvist, T.; Rafoss, T. Research Needs and Data Gaps of Importance for Food Safety and Protection of Biodiversity; VKM Report 2005–2015; Scientific Steering Committee of the Norwegian Scientific Committee for Food Safety: Skøyen, Norway, 2016. [Google Scholar]
- Gonçalves, R.A.; Naehrer, K.; Santos, G.A. Occurrence of mycotoxins in commercial aquafeeds in Asia and Europe: A real risk to aquaculture? Rev. Aquacult. 2016, 10, 263–280. [Google Scholar] [CrossRef]
- Greco, M.; Pardo, A.; Pose, G. Mycotoxigenic fungi and natural co-occurrence of mycotoxins in rainbow trout (Oncorhynchus mykiss) feeds. Toxins 2015, 7, 4595–4609. [Google Scholar] [CrossRef]
- Nácher-Mestre, J.; Ibáñez, M.; Serrano, R.; Pérez-Sánchez, J.; Hernández, F. Qualitative screening of undesirable compounds from feeds to fish by liquid chromatography coupled to mass spectrometry. J. Agric. Food. Chem. 2013, 61, 2077–2087. [Google Scholar] [CrossRef]
- Pietsch, C.; Kersten, S.; Burkhardt-Holm, P.; Valenta, H.; Dänicke, S. Occurrence of deoxynivalenol and zearalenone in commercial fish feed: An initial study. Toxins 2013, 5, 184–192. [Google Scholar] [CrossRef]
- Sele, V.; Sanden, M.; Berntssen, M.; Lunestad, B.T.; Espe, M.; Lie, K.K.; Amlund, H.; Lundebye, A.-K.; Hemre, G.I.; Waagbø, R. Program for Overvåking av Fiskefôr; Havforskningen Instituttet: Bergen, Norway, 2018. [Google Scholar]
- Woźny, M.; Obremski, K.; Jakimiuk, E.; Gusiatin, M.; Brzuzan, P. Zearalenone contamination in rainbow trout farms in north-eastern Poland. Aquaculture 2013, 416–417, 209–211. [Google Scholar] [CrossRef]
- Matsumoto, T.; Kobayashi, M.; Moriwaki, T.; Kawai, S.i.; Watabe, S. Survey of estrogenic activity in fish feed by yeast estrogen-screen assay. Comp. Biochem. Physiol. C 2004, 139, 147–152. [Google Scholar] [CrossRef] [PubMed]
- Quesada-García, A.; Valdehita, A.; Fernández-Cruz, M.L.; Leal, E.; Sánchez, E.; Martín-Belinchón, M.; Cerdá-Reverter, J.M.; Navas, J.M. Assessment of estrogenic and thyrogenic activities in fish feeds. Aquaculture 2012, 338–341, 172–180. [Google Scholar] [CrossRef]
- Matejova, I.; Svobodova, Z.; Vakula, J.; Mares, J.; Modra, H. Impact of Mycotoxins on Aquaculture Fish Species: A Review. J. World Aquacult. Soc. 2017, 48, 186–200. [Google Scholar] [CrossRef]
- Sweeney, M.J.; Dobson, A.D. Mycotoxin production by Aspergillus, Fusarium and Penicillium species. Int. J. Food Microbiol. 1998, 43, 141–158. [Google Scholar] [CrossRef]
- Da Rocha, M.E.B.; Freire, F.d.C.O.; Maia, F.E.F.; Guedes, M.I.F.; Rondina, D. Mycotoxins and their effects on human and animal health. Food Control 2014, 36, 159–165. [Google Scholar] [CrossRef]
- Jestoi, M.; Rokka, M.; Järvenpää, E.; Peltonen, K. Determination of Fusarium mycotoxins beauvericin and enniatins (A, A1, B, B1) in eggs of laying hens using liquid chromatography–tandem mass spectrometry (LC–MS/MS). Food Chem. 2009, 115, 1120–1127. [Google Scholar] [CrossRef]
- Bernhoft, A.; Eriksen, G.S.; Sundheim, L.; Berntssen, M.; Brantsæter, A.L.; Brodal, G.; Fæste, C.K.; Hofgaard, I.S.; Rafoss, T.; Sivertsen, T.; et al. Risk Assessment of Mycotoxins in Cereal Grain in Norway. Opinion of the Scientific Steering Committee of the Norwegian Scientific Committee for Food Safety; VKM Report: Oslo, Norway, 2013. [Google Scholar]
- Commission, E. Commission Recommendation NO 2006/576/EC of 17 August 2006 on the Presence of Deoxynivalenol, Zearalenone, Ochratoxin A, T-2 and HT-2 and Fumonisins in Products Intended for animal Feeding. 2006. Available online: https://eur-lex.europa.eu/legal-content/EN/TXT/PDF/?uri=CELEX:32006H0576&from=EN (accessed on 1 March 2019).
- Commission, E. Commission Recommendation NO 2013/165/EU of 27 March 2013 on the Presence of T-2 and HT-2 Toxin in Cereals and Cereal Products. Off. J. Eur. Union 2013, L91/12. Available online: https://eur-lex.europa.eu/legal content/EN/TXT/PDF/?uri=CELEX:32013H0165&from=EN (accessed on 1 March 2019).
- Pinto, P.I.S.; Estêvão, M.D.; Andrade, A.; Santos, S.; Power, D.M. Tissue responsiveness to estradiol and genistein in the sea bass liver and scale. J. Steroid Biochem. Mol. Biol. 2016, 158, 127–137. [Google Scholar] [CrossRef]
- Kurzer, M.S.; Xu, X. Dietary phytoestrogens. Annu. Rev. Nutr. 1997, 17, 353–381. [Google Scholar] [CrossRef]
- Rietjens, I.M.C.M.; Louisse, J.; Beekmann, K. The potential health effects of dietary phytoestrogens. Br. J. Pharmacol. 2017, 174, 1263–1280. [Google Scholar] [CrossRef]
- Ng, Y.; Hanson, S.; Malison, J.A.; Wentworth, B.; Barry, T.P. Genistein and other isoflavones found in soybeans inhibit oestrogen metabolism in salmonid fish. Aquaculture 2006, 254, 658–665. [Google Scholar] [CrossRef]
- Pandjaitan, N.; Hettiarachchy, N.; Ju, Z.Y. Enrichment of genistein in soy protein concentrate with b-glucosidase. J. Food Sci. 2000, 65, 403–407. [Google Scholar] [CrossRef]
- Cleveland, B.M. In vitro and in vivo effects of phytoestrogens on protein turnover in rainbow trout (Oncorhynchus mykiss) white muscle. Comp. Biochem. Physiol. Part C Toxicol. Pharmacol. 2014, 165, 9–16. [Google Scholar] [CrossRef]
- Andrade, P.D.; Dantas, R.R.; Moura-Alves, T.L.d.S.d.; Caldas, E.D. Determination of multi-mycotoxins in cereals and of total fumonisins in maize products using isotope labeled internal standard and liquid chromatography/tandem mass spectrometry with positive ionization. J. Chromatogr. A 2017, 1490, 138–147. [Google Scholar] [CrossRef]
- Beltrán, E.; Ibáñez, M.; Sancho, J.V.; Hernández, F. Determination of mycotoxins in different food commodities by ultra-high-pressure liquid chromatography coupled to triple quadrupole mass spectrometry. Rapid Commun. Mass Spectrom. 2009, 23, 1801–1809. [Google Scholar] [CrossRef]
- Berthiller, F.; Brera, C.; Iha, M.H.; Krska, R.; Lattanzio, V.M.T.; MacDonald, S.; Malone, R.J.; Maragos, C.; Solfrizzo, M.; Stranska-Zachariasova, M.; et al. Developments in mycotoxin analysis: An update for 2015–2016. World Mycotoxin J. 2017, 10, 5–29. [Google Scholar] [CrossRef]
- De Santis, B.; Debegnach, F.; Gregori, E.; Russo, S.; Marchegiani, F.; Moracci, G.; Brera, C. Development of a LC-MS/MS method for the multi-mycotoxin determination in composite cereal-based samples. Toxins 2017, 9, 169. [Google Scholar] [CrossRef]
- Ivanova, L.; Sahlstrøm, S.; Rud, I.; Uhlig, S.; Fæste, C.K.; Eriksen, G.S.; Divon, H.H. Effect of primary processing on the distribution of free and modified Fusarium mycotoxins in naturally contaminated oats. World Mycotoxin J. 2017, 10, 73–88. [Google Scholar] [CrossRef]
- Malachová, A.; Sulyok, M.; Beltrán, E.; Berthiller, F.; Krska, R. Optimization and validation of a quantitative liquid chromatography–tandem mass spectrometric method covering 295 bacterial and fungal metabolites including all regulated mycotoxins in four model food matrices. J. Chromatogr. A 2014, 1362, 145–156. [Google Scholar] [CrossRef]
- Sulyok, M.; Krska, R.; Schuhmacher, R. A liquid chromatography/tandem mass spectrometric multi-mycotoxin method for the quantification of 87 analytes and its application to semi-quantitative screening of moldy food samples. Anal. Bioanal. Chem. 2007, 389, 1505–1523. [Google Scholar] [CrossRef]
- Sun, W.; Han, Z.; Aerts, J.; Nie, D.; Jin, M.; Shi, W.; Zhao, Z.; De Saeger, S.; Zhao, Y.; Wu, A. A reliable liquid chromatography–tandem mass spectrometry method for simultaneous determination of multiple mycotoxins in fresh fish and dried seafoods. J. Chromatogr. A 2015, 1387, 42–48. [Google Scholar] [CrossRef]
- Varga, E.; Glauner, T.; Köppen, R.; Mayer, K.; Sulyok, M.; Schuhmacher, R.; Krska, R.; Berthiller, F. Stable isotope dilution assay for the accurate determination of mycotoxins in maize by UHPLC-MS/MS. Anal. Bioanal. Chem. 2012, 402, 2675–2686. [Google Scholar] [CrossRef]
- Ciasca, B.; Pascale, M.; Altieri, V.G.; Longobardi, F.; Suman, M.; Catellani, D.; Lattanzio, V.M.T. In-house validation and small-scale collaborative study to evaluate analytical performances of multimycotoxin screening methods based on liquid chromatography–high-resolution mass spectrometry: Case study on Fusarium toxins in wheat. J. Mass Spectrom. 2018, 53, 743–752. [Google Scholar] [CrossRef]
- Lampe, J.W. Isoflavonoid and lignan phytoestrogens as dietary biomarkers. J. Nutr. 2003, 133, 956S–964S. [Google Scholar] [CrossRef]
- Wielogórska, E.; Elliott, C.T.; Danaher, M.; Chevallier, O.; Connolly, L. Validation of an ultra high performance liquid chromatography–tandem mass spectrometry method for detection and quantitation of 19 endocrine disruptors in milk. Food Control 2015, 48, 48–55. [Google Scholar] [CrossRef]
- Horn-Ross, P.L.; Barnes, S.; Lee, M.; Coward, L.; Mandel, J.E.; Koo, J.; John, E.M.; Smith, M. Assessing phytoestrogen exposure in epidemiologic studies: Development of a database (United States). Cancer Causes Control 2000, 11, 289–298. [Google Scholar] [CrossRef]
- Kuhnle, G.G.C.; Dell’Aquila, C.; Low, Y.-L.; Kussmaul, M.; Bingham, S.A. Extraction and quantification of phytoestrogens in foods using automated solid-phase extraction and LC/MS/MS. Anal. Chem. 2007, 79, 9234–9239. [Google Scholar] [CrossRef]
- Bernhoft, A.; Høgåsen, H.R.; Rosenlund, G.; Ivanova, L.; Berntssen, M.H.G.; Alexander, J.; Eriksen, G.S.; Fæste, C.K. Tissue distribution and elimination of deoxynivalenol and ochratoxin A in dietary-exposed Atlantic salmon (Salmo salar). Food Addit. Contam. A 2017, 34, 1211–1224. [Google Scholar] [CrossRef]
- Kuhnle, G.G.C.; Dell’Aquila, C.; Aspinall, S.M.; Runswick, S.A.; Mulligan, A.A.; Bingham, S.A. Phytoestrogen content of foods of animal origin: Dairy products, eggs, meat, fish, and seafood. J. Agric. Food. Chem. 2008, 56, 10099–10104. [Google Scholar] [CrossRef] [PubMed]
- Gomes, E.F.; Corraze, G.; Kaushik, S. Effects of dietary incorporation of a co-extruded plant protein (rapeseed and peas) on growth, nutrient utilization and muscle fatty acid composition of rainbow trout (Oncorhynchus mykiss). Aquaculture 1993, 113, 339–353. [Google Scholar] [CrossRef]
- Commission, E. Guidance Document on Identification of Mycotoxins in Food and Feed. SANTE/12089. 2016. Available online: https://ec.europa.eu/food/sites/food/files/safety/docs/cs_contaminants_sampling_guid-doc-ident-mycotoxins.pdf (accessed on 6 March 2019).
- International Organization for Standardization. Guide to Method Validation for Quantitative Analysis in Chemical Testing Laboratories. ISO/IEC 17025. 5 September 2018. Available online: https://www.iso.org/files/live/sites/isoorg/files/store/en/PUB100424.pdf (accessed on 6 March 2019).
- Norwegian Food Safety Authority. Anbefalte Grenseverdier for sopp og Mykotoksiner in Fôrvarer; Norwegian Food Safety Authority: Oslo, Norway, 2018.
- Maranghi, F.; Tassinari, R.; Narciso, L.; Tait, S.; Rocca, C.L.; Felice, G.D.; Butteroni, C.; Corinti, S.; Barletta, B.; Cordelli, E.; et al. In vivo toxicity and genotoxicity of beauvericin and enniatins. Combined approach to study in vivo toxicity and genotoxicity of mycotoxins beauvericin (BEA) and enniatin B (ENNB). EFSA Support. Publ. 2018, 15, 1406E. [Google Scholar] [CrossRef]
- Tolosa, J.; Font, G.; Mañes, J.; Ferrer, E. Natural Occurrence of Emerging Fusarium Mycotoxins in Feed and Fish from Aquaculture. J. Agric. Food. Chem. 2014, 62, 12462–12470. [Google Scholar] [CrossRef]
- Vitenskapskomiteen for Mat og Miljø. Risk Assessment of Mycotoxins in Cereal Grain in Norway; VKM Report: Oslo, Norway, 2013. [Google Scholar]
- Miura, A.; Sugiyama, C.; Sakakibara, H.; Simoi, K.; Goda, T. Bioavailability of isoflavones from soy products in equol producers and non-producers in Japanese women. J. Nutr. Intermed. Metabol. 2016, 6, 41–47. [Google Scholar] [CrossRef]
- Li, Y.; Yu, H.; Xue, M.; Zhang, Y.; Mai, K.; Hu, H.; Liu, J. A tolerance and safety assessment of daidzein in a female fish (Carassius auratus gibelio). Aquacult. Res. 2016, 47, 1191–1201. [Google Scholar] [CrossRef]
- Lovdata. Regulations on the Use of Animals in Experiments, FOR-2015-06-18-761; Ministry of Agriculture and Food: Oslo, Norway, 2015.
- The European Parliament and Commission. Directive 2010/63/EU of the European Parliament and of the Council of 22 September 2010 on the protection of animals used for scientific purposes. Off. J. Eur. Union 2010, L276, 33–79. [Google Scholar]
- Shrivastava, A.; Gupta, V. Methods for the determination of limit of detection and limit of quantitation of the analytical methods. Chron. Young Sci. 2011, 2, 21–25. [Google Scholar] [CrossRef]
- Horwitz, W. Protocol for the design, conduct and interpretation of method-performance studies: Revised 1994 (Technical Report). Pure Appl. Chem. 2009, 67, 331–343. [Google Scholar] [CrossRef]


| Diet Composition (g/100 g) | FM (Control) | SPC15 | SPC30 | WG15 | WG30 | PPC15 | PPC30 |
|---|---|---|---|---|---|---|---|
| Salmon | |||||||
| Fish meal | 63.35 | 48.35 | 33.35 | 48.35 | 33.35 | - | - |
| Wheat | 12.0 | 12.0 | 12.0 | 12.0 | 12.0 | - | - |
| Soy prot. conc. | - | 15.0 | 30.0 | - | - | - | - |
| Wheat gluten | - | - | - | 15.0 | 30.0 | - | - |
| Fish oil | 20.0 | 20.0 | 20.0 | 20.0 | 20.0 | - | - |
| Additives # | 4.65 | 4.65 | 4.65 | 4.65 | 4.65 | - | - |
| Total protein | 45.2 | 44.6 | 44.0 | 46.7 | 48.1 | - | - |
| Total lipids | 26.5 | 25.1 | 23.8 | 25.4 | 24.3 | - | - |
| Zebrafish | |||||||
| Fish meal | 79.35 | 64.35 | 49.35 | 64.35 | 49.35 | 64.35 | 49.35 |
| Wheat | 12.0 | 12.0 | 12.0 | 12.0 | 12.0 | 12.0 | 12.0 |
| Soy prot. conc. | - | 15.0 | 30.0 | - | - | - | - |
| Wheat gluten | - | - | - | 15.0 | 30.0 | - | - |
| Pea prot. conc. | - | - | - | - | - | 15.0 | 30.0 |
| Fish oil | 4.0 | 4.0 | 4.0 | 4.0 | 4.0 | 4.0 | 4.0 |
| Additives # | 4.65 | 4.65 | 4.65 | 4.65 | 4.65 | 4.65 | 4.65 |
| Total crude protein | 56.2 | 55.6 | 55.0 | 57.7 | 59.1 | 53.1 | 49.9 |
| Total lipids | 12.0 | 10.7 | 9.4 | 10.9 | 9.8 | 11.3 | 10.7 |
| Compound | Ionisation Mode | Target Ion | RT (min) | Precursor (m/z) | NCE (ev) | Fish Feed (R2) | Salmon (R2) | Zebrafish (R2) | ISTD |
|---|---|---|---|---|---|---|---|---|---|
| DON | ESI neg | [M+CH3COO]− | 12.3 | 355.1387 | 17 | 0.9996 | 0.9964 | 0.9996 | 13C-DON |
| 3-ADON | ESI neg | [M+CH3COO]− | 23.8 | 397.1493 | 15 | 0.9998 | 0.9975 | 0.9999 | 13C-3-ADON |
| 15-ADON | ESI pos | [M+Na]+ | 23.7 | 361.1258 | 15 | 0.9999 | 0.9986 | 0.9969 | 13C-15-ADON |
| DON-3G | ESI neg | [M+CH3COO]− | 15.1 | 517.1916 | 17 | 0.9993 | 0.9935 | 0.9851 | 13C-DON-3G |
| NIV | ESI neg | [M+CH3COO]− | 5.30 | 371.1337 | 17 | 0.9983 | 0.9901 | 0.9972 | 13C-NIV |
| T-2 | ESI pos | [M+NH4]+ | 28.0 | 484.2541 | 15 | 0.9995 | 0.9978 | 0.9995 | 13C-T-2 |
| HT-2 | ESI neg | [M+CH3COO]− | 26.4 | 483.2225 | 15 | 0.9998 | 0.9961 | 0.9998 | 13C-HT-2 |
| OTA | ESI neg | [M−H]− | 27.3 | 402.0739 | 32 | 0.9992 | 0.9984 | 0.9998 | 13C-OTA |
| ZEN | ESI neg | [M−H]− | 29.5 | 317.1384 | 50 | 0.9999 | 0.9985 | 0.9998 | 13C-ZEN |
| Ergonovine | ESI pos | [M+H]+ | 21.9 | 326.1863 | 50 | 0.9996 | 0.9992 | 0.9999 | MetErg |
| Ergosine | ESI pos | [M+H]+ | 27.6 | 548.2868 | 27 | 0.9990 | 0.9979 | 0.9999 | BromCri |
| Ergotamine | ESI pos | [M+H]+ | 28.0 | 582.2711 | 32 | 0.9973 | 0.9985 | 0.9999 | BromCri |
| Ergocornine | ESI pos | [M+H]+ | 28.1 | 562.3024 | 25 | 0.9992 | 0.9973 | 0.9998 | BromCri |
| α-Ergocryptine | ESI pos | [M+H]+ | 28.8 | 576.3180 | 25 | 0.9993 | 0.9980 | 0.9999 | BromCri |
| Ergoscristine | ESI pos | [M+H]+ | 29.0 | 610.3024 | 27 | 0.9984 | 0.9980 | 0.9999 | BromCri |
| ENN A | ESI pos | [M+NH4]+ | 35.1 | 699.4903 | 27 | 0.9943 | 0.9981 | 0.9992 | - |
| ENN A1 | ESI pos | [M+NH4]+ | 34.4 | 685.4746 | 27 | 0.9984 | 0.9987 | 0.9991 | - |
| ENN B | ESI pos | [M+NH4]+ | 33.1 | 657.4433 | 27 | 0.9986 | 0.9952 | 0.9998 | - |
| ENN B1 | ESI pos | [M+NH4]+ | 33.8 | 671.4590 | 27 | 0.9993 | 0.9987 | 0.9993 | - |
| Daidzein | ESI neg | [M−H]− | 26.1 | 253.0506 | 75 | 0.9993 | 0.9980 | 0.9982 | - |
| Daidzin | ESI neg | [M+CH3COO]− | 23.1 | 475.1246 | 10 | 0.9997 | 0.9984 | 0.9998 | - |
| Genistein | ESI neg | [M−H]− | 27.3 | 269.0455 | 70 | 0.9997 | 0.9986 | 0.9979 | - |
| Genistin | ESI neg | [M+CH3COO]− | 24.4 | 491.1195 | 10 | 0.9994 | 0.9974 | 0.9999 | - |
| Glycitein | ESI neg | [M−H]− | 26.4 | 283.0612 | 35 | 0.9998 | 0.9997 | 0.9989 | - |
| Glycitin | ESI neg | [M+CH3COO]− | 23.6 | 505.1351 | 10 | 0.9994 | 0.9979 | 0.9994 | - |
| Compound | n | LOD | LOQ | SSE (%) | Total within Laboratory Precision (%) | Recovery ± SD (%) | ||||||||||
|---|---|---|---|---|---|---|---|---|---|---|---|---|---|---|---|---|
| (µg/L) | (µg/kg) | (µg/L) | (µg/kg) | |||||||||||||
| (a/b/c/d) | (a) | (b) | (c) | (d) | (a) | (b) | (c) | (d) | (b/c/d) | (b) | (c) | (b) | (c) | (d) | ||
| with ISTD | ||||||||||||||||
| DON | 4/4/3/3 | 3 | 23 | 67 | 22 | 9 | 78 | 225 | 74 | 77/87/133 | 4 | 4 | 90 ± 7 | 107 ± 13 | 92 ± 25 | |
| 3-ADON | 4/4/3/3 | 4 | 17 | 57 | 9 | 15 | 56 | 189 | 29 | 98/116/144 | 3 | 3 | 112 ± 17 | 96 ± 12 | 78 ± 20 | |
| 15-ADON | 4/3/3/3 | 5 | 6 | 43 | 63 | 16 | 20 | 142 | 210 | 96/161/141 | 10 | 3 | 133 ± 2 | 107 ± 25 | 86 ± 14 | |
| DON-3G | 4/4/3/3 | 5 | 36 | 115 | 176 | 18 | 121 | 383 | 588 | 85/95/119 | 11 | 22 | 19 ± 9 | 83 ± 20 | 48 ± 31 | |
| NIV | 4/4/3/3 | 19 | 59 | 144 | 76 | 63 | 196 | 479 | 252 | 71/65/115 | 17 | 41 | 57 ± 34 | 69 ± 33 | 41 ± 24 | |
| T-2 | 4/4/3/3 | 4 | 26 | 53 | 26 | 12 | 88 | 176 | 86 | 97/136/151 | 3 | 3 | 96 ± 17 | 99 ± 15 | 90 ± 19 | |
| HT-2 | 4/4/3/3 | 2 | 22 | 70 | 15 | 8 | 73 | 235 | 52 | 89/129/149 | 2 | 3 | 94 ± 18 | 96 ± 11 | 98 ± 15 | |
| OTA | 4/4/3/3 | 5 | 41 | 44 | 21 | 18 | 138 | 148 | 68 | 105/139/150 | 6 | 4 | 75 ± 13 | 87 ± 23 | 83 ± 20 | |
| ZEN | 4/4/3/3 | 6 | 11 | 43 | 14 | 22 | 38 | 143 | 47 | 90/125/125 | 1 | 2 | 109 ± 5 | 106 ± 18 | 96 ± 25 | |
| Ergonovine | 4/4/3/3 | 6 | 23 | 35 | 8 | 19 | 77 | 115 | 26 | 85/130/106 | 2 | 1 | 84 ± 8 | 98 ± 13 | 87 ± 30 | |
| Ergosine | 4/4/3/3 | 4 | 35 | 52 | 9 | 12 | 117 | 173 | 32 | 79/129/138 | 7 | 11 | 69 ± 27 | 89 ± 31 | 72 ± 20 | |
| Ergotamine | 4/4/3/3 | 2 | 59 | 56 | 10 | 8 | 195 | 188 | 35 | 81/134/155 | 10 | 9 | 64 ± 10 | 84 ± 26 | 77 ± 18 | |
| Ergocornine | 4/4/3/3 | 3 | 32 | 59 | 16 | 11 | 108 | 196 | 53 | 93/129/136 | 11 | 11 | 59 ± 16 | 90 ± 26 | 70 ± 14 | |
| α-Ergocryptine | 4/4/3/3 | 4 | 15 | 38 | 8 | 14 | 50 | 126 | 28 | 67/119/137 | 7 | 8 | 53 ± 7 | 82 ± 21 | 70 ± 14 | |
| Ergoscristine | 4/4/3/3 | 3 | 30 | 51 | 10 | 10 | 100 | 170 | 32 | 70/117/135 | 8 | 5 | 77 ± 22 | 88 ± 24 | 54 ± 26 | |
| without ISTD | ||||||||||||||||
| ENN A | 4/4/3/3 | 4 | 85 | 49 | 32 | 13 | 284 | 165 | 108 | 115/173/181 | 1 | 8 | 161 ± 14 | 117 ± 27 | 81 ± 17 | |
| ENN A1 | 4/4/3/3 | 1 | 45 | 40 | 33 | 5 | 150 | 133 | 111 | 102/122/148 | 3 | 11 | 147 ± 21 | 110 ± 29 | 80 ± 16 | |
| ENN B | 4/4/3/3 | 1 | 41 | 78 | 17 | 4 | 138 | 260 | 57 | 95/132/152 | 2 | 10 | 117 ± 16 | 107 ± 30 | 79 ± 17 | |
| ENN B1 | 4/4/3/3 | 1 | 29 | 40 | 29 | 5 | 96 | 133 | 96 | 102/125/147 | 3 | 12 | 134 ± 9 | 106 ± 35 | 79 ± 17 | |
| Daidzein | 4/4/3/3 | 13 | 30 | 50 | 48 | 42 | 100 | 168 | 159 | 86/120/101 | 4 | 13 | 123 ± 9 | 122 ± 18 | 93 ± 15 | |
| Daidzin | 4/4/3/3 | 3 | 19 | 45 | 15 | 12 | 62 | 152 | 51 | 86/113/140 | 4 | 16 | 93 ± 21 | 93 ± 6 | 71 ± 13 | |
| Genistein | 4/4/3/3 | 11 | 20 | 42 | 52 | 37 | 66 | 141 | 172 | 81/120/104 | 2 | 13 | 114 ± 23 | 127 ± 28 | 91 ± 18 | |
| Genistin | 4/4/3/3 | 1 | 29 | 72 | 11 | 5 | 95 | 241 | 35 | 101/143/149 | 4 | 12 | 101 ± 45 | 88 ± 1 | 69 ± 14 | |
| Glycitein | 4/4/3/3 | 11 | 18 | 21 | 37 | 36 | 58 | 68 | 124 | 80/58/89 | 2 | 16 | 127 ± 3 | 118 ± 24 | 96 ± 16 | |
| Glycitin | 4/4/3/3 | 4 | 27 | 51 | 26 | 13 | 90 | 170 | 88 | 94/123/121 | 4 | 23 | 96 ± 14 | 113 ± 13 | 97 ± 22 | |
© 2019 by the authors. Licensee MDPI, Basel, Switzerland. This article is an open access article distributed under the terms and conditions of the Creative Commons Attribution (CC BY) license (http://creativecommons.org/licenses/by/4.0/).
Share and Cite
Johny, A.; Fæste, C.K.; Bogevik, A.S.; Berge, G.M.; Fernandes, J.M.O.; Ivanova, L. Development and Validation of a Liquid Chromatography High-Resolution Mass Spectrometry Method for the Simultaneous Determination of Mycotoxins and Phytoestrogens in Plant-Based Fish Feed and Exposed Fish. Toxins 2019, 11, 222. https://0-doi-org.brum.beds.ac.uk/10.3390/toxins11040222
Johny A, Fæste CK, Bogevik AS, Berge GM, Fernandes JMO, Ivanova L. Development and Validation of a Liquid Chromatography High-Resolution Mass Spectrometry Method for the Simultaneous Determination of Mycotoxins and Phytoestrogens in Plant-Based Fish Feed and Exposed Fish. Toxins. 2019; 11(4):222. https://0-doi-org.brum.beds.ac.uk/10.3390/toxins11040222
Chicago/Turabian StyleJohny, Amritha, Christiane Kruse Fæste, André S. Bogevik, Gerd Marit Berge, Jorge M.O. Fernandes, and Lada Ivanova. 2019. "Development and Validation of a Liquid Chromatography High-Resolution Mass Spectrometry Method for the Simultaneous Determination of Mycotoxins and Phytoestrogens in Plant-Based Fish Feed and Exposed Fish" Toxins 11, no. 4: 222. https://0-doi-org.brum.beds.ac.uk/10.3390/toxins11040222