Figure 1.
The nitrogen content (N%) in leaf sheath of transgenic Bt rice (cv. HH1; A, C) and its parental isoline of non-Bt rice (cv. MH63; B, D) during the tillering (A, B) and heading (C, D) stages, grown with low- and high-N fertilizer under various CO2 and temperature (T) combination in open-top chambers. (Note: HH1—Bt rice expressing cry1Ab/Ac genes; MH63—the parental isoline of HH1; CK—ambient CO2 and low-T; eTemp—ambient CO2 and high-T; eCO2—elevated CO2 and low-T; Combined—elevated CO2 and high-T; *, the lowercase (a, b) and uppercase letters (A, B) indicated significant difference in N% of Bt rice or non-Bt rice under eTemp, eCO2 or Combined treatment compared with CK at same fertilizer-N level, and between low-N and high-N for Bt rice or non-Bt rice grown under same levels of CO2 and T, and between Bt rice and non-Bt rice grown under same levels of CO2, T and N fertilizer by the Turkey-test at p < 0.05, respectively.
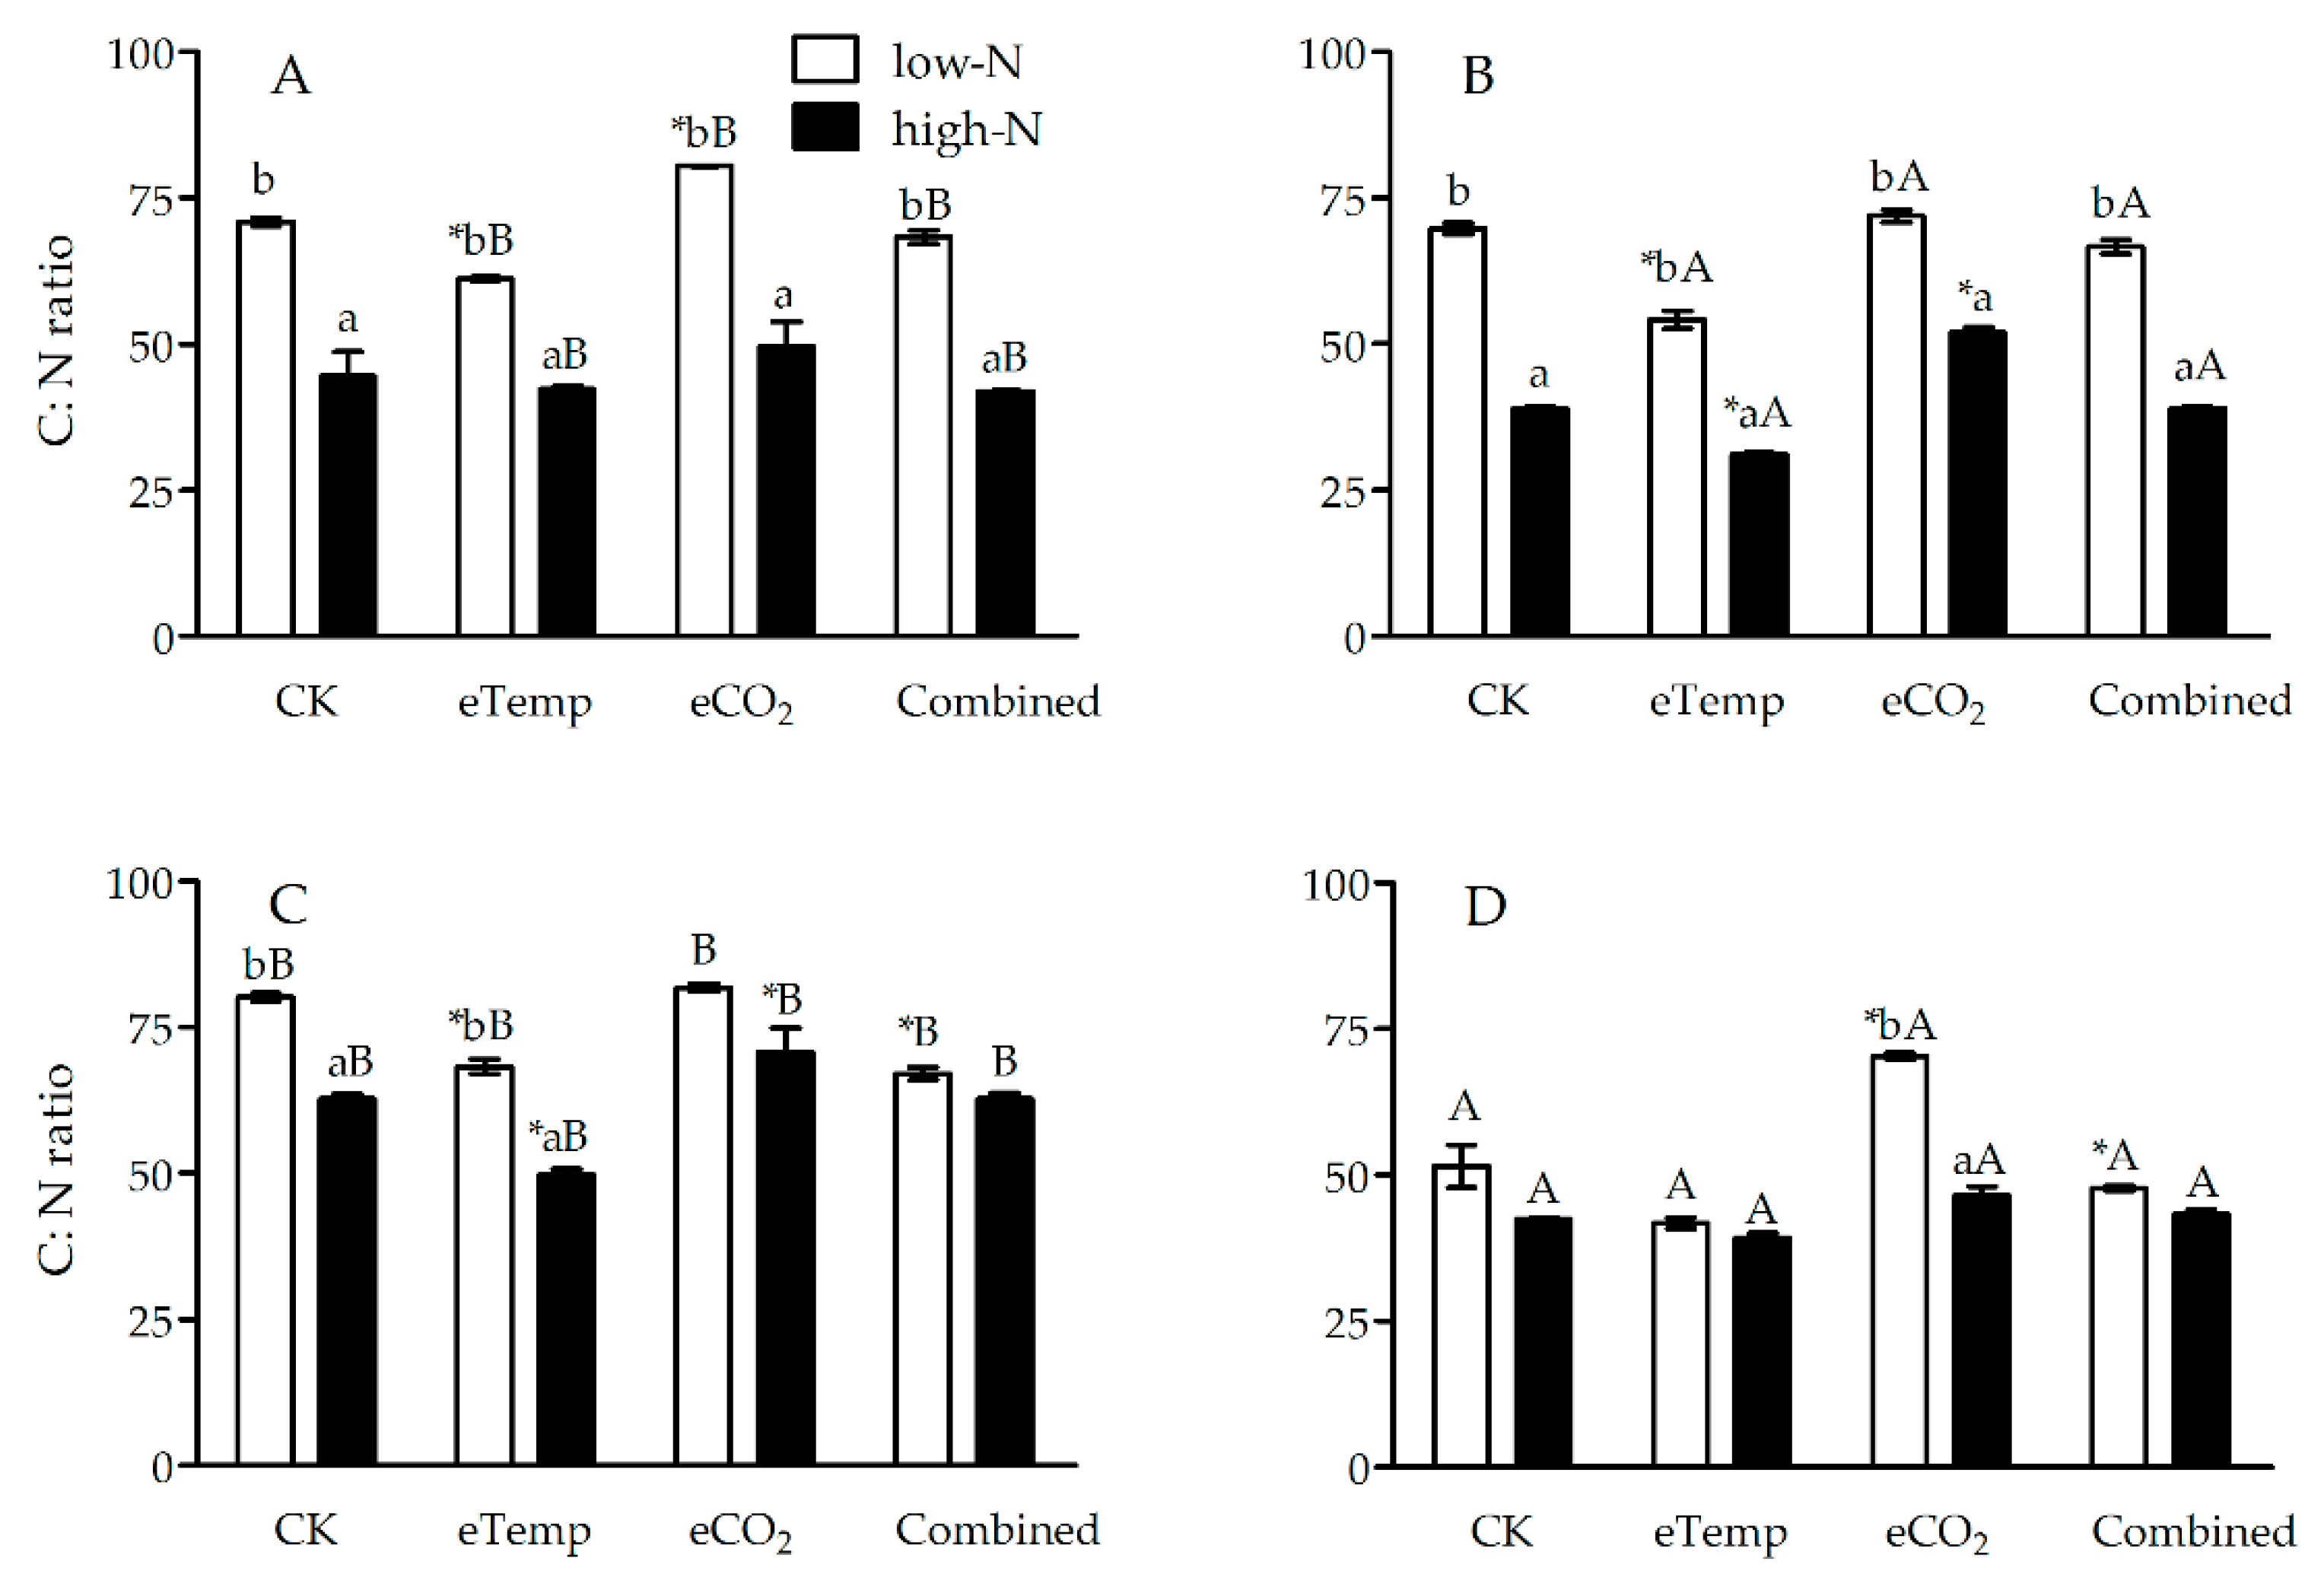
Figure 2.
The C:N ratio in leaf sheath of transgenic Bt rice (cv. HH1; A, C) and its parental isoline of non-Bt rice (cv. MH63; B, D) during the tillering (A, B) and heading (C, D) stages, grown with low- and high-N fertilizer under two levels of CO2 and temperature (T) in open-top chambers. (Note: *, the lowercase (a, b) and uppercase letters (A, B) indicated significant difference in N% of Bt rice or non-Bt rice under eTemp, eCO2 or Combined treatment compared with CK at same fertilizer-N level, and between low-N and high-N for Bt rice or non-Bt rice grown under same levels of CO2 and T, and between Bt rice and non-Bt rice grown under same levels of CO2, T and N fertilizer by the Turkey-test at p < 0.05, respectively).
Figure 3.
The nitrogen content (N%) in leaf of transgenic Bt rice (cv. HH1; A, C) and its parental isoline of non-Bt rice (cv. MH63; B, D) during the tillering (A, B) and heading (C, D) stages, grown with low- and high-N fertilizer under various CO2 and temperature (T) combination in open-top chambers. (Note: *, the lowercase (a, b) and uppercase letters (A, B) indicated significant difference in N% of Bt rice or non-Bt rice under eTemp, eCO2 or Combined treatment compared with CK at same fertilizer-N level, and between low-N and high-N for Bt rice or non-Bt rice grown under same levels of CO2 and T, and between Bt rice and non-Bt rice grown under same levels of CO2, T and N fertilizer by the Turkey-test at p < 0.05, respectively).
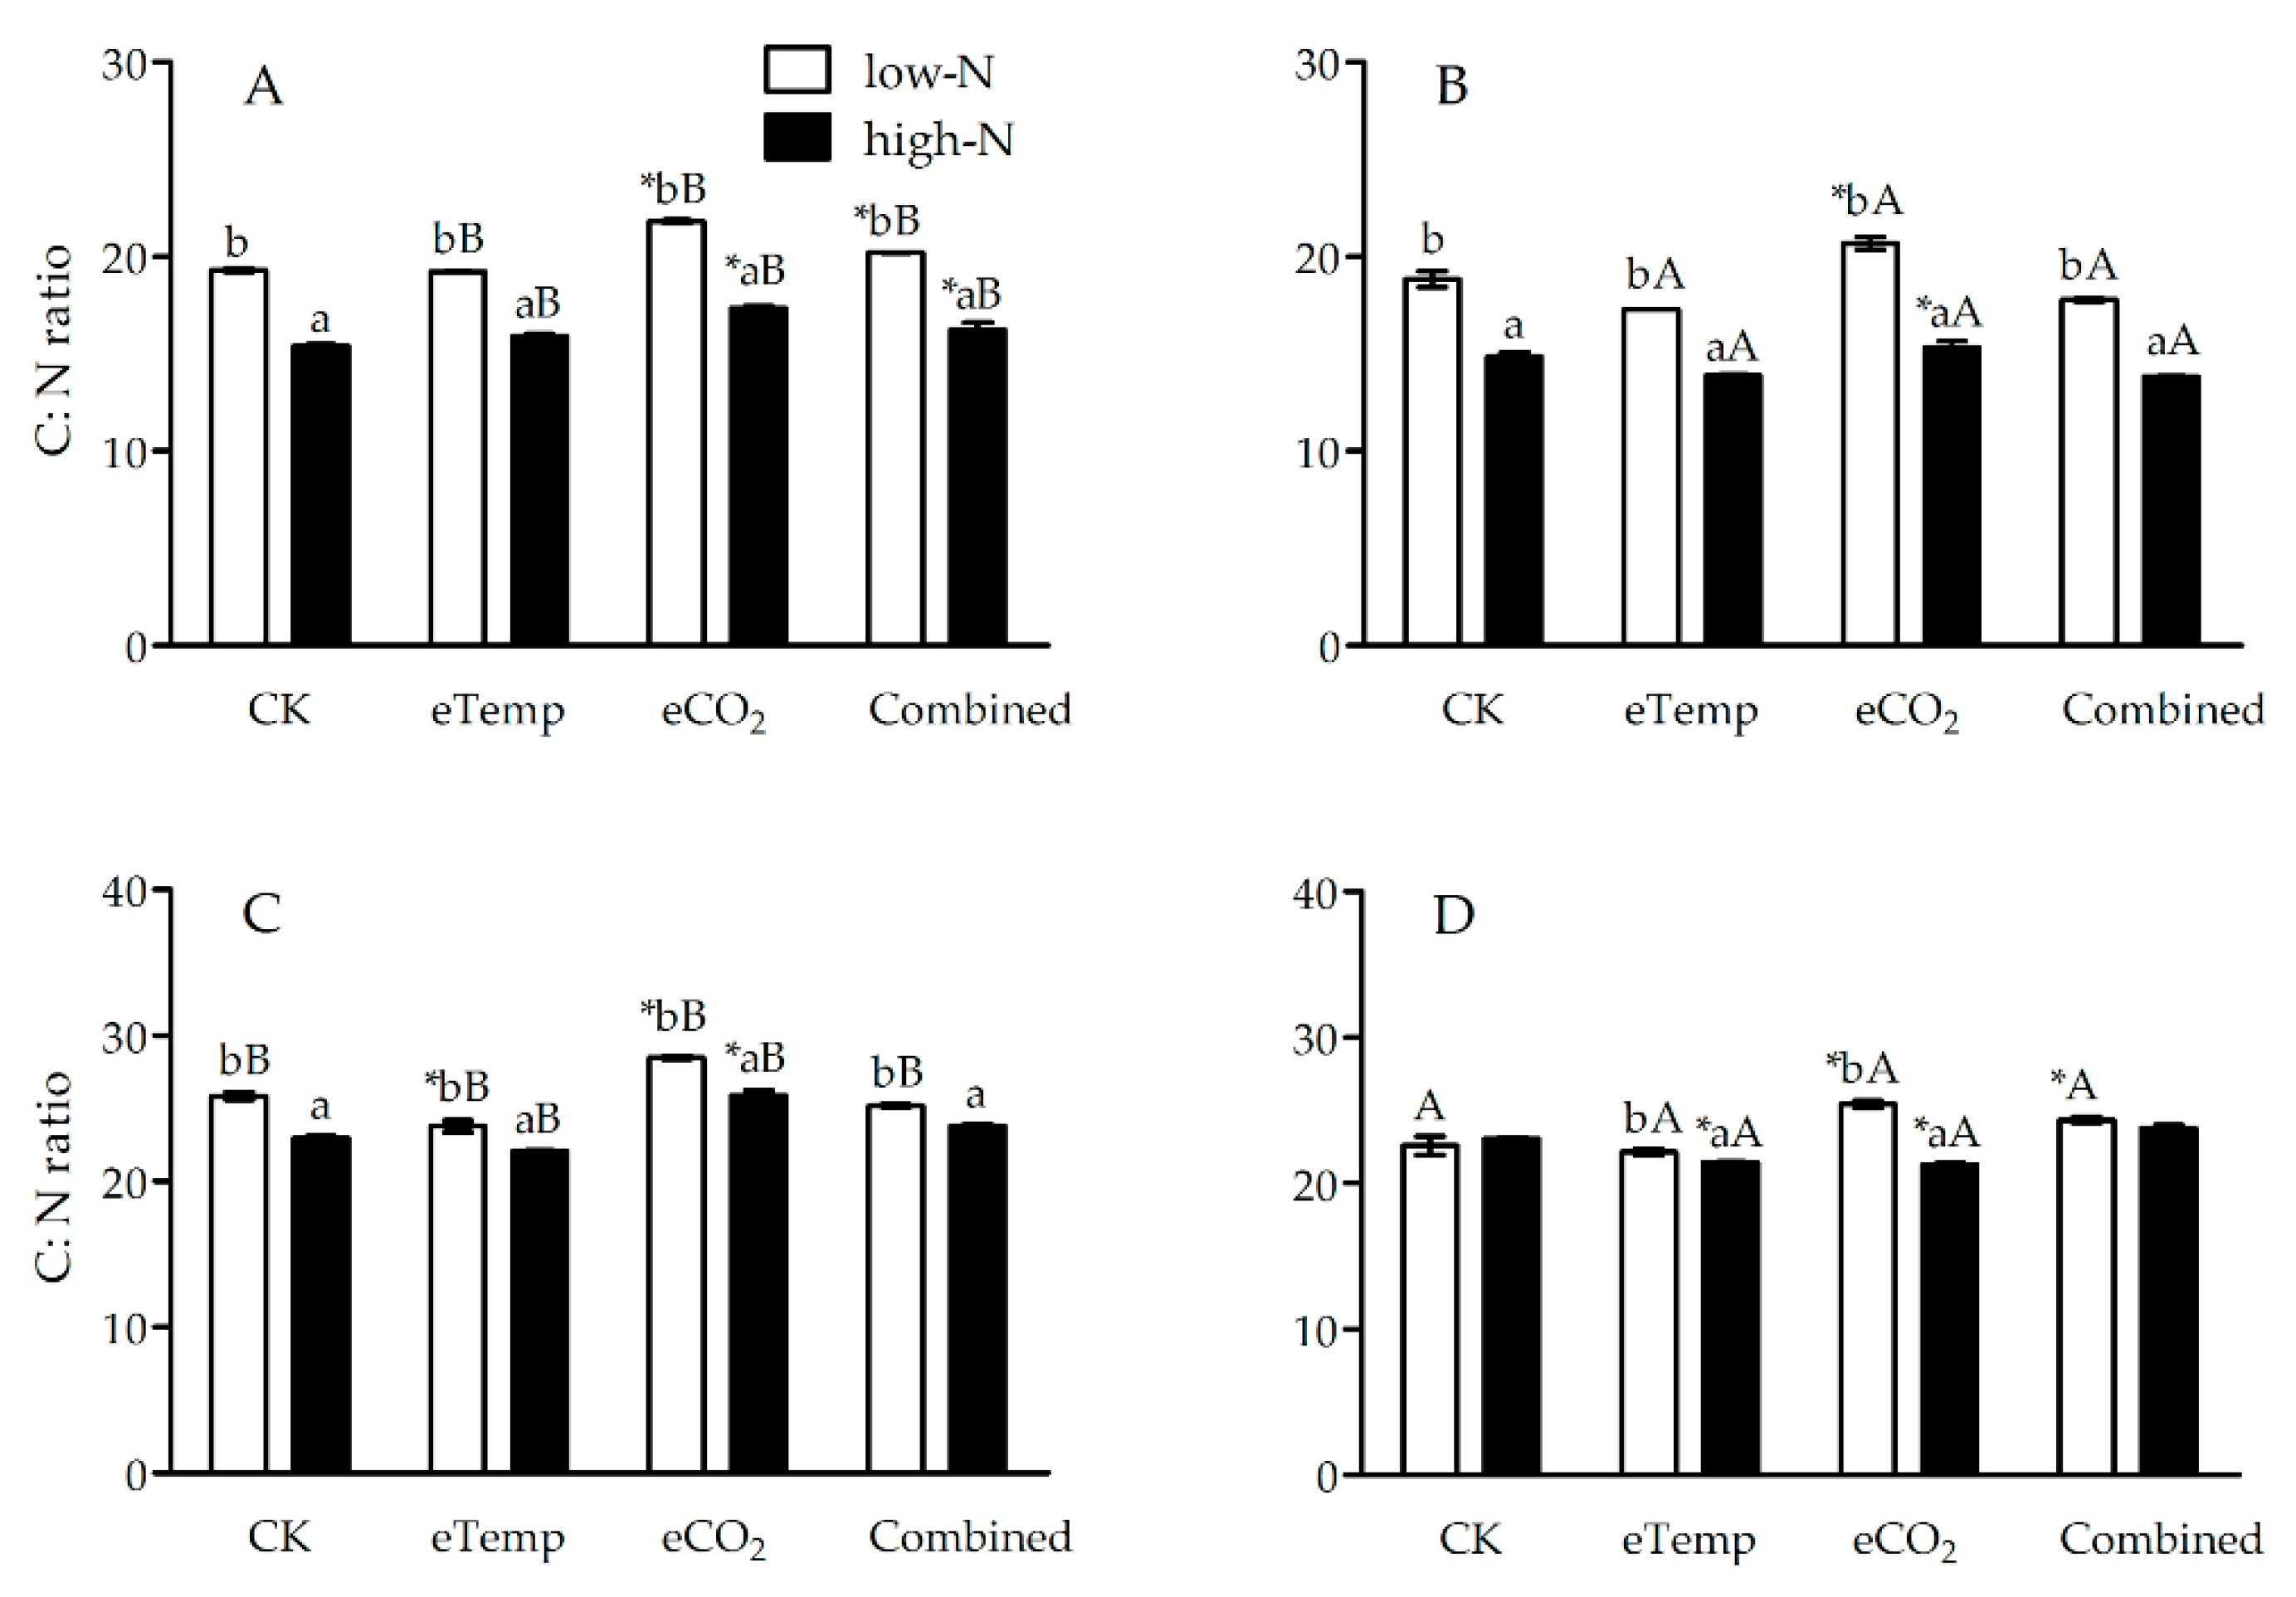
Figure 4.
The C:N ratio in leaf of transgenic Bt rice (cv. HH1; A, C) and its parental isoline of non-Bt rice (cv. MH63; B, D) during the tillering (A, B) and heading (C, D) stages, grown with low- and high-N fertilizer under various CO2 and temperature (T) combination in open-top chambers. (Note: *, the lowercase (a, b) and uppercase letters (A, B) indicated significant difference in N% of Bt rice or non-Bt rice under eTemp, eCO2 or Combined treatment compared with CK at same fertilizer-N level, and between low-N and high-N for Bt rice or non-Bt rice grown under same levels of CO2 and T, and between Bt rice and non-Bt rice grown under same levels of CO2, T and N fertilizer by the Turkey-test at p < 0.05, respectively).
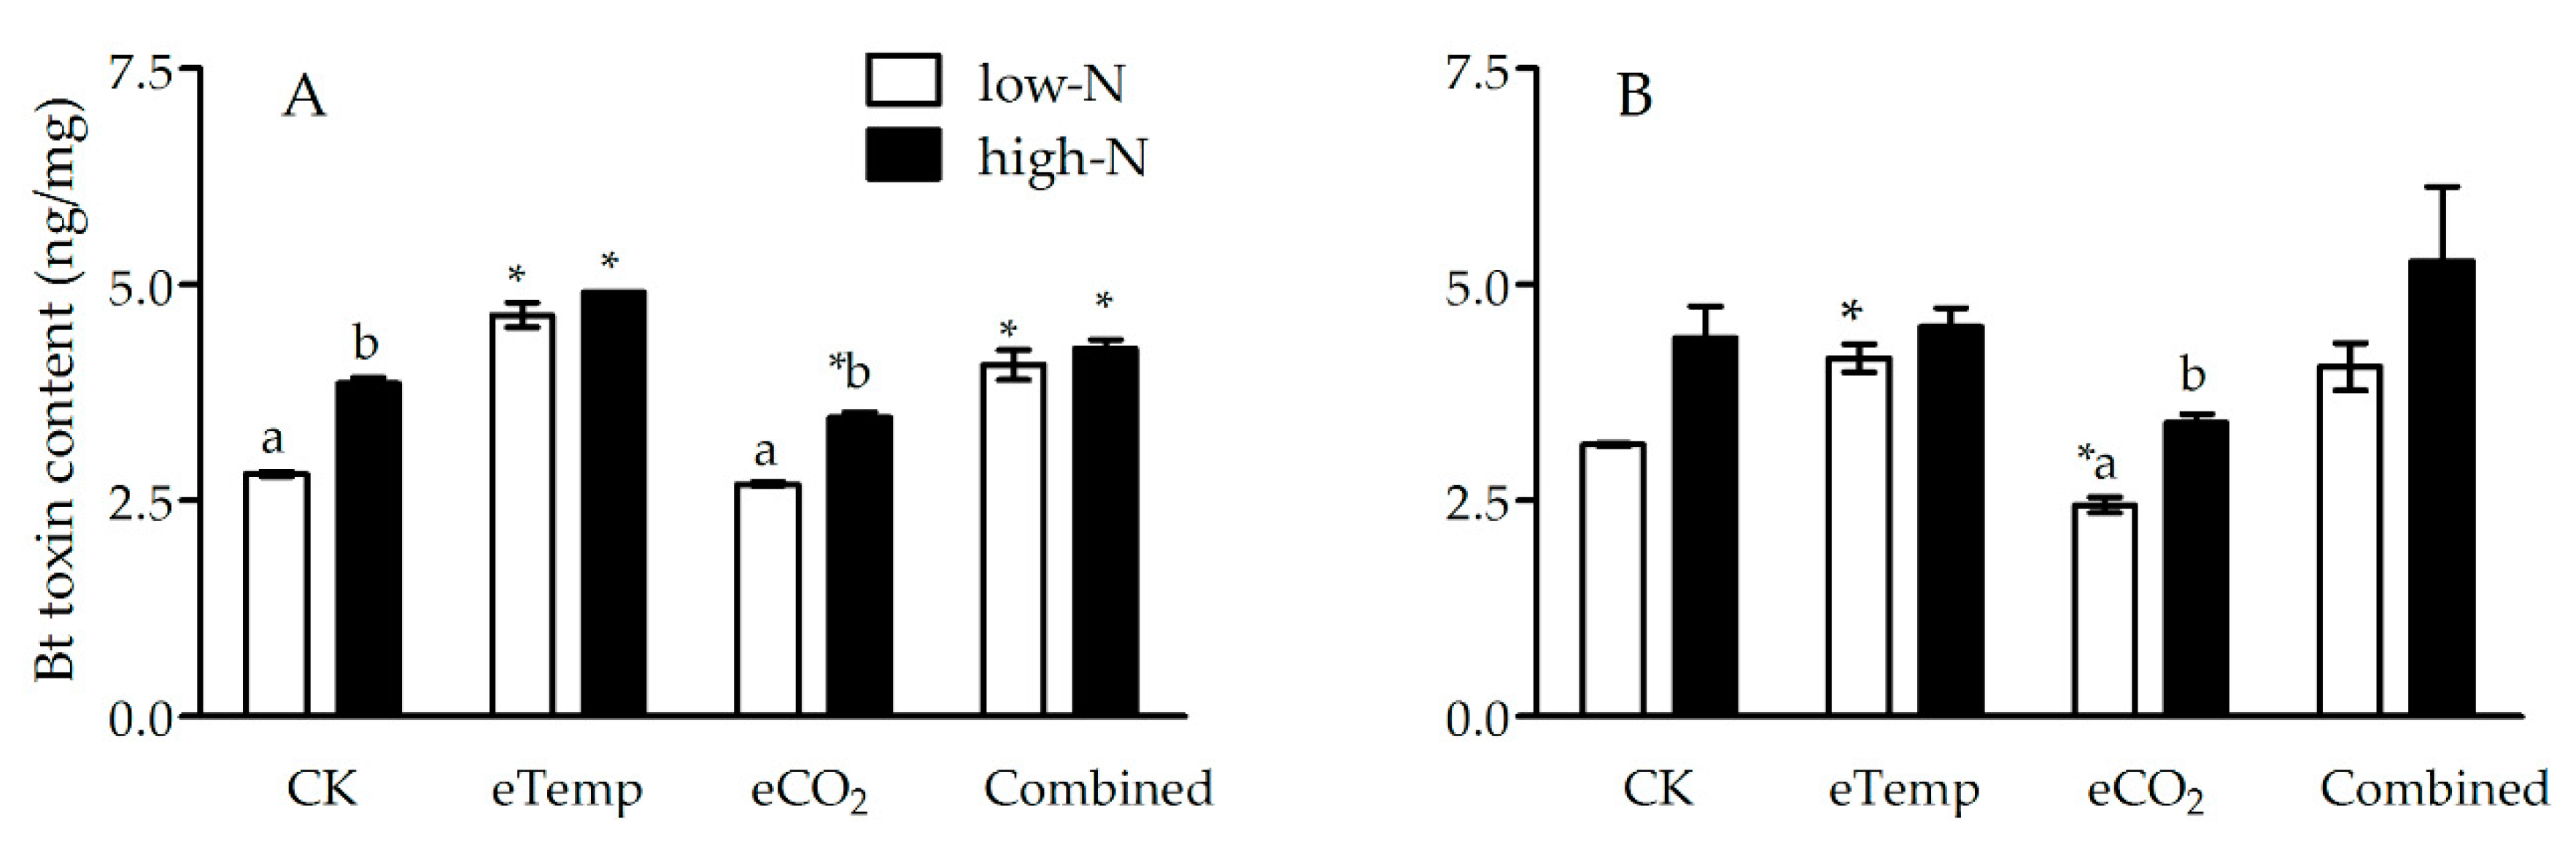
Figure 5.
The Bt toxin content (ng/mg) in leaf sheath of transgenic Bt rice (cv. HH1) during the tillering (A) and heading (B) stages, grown with low- and high-N fertilizer under various CO2 and temperature (T) combination in open-top chambers. (Note: *, the lowercase (a, b) and uppercase letters (A, B) indicated significant difference in N% of Bt rice or non-Bt rice under eTemp, eCO2 or Combined treatment compared with CK at same fertilizer-N level, and between low-N and high-N for Bt rice or non-Bt rice grown under same levels of CO2 and T, and between Bt rice and non-Bt rice grown under same levels of CO2, T and N fertilizer by the Turkey-test at p < 0.05, respectively).
Figure 6.
The Bt toxin content (ng/mg) in leaf of transgenic Bt rice (cv. HH1) during the tillering (A) and heading (B) stages, grown with low- and high-N fertilizer under various CO2 and temperature (T) combination in open-top chambers. (Note: *, the lowercase (a, b) and uppercase letters (A, B) indicated significant difference in N% of Bt rice or non-Bt rice under eTemp, eCO2 or Combined treatment compared with CK at same fertilizer-N level, and between low-N and high-N for Bt rice or non-Bt rice grown under same levels of CO2 and T, and between Bt rice and non-Bt rice grown under same levels of CO2, T and N fertilizer by the Turkey-test at p < 0.05, respectively).
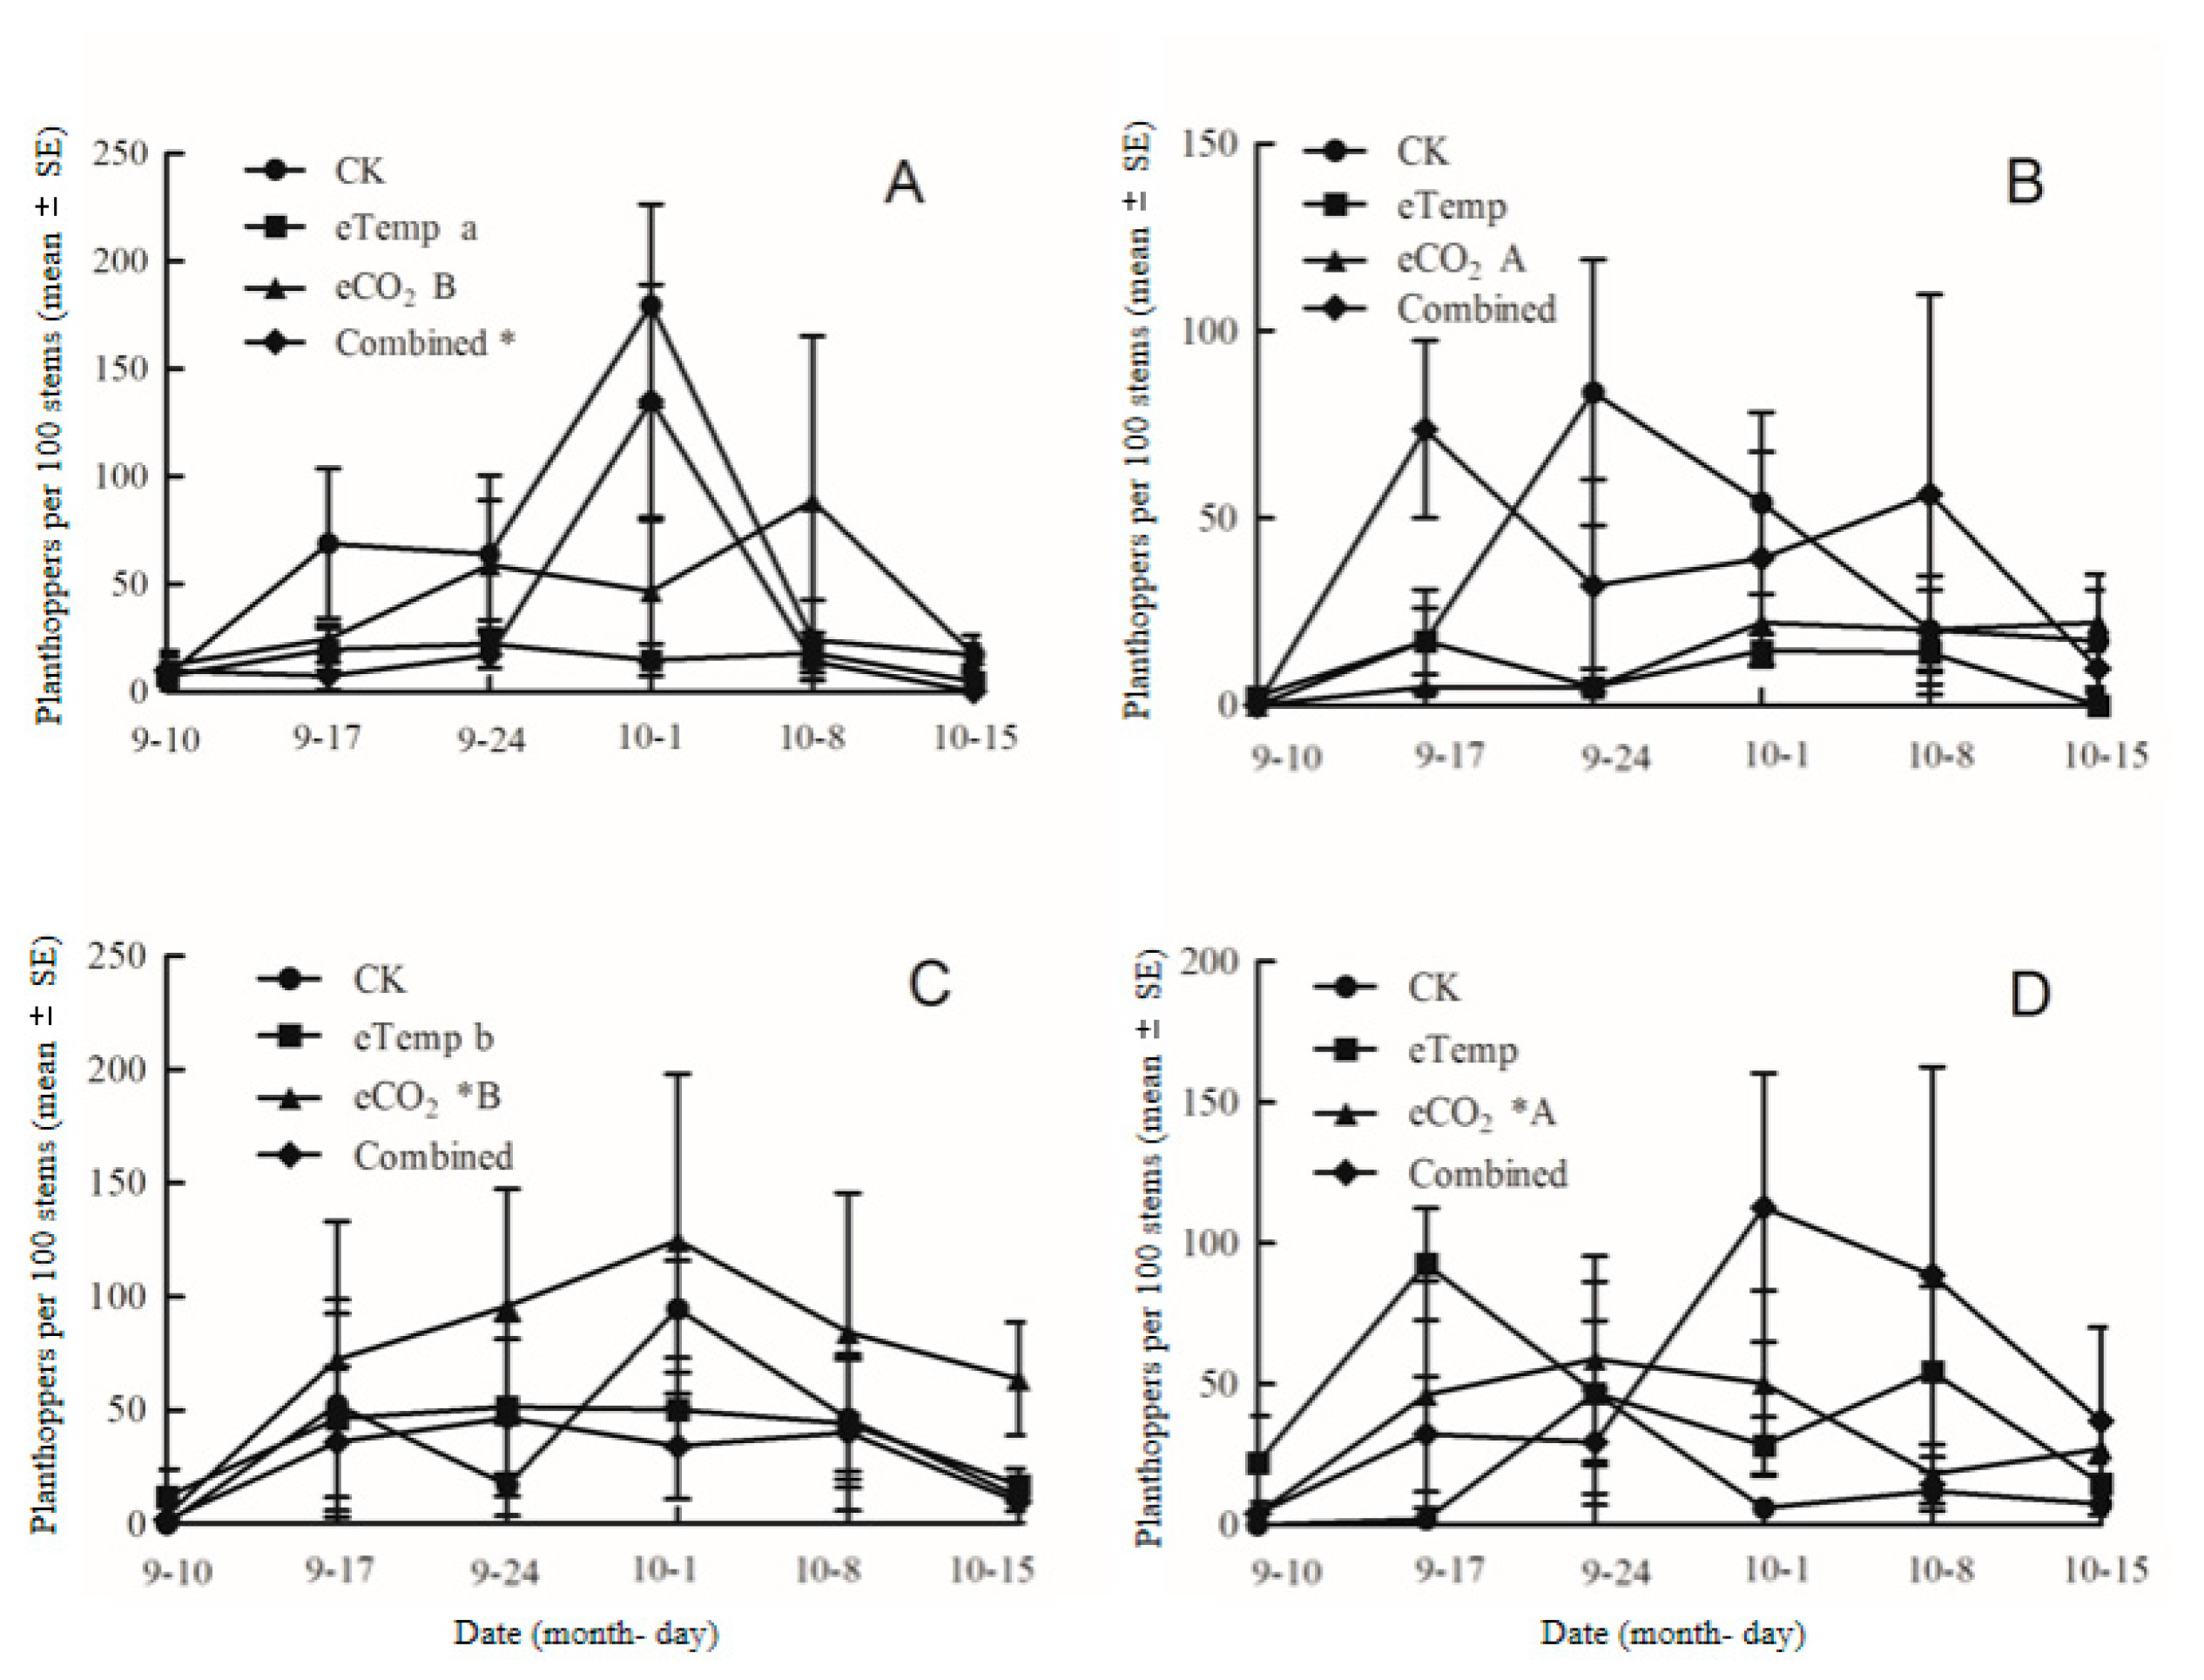
Figure 7.
Population dynamics of brown planthopper, Nilaparvata lugens fed on transgenic Bt rice (cv. HH1) (B,D) and its parental isoline of non-Bt rice (cv. MH63) (A,C) grown under various CO2 and temperature (T) combinations with low-N (A,B) and high-N (C,D) fertilizer in open-top chambers from 10 Sept to 15 October 2016. (Note: *, the lowercase (a, b) and uppercase letters (A, B) indicated significant difference in N% of Bt rice or non-Bt rice under eTemp, eCO2 or Combined treatment compared with CK at same fertilizer-N level, and between low-N and high-N for Bt rice or non-Bt rice grown under same levels of CO2 and T, and between Bt rice and non-Bt rice grown under same levels of CO2, T and N fertilizer by the Turkey-test at p < 0.05, respectively).
Table 1.
df, F-values and p-values derived from the three-way ANOVAs on nitrogen content (N%) in leaf sheath of transgenic Bt rice (cv. HH1) and its parental isoline of non-Bt rice (cv. MH63) during the tillering and heading stages grown under variousCO2 and temperature (T) in combinations with low- and high-N fertilizer in open-top chambers (n = 3).
| Factors | eCO2 | eTemp | Combined |
|---|
| Tillering | Heading | Tillering | Heading | Tillering | Heading |
|---|
| Bt | 1, 1.75, 0.205 | 1, 196.40, <0.001 *** | 1, 43.09, <0.001 *** | 1, 292.83, <0.001 *** | 1, 7.00, 0.018 * | 1, 383.71, <0.001 *** |
| N | 1, 156.22, 0.001 *** | 1, 85.56, <0.001 *** | 1, 401.14, <0.001 *** | 1, 72.15, <0.001 *** | 1, 389.96, <0.001 *** | 1, 43.39, <0.001 *** |
| eTemp | - | - | 1, 46.43, <0.001 *** | 1, 71.98, <0.001 *** | - | - |
| eCO2 | 1, 13.84, 0.002 ** | 1, 23.02, <0.001 *** | - | - | - | - |
| Combined | - | - | - | - | 1, 1.47, 0.242 | 1, 8.39, 0.011 * |
| Bt × N | 1, 1.59, 0.695 | 1, 13.82, 0.002** | 1, 19.98, 0.001 *** | 1, 4.64, 0.047* | 1, 4.43, 0.051 | 1, 2.78, 0.115 |
| Bt × eTemp | - | - | 1, 13.71, 0.002 ** | 1, 0.91, 0.353 | - | - |
| N × eTemp | - | - | 1, 0.47, 0.503 | 1, 0.75, 0.399 | - | - |
| Bt × eCO2 | 1, 0.75, 0.399 | 1, 10.65, 0.005 ** | - | - | - | - |
| N × eCO2 | 1, 5.25, 0.036 * | 1, 3.83, 0.068 | - | - | - | - |
| Bt × Combined | - | - | - | - | 1, 0.06, 0.803 | 1, 1.90, 0.187 |
| N × Combined | - | - | - | - | 1, 0.02, 0.884 | 1, 5.13, 0.038 * |
| Bt × N × eTemp | - | - | 1, 7.54, 0.014* | 1, 13.40, 0.002 ** | - | - |
| Bt × N × eCO2 | 1, 2.95, 0.105 | 1, 5.19, 0.037 * | - | - | - | - |
| Bt × N × Combined | - | - | - | - | 1, 0.13, 0.725 | 1, 0.01, 0.937 |
Table 2.
df, F-values and p-values derived from the three-way ANOVAs on C:N ratio in leaf sheath of transgenic Bt rice (cv. HH1) and its parental isoline of non-Bt rice (cv. MH63) during the tillering and heading stages grown under various CO2 and temperature (T) in combinations with low- and high-N fertilizer in open-top chambers (n = 3).
| Factors | eCO2 | eTemp | Combined |
|---|
| Tillering | Heading | Tillering | Heading | Tillering | Heading |
|---|
| Bt | 1, 2.67, 0.122 | 1, 146.60, <0.001 *** | 1, 13.56, 0.002 ** | 1, 155.67, <0.001 *** | 1, 3.17, 0.049 * | 1, 366.80, <0.001 *** |
| N | 1, 61.90, <0.001 *** | 1, 64.44, <0.001 *** | 1, 136.86, <0.001 *** | 1, 36.78, <0.001 *** | 1, 105.37, <0.001 *** | 1, 49.27, <0.001 *** |
| eTemp | - | - | 1, 13.99, 0.002 ** | 1, 20.21, <0.001 *** | - | - |
| eCO2 | 1, 8.76, 0.009 ** | 23.02/<0.001 *** | - | - | - | - |
| Combined | - | - | - | - | 1, 0.01, 0.907 | 1, 11.35, 0.004 ** |
| Bt × N | 1,0.01, 0.9200 | 13.82/0.002 ** | 1, 2.54, 0.130 | 1, 8.43, 0.012 * | 1, 1.29, 0.273 | 1, 1.44, 0.247 |
| Bt × eTemp | - | - | 1, 3.99, 0.063 | 1, 0.89, 0.359 | - | - |
| N × eTemp | - | - | 1, 5.89, 0.027 * | 1, 1.33, 0.267 | - | - |
| Bt × eCO2 | 1, 0.32, 0.582 | 10.65/0.005 ** | - | - | - | - |
| N × eCO2 | 1, 1.25, 0.280 | 3.83/0.068 | - | - | - | - |
| Bt × Combined | - | - | - | - | 1, 0.20, 0.660 | 1, 4.46, 0.051 |
| N × Combined | - | - | - | - | 1, 0.81, 0.380 | 1, 19.47, <0.001 *** |
| Bt × N × eTemp | - | - | 1, 0.24, 0.631 * | 1, 0.40, 0.536 | - | - |
| Bt × N × eCO2 | 1, 0.36, 0.556 | 1, 11.40, 0.004 ** | - | - | - | - |
| Bt × N × Combined | - | - | - | - | 1, 0.07, 0.796 | 1,5.75, 0.290 |
Table 3.
df, F-values and P-values derived from the three-way ANOVAs on nitrogen content (N%) in leaf of transgenic Bt rice (cv. HH1) and its parental isoline of non-Bt rice (cv. MH63) during the tillering and heading stages grown under various CO2 and temperature (T) in combinations with low- and high-N fertilizer in open-top chambers (n = 3).
| Factors | eCO2 | eTemp | Combined |
|---|
| Tillering | Heading | Tillering | Heading | Tillering | Heading |
|---|
| Bt | 1, 69.76, <0.001 *** | 1, 0.59, 0.455 | 1, 385.98, <0.001 *** | 1, 42.36, <0.001 *** | 1, 204.30, <0.001 *** | 1, 60.14, <0.001 *** |
| N | 1, 1734.54, <0.001 *** | 1, 337.02, <0.001 *** | 1, 3868.60, <0.001 *** | 1, 145.59, <0.001 *** | 1, 1568.68, <0.001 *** | 1, 345.92, 0.001 *** |
| eTemp | - | - | 1, 145.00, <0.001 *** | 1, 138.62, 0.001 *** | - | - |
| eCO2 | 1, 151.35, <0.001 *** | 1, 184.83, <0.001 *** | - | - | - | - |
| Combined | - | - | - | - | 1, 5.76, 0.029 * | 1, 32.19, <0.001 *** |
| Bt × N | 1, 25.80, <0.001 *** | 1, 39.63, <0.001 *** | 1, 26.63, <0.001 *** | 1, 0.05, 0.829 | 1, 20.01, <0.001 *** | 1, 8.34, 0.011 * |
| Bt × eTemp | - | - | 1, 217.78, <0.001 *** | 1, 46.25, <0.001 *** | - | - |
| N × eTemp | - | - | 1, 5.98, 0.026 * | 1, 24.01, <0.001 *** | - | - |
| Bt × eCO2 | 1, 28.14, <0.001 *** | 1, 0.28, 0.606 | - | - | - | - |
| N × eCO2 | 1.83/0.194 | 1, 20.03, <0.001 *** | - | - | - | - |
| Bt × Combined | - | - | - | - | 1, 128.76, <0.001 *** | 1, 65.46, <0.001 *** |
| N × Combined | - | - | - | - | 1, 0.43, 0.522 | 1, 0.76, 0.396 |
| Bt × N × eTemp | - | - | 1, 1.84, 0.193 | 1, 3.34, 0.086 | - | - |
| Bt × N × eCO2 | 1, 7.34, 0.015 * | 1, 63.53, <0.001 *** | - | - | - | - |
| Bt × N × Combined | - | - | - | - | 1, 4.76, 0.044 * | 1, 27.43, <0.001 *** |
Table 4.
df, F-values and P-values derived from the three-way ANOVAs on C:N ratio in leaf of transgenic Bt rice (cv. HH1) and its parental isoline of non-Bt rice (cv. MH63) during the tillering and heading stages grown under various CO2 and temperature (T) in combinations with low- and high-N fertilizer in open-top chambers (n = 3).
| Factors | eCO2 | eTemp | Combined |
|---|
| Tillering | Heading | Tillering | Heading | Tillering | Heading |
|---|
| Bt | 1, 9.85, 0.006 ** | 1, 80.90, <0.001 *** | 1, 19.78, <0.001 *** | 1, 48.78, <0.001 *** | 1, 20.03, <0.001 *** | .1, 23.60, <0001 *** |
| N | 1, 97.64, <0.001 *** | 1, 44.25, <0.001 *** | 1, 111.64 <0.001 *** | 1, 32.86 <0.001 *** | 1, 93.19, <0.001 *** | 1, 20.47, <0.001 *** |
| eTemp | - | - | 1, 0.89, 0.359 | 1, 26.25, <0.001*** | - | - |
| eCO2 | 1, 22.13, <0.001 *** | 1, 32.14, <0.001 *** | - | - | - | - |
| Combined | - | - | - | - | 1, 0.20, 0.661 | 1, 11.06, 0.004 ** |
| Bt × N | 1, 1.36, 0.261 | 1, 0.81, 0.381 | 1, 0.61, 0.448 | 1, 25.92, <0.001 *** | 1, 0.49, 0.494 | 1, 18.84, 0.008 ** |
| Bt × eTemp | - | - | 1, 8.47, 0.011 * | 1, 0.14, 0.712 | - | - |
| N × eTemp | - | - | 1, 2.35, 0.145 | 1, 0.05, 0.832 | - | - |
| Bt × eCO2 | 1, 3.80, 0.069 | 1, 15.77, 0.009 ** | - | - | - | - |
| N × eCO2 | 1, 0.28, 0.605 | 1, 8.34, 0.011 * | - | - | - | - |
| Bt × Combined | - | - | - | - | 1, 10.03, 0.006 ** | 1, 4.82, 0.043 * |
| N × Combined | - | - | - | - | 1, 0.41, 0.530 | 1, 0.58, 0.456 |
| Bt × N × eTemp | - | - | 1, 0.40, 0.535 | 1, 6.56, 0.021 * | - | - |
| Bt × N × eCO2 | 1, 1.11, 0.308 | 1, 18.68, 0.008 ** | - | - | - | - |
| Bt × N × Combined | - | - | - | - | 1, 0.33, 0.571 | 1, 8.97, 0.009 ** |
Table 5.
df, F-values and p-values derived from the two-way ANOVAs on Bt-toxin content in leaf sheath of transgenic Bt rice (cv. HH1) during the tillering and heading stages grown under various CO2 and temperature (T) combinations with low- and high-N fertilizer in open-top chambers (n = 3).
Table 5.
df, F-values and p-values derived from the two-way ANOVAs on Bt-toxin content in leaf sheath of transgenic Bt rice (cv. HH1) during the tillering and heading stages grown under various CO2 and temperature (T) combinations with low- and high-N fertilizer in open-top chambers (n = 3).
| Factors | eCO2 | eTemp | Combined |
|---|
| Tillering | Heading | Tillering | Heading | Tillering | Heading |
|---|
| N | 1, 19.85, 0.002 ** | 1, 33.44, <0.001 *** | 1, 37.57, <0.001 *** | 1, 5.18, 0.052 | 1, 10.88, 0.011 * | 1, 2.78, 0.134 |
| eTemp | - | - | 1, 43.20, <0.001 *** | 1, 0.45, 0.523 | - | - |
| eCO2 | 1, 0.23, 0.644 | 1, 153.34, <0.001 *** | - | - | - | - |
| Combined | - | - | - | - | 1, 11.74, 0.009 ** | 1, 0.02, 0.886 |
| N × eTemp | - | - | 1, 7.80, 0.023 * | 1, 0.01, 0.934 | - | - |
| N × eCO2 | 1, 0.01, 0.989 | 1, 6.20, 0.038 * | - | - | - | - |
| N × Combined | - | - | - | - | 1, 1.60, 0.242 | 1, 0.30, 0.598 |
Table 6.
df, F-values and p values derived from the two-way ANOVAs on Bt-toxin content in leaf of transgenic Bt rice (cv. HH1) during the tillering and heading stages grown under various CO2 and temperature (T) combinations with low- and high-N fertilizer in open-top chambers (n = 3).
Table 6.
df, F-values and p values derived from the two-way ANOVAs on Bt-toxin content in leaf of transgenic Bt rice (cv. HH1) during the tillering and heading stages grown under various CO2 and temperature (T) combinations with low- and high-N fertilizer in open-top chambers (n = 3).
| Factors | eCO2 | eTemp | Combined |
|---|
| Tillering | Heading | Tillering | Heading | Tillering | Heading |
|---|
| N | 1, 398.92, <0.001 *** | 1, 31.49, 0.002 ** | 1, 68.34, <0.001 *** | 1, 12.56, 0.008 ** | 1, 31.55, <0.009 ** | 1, 6.35, 0.036 * |
| eTemp | - | - | 1, 334.08, <0.001 *** | 1, 6.20, 0.037 * | - | - |
| eCO2 | 1, 31.69, <0.001 *** | 1, 18.48, 0.003 ** | - | - | - | - |
| Combined | - | - | - | - | 1, 57.48, <0.001 *** | 1, 3.36, 0.104 |
| N × eTemp | - | - | 1, 24.86, 0.002** | 1, 3.67, 0.092 | - | - |
| N × eCO2 | 1, 8.99, 0.017 * | 1, 0.53, 0.486 | - | - | - | - |
| N × Combined | - | - | - | - | 1, 15.51, 0.004 ** | 1, 281.90, 0.985 |
Table 7.
df, F-values and p values derived from the three-way ANOVAs on population dynamics of Nilaparvata lugens fed on transgenic Bt rice (cv. HH1) and its parental isoline of non-Bt rice (cv. MH63) grown under various CO2 and temperature (T) combinations with low- and high-N fertilizer in open-top chambers from Sept 10 to Oct 15 in 2016 (n = 3).
| Factors | eCO2 | eTemp | Combined |
|---|
| Bt | 1, 9.36, 0.004** | 1, 2.13, 0.152 | 1, 0.34, 0.577 |
| N | 1, 0.09, 0.772 | 1, 0.15, 0.705 | 1, 0.44, 0.510 |
| eTemp | - | 1, 1.13, 0.292 | - |
| eCO2 | 1, 0.26, 0.613 | - | |
| Combined | - | - | 1, 0.01, 0.951 |
| Bt × N | 1, 0.04, 0.851 | 1, 0.18, 0.68 | 1, 0.23, 0.642 |
| Bt × eTemp | - | 1, 2.22, 0.14 | - |
| N × eTemp | - | 1, 7.67, 0.008** | - |
| Bt × eCO2 | 1, 0.17, 0.695 | - | - |
| N × eCO2 | 1, 5.96, 0.019* | - | - |
| Bt × Combined | - | - | 1, 3.21, 0.081 |
| N × Combined | - | - | 1, 1. 56, 0.227 |
| Bt × N × eTemp | - | 1, 0.05, 0.826 | - |
| Bt × N × eCO2 | 1, 0.13, 0.723 | - | - |
| Bt × N × Combined | - | - | 1, 0.11, 0.750 |


