1. Introduction
Most cyanobacterial species can produce a wide range of secondary metabolites with diversified biological activities. The unique cyanobacterium-specific secondary metabolites originating from variable biosynthetic pathways show great chemical diversity and are common across cyanobacterial taxa. Many of these compounds that are of interest in several scientific fields (pharmacology, toxicology, ecology, etc.) have been isolated from strains cultured under controlled conditions and field samples, and partly or fully characterized [
1,
2].
Oligopeptides are a major family of cyanobacterial secondary metabolites. They are a highly diverse category of low molecular weight peptides built from proteinogenic and non-proteinogenic amino acids. The most widely accepted classification by Welker and von Döhren [
3] is as follows: aeruginosins [
4], cyanopeptolins [
5], anabaenopeptins [
6], microginins [
7], microviridins [
8], cyclamides [
9], and the well-studied and notorious microcystins [
10]. These oligopeptides are mainly synthesized by non-ribosomal pathways, assembled by large multifunctional enzyme complexes, regularly non-ribosomal peptide synthases (NRPS), or hybrid NRPS/PKS (polyketide) synthases. These complexes are encoded in large gene clusters with a modular unit, and produce mainly small peptide chains as end-products [
11,
12].
Oligopeptides are appropriate biomarkers of cyanobacterial subpopulations. LC-MS-based untargeted peptide metabolomic studies can be useful for the separation and identification of unknown metabolites from complex natural matrices, and for metabolite typing at both individual and population levels [
13,
14].
Microcystis is one of the most widely studied cyanobacterial genera due to its ability to form toxic blooms in freshwater environments across almost all continents.
Microcystis blooms have increased in general during recent decades, and are expected to further expand in the near future. Furthermore, several cases of huge biomass production have occurred, which were linked to this genus in strategically important freshwater habitats [
10]. High genetic diversity and genotype numbers have been identified in the genus
Microcystis [
15,
16,
17,
18,
19,
20,
21,
22,
23]. It is important to note that the reported existence of a number of described morphospecies based on colony/cell morphology is not supported by molecular evidence, forming a clade of nearly identical 16S rDNA sequences [
24,
25]. Based on the low 16S rRNA sequence variability and DNA–DNA hybridization data, Otsuka et al. [
26] suggested merging all morphospecies into a single species following the Bacteriological Code rules.
Climate change and nutrient over-enrichment in waters has led to worldwide proliferation of various geno- and chemo-types of several cyanobacterial species [
27]. Although the invasion of microorganisms to new aquatic environments is difficult to observe, several cyanobacteria have shown characteristic microscopic morphological features, or have generated conspicuous negative impacts on the local ecosystem [
28,
29]. Invasions may also threaten global biodiversity by changing the structure and function of ecosystems and interrupting key biological interactions [
30]. Indeed, when invading new areas, cyanobacterial species (including
Microcystis spp.) are able to cause fatal environmental changes by defeating native species, disturbing food-web structures [
31], or reducing diversity [
28,
32,
33].
Bighead carp (
Hypophthalmichthys nobilis R.) and silver carp (
H. molitrix V.) are filter feeder cyprinid fish, native to the large freshwater habitats of Asia [
34,
35]. These species and their hybrids (collectively referred to as filter-feeding Asian or bigheaded carps) are detritivorous, planktivorous, and opportunistic feeders [
35,
36]. They have been introduced into lakes, rivers, and reservoirs throughout the world since the early 1950s. The usual purpose of introducing and stocking bigheaded carp outside their native range is to increase fishery yields and improve water quality, because it is assumed that that these fish species (especially silver carp) are effective biological control agents for algal blooms [
37,
38,
39,
40]. Several promising biomanipulation experiments have been conducted and found that population size and quantity of cyanobacteria were unchanged or even increased by stocking filter-feeding fish [
41]. In addition, filter-feeding fish might increase nutrient availability and could thus stimulate the proliferation of cyanobacteria [
42,
43]. Miura and Wang [
44] noted that several cyanobacteria survived after passing through the gut of filter-feeding species, and attained increased photosynthetic activity. Many studies conducted on bigheaded carps reported no negative effects on the viability of some cyanobacterial species after gut passage [
45]. Lewin et al. [
46] and Görgényi et al. [
47] proposed that
Microcystis cells were not harmed or damaged after transit through the gut due to their mucous protection. Moreover, direct use of phosphorus by this cyanobacterial species has been detected in fish guts during passage [
47].
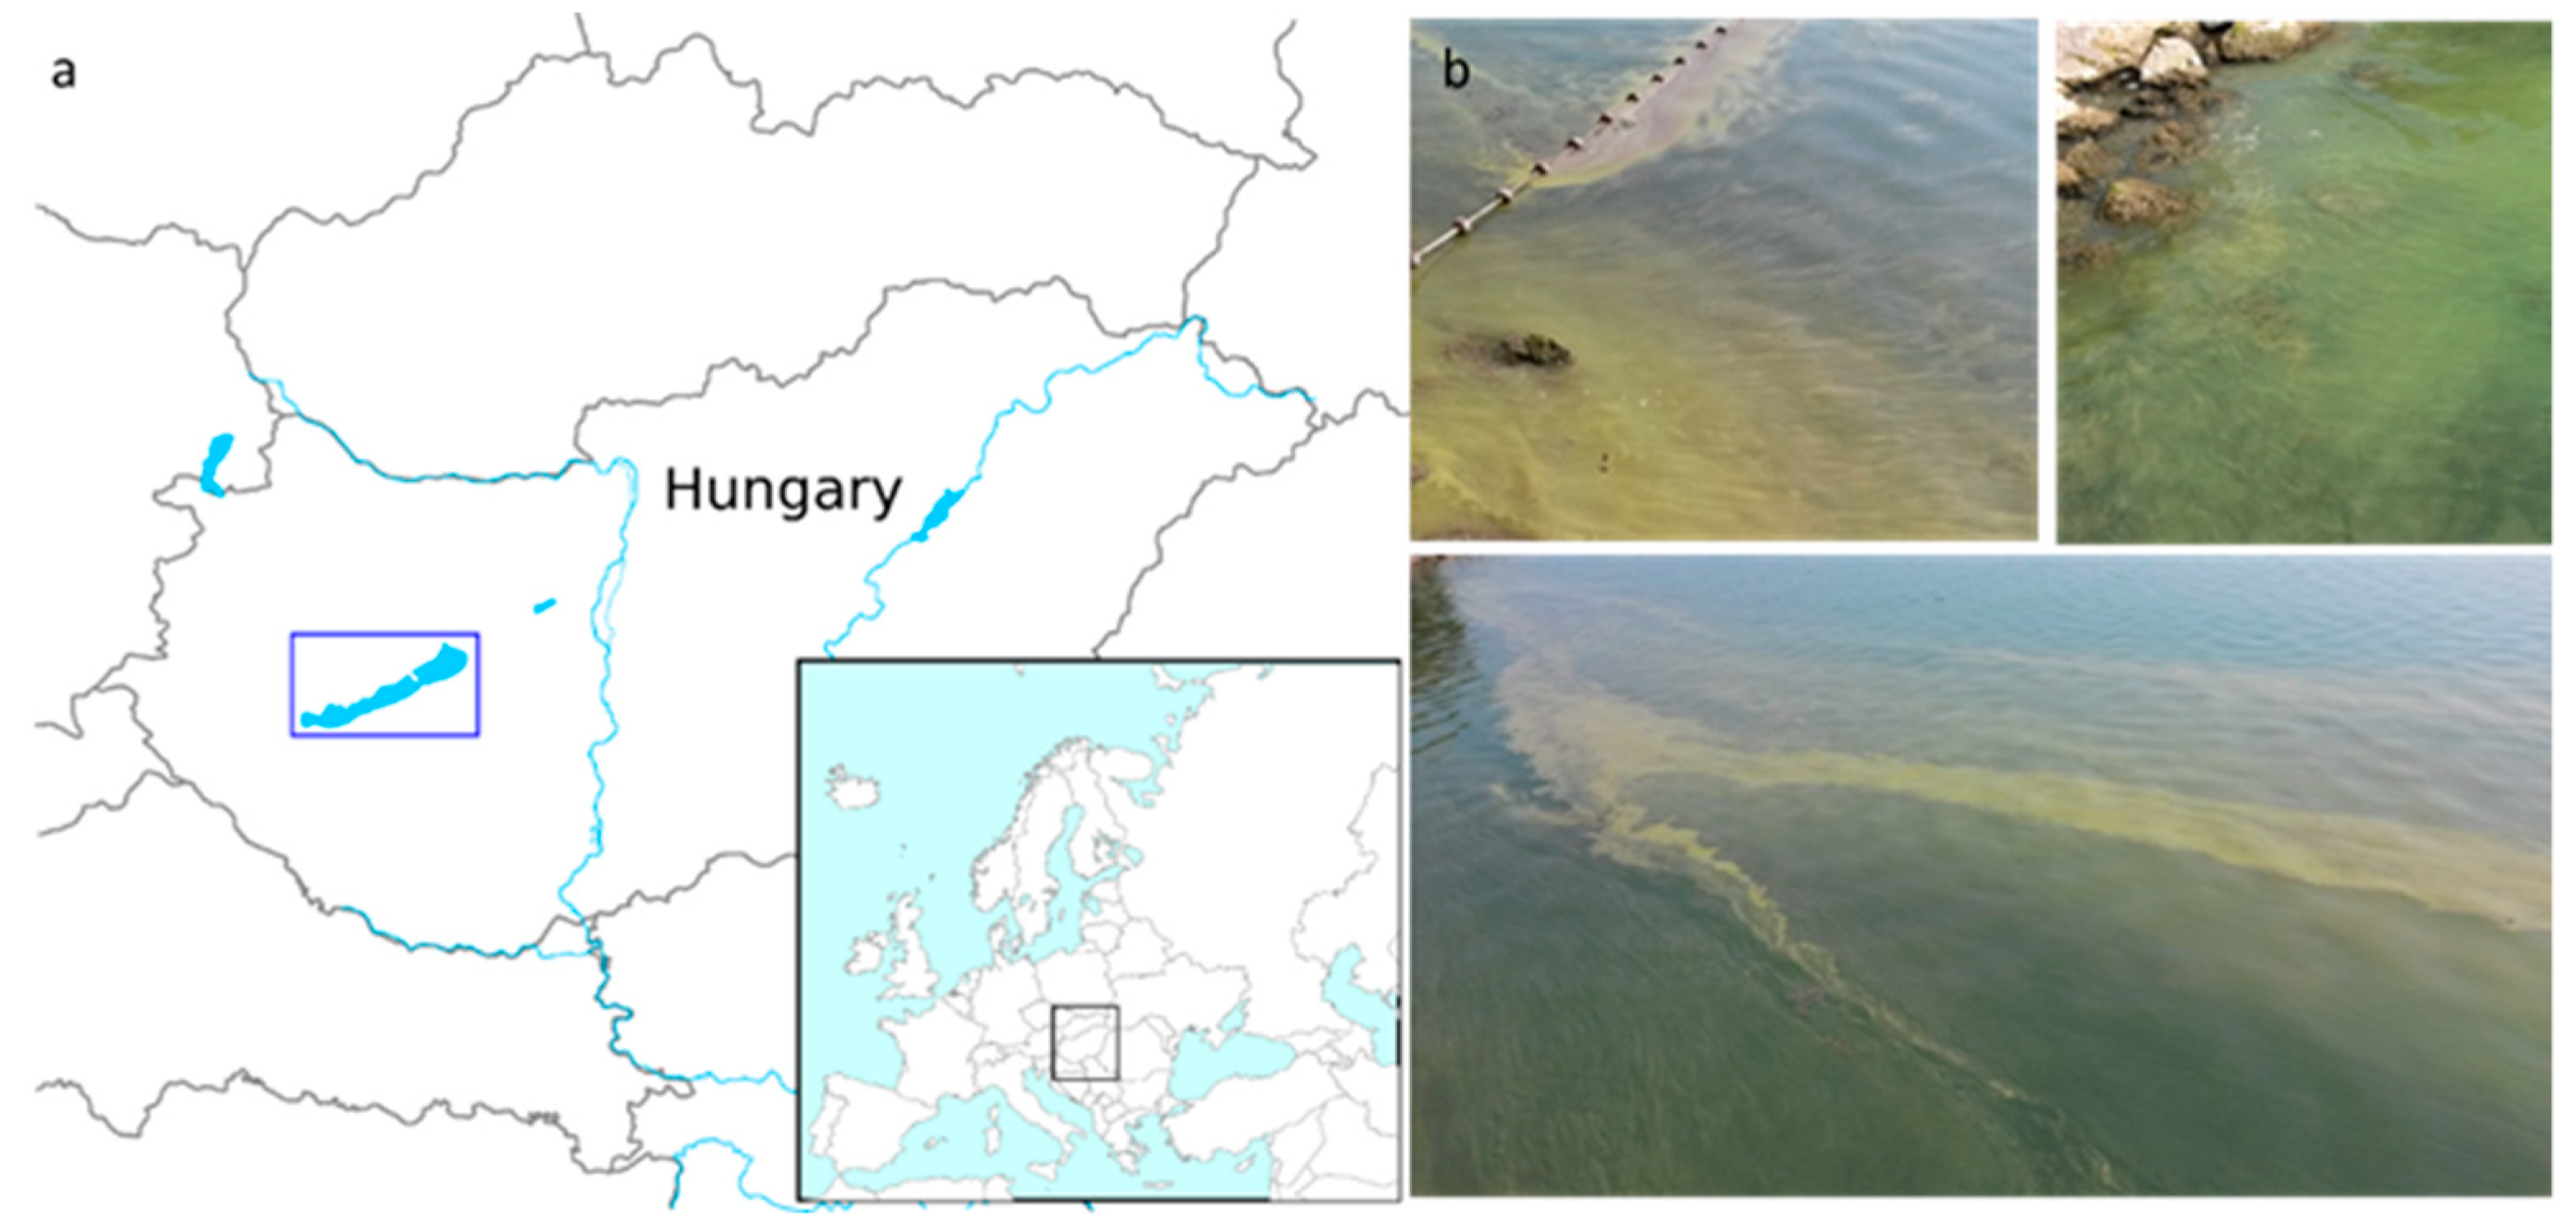
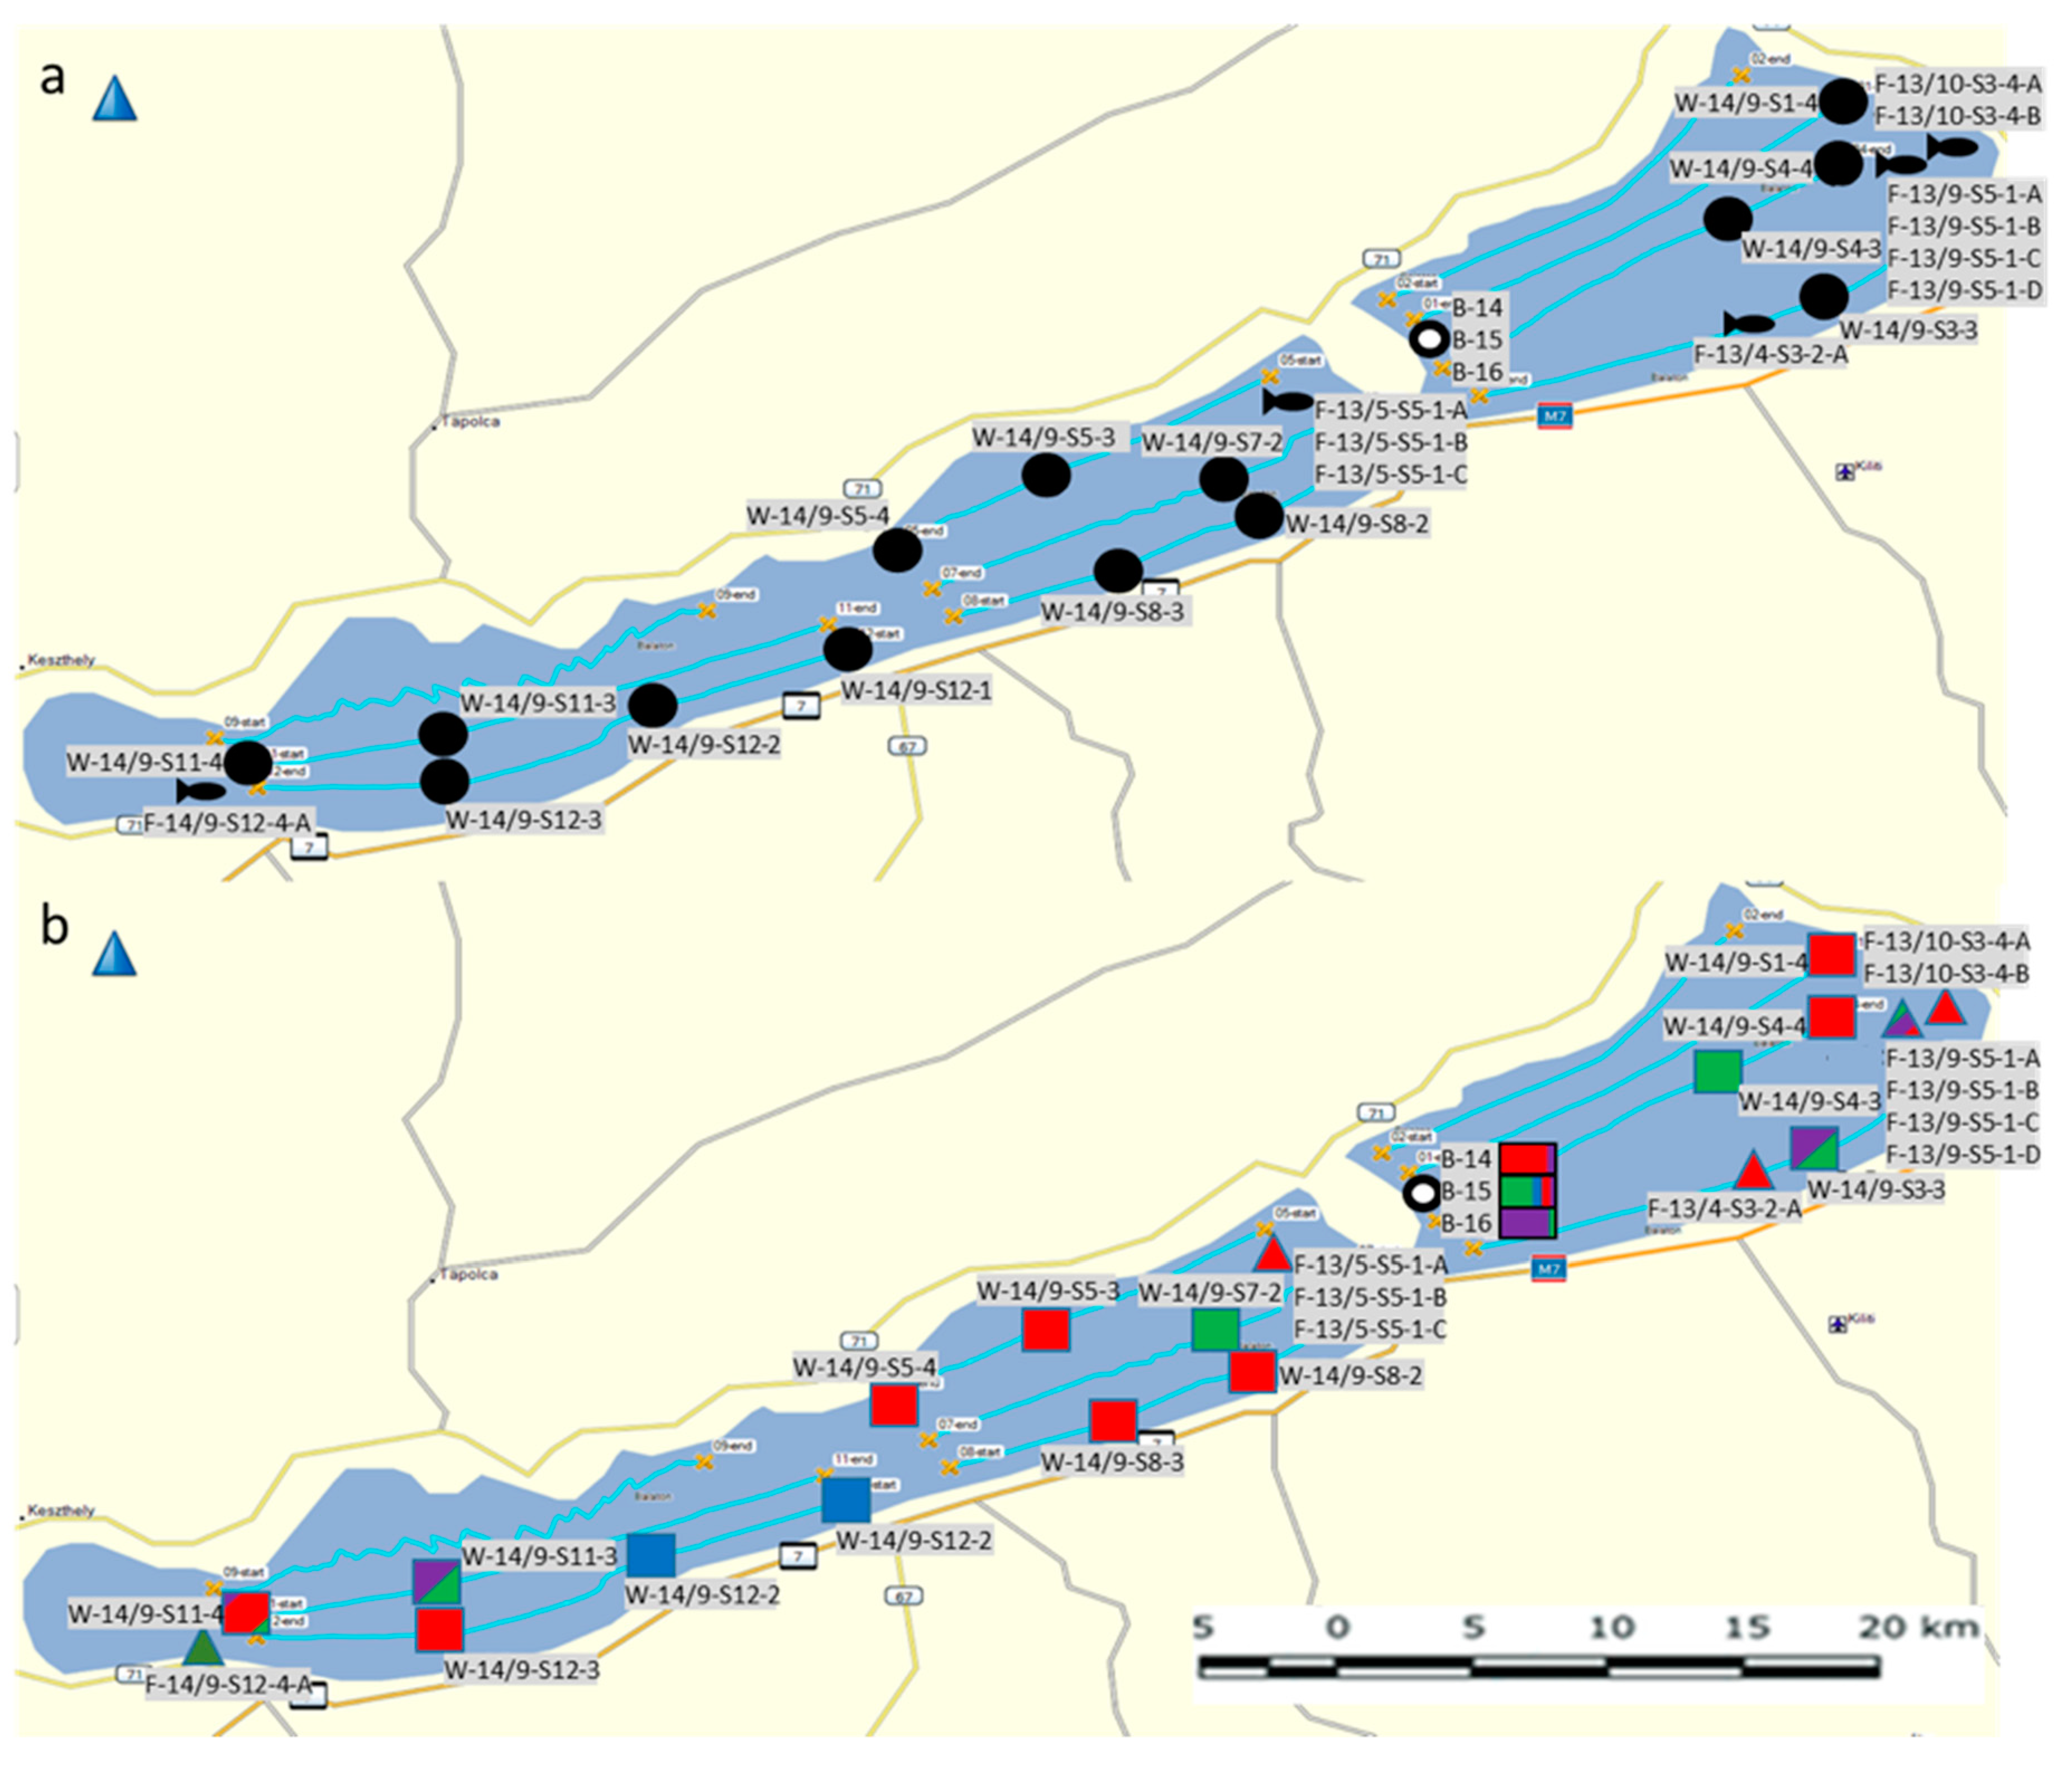
In the mid-2010s, summer cyanobacterial blooms of
Microcystis spp. occurred on a regular basis in Lake Balaton, the largest lake in Central Europe (
Figure 1). The main objective of the present work was to investigate
Microcystis chemotypes within these waterbodies in the period between 2013–2016. More specifically, we aimed to: (i) Identify new and well known congeners of the cyanobacteria peptide family using a LC-MS-based untargeted approach; and (ii) determine the pattern, abundance, and distribution of
Microcystis chemotypes among the pelagial, bloom area, and in the alimentary tracts of filter-feeding bigheaded carps (
Figure 2)—as this fish species represent a massive stock in the lake recently.
3. Discussion
The detected
Microcystis flos-aquae blooms were unexpected but not unique, because at the beginning of the 20th century,
Microcystis blooms were observed in Lake Balaton localizing to small areas [
54]. In addition, from the middle of the century, mainly nitrogen fixing filamentous cyanobacteria species like
Aphanizomenon and
Anabaena (
Dolichospermum) caused this phenomenon in the lake. In Lake Balaton, the species
Cylindrospermopsis raciborskii was identified in the 1970s and initiated whole-lake-area sized water blooms in 1982 and 1994, which adversely affected the tourism and economy of the area [
55]. A number of comprehensive water management measures at the end of the 1980s were aimed at curbing eutrophication such as the drainage of communal sewage from the coastal zone. At the same time, the scale of agricultural activity decreased, resulting in lower nutrient loads to the lake. From this period until the present report, there has been no cyanobacterial blooming in Lake Balaton. The reappearance of
Microcystis blooms in the lake, which were observed in this study, suggests that external nitrogen loads may have initiated the multiplication of non-diazotrophic cyanobacteria. In our present study, 11
Microcystis strains were isolated from gut samples, 14 from the pelagic plankton from Lake Balaton, and three collected
Microcystis bloom samples.
Taxonomic classification of
Microcystis is difficult. The combination of microscopic observations with molecular data can be the most adequate method for identifying isolates [
56]. Most species of this genera have been described via their morphological characteristics [
57,
58], however, colony variance can be huge, and the external qualities of many populations overlap the limiting specifications [
59,
60]. Therefore, it is difficult to find the differences between traditional species [
61].
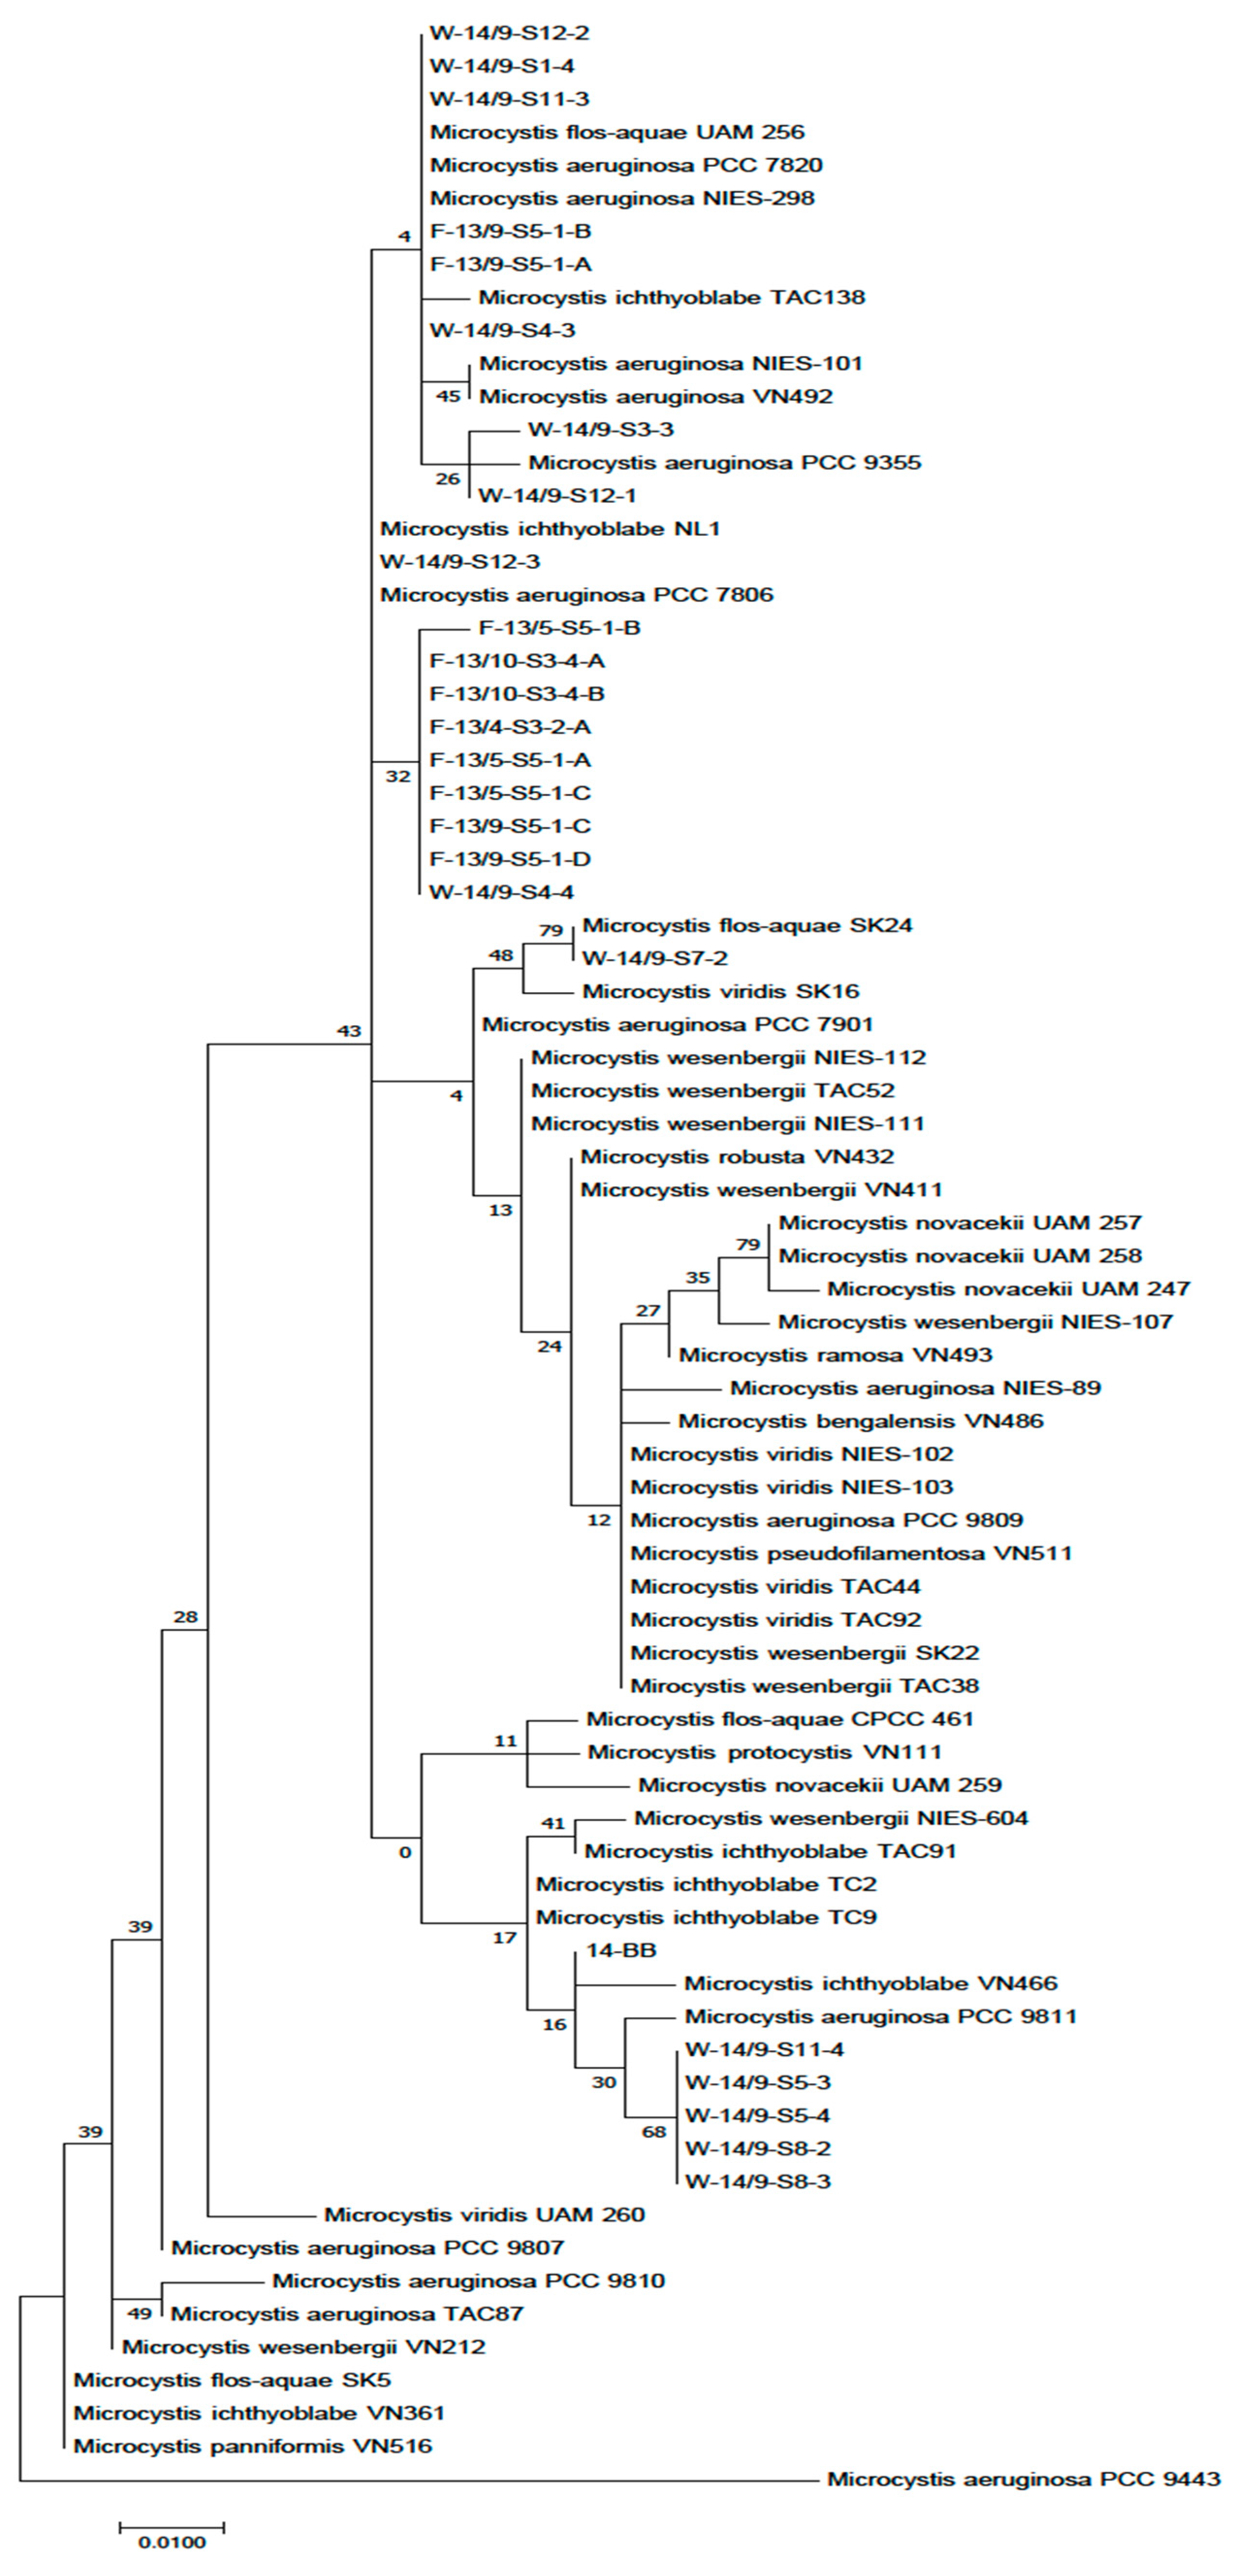
The taxonomic position of the isolated strains was confirmed by phylogenetic analysis. Our strains showed the closest phylogenetic relation to morphospecies
M. flos-aquae and
M. viridis (
Figure A1). Several papers have been published on the correlation between
Microcystis morphotypes and genotypes [
62,
63]. The heterogeneity of this genus between different regions has also been well documented using further genetic markers [
16,
18,
19,
20,
22,
23,
29]. Neilan et al. [
64] defined genetic similarity and noted that the species had no specific phylogeographic structure, which was in accordance with work described by Bittencourt-Oliveira et al., (2001) [
17] where
Microcystis strains did not show any distinct phylogenetic pattern.
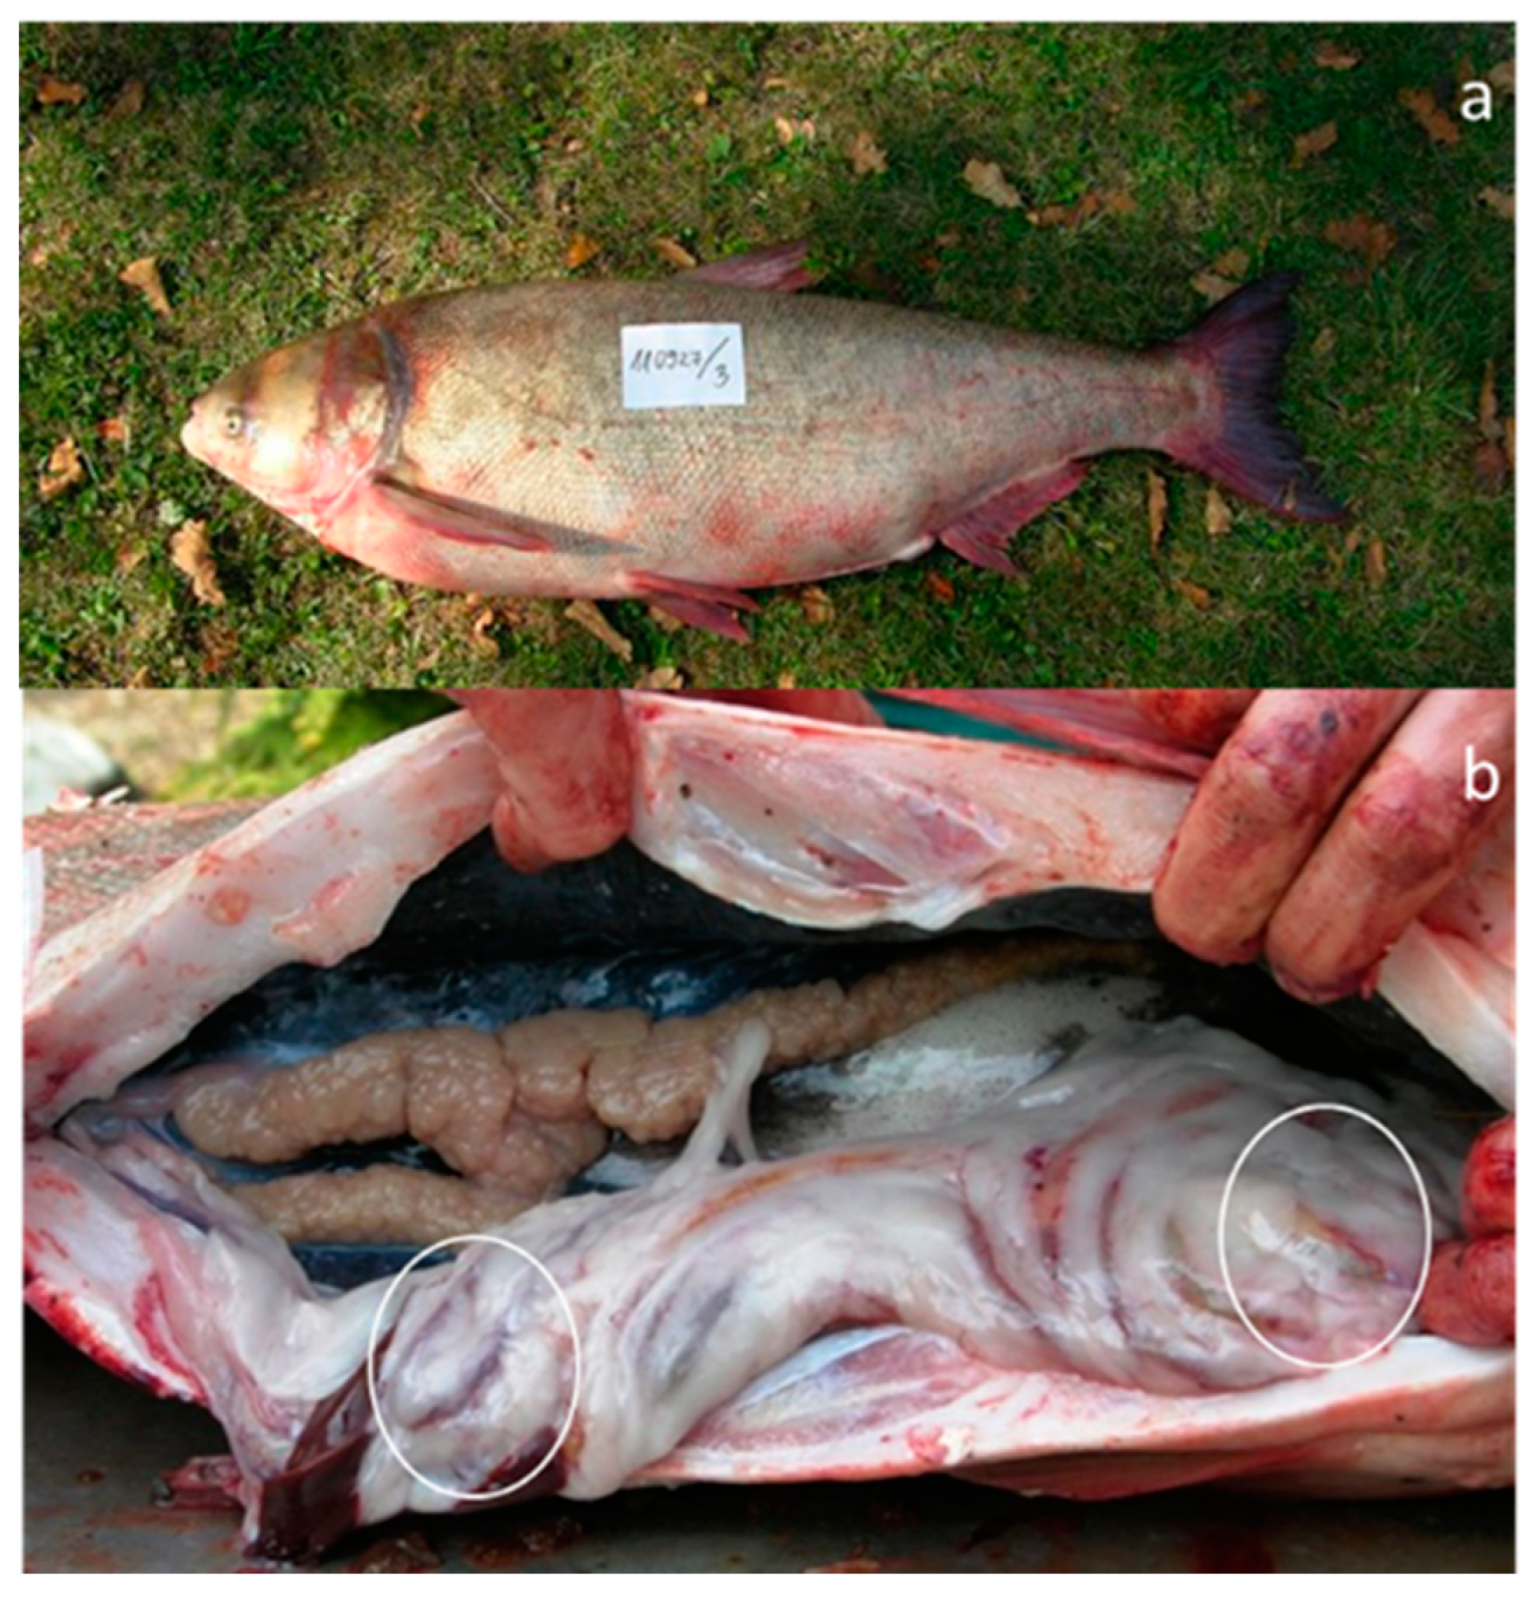
In our work, we identified a strong mucous envelope characteristic of the studied
Microcystis morphotype. This can explain how this cyanobacterial species survive in the alimentary tract of bigheaded carps. Exopolysaccharides (EPS) can be crucial for cellular attachment, adhesion, and survival. This highly hydrated layer provides protection to cyanobacterial cells against desiccation, toxic agents, or the digestive enzymes of other organisms. This role of the EPS has been confirmed in several studies [
65].
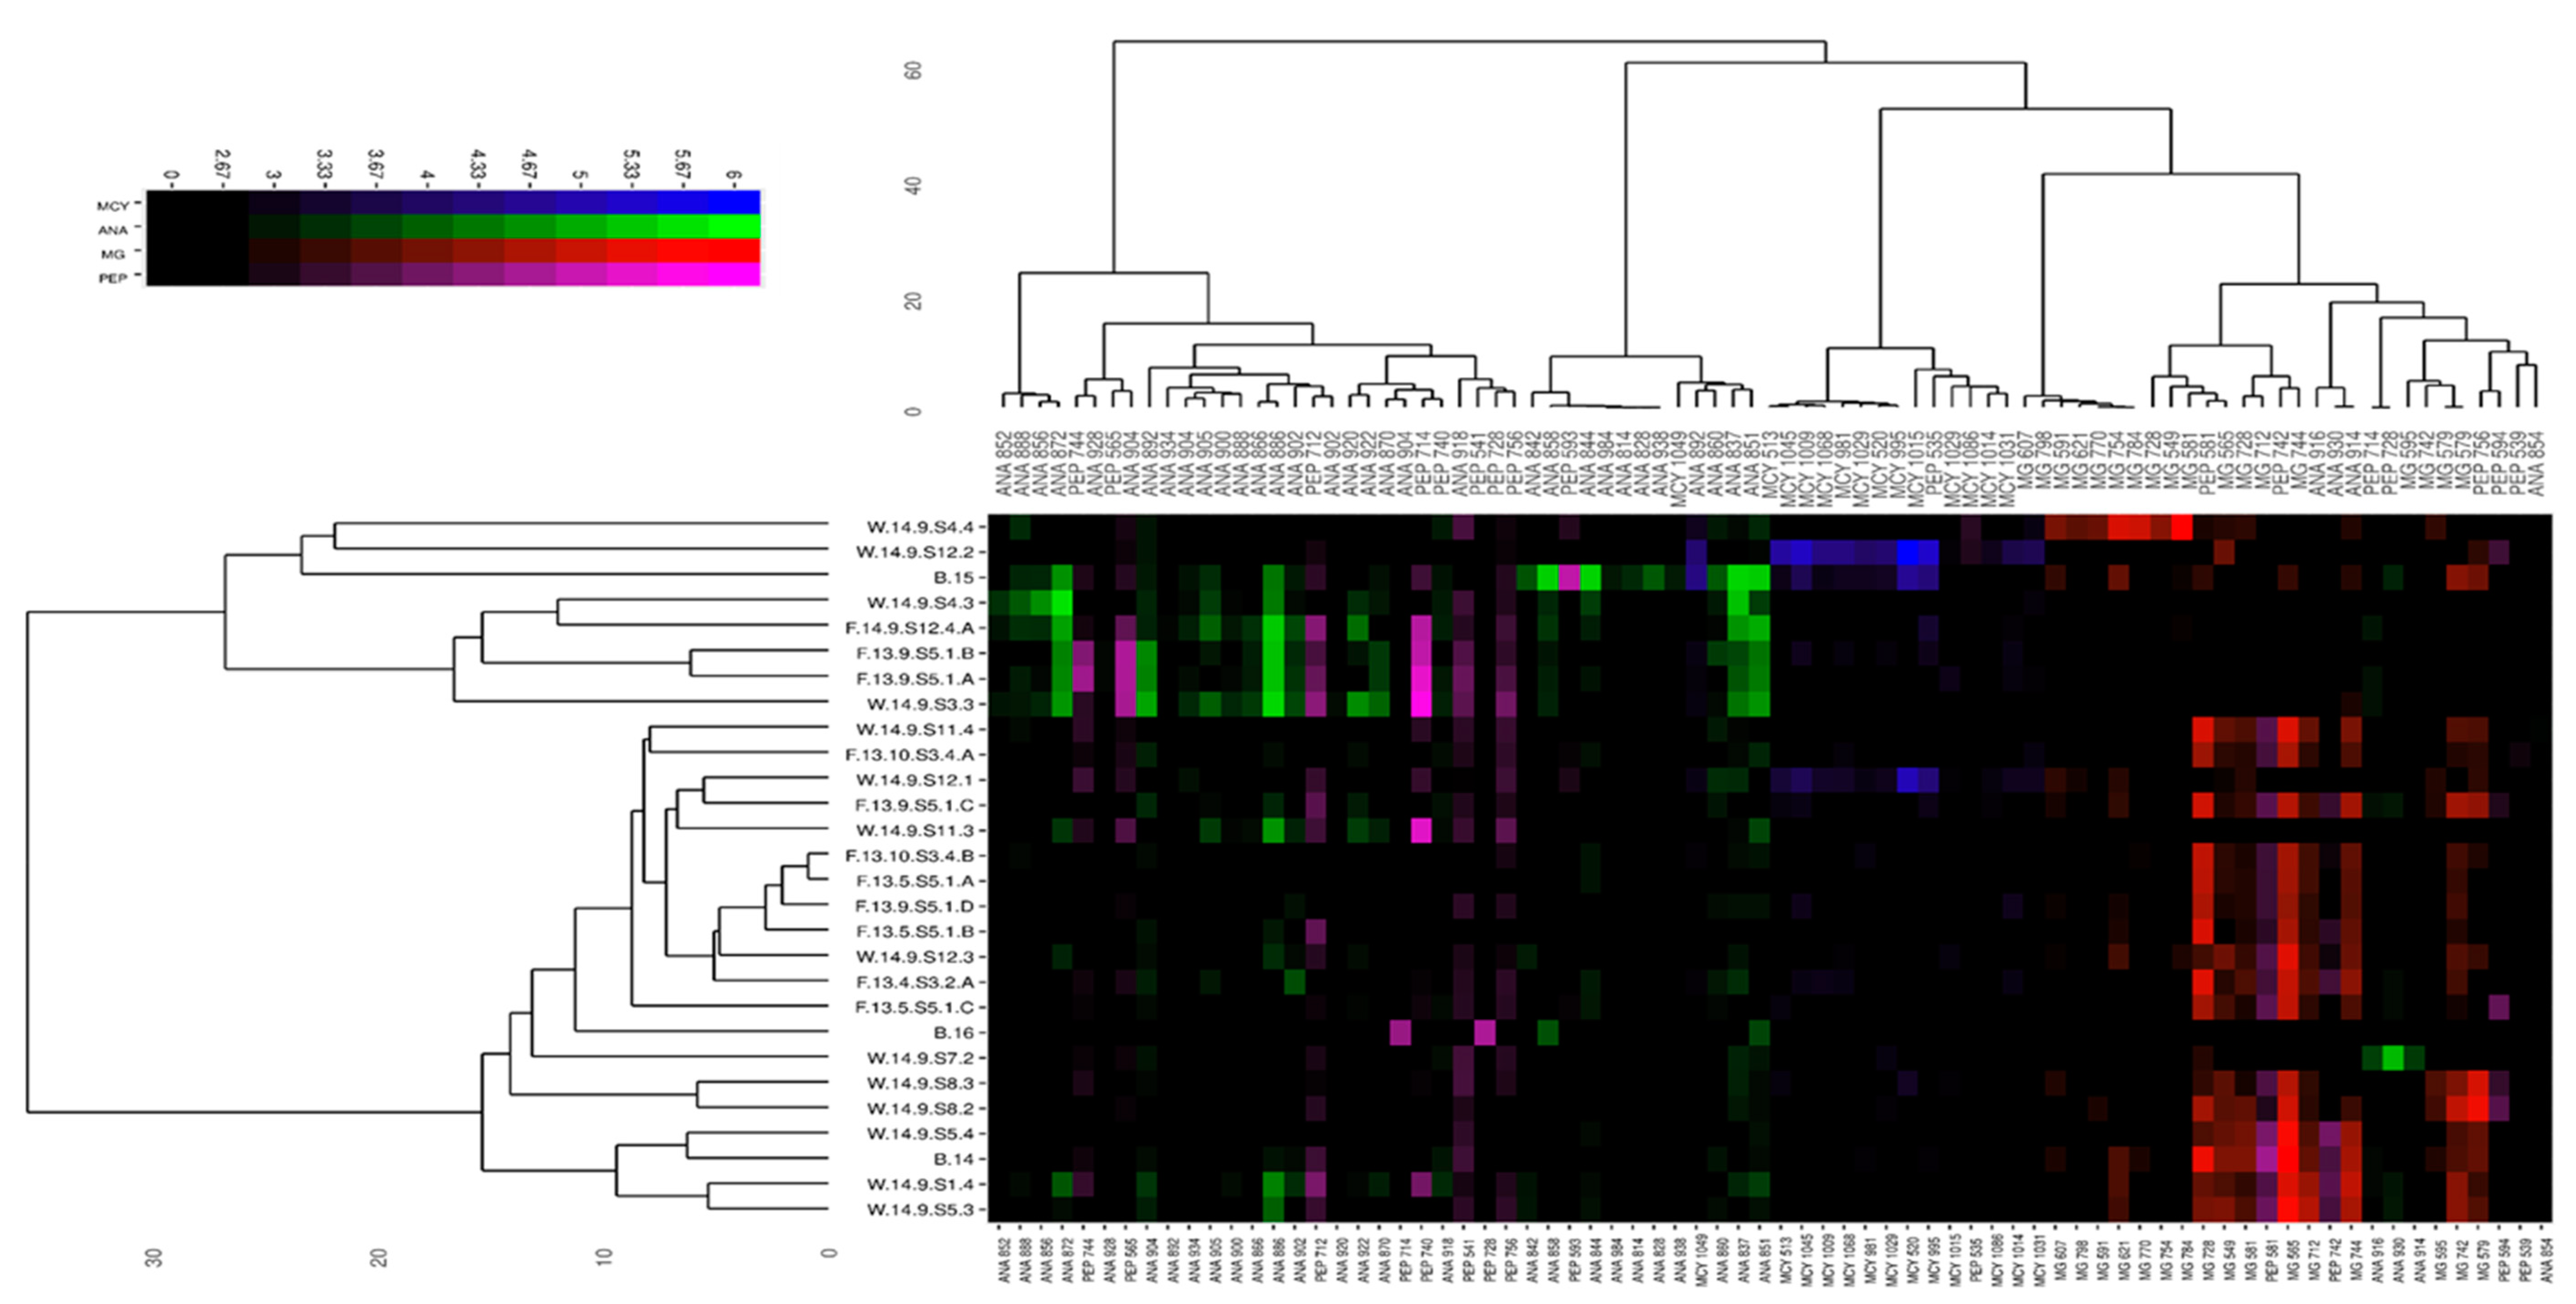
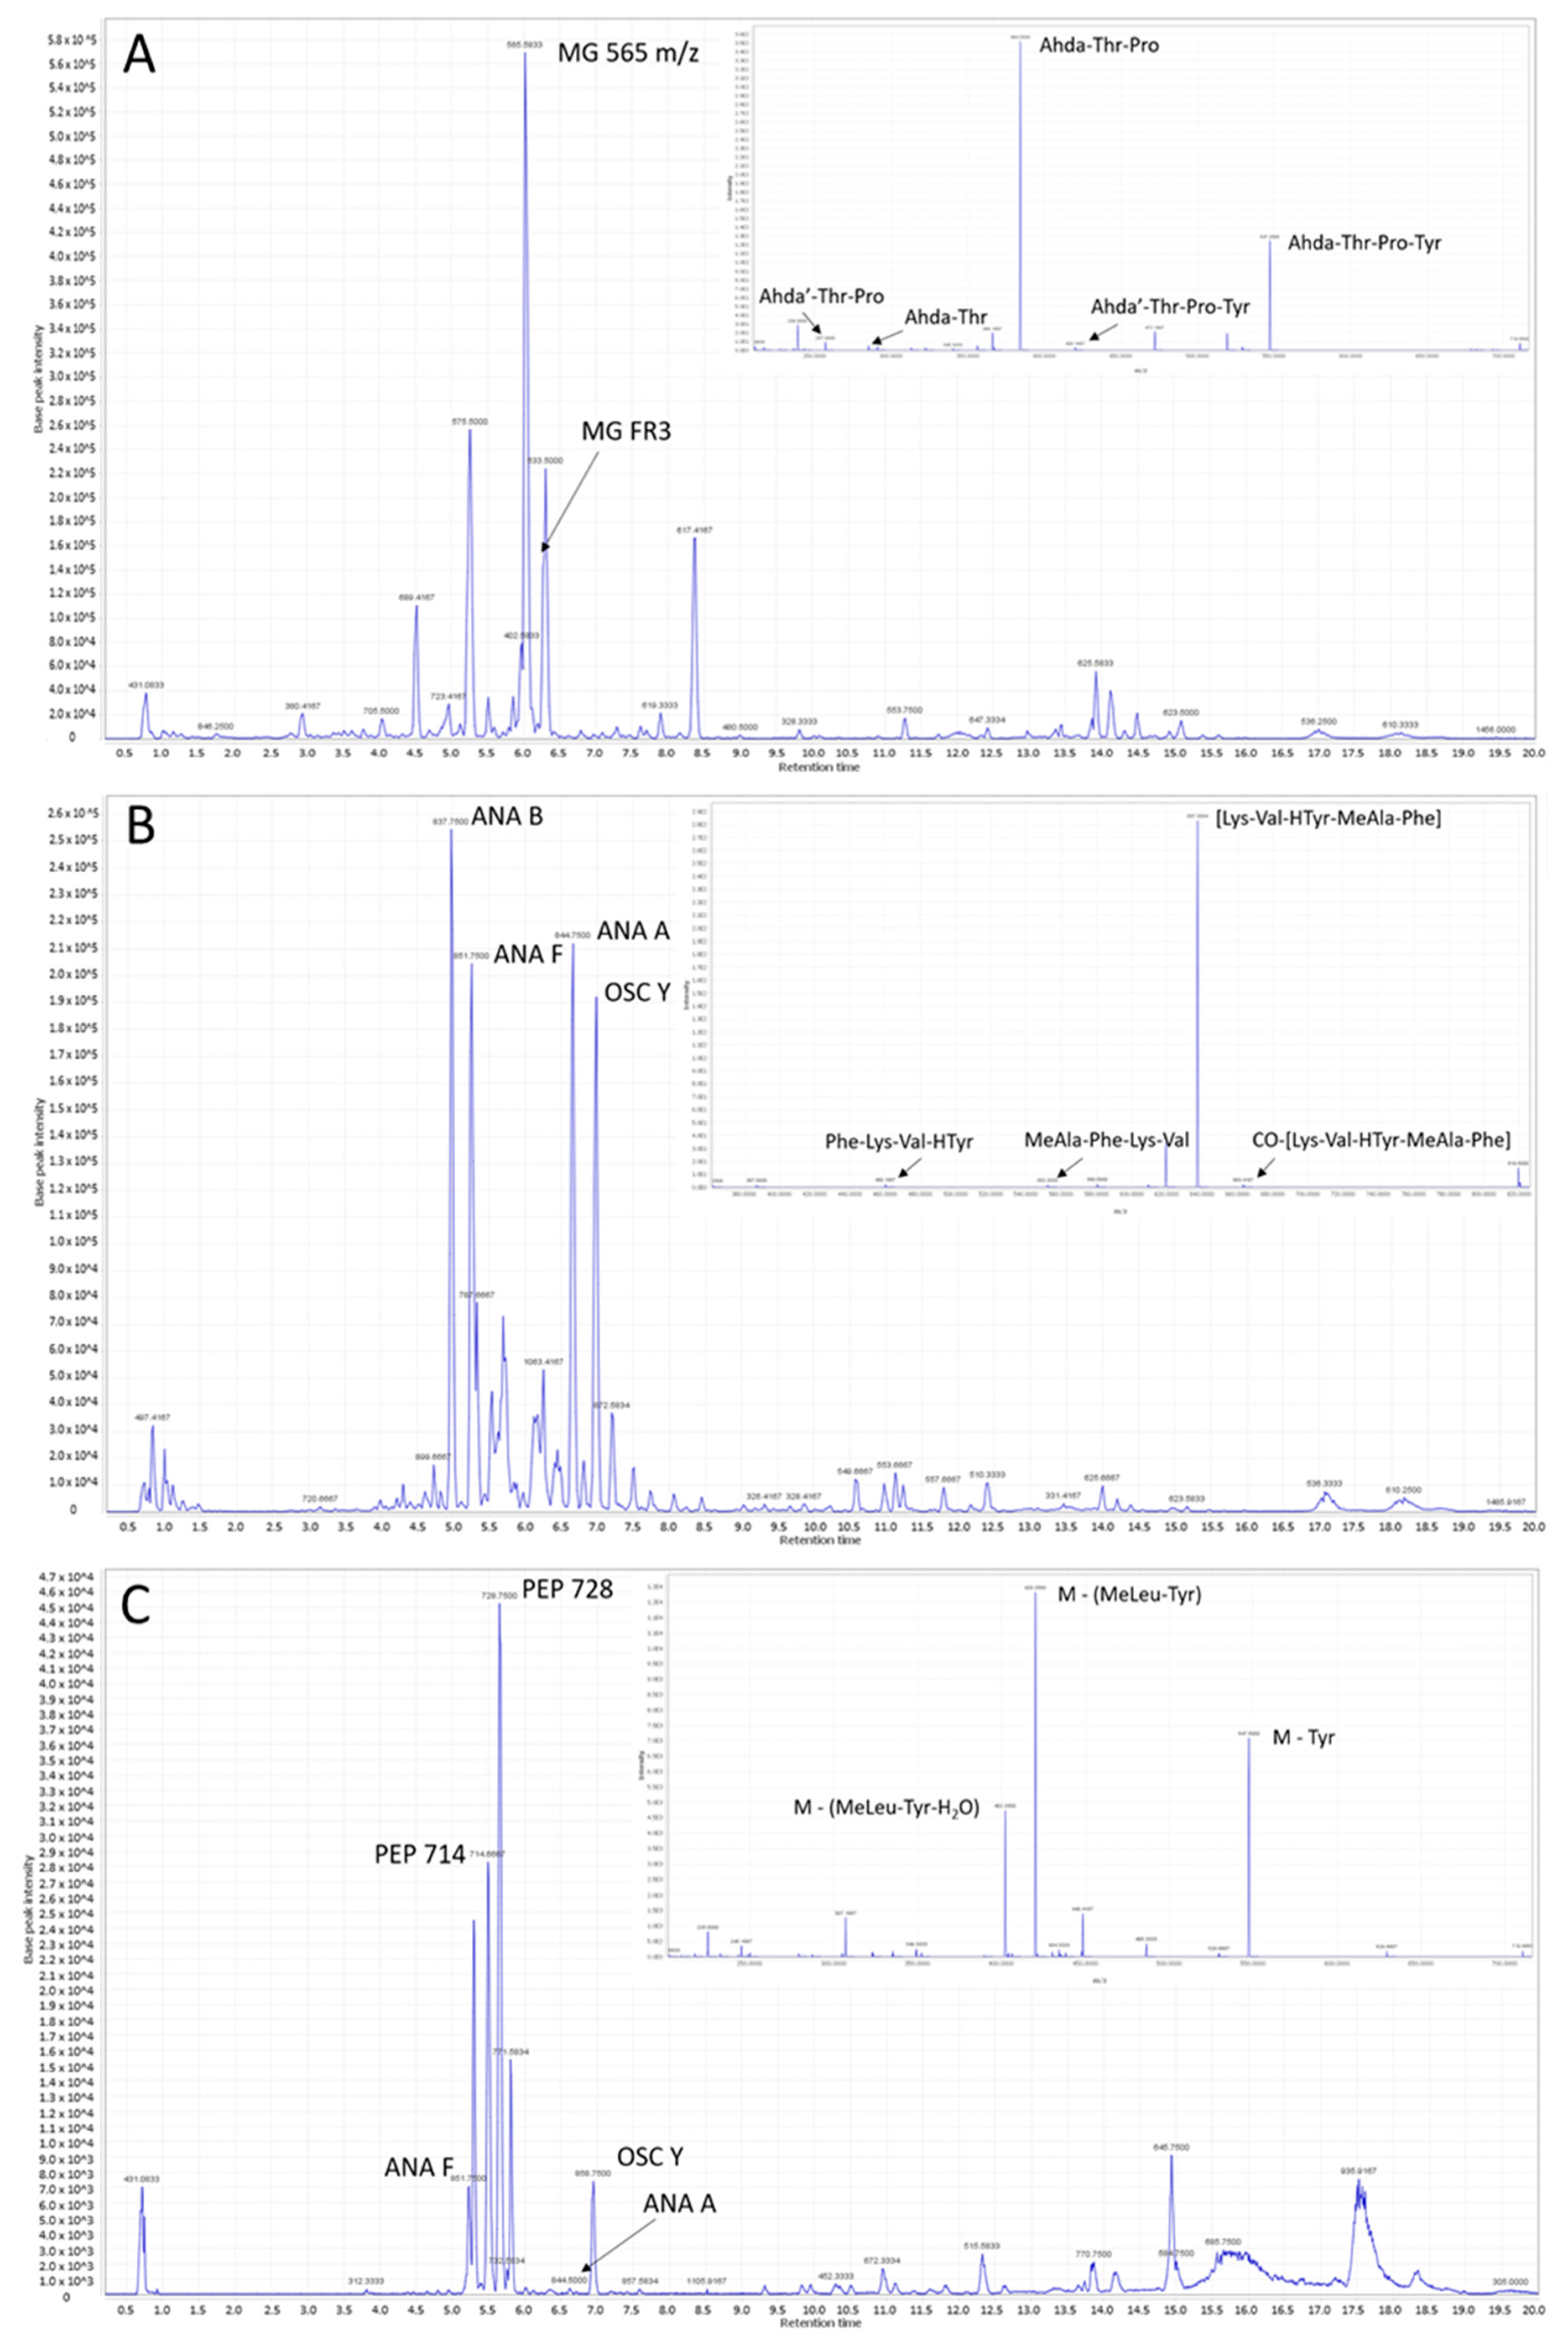
Thirty-six ANA and 17 MG variants were identified from the isolated strains (
Table 1 and
Table 2). New MCY congeners are more rarely identified, perhaps because this has been the most investigated cyanobacterial peptide family. However, bioactive peptide families like MGs and ANAs are receiving growing attention. Four known and 32—to the best of our knowledge—previously unknown ANA variants were fully or partially identified in our analysis. Several partly identified peptide fragments were detected (
Table 4 and
Table A4), which were clustered into this family using heat map analysis.
ANA F, OSC B, and C are inhibitors of protein phosphatases (PP). N-MeHty and the positively charged Arg are crucial parts of molecules relating to this activity [
66]. ANAs were also found to be active toward proteinase enzymes such as trypsin, chymotrypsin, elastase, and carboxypeptidase A [
8,
67,
68]. The relaxing activity of rat aortic preparations was detected by treatments with ANA B and ANA 906 [
69]. ANA B and ANA F, the most frequently found ANAs, were shown to inhibit the growth of many
M. aeruginosa strains by inducing the lytic cycle in cyanobacteria [
70,
71]. Taking into account the published effects of these metabolites, its ecological roles might be important [
72].
Two known, and 15—to the best of our knowledge—previously unknown MG variants were identified in our analysis. Several partly identified peptid fragments were also detected as part of this family.
MGs are a 40-member group of linear and nonribosomal peptides, which have been detected and purified from several bloom-forming cyanobacteria isolates. The number of congeners is growing [
2,
3,
7]. These are built by an α-hydroxy-β-amino derivate of decanoic or octanoic acid, which is rarely chlorinated at its terminal methyl group with three to five additional amino acids in the molecules [
4,
7,
73,
74]. MGs are zinc metalloprotease inhibitors (e.g., angiotensin-converting enzyme), and aminoproteinases that bind their α-hydroxy-β-amino residue to the zinc at the active site of the enzyme. Our findings indicate that these substances are important candidates for treating hypertension [
72]. The patchy distribution of oligopeptide patterns in cyanobacterial populations enables classifying isolates into several oligopeptide-based chemotypes [
14,
75]. It is important to note that mainly ANA and MG dominant strains were detected from Lake Balaton in this study, but 10 strains from the alimentary tract were MCY producing.
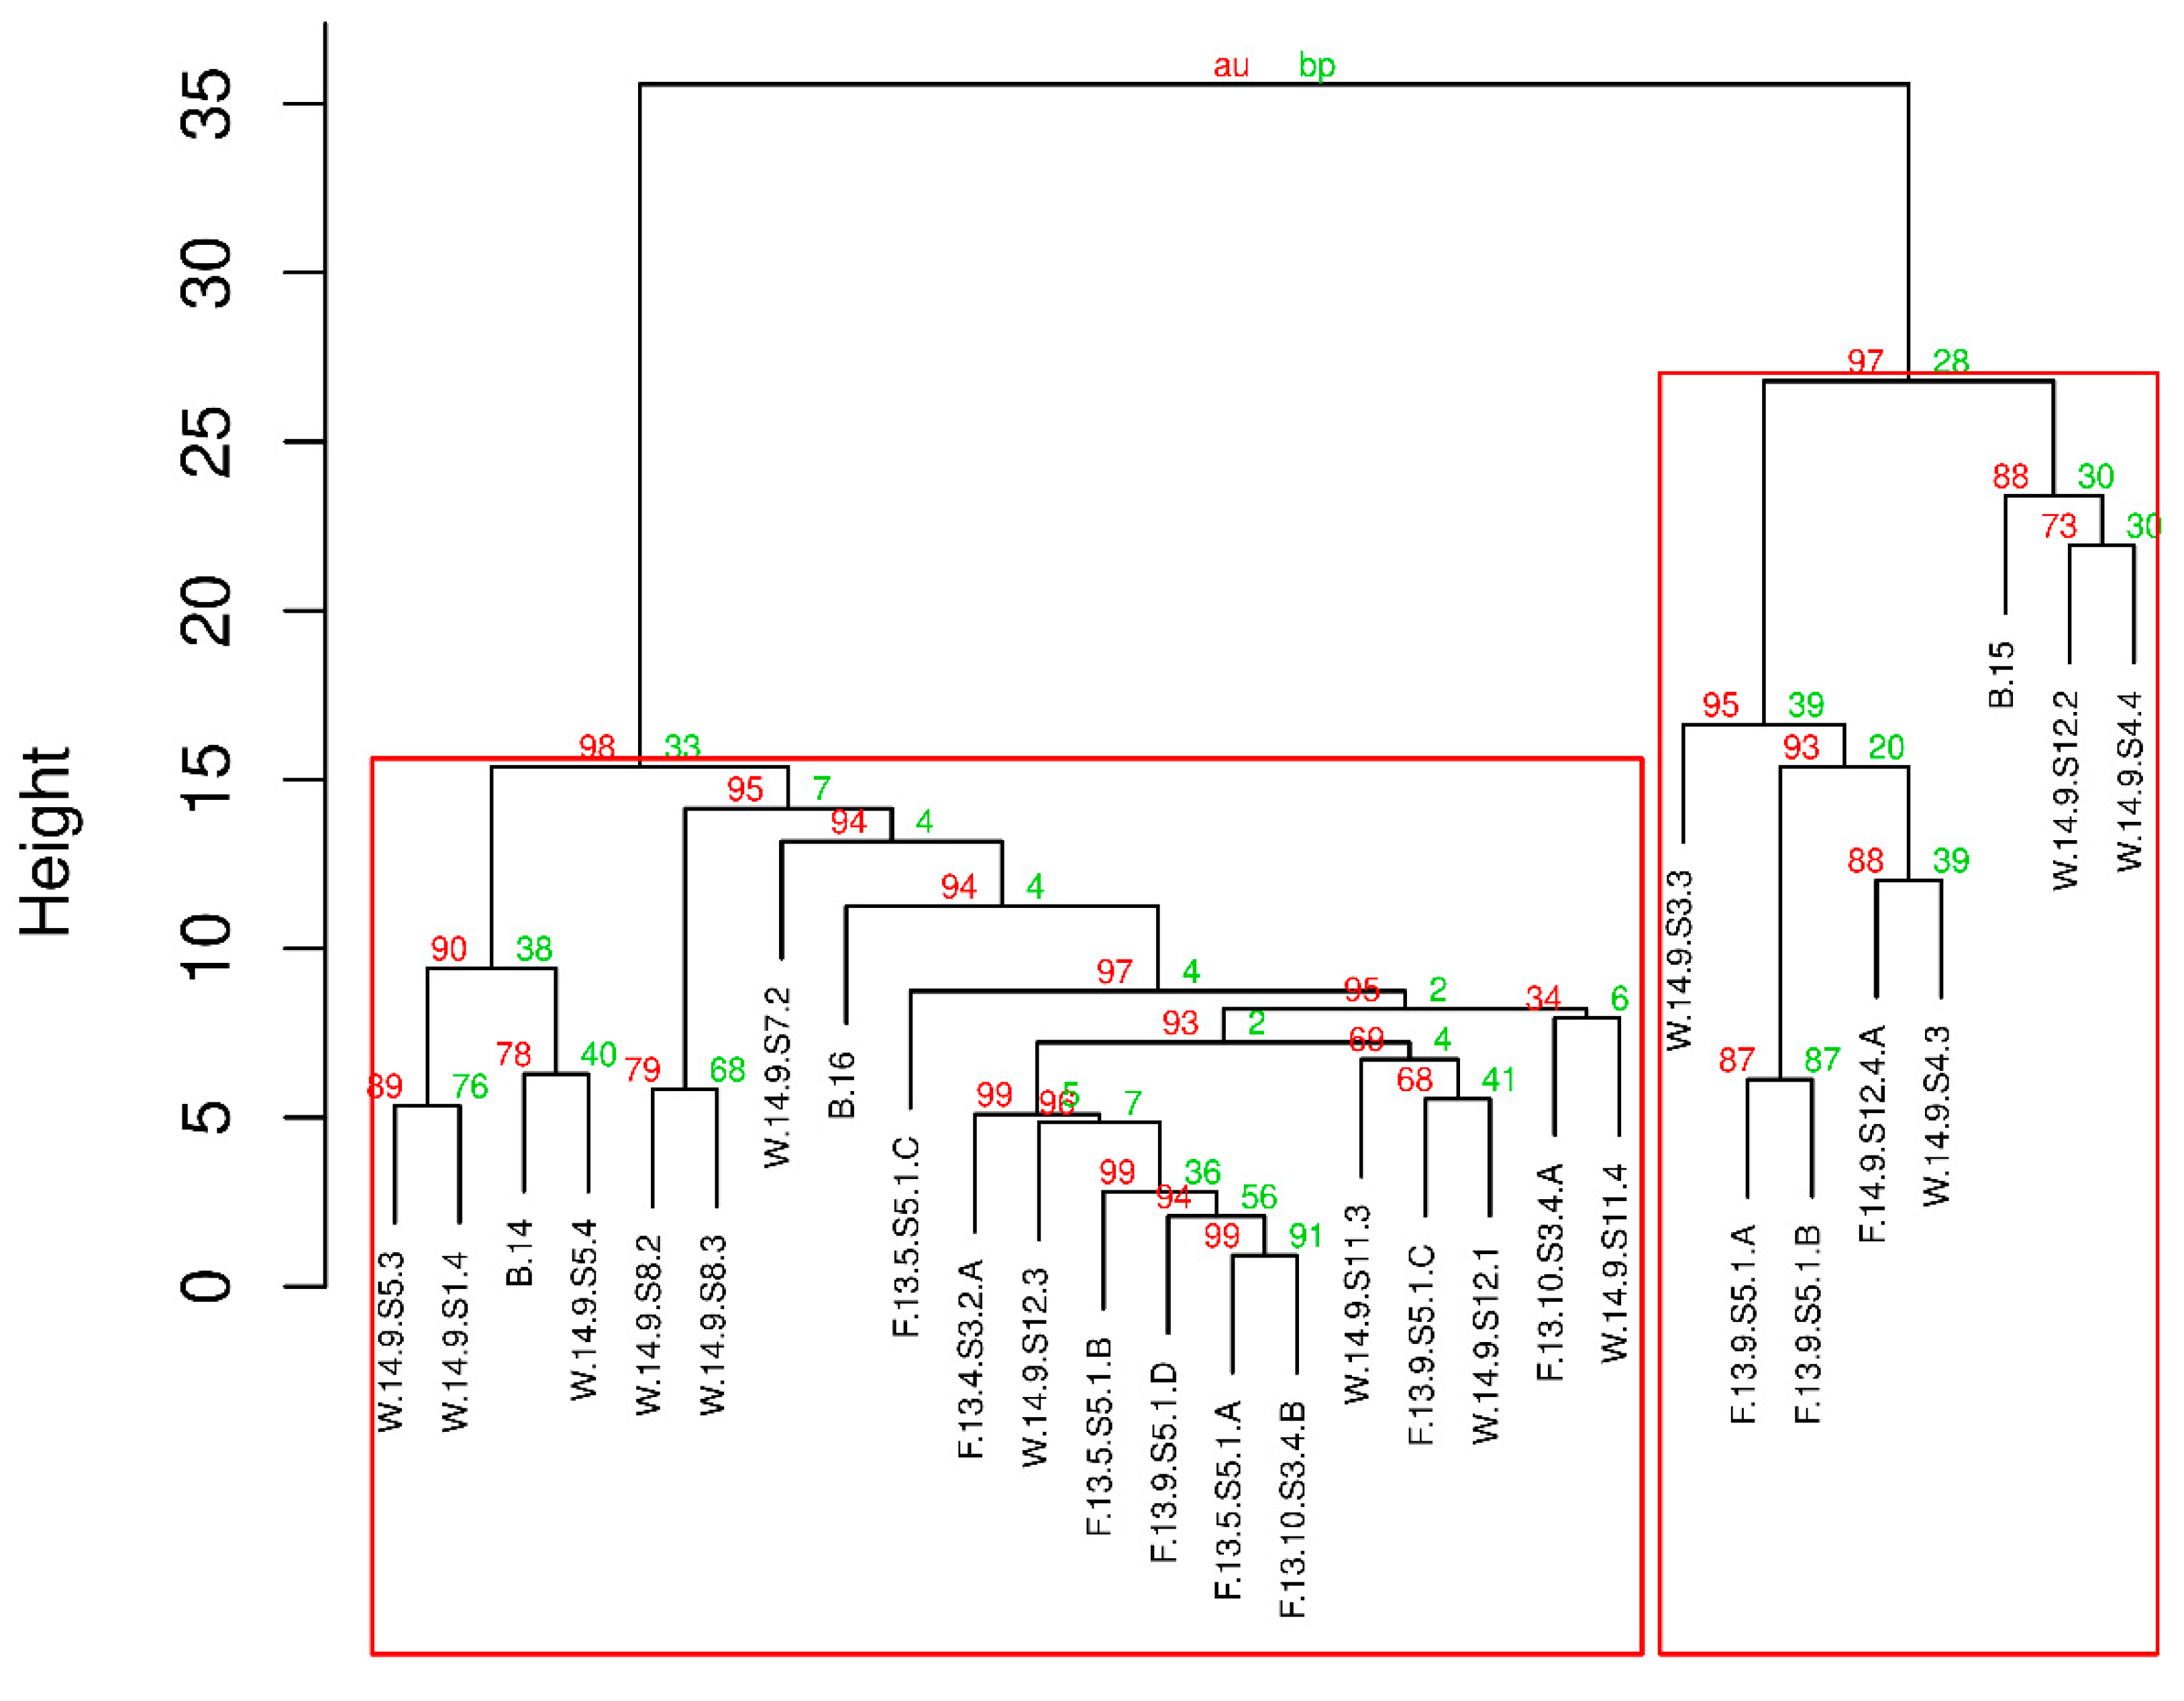
The distinguishable chemotypes we found in our analysis were separated into clusters of varied density based on the absence or co-occurrence of biosynthetic metabolite clusters, similar to several other studies that have investigated
Microcystis and other cyanobacterial peptide producers such as
Planktothrix sp.,
Nostoc sp., etc. [
14,
75,
76,
77]. These genera often possess variable chemotypes with the ability to produce different peptide families in natural assemblages [
3]. In the
Microcystis isolates originating from natural populations, four chemotypes were characterized based on the fact that they contained a few or several main peptides, but in many cases, the appearance of several different peptides belonging to different biosynthetic clusters has been observed.
From Lake Balaton, primarily ANA- and MG-dominated strains were detected, with the observation that many lesser-known or new congeners appeared from both groups of peptides. In addition, several partly identified peptide fragments were detected during the analysis whose metabolites seemed to belong to the metabolism (synthesis or degradation) of the two main groups identified as suggested by the heat map visualization. Focusing on the bloom samples from 2014–2016, it is important to note that the naturally collected material of all three samples represent mixed matrices, and each of them contained several chemotypes and/or genotypes of the genus
Microcystis. These samples belonged to different chemotype clusters. The bloom samples from the same sampling site showed different bioactive peptide patterns. While the 2014 sample was mainly MG-dominated, the 2015 bloom sample was rather ANA-rich. The 2016 bloom community contained mostly non-identified peptides (
Figure A2). Considering all the identified peptides in our samples, we found that the isolated and identified chemotypes originating from the gut and pelagic sample could be involved in the
Microcystis community that built the bloom phenomenon.
Altogether, 13 MCY congeners were also identified in this work from phytoplankton and digestive tract strains. There is no doubt that MCYs are the most harmful and notorious family from the described cyanobacterial peptides. All of the detected MCY forms are already known, and no new MCY variant was identified in the present analysis. Although only a few MCY variants have been identified near the large number of MG and ANA, these peptide-producers display a separate cluster in our analysis. It is especially worth paying attention to this group because MCY is the most common toxin produced by cyanobacteria in waters [
78,
79], and can also cause death, illness, complications, and damage in humans, animals, and plant organs.
In the several cases where
Microcystis and
Planktothrix oligopeptide patterns have been investigated worldwide [
12,
13,
14,
75,
80,
81,
82], and in our local area [
83,
84,
85,
86], the numbers of genotypes have been identified with the help of phylogenetic markers [
64,
87]. The lack of correlation between the
Microcystis chemotypes and phylogenetic genotypes found in cases similar to our present study suggest that the synthesis of bioactive peptides is not phylogenetically conserved in this genera. This has also been the conclusion of recent work [
88] where
Microcystis chemotypes were researched in Spanish freshwater and reservoirs. The findings in our study are consistent with the statement that the distribution of oligopeptide production abilities does not correlate with morphospecies, phylogenies based on commonly used molecular markers, or the geographical origin of the isolated organisms [
64,
89].
Bigheaded carps were introduced into Lake Balaton (Hungary) in 1972 and were stocked until 1983 [
90,
91,
92,
93,
94]. These filter-feeder fish species can consume almost all algal and cyanobacterial taxa from ambient water, but the ingested algae are only partially utilized [
47]. In fact, a fraction of the consumed phytoplankton cells or colonies (e.g.,
Microcystis sp., diatoms, volvocalean, and chlorococcalean green algae) may stay alive after passing through the digestive tract of fish as they are protected either by a mucilaginous envelope or by a thick, cellulose-based cell wall [
47,
95]. In the present study, 11
Microcystis strains were isolated from gut samples and identified as
Microcystis flos-aquae with a characteristic mucilage envelope that can be the main protecting layer against the extreme gut environment.
In the scientific literature, there is contradictory information on the abundance and composition of cyanobacteria in the alimentary tract of bigheaded carps. On one hand, a study by Ye et al. [
96] found cyanobacteria to be predominant in the gut microbiota of bigheaded carp living in different North American rivers, while Li et al. [
97] reported the abundance of cyanobacteria was typically low in the intestines of both silver and bighead carp inhabiting Wuhu Lake (China). Based on the gut content metagenome analysis,
Microcystis was identified as the most abundant cyanobacterial genus detected in the gut of bigheaded carp in Lake Balaton [
98].
Beyond the outer polysaccharide layer, it is worth noting the detected peptides in this work, mainly the large number of ANAs and MGs (
Table 1 and
Table 2) and the above discussed bioactivity. Digestive enzymes’ activity in bigheaded carp species have been investigated in several studies [
99,
100]. Phosphatases and proteases are principal groups of enzymes for the fish species [
101]. “The rapid excretion rate of silver carp would require quick digestion and nutrient uptake of foods to support high growth rates” [
102]. Several microorganisms that can play a role in digestion and be responsible for higher levels of the above-mentioned digestive enzymes have been identified in the gut of silver carp [
96]. Our suggestion is that the detected MGs and ANAs, as potent protease inhibitors, could modify the digestive capacity by binding directly to the enzymes. However, it is known that most oligopeptides stay in the producing cyanobacteria cell and are only released via cell lysis following cell death, and thus, would only provide protection for the surviving cyanobacterial cells in the gut.
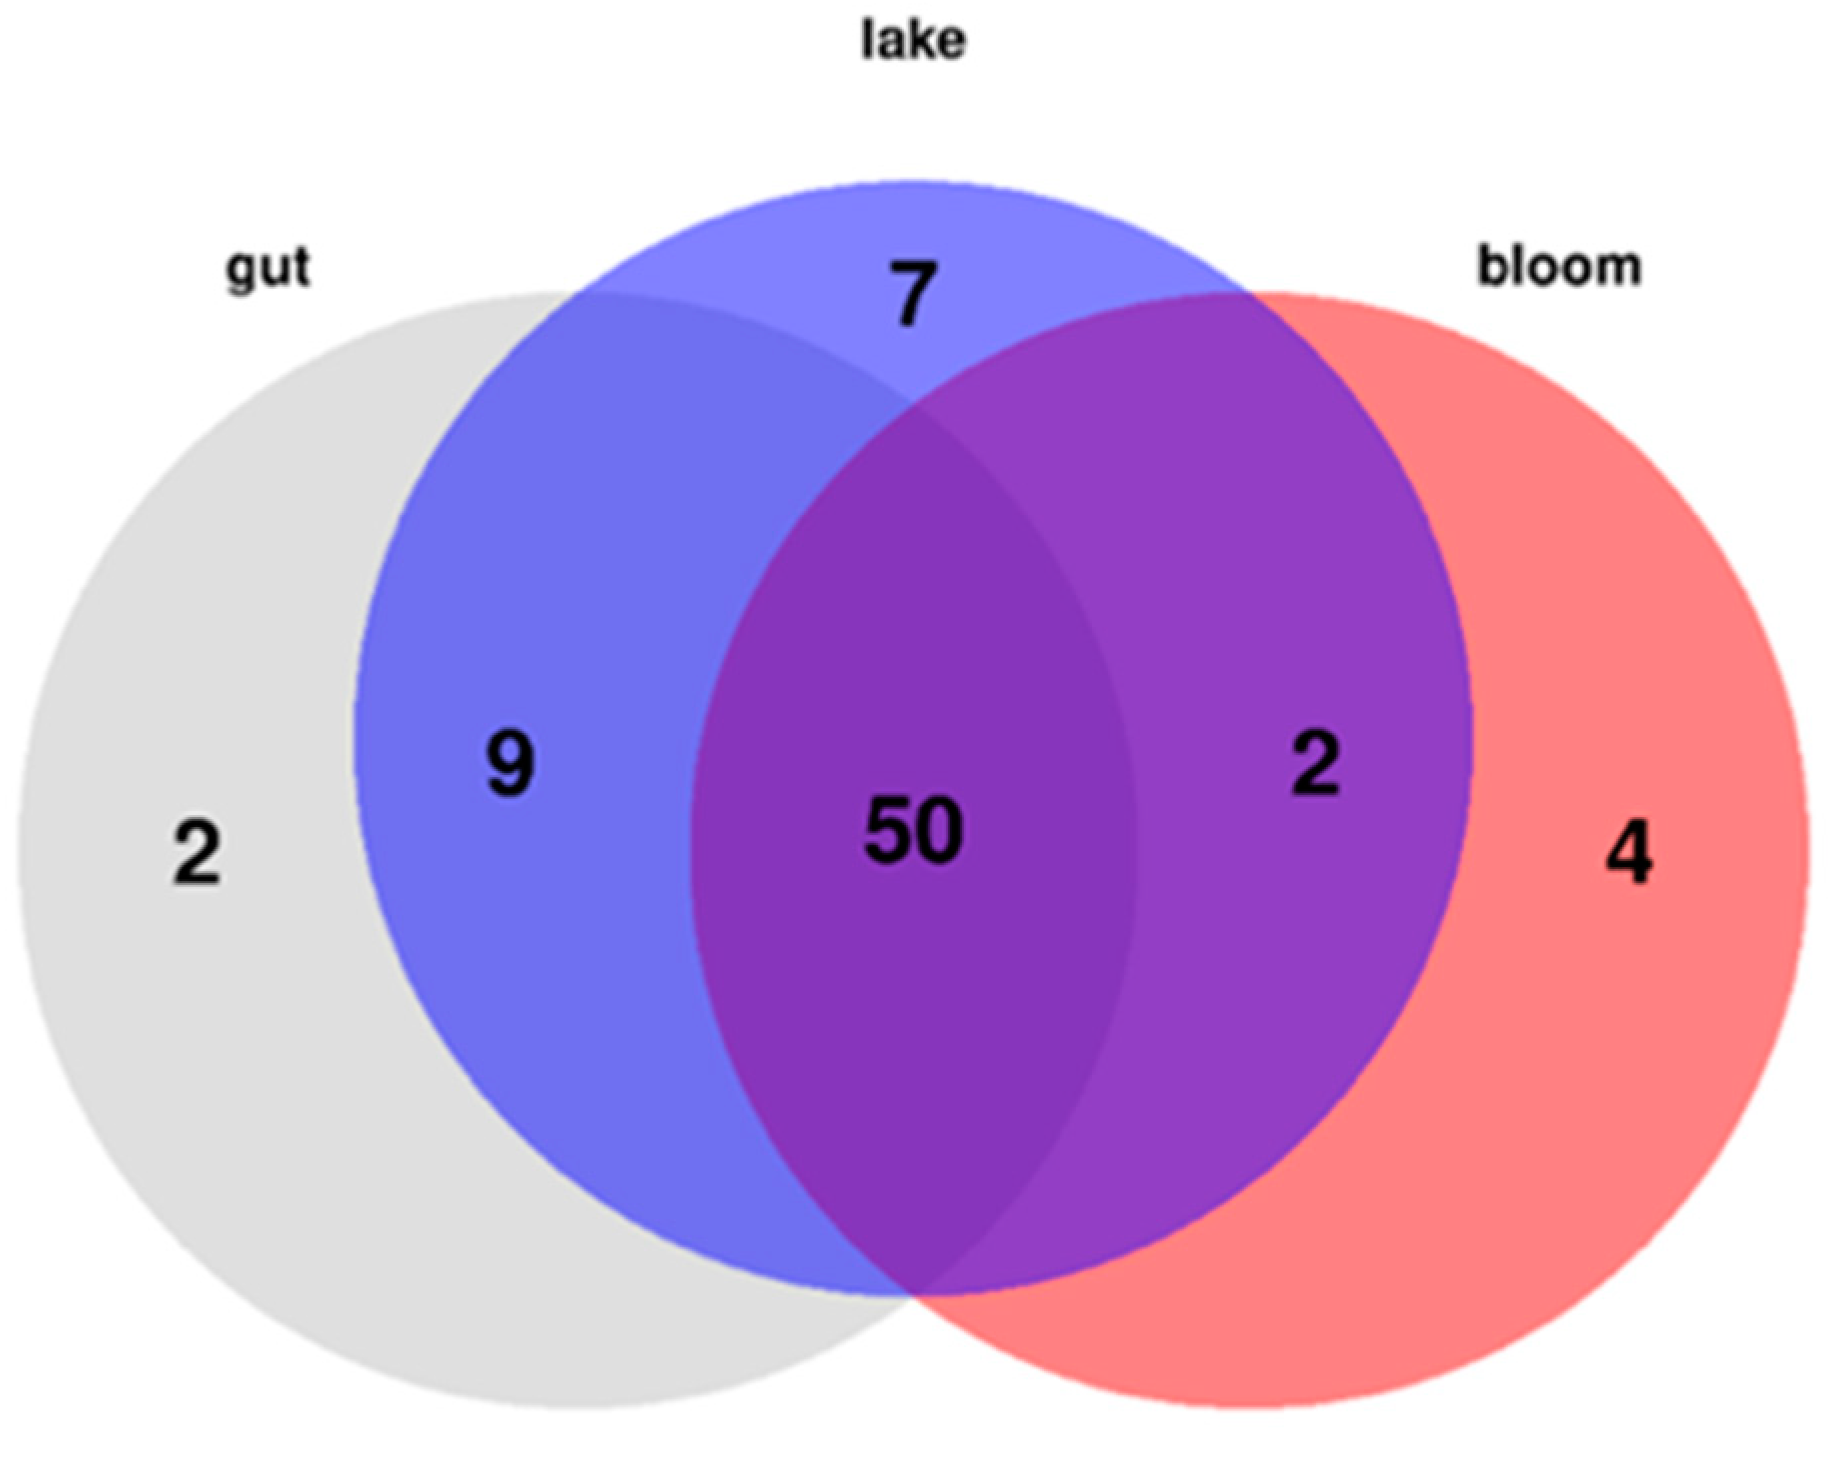
While the traditional approaches of toxin and/or bioactive metabolite research of cyanobacteria have mainly focused on individual peptides, exploring their effects or biosynthesis, our chemotyping study with non-targeted analysis investigated the occurrence of various peptides in
Microcystis strains that originated from bloom, pelagic plankton samples, and from the gut of a notorious invasive fish species. Except for 13 peptides, all other congeners were detected from viable and cultivated chemotypes originating from bigheaded carps. This finding suggests that the alimentary tract of bigheaded carps is not only a special habitat, but also a supplier for strains that represent the pelagic chemotypes and can initiate blooms in the waterbody. This potentially malicious feature can come from the ability of this fish species to filter plankton efficiently, but a few organisms such as the peptide-producing mucilaginous enveloped cyanobacterial species
M. flos-aquae are digested improperly or not at all in the digestive system. In addition, several studies have noted that the toxicity of cyanobacteria remained unaffected or even increased after defecation. Kolmakov et al. [
103] demonstrated that the physiology of the investigated cyanobacterial species were not suppressed by passing through fish intestines, but rather enhanced when they returned to the water. Kolar et al. [
35] also noted that some
Microcystis cells were not eliminated by the digestive processes of fish species. Lewin et al. [
46] suspected that
Microcystis could survive, and even use the phosphorus in fish guts as nutrients [
46].
Wide time interval evacuation rates have been estimated for silver carp at different water temperatures [
104]. This is why it is not easy to calculate the retention of viable
Microcystis cells in the gut. Although it is worth raising the opportunity that bigheaded carps carrying cyanobacterial chemotypes in their guts from one habitat can invade new areas, and that the viable cyanobacterial cells may be released by defecation from fish [
32,
33].
In our chemotyping study, Microcystis strains isolated from the invasive non-native bigheaded carps and their peptide patterns were compared to pelagic and bloom material strains. Our results draw attention to the fact that bigheaded carps not only carry and spread viable, mucilaginous envelope-covered Microcystis cells from their alimentary tracts, but harmful cyanobacterial strains can also be found among them according to the chemotypes.

 ,
, 


 ; hindgut content of bigheaded carp:
  ; and collected bloom samples:
  . (b): Relative abundance of peptide families (microginins: red; anabaenopeptins: green; microcystins: blue; unidentified peptides: magenta) at the sampling sites: Pelagic plankton samples:
  ; hindgut content of bigheaded carp:
  , and collected bloom samples:
  .
.
