Global Mycotoxin Occurrence in Feed: A Ten-Year Survey


BIOMIN Research Center, Technopark 1, 3430 Tulln, Austria
*
Author to whom correspondence should be addressed.
†
These authors contributed equally to this work.
Toxins 2019, 11(7), 375; https://0-doi-org.brum.beds.ac.uk/10.3390/toxins11070375
Submission received: 5 June 2019
/
Revised: 24 June 2019
/
Accepted: 25 June 2019
/
Published: 27 June 2019
(This article belongs to the Special Issue Fungal Infestations in Humans, Animals, Crops)
Abstract
:Mycotoxins contaminating animal feed can exert toxic effects in animals and be transferred into animal products. Therefore, mycotoxin occurrence in feed should be monitored. To this end, we performed a large-scale global survey of mycotoxin contamination in feed and assessed regional differences and year-to-year variation of mycotoxin occurrence. Concentrations of aflatoxin B1, zearalenone, fumonisins, ochratoxin A, deoxynivalenol, and T-2 toxin were analyzed in 74,821 samples of feed and feed raw materials (e.g., maize, wheat, soybean) collected from 100 countries from 2008 to 2017. In total, 88% of the samples were contaminated with at least one mycotoxin. Mycotoxin occurrence showed distinct regional trends and climate was a key determinant governing these trends. In most regions, the majority of samples complied with maximum levels and guidance values for mycotoxins in animal feed that are in effect in the European Union. However, 41.1%, 38.5%, and 20.9% of samples from South Asia, Sub-Saharan Africa, and Southeast Asia, respectively, exceeded the maximum level for aflatoxin B1 (20 µg/kg). In several regions, mycotoxin concentrations in maize showed a pronounced year-to-year variation that could be explained by rainfall or temperature during sensitive periods of grain development. A large fraction of samples (64%) was co-contaminated with ≥ 2 mycotoxins. Most frequently observed mycotoxin mixtures were combinations of deoxynivalenol, zearalenone, and fumonisins, as well as fumonisins and aflatoxin B1. Deoxynivalenol and zearalenone concentrations were correlated in maize and wheat. In conclusion, according to an extensive global survey, mycotoxin (co-)contamination of animal feed is common, shows regional trends, and is governed in part by climate and weather.
Key Contribution: An extensive global survey indicated that mycotoxin contamination and co-contamination of animal feed is common and shows regional trends governed in part by climate and weather. Potentially unsafe concentrations of aflatoxin B1 were frequently detected in feed from South Asia, Sub-Saharan Africa, and Southeast Asia.
1. Introduction
Mycotoxins are toxic fungal secondary metabolites frequently found as contaminants of food and feed. Mycotoxigenic fungi infest crop plants in the field or agricultural commodities during storage. The most common mycotoxins are aflatoxins (e.g., aflatoxin B1; AFB1), fumonisins, zearalenone (ZEN), type B trichothecenes (e.g., deoxynivalenol; DON), type A trichothecenes (e.g., T-2 toxin; T-2), and ochratoxin A (OTA). These mycotoxins are known to exert toxic effects in farm animals, causing distress and reduced productivity [1]. Furthermore, some mycotoxins may carryover in livestock products, such as meat, eggs, and milk [2], thereby compromising the safety of human consumers. To prevent negative effects on animals and consumers, many countries regulate mycotoxin concentrations in feed. In the European Union (EU), for example, maximum levels are enforced for AFB1 [3] and guidance values have been stipulated for fumonisins, ZEN, DON, and OTA [4]. Mycotoxin concentrations in feed should be continuously monitored to support risk assessment.
Multiple factors determine the contamination of agricultural commodities with mycotoxins. Mycotoxin occurrence varies between crops, as fungal species and strains differ in their ability to infest a particular host, and it varies between varieties of the same plant species, as varieties show different levels of susceptibility or resistance to fungal infestation. Furthermore, environmental conditions, such as temperature and humidity, affect the infestation of crop plants with mycotoxigenic fungi and mycotoxin production by these fungi and, therefore, climate and weather are strong determinants of mycotoxin contamination [5]. Moreover, agricultural practices, timing of harvest, and post-harvest handling of crops affect mycotoxin formation [6].
Crops may be infested with multiple strains of mycotoxigenic fungi and most fungal strains produce more than one type of mycotoxin. Therefore, co-contamination of agricultural commodities with multiple mycotoxins is frequently observed [7]. When feed raw materials are mixed to produce compound feed, mycotoxin co-contamination becomes even more likely. If mycotoxins co-occur, their combined toxic effect may be additive, synergistic, or antagonistic, i.e., equal to, greater than, or lower than the summed effects of the individual mycotoxins [8,9]. Scientific interest in biological effects of mycotoxin mixtures has been increasing in recent years, but knowledge on this topic is still scarce. Monitoring mycotoxin co-occurrence enables identifying the most prevalent mycotoxin mixtures and, thus, can help to prioritize research efforts.
Since 2004, BIOMIN has been conducting a global survey program to monitor mycotoxin contamination of animal feed. Studies on these data have been published previously [10,11,12,13,14]. In the study presented here, we analyzed global occurrence and co-occurrence of AFB1, fumonisins, ZEN DON, OTA, and T-2 in 74,821 samples of finished feed and feed raw materials such as maize, wheat, barley, and soybean collected from 100 countries during a 10-year period. We compared mycotoxin occurrence in 15 geographic regions covering most of the globe and analyzed the year-to-year variation of mycotoxin concentrations in finished feed and maize from each region. To investigate the effect of weather on mycotoxin occurrence, we compared historical weather data from maize growing areas to year-to-year variation of mycotoxin concentrations in maize. This is, to the best of our knowledge, the largest dataset of mycotoxin concentrations in feed and the most comprehensive assessment of regional trends of mycotoxin occurrence published to date.
2. Results
2.1. Global Mycotoxin Occurrence
In total, 74,821 samples collected from 100 countries were analyzed for AFB1, fumonisins, ZEN DON, OTA, and T-2. Of the samples tested for ≥ 3 mycotoxins, 88% were contaminated with at least one mycotoxin. The Fusarium mycotoxins DON, fumonisins, and ZEN were most prevalent and were detected in 64%, 60%, and 45% of all samples, respectively (Table 1). AFB1, T-2, and OTA were detected in 23%, 19%, and 15% of the samples, respectively (Table 1). Fumonisins and DON showed the highest median concentrations, namely 723 µg/kg and 388 µg/kg, respectively (Table 1).
We compared global mycotoxin occurrence in different commodities, including finished feed, maize, maize dried distillers grains with solubles (DDGS), maize silage, soybean grains, soybean meal, wheat, barley, and rice. Mycotoxin occurrence differed between these commodities. Finished feed was among the commodities showing the highest percentage of positive samples for every mycotoxin analyzed (Table 1). In maize, fumonisins showed a higher prevalence (80% positive samples) and higher median value (1300 µg/kg) than in any other commodity (Table 1). Maize furthermore showed a high prevalence of DON (67% positive samples), ZEN (44% positive samples), and AFB1 (24% positive samples). Similar to maize, maize DDGS showed a high prevalence of fumonisins (78% positive samples), DON (83% positive samples), and ZEN (75% positive samples). Median concentrations of DON (1490 µg/kg) and AFB1 (11 µg/kg) were higher in maize DDGS than in maize or any other commodity analyzed in this survey (Table 1). Furthermore, the prevalence of OTA (22% positive samples) was higher in maize DDGS than in most of the other commodities (Table 1). As in maize, fumonisins, ZEN, and DON were the most frequently detected mycotoxins in maize silage. However, the prevalence and median concentration of fumonisins were markedly lower in maize silage than in maize (Table 1). In both soybean grains and soybean meal, ZEN was the most prevalent mycotoxin, detected in 36% and 61% of samples, respectively (Table 1). Furthermore, DON, AFB1, and T-2 were detected in 29%, 20%, and 18% of soybean grain samples and in 31%, 29%, and 33% of soybean meal samples, respectively. In wheat and barley, DON (65% and 61%, respectively), T-2 (22% and 22%, respectively), and ZEN (33% and 20%, respectively) were the most frequently detected mycotoxins (Table 1). Rice showed a higher percentage of samples contaminated with AFB1 (31%) than any other commodity (Table 1). Furthermore, 34% and 27% of rice samples were contaminated with ZEN and DON, respectively.
2.2. Regional Mycotoxin Occurrence
To elucidate regional trends of mycotoxin occurrence we broke down the global dataset into datasets of 15 geographic regions (i.e., Northern Europe, Central Europe, Southern Europe, Eastern Europe, North America, Central America, South America, Middle East/North Africa, Sub-Saharan Africa, South Africa, Oceania, South Asia, East Asia, Southeast Asia, and Central Asia). For each of these regions, prevalence and median concentrations of AFB1, fumonisins, ZEN, DON, OTA, and T-2 are shown in Figure 1. For risk assessment, the percentages of samples exceeding EU regulatory limits or guidance values for mycotoxins in feed are shown in Table 2. Many countries enforce legal limits for mycotoxins in feed that differ from the EU limits. However, to allow a comparison between regions, samples from all regions were compared to EU limits in this study.
The year-to-year variation of mycotoxin concentrations in maize and finished feed samples collected from different regions is shown in Figure 2 and Figure 3. For Central America, Sub-Saharan Africa, Central Asia, and Oceania, year-to-year variation of mycotoxin concentrations in maize and finished feed was not investigated, as lower sample numbers did not allow this analysis. The results for each region are described in detail in the following sections.
2.2.1. Northern Europe
Trichothecenes were prevalent in samples collected from Northern Europe (Figure 1). DON was detected in 74.2% of the samples and T-2 was detected in 30.3% of the samples. T-2 showed a median concentration of 34 µg/kg, which was the highest median concentration obtained for any region. Furthermore, a relatively high median concentration of 504 µg/kg was detected for DON and 21.5% of samples did not comply with the lowest EU guidance value for DON, stipulated for the most sensitive animal species (Table 2). Just 1.0% of the samples did not comply with the highest EU guidance value for DON, stipulated for the most tolerant animal species.
2.2.2. Central Europe
In Central European samples, trichothecenes were prevalent (Figure 1). In total, 69.8% and 30.7% of the samples were found to be contaminated with DON and T-2, respectively. DON reached a relatively high median level of 428 µg/kg. Furthermore, ZEN and fumonisins were detected in 45.0% and 43.2% of the samples, respectively. The lowest EU guidance values for DON and ZEN were exceeded by 20.4% and 13.0% of the samples, respectively (Table 2). Just 0.9% and 0.4% of the samples did not comply with the highest EU guidance values for DON and ZEN, respectively. In maize, mean concentrations of DON and ZEN were significantly higher in 2014 than in the other years (Figure 2).
2.2.3. Southern Europe
Fumonisins were the most prevalent mycotoxins in samples from Southern Europe. They were detected in 74.9% of samples at a median concentration of 607 µg/kg. Furthermore, DON was detected in 52.9% of the samples and ZEN was detected in 36.3% of the samples. For DON and ZEN, 11.7% and 11.8% of the samples exceeded the lowest EU guidance value, with 0.5% and 0.2%, exceeding the highest EU guidance value, respectively. As in Central Europe, mean concentrations of DON and ZEN in maize peaked in 2014 (Figure 2). AFB1 was more prevalent in Southern Europe than in the other European regions (28.9% compared to 5.9–17.0% positive samples, Figure 1). Furthermore, the fractions of samples exceeding lowest and highest EU regulatory limits for AFB1 were higher in this region than in the rest of Europe (Table 2). The highest regulatory limit was exceeded in 2.1% of cases.
2.2.4. Eastern Europe
Trichothecenes were prevalent in samples from Eastern Europe (Figure 1). DON was detected in 59.9% of the samples and T-2 was detected in 48.2% of the samples and the latter was therefore more prevalent in this dataset than in datasets from any other region. Furthermore, ZEN was detected in 42.5% of the samples and OTA showed a relatively high prevalence of 36.4%.
2.2.5. North America
DON, fumonisins, and ZEN were the most prevalent mycotoxins in samples from North America, detected in 64.1%, 47.7%, and 31.7% of the samples, respectively. Compared to other regions (Figure 1), DON and ZEN showed relatively high median concentrations of 505 µg/kg and 102 µg/kg, and 19.1% and 16.8% of the samples exceeded the lowest EU guidance value, but only 0.8% and 0.6% of samples exceeded the highest EU guidance values, respectively (Table 2).
2.2.6. Central America
In samples from Central America, fumonisins were more prevalent than in samples from any other region (Figure 1). They were detected in 81.8% of samples at a relatively high median concentration of 929 µg/kg. Furthermore, DON was prevalent being detected in 70.0% of the samples and ZEN was detected in 38.2% of the samples.
2.2.7. South America
In the South American dataset, fumonisins were detected in a high fraction of samples (75.3%) at a median concentration of 1390 µg/kg. This was the highest median concentration obtained for fumonisins in any region (Figure 1). Furthermore, 8.4% of the samples exceeded the lowest EU guidance value for fumonisins, with 0.2% of the samples exceeding the highest EU guidance value (Table 2). Fumonisin concentrations in maize were particularly high in 2009 and tended to increase between 2012 and 2017 (Figure 2). ZEN was detected in 46.9% of samples. T-2 was detected in 21.5% of samples at a relatively high median concentration of 31 µg/kg.
2.2.8. Middle East/North Africa
In samples from Middle East and North Africa, fumonisins, DON, and ZEN were the most frequently detected mycotoxins with 66.8%, 47.8%, and 44.8% positive samples, respectively (Figure 1). AFB1 concentrations in finished feed were significantly higher in 2011 than in the other years (Figure 3). However, it has to be noted that all high values obtained in 2011 were from a group of samples from Mauritius. Therefore, the high average that year is of doubtful significance for the wider region. Furthermore, the finished feed samples may have contained imported ingredients or have been affected by storage conditions and consequently, the detected AFB1 concentrations may not be representative of local crops.
2.2.9. Sub-Saharan Africa
AFB1 was detected in 76.0% of samples from Sub-Saharan Africa at a median concentration of 23 µg/kg, the highest median concentration detected in any region (Figure 1). Consequently, 59.1% of these samples exceeded the lowest EU regulatory limit for AFB1 in feed and still 38.5% of the samples did not comply with the highest EU regulatory limit of 20 µg/kg (Table 2). Fusarium mycotoxins fumonisins, ZEN, and DON were prevalent in this region as well, and detected in 72.6%, 52.2%, and 49.5% of the samples, respectively.
2.2.10. South Africa
Fusarium mycotoxins DON, fumonisins, and ZEN were the most prevalent mycotoxins in South African samples and detected in 63.2%, 62.6%, and 41.6% of samples, respectively (Figure 1). Fumonisin concentrations in maize were high and DON concentrations were low in samples from 2016 (Figure 3). This has been reported and discussed in a recent publication on a dataset of South African feed samples derived from the BIOMIN Mycotoxin Survey that overlaps with the dataset presented here [13].
2.2.11. Oceania
In samples from Oceania, DON was the most frequently detected mycotoxin, with 34.5% of positive samples (Figure 1). ZEN was detected in a comparatively low fraction of samples (21.5%), but reached a high median concentration of 105 µg/kg. Accordingly, 11.1% of samples exceeded the lowest EU guidance value for ZEN in feed (Table 2). Most samples (99.3%) complied with the highest EU guidance value.
2.2.12. South Asia
AFB1 was detected in 82.2% of samples from South Asia, which was the highest percentage of positive samples found in any region (Figure 1). Furthermore, AFB1 reached a high median concentration of 20 µg/kg. Accordingly, high fractions of samples, i.e., 61.1% and 41.1%, did not comply with the lowest and highest EU regulatory limits for AFB1 in feed, respectively (Table 2). OTA was detected in 60.4% of the samples, which was again the highest percentage of positive samples detected in any dataset. However, nearly all samples (99.6%) complied with the most stringent EU guidance value for OTA in feed. In addition to AFB1 and OTA, fumonisins were prevalent in South Asia, being detected in 69% of the samples.
2.2.13. Southeast Asia
AFB1 was prevalent in samples from Southeast Asia. It was detected in 57.4% of the samples at a median concentration of 10 µg/kg and 37.9% and 20.9% of the samples did not comply with the lowest and highest EU regulatory limits for AFB1, respectively (Table 2). AFB1 concentrations in maize were particularly high in 2008–2011 and in 2017 (Figure 3). Apart from AFB1, Fusarium mycotoxins were prevalent in the dataset from Southeast Asia. Fumonisins, ZEN, and DON were detected in 69.6%, 45.9%, and 42.5% of the samples, respectively.
2.2.14. East Asia
In samples from East Asia, DON and ZEN were more prevalent (84.8% and 58.2% positive samples, respectively) than in samples from any other region (Figure 1). Relatively high median concentrations of 418 µg/kg and 90 µg/kg were detected for DON and ZEN, respectively. In total, 20.6% and 27.3% of samples exceeded the lowest EU guidance value and 0.7% and 1.3% of samples exceeded the highest EU guidance value for DON and ZEN, respectively (Table 2). DON levels were low in 2014 relative to other years in this region (Figure 3). In addition to DON and ZEN, fumonisins were prevalent in the East Asian dataset with 60.7% of positive samples and a relatively high median concentration of 810 µg/kg (Figure 1). Fumonisin concentrations peaked in samples from 2017 (Figure 3). AFB1 was detected in a lower fraction of samples (17.1%) than in South Asia and Southeast Asia, but at a relatively high median concentration of 10 µg/kg. Accordingly, 10.2% and 6.6% of the samples exceeded the lowest and highest EU regulatory limit for AFB1 in feed, respectively. The mean concentration of AFB1 was higher in 2017 than in previous years (Figure 3).
2.2.15. Central Asia
For Central Asia, we only had a small dataset of 15 samples available. These samples did not show notable trends for prevalence or median concentrations of mycotoxins (Figure 1). The limited dataset did not allow more detailed analyses as performed for the other regions.
2.3. Co-Occurrence of Mycotoxins
In total, 64% of all samples tested for ≥ 3 mycotoxins were found to contain ≥ 2 mycotoxins. To analyze the co-occurrence of mycotoxins in different commodities, we calculated the fraction of samples contaminated with either combination of two mycotoxins for finished feed, maize, and wheat. In case of finished feed, combinations of DON, fumonisins, and ZEN were most frequently observed (Table 3). DON and ZEN, DON and fumonisins, and ZEN and fumonisins co-occurred in 48%, 48%, and 43% of the samples, respectively. In maize, the same mycotoxin combinations were most prevalent (Table 3). Co-occurrence of DON and ZEN, DON and fumonisins, and ZEN and fumonisins was detected in 39%, 49%, and 37% of the samples, respectively. Furthermore, AFB1 and fumonisins co-occurred in 22% and 24% of finished feed and maize samples, respectively. In wheat, DON and ZEN was the most frequently observed combination, detected in 28% of the samples (Table 3).
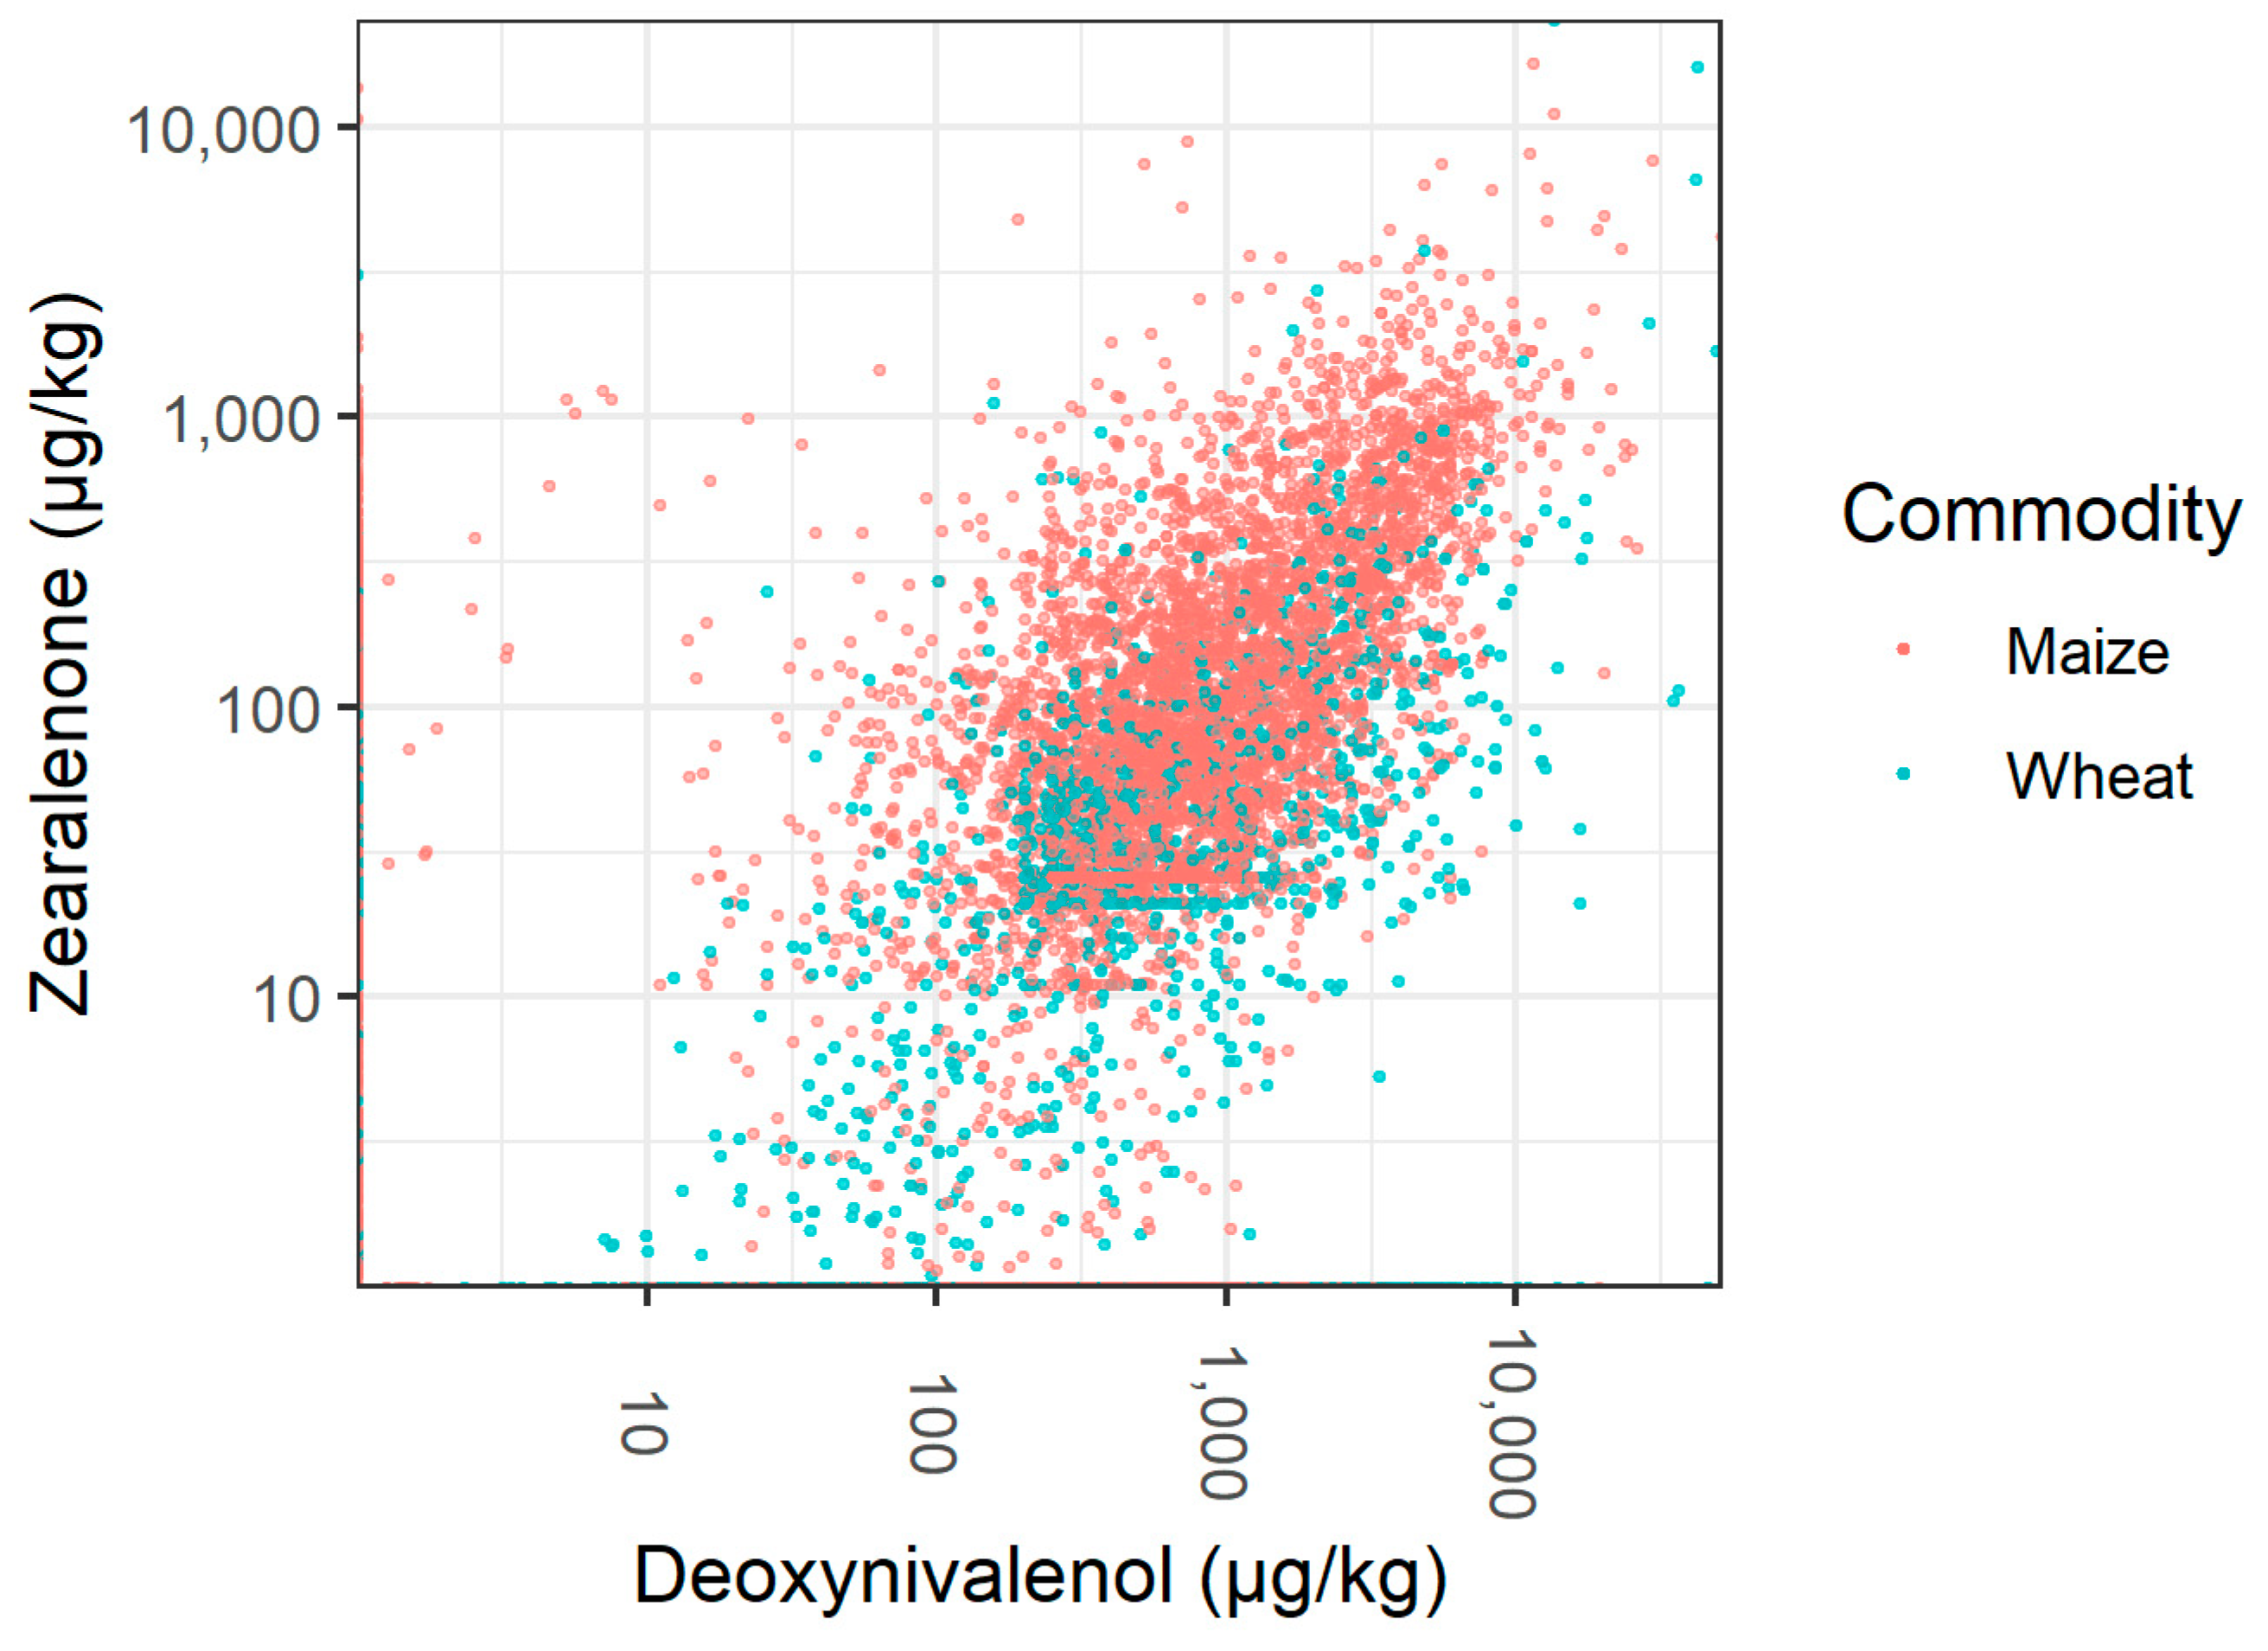
We calculated the correlation of mycotoxin concentrations for any combination of two mycotoxins in maize and wheat. Concentrations of DON and ZEN showed a positive correlation with a correlation coefficient (on log-transformed data) of 0.483 and 0.375 in maize and wheat, respectively (Figure 4). All other combinations showed correlation coefficients of ≤ 0.2.
To investigate regional trends of mycotoxin co-occurrence, we calculated for each region defined in Figure 1 the fraction of samples contaminated with either combination of two mycotoxins for finished feed, maize, and wheat. As in the global dataset, dual combinations of DON, ZEN, and fumonisins were the most frequently detected mycotoxin combinations in these commodities in most regions (data not shown). However, AFB1 and fumonisins was the most frequently detected mycotoxin combination in finished feed from Sub-Saharan Africa (89% positive samples) and Southeast Asia (62% positive samples) and in maize from Sub-Saharan Africa (60% positive samples), Southeast Asia (62% positive samples), South Asia (64% positive samples), and Oceania (29% positive samples). Furthermore, AFB1 and OTA was the most frequently detected combination in finished feed from South Asia (81% positive samples).
3. Discussion
3.1. Global Patterns of Mycotoxin Occurrence in Different Commodities
Each feed raw material showed a distinct pattern of mycotoxin occurrence (Table 1). Maize showed a particularly high prevalence and high levels of fumonisins and frequently contained DON, ZEN, and AFB1. Wheat and barley were mainly contaminated with DON and additionally contained T-2 and ZEN. Soybean and soybean meal were mainly contaminated with ZEN, DON, T-2, and AFB1. In rice, ZEN, AFB1, and DON were most frequently detected. These patterns reflect well-known associations of certain fungal species with these crop plants. For example, fumonisin producer F. verticillioides is a known pathogen of maize [15] and DON and ZEN producers F. culmorum and F. graminearum infest assorted cereal species, including maize, wheat, barley, and rice [16].
Compared to the raw materials, finished feed showed a high percentage of positive samples for all mycotoxins (Table 1). This is not surprising, since finished feed is a blend of different commodities and therefore can be expected to contain a blend of mycotoxins occurring in these commodities. For example, maize and maize products are commonly added to finished feed as main ingredients. Consequently, both maize and finished feed showed a high prevalence of fumonisins in our survey, whereas this was not observed for other feed raw materials (Table 1).
Maize DDGS showed the highest median levels of DON and AFB1 of all commodities (Table 1). DDGS are a by-product of bioethanol production. Mycotoxins present in the starting material are enriched in DDGS [17]. For example, the DON concentration by dry weight has been reported to be three times higher in DDGS than in the initial grain [18,19]. Although the global datasets of maize and maize DDGS samples analyzed in this study are not directly comparable, as they contain samples from varying geographical regions over a 10-year period, and consequently the maize samples analyzed may not resemble the maize used as starting material for DDGS production, our results confirm higher mycotoxin concentrations in maize DDGS compared to maize grains. The notable exception in our data is for fumonisins, which are known in the literature to concentrate in DDGS at levels around three times the original grain levels [20]. The opposite pattern in our results is likely to be largely related to high sample numbers of corn grain and lack of DDGS from high-fumonisin regions of South America (see Materials and Methods).
3.2. Effects of Climate and Weather on Regional Patterns of Mycotoxin Occurrence
Prevalence and median concentrations of mycotoxins varied between regions (Figure 1). Several factors may contribute to these differences. As discussed above, susceptibility to mycotoxin contamination varies between crops and as datasets from different regions contained different proportions of samples from each commodity (Table 4) reflecting crops preferentially grown or consumed in each region, mycotoxin occurrence may vary accordingly. Furthermore, pre- and post-harvest agricultural practices that affect fungal growth and mycotoxin production may vary between regions. Importantly, regions may show different trends of mycotoxin occurrence due to differences in climatic conditions affecting mycotoxin formation during crop plant development and during the storage of crops.
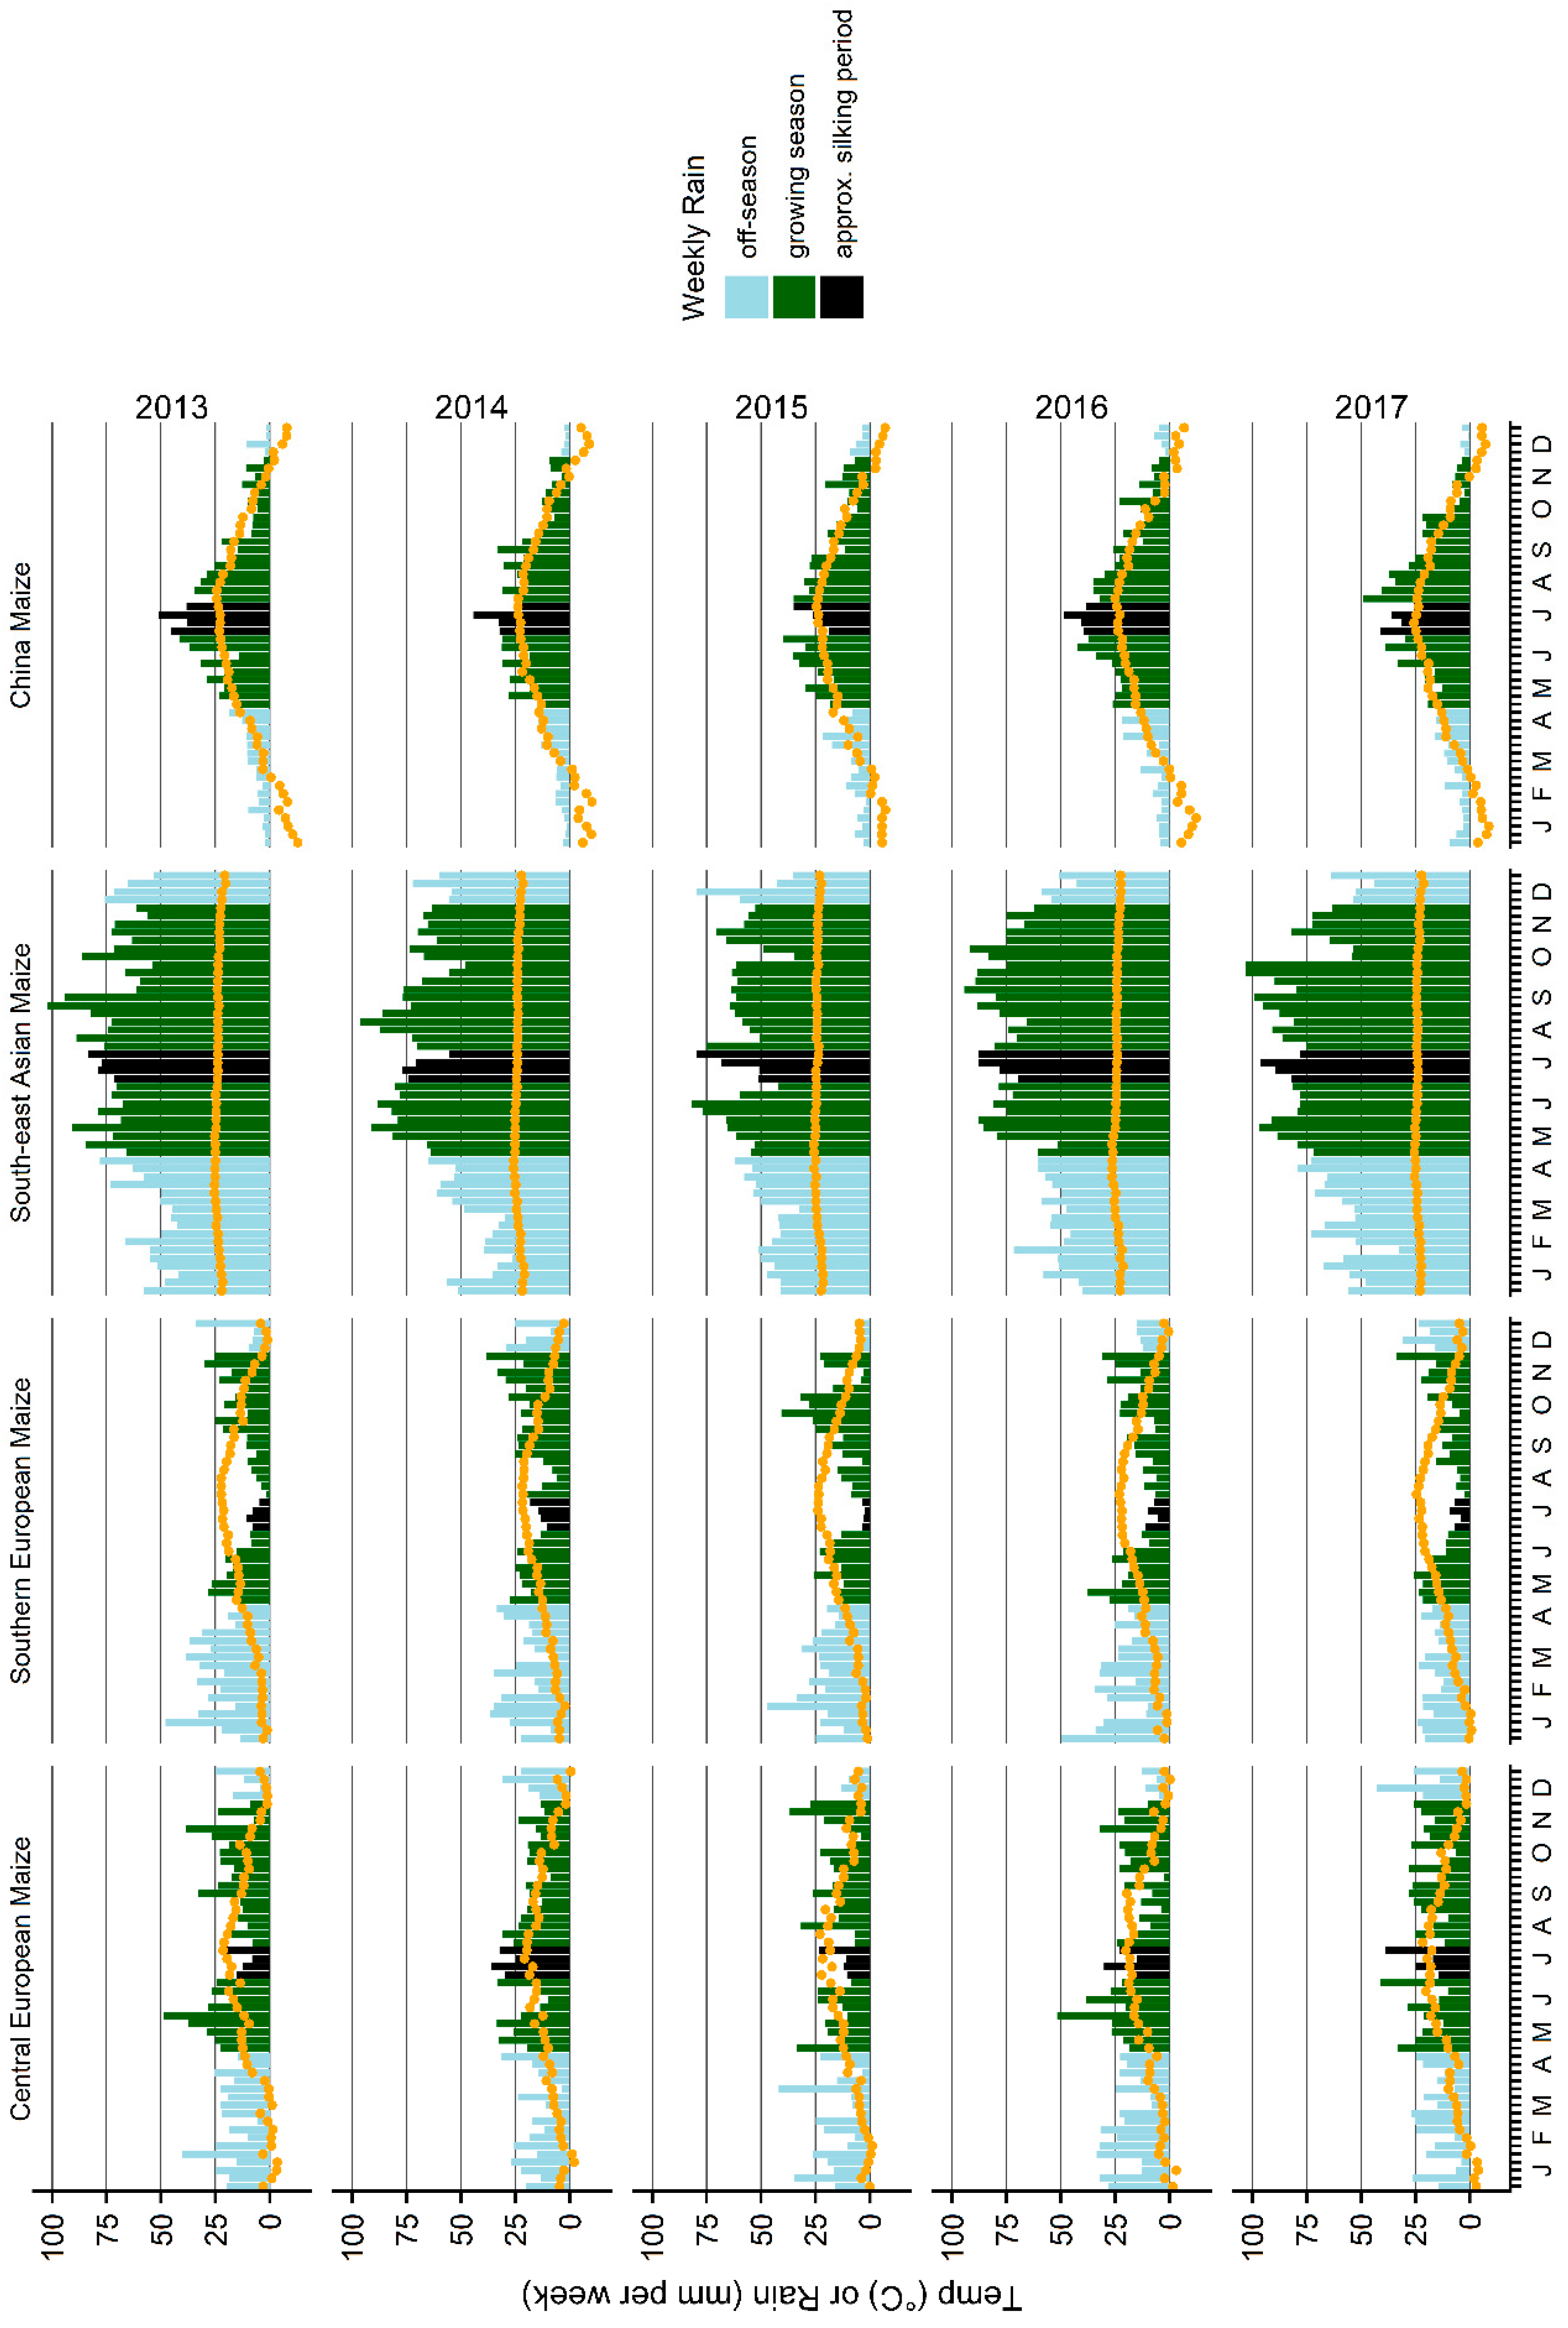
As climatic conditions are the main determinants of mycotoxin formation in crops, we discuss the impact of climate on regional occurrence of AFB1, DON, ZEN, and fumonisins in more detail in the following sections. Furthermore, we discuss the effect of weather on the year-to-year variation of mycotoxin concentrations in maize. To this end, we compare trends of mycotoxin concentrations in maize from Southeast Asia, Central Europe, Southern Europe, and East Asia (Figure 3 and Figure 4) to rainfall and temperature measured in maize growing areas in these regions in 2013–2017 (Figure 5).
3.2.1. Aflatoxin B1
In samples from Sub-Saharan Africa, Southeast Asia, and South Asia, AFB1 was prevalent and detected at high concentrations (Figure 1) often exceeding the highest EU regulatory limit for AFB1 in feed (Table 2). These data indicate that AFB1 is a significant burden for animal production in these regions. Climatic conditions in these regions (mainly tropical or sub-tropical) facilitate aflatoxin contamination of crops. On the one hand, infestation of crop plants with aflatoxigenic Aspergillus spp. and the production of aflatoxins in the growing plant is favored by drought stress, i.e., periods of high temperature and low humidity [21]. On the other hand, exposure to high temperatures and high moisture leading up to harvest [5] and during storage of crops [22] facilitates fungal growth and aflatoxin production. Either scenario is common in tropical and subtropical climates.
It can be expected that many of the AFB1-positive samples collected from Europe were imported from other parts of the world, as climatic conditions in temperate Europe generally do not favor infestation of crop plants with aflatoxigenic fungi. However, AFB1 contamination of maize grown in Southern European countries has been reported in recent years [23,24,25,26]. Hot and dry conditions necessary for Aspergillus flavus infestation of maize mainly prevail in Europe below 45° North latitude [27] and therefore in the region defined in this study as Southern Europe (Figure 1). Accordingly, in this study, prevalence of AFB1 was higher in samples from Southern Europe than in samples from the other European regions (Figure 1) and 2.1% of samples exceeded the highest EU maximum level for AFB1 in feed (Table 2). AFB1 contamination of crops in Southern Europe should continue to be monitored closely, as occasional high levels occur and this may increase in the future due to climate change [27,28].
AFB1 concentrations in maize varied from year to year in several regions (Figure 2 and Figure 3) and some of this variation could be traced back to a variation in weather conditions. In Southeast Asia, AFB1 concentrations were significantly higher in maize harvested in 2017 than in maize harvested in 2013–2016 (Figure 3). These higher AFB1 levels may reflect the relatively high rainfall in August and September 2017 leading up to harvest (Figure 5; weeks 31–39: 783.1 mm in 2017; 551.5–720.4 mm in 2013–2016). In maize from East Asia, AFB1 concentrations were significantly higher in 2017 than in previous years. This may be due to a higher temperature during the approximate silking period of maize (July) in the core Chinese maize growing areas in 2017 compared to 2013–2016 (Figure 5; mean temperature in weeks 27–30: 24.6 °C in 2017; 23.1–23.7 °C in 2013–2016). These two examples illustrate the effect of hot and humid weather conditions on AFB1 contamination levels in maize.
3.2.2. Deoxynivalenol and Zearalenone
Rainfall and mild temperatures during the flowering and maturation periods were shown to favor infestation of wheat and maize with F. graminearum and F. culmorum and DON contamination [5,29]. Accordingly, higher DON concentrations were detected in samples from the temperate regions North America, Northern Europe, Central Europe, and East Asia (Figure 1).
For several regions analyzed in this study, the year-to-year variation of concentrations of DON and ZEN (also produced by F. graminearum and F. culmorum) in maize could be correlated with rainfall. DON and ZEN concentrations were exceptionally high in maize harvested in 2014 in Central Europe (Figure 2). These peaks in DON and ZEN concentrations corresponded with higher than usual rainfall in July 2014 (Figure 5; weeks 27–30: 122.7 mm in 2014; 56.4–94.9 mm in 2013, 2015, 2016, 2017), i.e., during the main silking period of maize, ongoing relatively high rainfall in August (Figure 5; weeks 31–35: 122.0 mm in 2014; 62.6–84.6 mm in 2013, 2015, 2016, 2017), and moderate rainfall in September (Figure 5). High rainfall during the silking period could have facilitated infestation of maize plants with Fusarium spp., whereas ongoing rainfall in the lead-up to harvest would have meant an extended period of suitable grain moisture levels for continued fungal growth and mycotoxin production within the grain. Same as in Central Europe, DON and ZEN showed relatively high levels in Southern European maize harvested in 2014 (Figure 2), which also coincided with heavier than usual rainfall in July (Figure 5; weeks 27–30: 56.0 mm in 2014; 11.8–33.3 mm in 2013, 2015, 2016, 2017) and August (Figure 5; weeks 31–35: 60.6 mm in 2014; 29.8–47.4 mm in 2013, 2015, 2016, 2017). In East Asian maize, DON and ZEN levels were relatively low in maize harvested in 2013 (Figure 3), which may reflect the relatively lower levels of rainfall in August and September (leading up to harvest) that year in the core Chinese maize growing areas compared to the following years (Figure 5; weeks 31–39: 210.3 mm in 2013; 215.1–270.6 mm in 2014–2017). Overall, these observations confirm a key impact of rainfall on DON and ZEN contamination levels in maize.
3.2.3. Fumonisins
Infestation of maize with F. verticillioides and consequent fumonisin contamination is facilitated by high temperatures and low precipitation around silking [30,31,32,33]. It is therefore not surprising that regions with a hot climate such as South America, Central America or Sub-Saharan Africa showed particularly high levels of contamination in this survey (Figure 1). Furthermore, in the case of Europe, highest median concentrations were detected in Southern Europe (Figure 1), the warmest and driest region of the continent.
Year-to-year trends of fumonisin concentrations in maize could be correlated with patterns observed in weather data. In Central Europe, fumonisin concentrations peaked in maize harvested in 2015 (Figure 2). This could be related to warmer temperatures in July (during silking) and August (in the lead-up to harvest) that year than observed in other years (Figure 5; mean temperature in weeks 27–30: 19.8 °C in 2015; 18.2–19.2 °C in 2013, 2014, 2016, 2017; mean temperature in weeks 31–35: 19.8 °C in 2015; 16.7–18.7 °C in 2013, 2014, 2016, 2017). Furthermore, the amount of rainfall in July (weeks 27–30) was lower in 2015 (56.4 mm) than in the other years (58.7–122.7 mm). A peak in fumonisin concentration observed in East Asian maize harvested in 2017 could be associated with relatively high temperatures in the core Chinese maize growing areas in July of that year (Figure 5; mean temperature in weeks 27–30: 24.6 °C in 2017; 23.1–23.7 °C in 2013–2016). In this case, the amount of rainfall was average compared to 2013–2016 (Figure 5; weeks 27–30: 134.3 mm in 2017; 102.3–172.7 mm in 2013–2016). In summary, fumonisin concentration peaks in Central European and East Asian maize could be related to high temperatures during the silking period.
3.3. Co-Occurrence of Mycotoxins
Mycotoxin co-occurrence was frequently observed with ≥ 2 mycotoxins detected in 64% of all samples tested for ≥ 3 mycotoxins. Risk assessment and regulation usually target single mycotoxins, not mycotoxin mixtures. However, the results of this study indicate that mycotoxin co-contamination of feed and consequently, mycotoxin co-exposure of animals, is the rule rather than the exception. Therefore, it is important to consider the combined toxic effects of mycotoxins.
Most frequently observed mycotoxin combinations in finished feed, maize, and wheat were combinations of Fusarium mycotoxins DON, ZEN, and fumonisins (Table 3). Furthermore, DON and ZEN concentrations showed a positive correlation in maize and wheat (Figure 4). As DON and ZEN are both produced by the same fungal species, i.e., F. graminearum and F. culmorum, a correlation of their concentrations in agricultural commodities is not surprising. In published studies investigating the combined effect of DON and ZEN in animals, additive, synergistic, and antagonistic effects have been observed. The type of interaction may vary with the investigated parameter, the animal species, age, sex, or nutritional status of the animals, administered mycotoxin dose, as well as duration and route of mycotoxin administration [8]. Additive or synergistic effects of DON and ZEN were reported for parameters of immune function in mice and pigs [34,35,36], parameters of liver health and antioxidant function in mice and rats [37,38], and parameters of oxidative stress in the spleen [36], brain [39], and kidneys [40] of mice. Antagonistic effects were reported for parameters of immune function in pigs [35] and parameters of liver health [37] and liver metabolism [41] in mice. Mixtures of fumonisins and DON or fumonisins and ZEN have also been shown to exert different types of combined effects in animals or in vitro, including additive and synergistic effects [8,9].
AFB1 and fumonisins frequently co-occurred in maize and finished feed from Sub-Saharan Africa, Southeast Asia, and South Asia. As for the mycotoxin combinations discussed above, any type of combined effect has been reported for AFB1 and fumonisins in animals. Importantly, according to the assessment by Grenier and Oswald [8], a synergistic negative effect on zootechnical parameters (e.g., body weight gain, feed conversion, egg weight) has been observed in several animal species including pigs [42,43], chickens [44,45], quail [46], and rabbits [47]. Furthermore, AFB1 and fumonisins have been shown to induce liver lesions in an additive or synergistic manner (e.g., [47,48,49]), and, when administered sequentially, fumonisins promoted liver cancer initiated by AFB1 in rats [50,51] and trout [52].
In summary, published studies on the effects of mycotoxin combinations detected frequently in this survey suggest a stronger toxic effect of the mixtures compared to each individual mycotoxin. Mycotoxin dosage and mode of administration varied between studies and, in many cases, the mycotoxin challenge applied may not be comparable to dietary exposure to mycotoxin concentrations reported here. The high prevalence of mixtures containing DON, ZEN, and fumonisins or AFB1 and fumonisins in feed necessitates further investigation of combined effects of these mycotoxins in animals, especially for dietary exposure to concentrations commonly detected in feed. Such studies would be important to clarify if there is a need for regulation of mycotoxin mixtures in animal feed.
4. Conclusions
In conclusion, analysis of 74,821 samples collected from 100 countries indicated that mycotoxins are almost ubiquitously present in feed. Each feed raw material showed a distinct pattern of mycotoxin contamination according to well-known associations of certain fungal pathogens with certain plant hosts. As a blend of raw materials, finished feed showed a comparatively high prevalence of all mycotoxins.
Governed by climate as one key determinant, each region showed a distinct mycotoxin occurrence pattern and, therefore, faces its own challenges with respect to mycotoxin contamination of feed. Mycotoxin concentrations mostly complied with EU regulatory limits and guidance values stipulated for the most resistant animal species. However, as a notable exception, large fractions of samples from Sub-Saharan Africa, Southeast Asia, and South Asia were contaminated with high AFB1 concentrations exceeding the EU maximum level for the most resistant species, indicating a threat for animal and human health.
Mycotoxin contamination levels in maize from each region varied from year to year and weather conditions (i.e., rainfall and temperature) during sensitive periods of flowering and grain development were found to explain some of this variation. Our data suggest that extreme weather conditions during these periods may cause mycotoxin contamination levels far in excess of concentrations typically observed in a given region, as exemplified by a sudden increase in DON and ZEN concentrations in Central European and Southern European maize in 2014 that coincided with high rainfall in July and August of that year.
Results of this survey indicate that co-occurrence of mycotoxins is the rule rather than the exception. Consequently, the toxicological effect of frequently detected mycotoxin mixtures (most importantly combinations of DON, ZEN, and fumonisins, as well as, in some regions, the combination of fumonisins and AFB1) should be investigated more closely, especially with respect to dietary exposure to concentrations commonly detected in feed.
5. Materials and Methods
5.1. Collection of Feed Samples
In total, 74,821 feed samples were collected from 100 countries from January 2008–December 2017. The countries were classified into 15 regions: Northern Europe (Denmark, Finland, Iceland, Ireland, Latvia, Lithuania, Norway, Sweden, United Kingdom); Central Europe (Austria, Belgium, Czech Republic, France, Germany, Hungary, Moldova, Poland, Romania, Slovakia, Slovenia, Switzerland, The Netherlands); Southern Europe (Bosnia and Herzegovina, Bulgaria, Croatia, Cyprus, Greece, Italy, Portugal, Serbia, Spain, Turkey); Eastern Europe (Belarus, Russia, Ukraine); North America (Canada, USA); Central America (Costa Rica, Cuba, Dominican Republic, Guatemala, Honduras, Mexico, Nicaragua, Panama); South America (Argentina, Bolivia, Brazil, Chile, Colombia, Ecuador, Paraguay, Peru, Uruguay); Middle East/North Africa (Algeria, Egypt, Iran, Israel, Jordan, Kuwait, Lebanon, Mauritania, Morocco, Saudi Arabia, Sudan, Syria, Tunisia, UAE, Yemen); Sub-Saharan Africa (Ghana, Ivory Coast, Kenya, Madagascar, Namibia, Nigeria, Senegal, Tanzania, Uganda, Zambia); South Africa (South Africa); Oceania (Australia, New Zealand); South Asia (Bangladesh, India, Nepal, Pakistan, Sri Lanka); Southeast Asia (Indonesia, Laos, Malaysia, Myanmar, Philippines, Singapore, Thailand, Vietnam); East Asia (China, Japan, Korea, Taiwan); and Central Asia (Kazakhstan). Sample numbers per commodity and region are given in Table 4.
Sampling, milling of samples, and homogenization of samples was performed as described previously [14]. Paper bags or bags with ventilation were used as sample containers to avoid humidity build-up. Samples that showed a high moisture content were dried. Samples were immediately sent to the laboratory for analysis.
5.2. Mycotoxin Analysis
Mycotoxin concentrations were analyzed using the methods specified in Table 5.
For ZEN, DON, fumonisin B1, fumonisin B2, fumonisin B3, OTA, and T-2, the threshold of relevant concentration was defined as either > 1.0 µg/kg or > limit of detection, whichever was higher. For AFB1, the threshold of relevant concentration was defined as either > 0.5 µg/kg or > limit of detection, whichever was higher. Correlations between mycotoxin concentrations were analyzed using ggpairs in the ggally package [53] in R software, version 3.3.0 [54]. For this analysis, results below the limit of detection were treated as zero values. Timeline graphs were constructed using ggplot2 package [55] and data was summarized with the dplyr package [56].
5.3. Analysis of Weather Data
Gridded weather data from 2013, 2014, 2015, 2016, and 2017 was accessed from the Cleaned Observations dataset of The Weather Company (IBM) calculated by The Weather Company algorithms and summarized as weekly total rainfall and weekly mean temperature for the world regions. Weather data for four of the regions was visually analyzed for patterns coincident with annual changes in mycotoxin concentrations. The weather data is displayed in Figure 5.
Central European weather data included 51 grid locations from Austria, 21 from Belgium, 50 from Czech Republic, 328 from France, 250 from Germany, 49 from Hungary, one from Luxemburg, 31 from the Netherlands, 223 from Poland, 135 from Romania, 32 from Slovakia, 11 from Slovenia, and 23 from Switzerland.
Southern European gridded weather locations included 16 from Albania, 28 from Bosnia and Herzegovina, 57 from Bulgaria, 37 from Croatia, eight from Cyprus, 107 from Greece, 228 from Italy, four from Kosovo, 12 from Macedonia, one from Malta, one from Monaco, seven from Montenegro, 50 from Portugal, 38 from Serbia, 263 from Spain, and 366 from Turkey.
Southeast Asian weather data was based on two gridded locations from Brunei, 51 from Cambodia, one from Christmas Island, one from Cocos (Keeling) Islands, six from East Timor, 773 from Indonesia, 68 from Laos, 105 from Malaysia, 234 from Myanmar (Burma), two from Palau, 180 from Papua New Guinea, 172 from the Philippines, 154 from Thailand, and 108 from Vietnam.
East Asian weather data was based on the mainland Chinese maize growing districts with 50 grid locations from Anhui, six from Beijing, 163 from Gansu, 78 from Guangxi, 58 from Guizhou, 17 from Hainan, 87 from Hebei, 268 from Heilongjiang, 65 from Henan, 66 from Hubei, 71 from Hunan, 597 from Inner Mongolia, 50 from Jiangsu, 99 from Jilin, 76 from Liaoning, 21 from Ningsia Hui Autonomous Region, 80 from Shaanxi, 67 from Shandong, 65 from Shanxi, 203 from Sichuan, five from Tianjin, 766 from Xinjiang, and 121 from Yunnan.
Author Contributions
C.G.-D., T.J., and G.S. designed the study. T.J. analyzed the data with input from C.G.-D. and G.S.; C.G.-D., T.J., and G.S. interpreted the data. C.G.-D. wrote the manuscript and T.J. and G.S. carefully revised it.
Funding
The mycotoxin survey component of this study was supported by research funds of the government of Lower Austria and the competence center FFoQSI (Feed and Food Quality, Safety and Innovation). FFoQSI is funded by the Austrian ministries BMVIT, BMDW and the Austrian provinces Lower Austria, Upper Austria and Vienna within the scope of COMET (Competence Centers for Excellent Technologies). The program COMET is handled by the Austrian Research Promotion Agency (FFG). The relationship between weather and mycotoxins component of this study was supported by the FFG Frontrunner Initiative project no. 866384 “Omics-technologies and natural feed additives solving challenges of livestock industry in the era of digitalization”.
Acknowledgments
We thank Thomas Erhäusl for sample preparation and Michael Sulyok for performing multi-mycotoxin LC-MS/MS analysis at IFA Tulln. Special thanks go to Biofarma Feedlab (Argentina), Labocea (France), LAMIC (Brazil) and Anika Steinhoff-Ooster, Tiergesundheitsdienst Bayern e.V. (Germany) for sharing their mycotoxin analysis results.
Conflicts of Interest
The authors declare no conflict of interest. The funders had no role in the design of the study; in the collection, analyses, or interpretation of data; in the writing of the manuscript, or in the decision to publish the results.
References
- Bryden, W.L. Mycotoxin contamination of the feed supply chain: Implications for animal productivity and feed security. Anim. Feed Sci. Technol. 2012, 173, 134–158. [Google Scholar] [CrossRef]
- Becker-Algeri, T.A.; Castagnaro, D.; de Bortoli, K.; de Souza, C.; Drunkler, D.A.; Badiale-Furlong, E. Mycotoxins in bovine milk and dairy products: A review. J. Food Sci. 2016, 81, 544–552. [Google Scholar] [CrossRef] [PubMed]
- European Commission. Commission regulation (EU) No 574/2011 of 16 June 2011 amending Annex I to Directive 2002/32/EC of the European Parliament and of the Council as regards maximum levels for nitrite, melamine, Ambrosia spp. and carry-over of certain coccidiostats and histomonostats and consolidating Annexes I and II thereto. Off. J. Eur. Union 2011, L 159, 7–24. [Google Scholar]
- European Commission. Commission recommendation of 27 March 2013 on the presence of T-2 and HT-2 toxin in cereals and cereal products. Off. J. Eur. Union 2013, L 91, 12–15. [Google Scholar]
- Paterson, R.R.M.; Lima, N. How will climate change affect mycotoxins in food? Food Res. Int. 2010, 43, 1902–1914. [Google Scholar] [CrossRef] [Green Version]
- Jouany, J.P. Methods for preventing, decontaminating and minimizing the toxicity of mycotoxins in feeds. Anim. Feed Sci. Technol. 2007, 137, 342–362. [Google Scholar] [CrossRef]
- Smith, M.C.; Madec, S.; Coton, E.; Hymery, N. Natural co-occurrence of mycotoxins in foods and feeds and their in vitro combined toxicological effects. Toxins 2016, 8, 94. [Google Scholar] [CrossRef] [PubMed]
- Grenier, B.; Oswald, I.P. Mycotoxin co-contamination of food and feed: Meta-analysis of publications describing toxicological interactions. World Mycotoxin J. 2011, 4, 285–313. [Google Scholar] [CrossRef]
- Alassane-Kpembi, I.; Schatzmayr, G.; Taranu, I.; Marin, D.; Puel, O.; Oswald, I.P. Mycotoxins co-contamination: Methodological aspects and biological relevance of combined toxicity studies. Crit. Rev. Food Sci. Nutr. 2017, 57, 3489–3507. [Google Scholar] [CrossRef] [PubMed]
- Streit, E.; Naehrer, K.; Rodrigues, I.; Schatzmayr, G. Mycotoxin occurrence in feed and feed raw materials worldwide: long-term analysis with special focus on Europe and Asia. J. Sci. Food Agric. 2013, 93, 2892–2899. [Google Scholar] [CrossRef] [PubMed]
- Streit, E.; Schwab, C.; Sulyok, M.; Naehrer, K.; Krska, R.; Schatzmayr, G. Multi-mycotoxin screening reveals the occurrence of 139 different secondary metabolites in feed and feed ingredients. Toxins 2013, 5, 504–523. [Google Scholar] [CrossRef] [PubMed]
- Schatzmayr, G.; Streit, E. Global occurrence of mycotoxins in the food and feed chain: Facts and figures. World Mycotoxin J. 2013, 6, 213–222. [Google Scholar] [CrossRef]
- Gruber-Dorninger, C.; Jenkins, T.; Schatzmayr, G. Multi-mycotoxin screening of feed and feed raw materials from Africa. World Mycotoxin J. 2018, 11, 369–383. [Google Scholar] [CrossRef]
- Kovalsky, P.; Kos, G.; Nahrer, K.; Schwab, C.; Jenkins, T.; Schatzmayr, G.; Sulyok, M.; Krska, R. Co-occurrence of regulated, masked and emerging mycotoxins and secondary metabolites in finished feed and maize-an extensive survey. Toxins 2016, 8, 363. [Google Scholar] [CrossRef] [PubMed]
- Blacutt, A.A.; Gold, S.E.; Voss, K.A.; Gao, M.; Glenn, A.E. Fusarium verticillioides: Advancements in understanding the toxicity, virulence, and niche adaptations of a model mycotoxigenic pathogen of maize. Phytopathology 2018, 108, 312–326. [Google Scholar] [CrossRef]
- Miller, J.D. Mycotoxins in small grains and maize: Old problems, new challenges. Food Addit. Contam. Part A Chem. Anal Control Expo. Risk Assess. 2008, 25, 219–230. [Google Scholar] [CrossRef]
- Wu, F.; Munkvold, G.P. Mycotoxins in ethanol co-products: Modeling economic impacts on the livestock industry and management strategies. J. Agric. Food Chem. 2008, 56, 3900–3911. [Google Scholar] [CrossRef]
- Schaafsma, A.W.; Limay-Rios, V.; Paul, D.E.; Miller, J.D. Mycotoxins in fuel ethanol co-products derived from maize: A mass balance for deoxynivalenol. J. Sci. Food Agric. 2009, 89, 1574–1580. [Google Scholar] [CrossRef]
- Zhang, Y.; Caupert, J. Survey of mycotoxins in U.S. distiller’s dried grains with solubles from 2009 to 2011. J. Agric. Food Chem. 2012, 60, 539–543. [Google Scholar] [CrossRef]
- Bowers, E.L.; Munkvold, G.P. Fumonisins in conventional and transgenic, insect-resistant maize intended for fuel ethanol production: Implications for fermentation efficiency and DDGS co-product quality. Toxins 2014, 6, 2804–2825. [Google Scholar] [CrossRef]
- Battilani, P.; Rossi, V.; Giorni, P.; Pietri, A.; Gualla, A.; van der Fels-Klerx, H.J.; Booij, C.J.H.; Moretti, A.; Logrieco, A.; Miglietta, F.; et al. Modelling, Predicting and Mapping the Emergence of Aflatoxins in Cereals in the EU Due to Climate Change. 2012. Available online: http://www.efsa.europa.eu/en/supporting/pub/223e.htm (accessed on 27 June 2019). [CrossRef]
- Chulze, S.N. Strategies to reduce mycotoxin levels in maize during storage: A review. Food Addit. Contam. Part A Chem. Anal Control Expo. Risk Assess. 2010, 27, 651–657. [Google Scholar] [CrossRef] [PubMed]
- Kos, J.; Mastilović, J.; Janic Hajnal, E.; Šarić, B. Natural occurrence of aflatoxins in maize harvested in Serbia during 2009–2012. Food Control 2013, 34, 31–34. [Google Scholar] [CrossRef]
- Pleadin, J.; Vulić, A.; Perši, N.; Škrivanko, M.; Capek, B.; Cvetnić, Ž. Aflatoxin B1 occurrence in maize sampled from Croatian farms and feed factories during 2013. Food Control 2014, 40, 286–291. [Google Scholar] [CrossRef]
- Janic Hajnal, E.; Kos, J.; Krulj, J.; Krstovic, S.; Jajic, I.; Pezo, L.; Saric, B.; Nedeljkovic, N. Aflatoxins contamination of maize in Serbia: The impact of weather conditions in 2015. Food Addit. Contam. Part A Chem. Anal. Control Expo. Risk Assess. 2017, 34, 1999–2010. [Google Scholar] [CrossRef] [PubMed]
- Decastelli, L.; Lai, J.; Gramaglia, M.; Monaco, A.; Nachtmann, C.; Oldano, F.; Ruffier, M.; Sezian, A.; Bandirola, C. Aflatoxins occurrence in milk and feed in Northern Italy during 2004–2005. Food Control 2007, 18, 1263–1266. [Google Scholar] [CrossRef]
- Battilani, P.; Toscano, P.; Van der Fels-Klerx, H.J.; Moretti, A.; Camardo Leggieri, M.; Brera, C.; Rortais, A.; Goumperis, T.; Robinson, T. Aflatoxin B1 contamination in maize in Europe increases due to climate change. Sci. Rep. 2016, 6, 24328. [Google Scholar] [CrossRef]
- Assuncao, R.; Martins, C.; Viegas, S.; Viegas, C.; Jakobsen, L.S.; Pires, S.; Alvito, P. Climate change and the health impact of aflatoxins exposure in Portugal–an overview. Food Addit. Contam. Part A Chem. Anal. Control Expo. Risk Assess. 2018, 35, 1610–1621. [Google Scholar] [CrossRef] [PubMed]
- Van Asselt, E.D.; Booij, C.J.; van der Fels-Klerx, H.J. Modelling mycotoxin formation by Fusarium graminearum in maize in The Netherlands. Food Addit. Contam. Part A Chem. Anal. Control Expo. Risk Assess. 2012, 29, 1572–1580. [Google Scholar] [CrossRef] [PubMed]
- De la Campa, R.; Hooker, D.C.; Miller, J.D.; Schaafsma, A.W.; Hammond, B.G. Modeling effects of environment, insect damage, and Bt genotypes on fumonisin accumulation in maize in Argentina and the Philippines. Mycopathologia 2005, 159, 539–552. [Google Scholar] [CrossRef]
- Janse van Rensburg, B.; McLaren, N.W.; Flett, B.C. Grain colonization by fumonisin-producing Fusarium spp. and fumonisin synthesis in South African commercial maize in relation to prevailing weather conditions. Crop Protection 2017, 102, 129–136. [Google Scholar] [CrossRef]
- Pascale, M.; Visconti, A.; Chelkowski, J. Ear rot susceptibility and mycotoxin contamination of maize hybrids inoculated with Fusarium species under field conditions. Eur. J. of Plant Pathol. 2002, 108, 645–651. [Google Scholar] [CrossRef]
- Udovicki, B.; Djekic, I.; Stankovic, S.; Obradovic, A.; Rajkovic, A. Impact of climatic conditions on fumonisins in maize grown in Serbia. World Mycotoxin J. 2019, 12, 183–190. [Google Scholar] [CrossRef]
- Dabrowski, M.; Obremski, K.; Gajecka, M.; Gajecki, M.T.; Zielonka, L. Changes in the subpopulations of porcine peripheral blood lymphocytes induced by exposure to low doses of zearalenone (ZEN) and deoxynivalenol (DON). Molecules 2016, 21, 557. [Google Scholar] [CrossRef] [PubMed]
- Pestka, J.J.; Tai, J.H.; Witt, M.F.; Dixon, D.E.; Forsell, J.H. Suppression of immune response in the B6C3F1 mouse after dietary exposure to the Fusarium mycotoxins deoxynivalenol (vomitoxin) and zearalenone. Food Chem. Toxicol. 1987, 25, 297–304. [Google Scholar] [CrossRef]
- Ren, Z.H.; Deng, H.D.; Wang, Y.C.; Deng, J.L.; Zuo, Z.C.; Wang, Y.; Peng, X.; Cui, H.M.; Fang, J.; Yu, S.M.; et al. The Fusarium toxin zearalenone and deoxynivalenol affect murine splenic antioxidant functions, interferon levels, and T-cell subsets. Environ. Toxicol. Pharmacol. 2016, 41, 195–200. [Google Scholar] [CrossRef] [PubMed]
- Sun, L.H.; Lei, M.Y.; Zhang, N.Y.; Zhao, L.; Krumm, C.S.; Qi, D.S. Hepatotoxic effects of mycotoxin combinations in mice. Food Chem. Toxicol. 2014, 74, 289–293. [Google Scholar] [CrossRef] [PubMed]
- Szabo-Fodor, J.; Szabo, A.; Kocso, D.; Marosi, K.; Bota, B.; Kachlek, M.; Mezes, M.; Balogh, K.; Kover, G.; Nagy, I.; et al. Interaction between the three frequently co-occurring Fusarium mycotoxins in rats. J. Anim. Physiol. Anim. Nutr. 2018, 103, 370–382. [Google Scholar] [CrossRef]
- Ren, Z.H.; Deng, H.D.; Deng, Y.T.; Deng, J.L.; Zuo, Z.C.; Yu, S.M.; Shen, L.H.; Cui, H.M.; Xu, Z.W.; Hu, Y.C. Effect of the Fusarium toxins, zearalenone and deoxynivalenol, on the mouse brain. Environ. Toxicol. Pharmacol. 2016, 46, 62–70. [Google Scholar] [CrossRef]
- Liang, Z.; Ren, Z.; Gao, S.; Chen, Y.; Yang, Y.; Yang, D.; Deng, J.; Zuo, Z.; Wang, Y.; Shen, L. Individual and combined effects of deoxynivalenol and zearalenone on mouse kidney. Environ. Toxicol. Pharmacol. 2015, 40, 686–691. [Google Scholar] [CrossRef]
- Ji, J.; Zhu, P.; Cui, F.; Pi, F.; Zhang, Y.; Li, Y.; Wang, J.; Sun, X. The antagonistic effect of mycotoxins deoxynivalenol and zearalenone on metabolic profiling in serum and liver of mice. Toxins 2017, 9, 28. [Google Scholar] [CrossRef]
- Dilkin, P.; Zorzete, P.; Mallmann, C.A.; Gomes, J.D.F.; Utiyam, C.E.; Oetting, L.L.; Correa, B. Toxicological effects of chronic low doses of aflatoxin B1 and fumonisin B1-containing Fusarium moniliforme culture material in weaned piglets. Food Chem. Toxicol. 2003, 41, 1345–1353. [Google Scholar] [CrossRef]
- Harvey, R.B.; Edrington, T.S.; Kubena, L.F.; Elissalde, M.H.; Rottinghaus, G.E. Influence of aflatoxin and fumonisin B1-containing culture material on growing barrows. Am. J. Vet. Res. 1995, 56, 1668–1672. [Google Scholar] [PubMed]
- Miazzo, R.; Peralta, M.F.; Magnoli, C.; Salvano, M.; Ferrero, S.; Chiacchiera, S.M.; Carvalho, E.C.; Rosa, C.A.; Dalcero, A. Efficacy of sodium bentonite as a detoxifier of broiler feed contaminated with aflatoxin and fumonisin. Poult. Sci. 2005, 84, 1–8. [Google Scholar] [CrossRef]
- Tessari, E.N.; Oliveira, C.A.; Cardoso, A.L.; Ledoux, D.R.; Rottinghaus, G.E. Effects of aflatoxin B1 and fumonisin B1 on body weight, antibody titres and histology of broiler chicks. Br. Poult. Sci. 2006, 47, 357–364. [Google Scholar] [CrossRef]
- Ogido, R.; Oliveira, C.A.; Ledoux, D.R.; Rottinghaus, G.E.; Correa, B.; Butkeraitis, P.; Reis, T.A.; Goncales, E.; Albuquerque, R. Effects of prolonged administration of aflatoxin B1 and fumonisin B1 in laying Japanese quail. Poult. Sci. 2004, 83, 1953–1958. [Google Scholar] [CrossRef]
- Orsi, R.B.; Oliveira, C.A.; Dilkin, P.; Xavier, J.G.; Direito, G.M.; Correa, B. Effects of oral administration of aflatoxin B1 and fumonisin B1 in rabbits (Oryctolagus cuniculus). Chem. Biol. Interact. 2007, 170, 201–208. [Google Scholar] [CrossRef] [PubMed]
- Casado, J.M.; Theumer, M.; Masih, D.T.; Chulze, S.; Rubinstein, H.R. Experimental subchronic mycotoxicoses in mice: individual and combined effects of dietary exposure to fumonisins and aflatoxin B1. Food Chem. Toxicol. 2001, 39, 579–586. [Google Scholar] [CrossRef]
- Theumer, M.G.; Lopez, A.G.; Aoki, M.P.; Canepa, M.C.; Rubinstein, H.R. Subchronic mycotoxicoses in rats. Histopathological changes and modulation of the sphinganine to sphingosine (Sa/So) ratio imbalance induced by Fusarium verticillioides culture material, due to the coexistence of aflatoxin B1 in the diet. Food Chem. Toxicol. 2008, 46, 967–977. [Google Scholar] [CrossRef] [PubMed]
- Qian, G.; Tang, L.; Lin, S.; Xue, K.S.; Mitchell, N.J.; Su, J.; Gelderblom, W.C.; Riley, R.T.; Phillips, T.D.; Wang, J.S. Sequential dietary exposure to aflatoxin B1 and fumonisin B1 in F344 rats increases liver preneoplastic changes indicative of a synergistic interaction. Food Chem Toxicol 2016, 95, 188–195. [Google Scholar] [CrossRef]
- Gelderblom, W.C.; Marasas, W.F.; Lebepe-Mazur, S.; Swanevelder, S.; Vessey, C.J.; Hall Pde, L. Interaction of fumonisin B1 and aflatoxin B1 in a short-term carcinogenesis model in rat liver. Toxicology 2002, 171, 161–173. [Google Scholar] [CrossRef]
- Carlson, D.B.; Williams, D.E.; Spitsbergen, J.M.; Ross, P.F.; Bacon, C.W.; Meredith, F.I.; Riley, R.T. Fumonisin B1 promotes aflatoxin B1 and N-methyl-N’-nitro-nitrosoguanidine-initiated liver tumors in rainbow trout. Toxicol. Appl. Pharmacol. 2001, 172, 29–36. [Google Scholar] [CrossRef] [PubMed]
- Schloerke, B.; Crowley, J.; Cook, D.; Briatte, F.; Marbach, M.; Thoen, E.; Elberg, A.; Larmarange, J. GGally: Extension to ‘ggplot2’. R package version 1.4.0. Available online: https://CRAN.R-project.org/package=GGally (accessed on 4 February 2019).
- R Core Team. R: A Language and Environment for Statistical Computing; R Foundation for Statistical Computing: Vienna, Austria, 2018. Available online: https://www.R-project.org/ (accessed on 11 December 2018).
- Wickham, H. ggplot2: Elegant Graphics for Data Analysis; Springer: New York, NY, USA, 2016. [Google Scholar]
- Wickham, H.; François, R.; Henry, L.; Müller, K. dplyr: A Grammar of Data Manipulation. R package version 0.7.7. Available online: https://CRAN.R-project.org/package=dplyr (accessed on 11 December 2018).
Figure 1.
Occurrence of mycotoxins in 15 geographic regions. For each region, countries of sample origin are labeled in the map using a distinct color. The legend indicates percentage of positive samples and median of positive samples for each mycotoxin in each region. Each row represents one region and is labeled using the distinct color corresponding to the respective region in the map. n–sample number; AFB1–aflatoxin B1; DON–deoxynivalenol; ZEN–zearalenone; FUM–fumonisins (sum of fumonisins B1, B2,and B3); OTA–ochratoxin A; T-2–T-2 toxin.
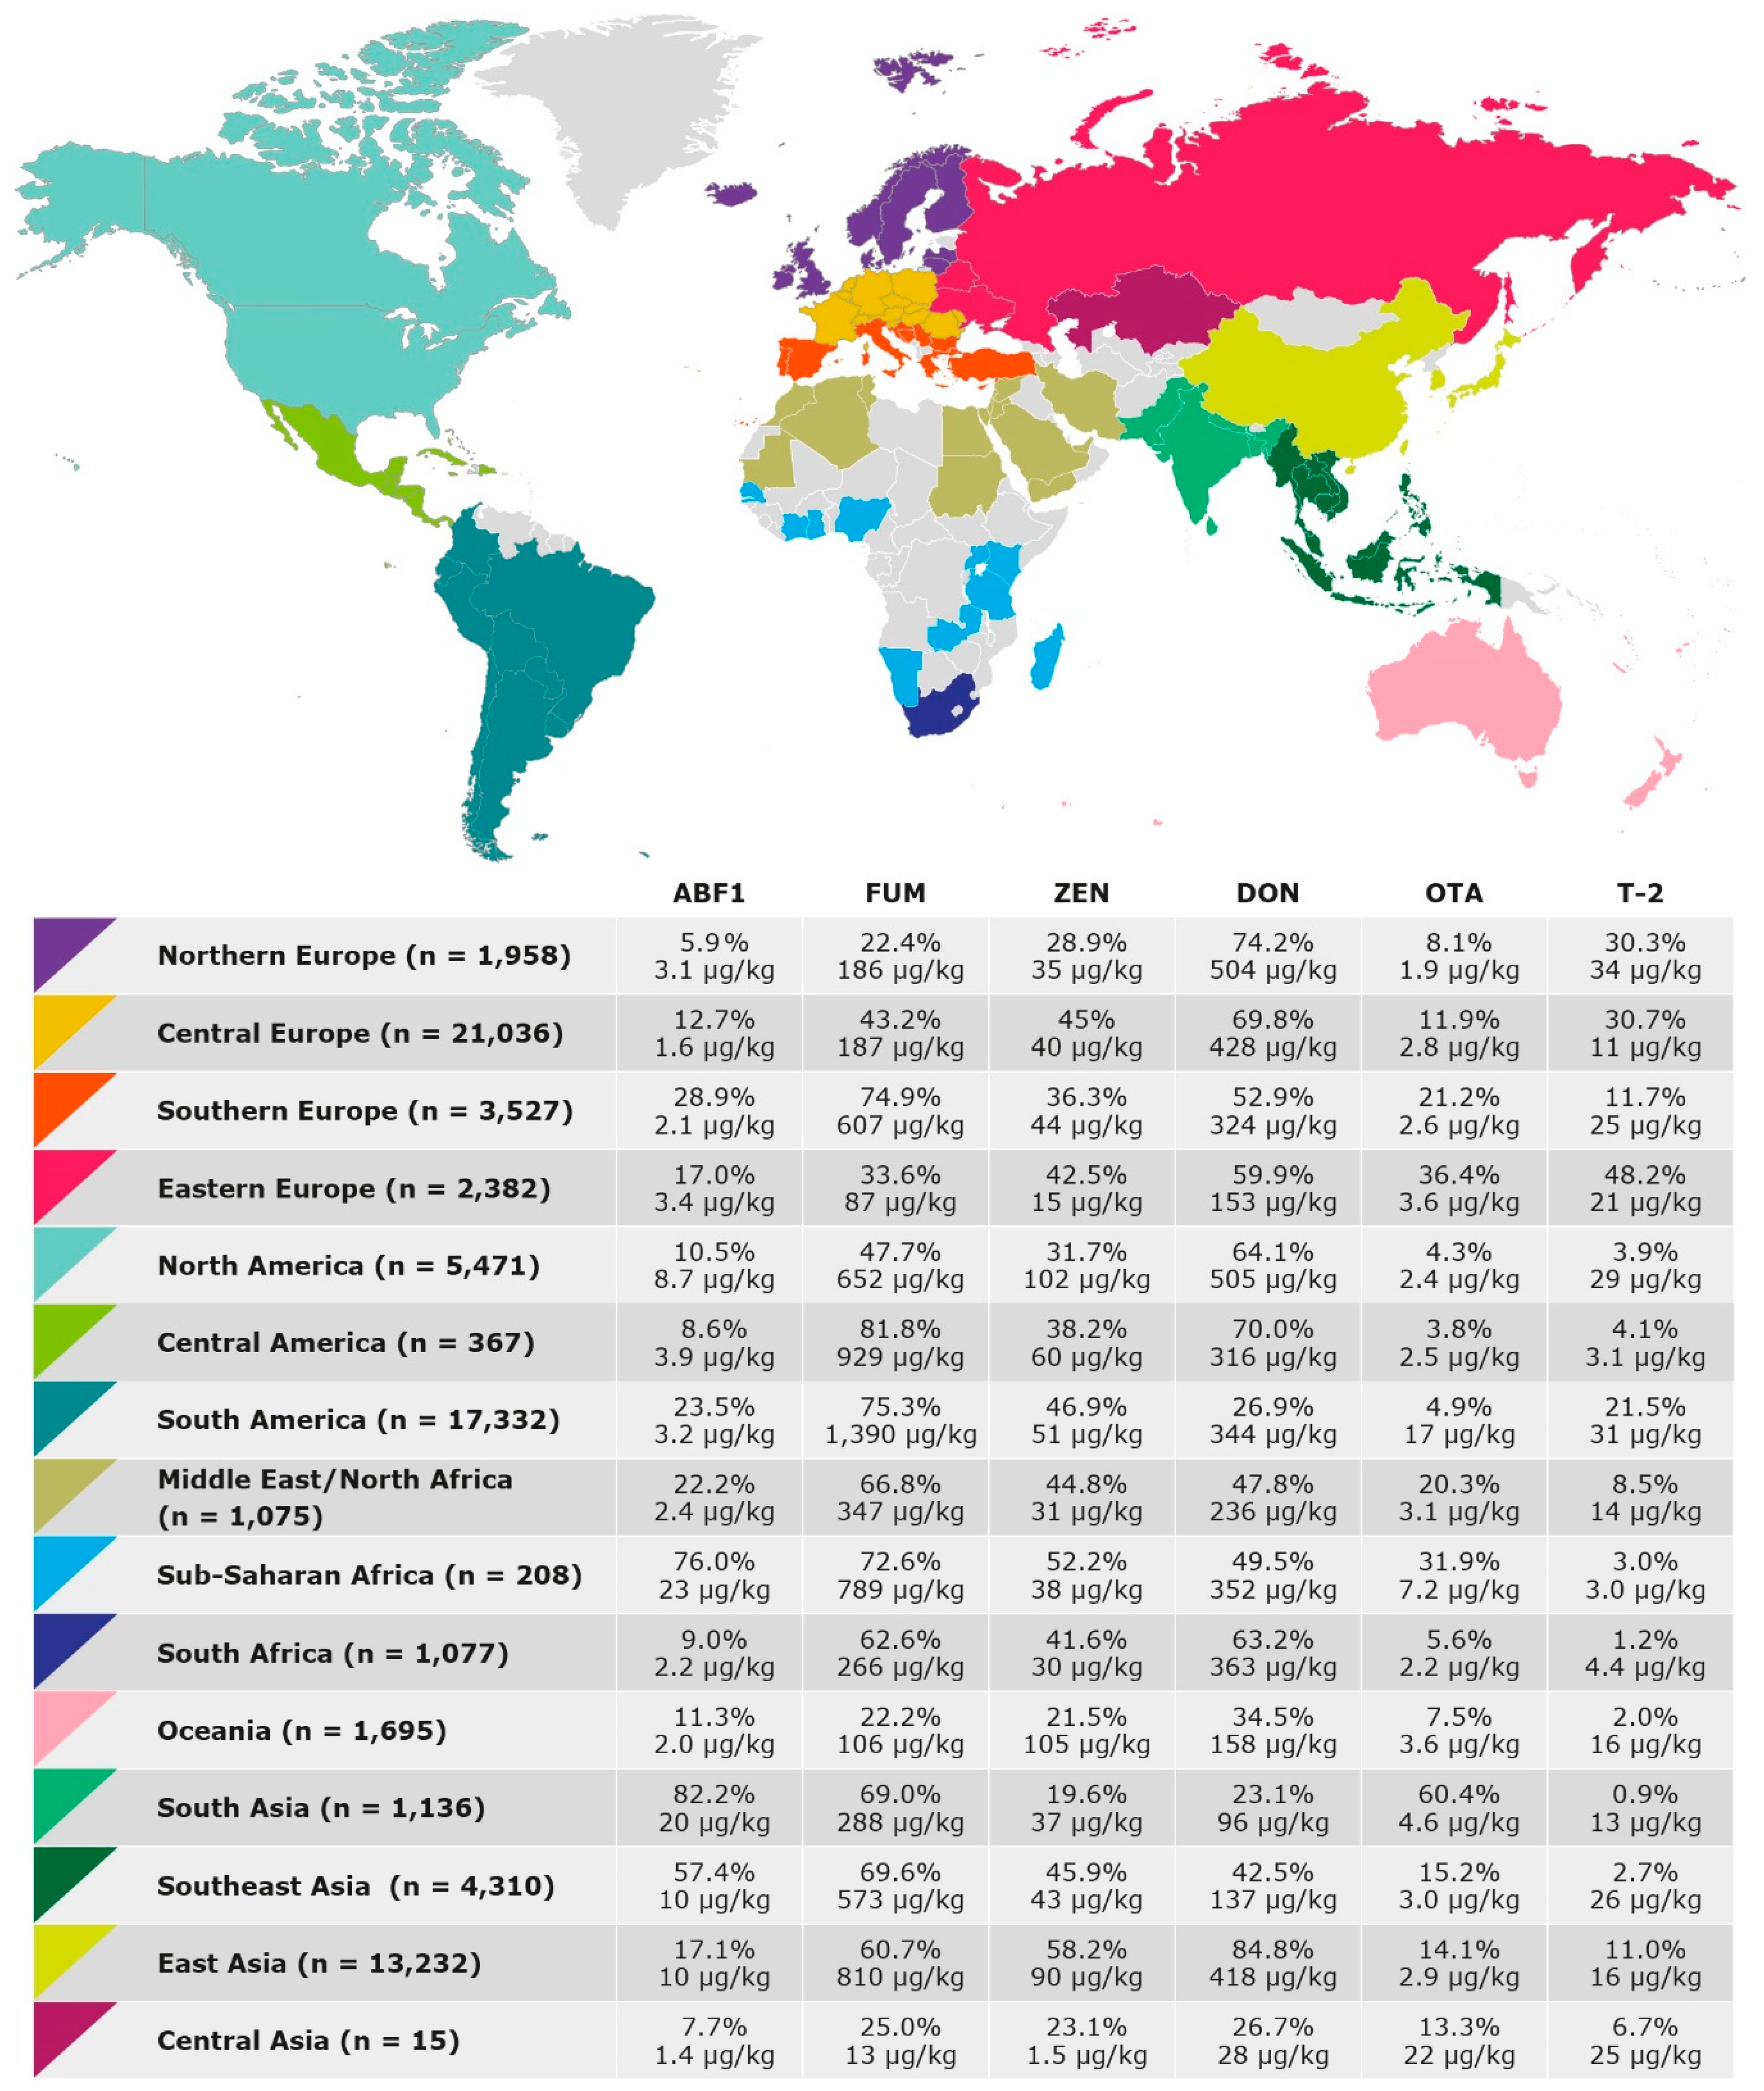
Figure 2.
Year-to-year variation of mycotoxin concentrations in North America, South America, Northern Europe, Central Europe, Southern Europe, and Eastern Europe. The vertical axis shows mean concentrations of mycotoxins (Bayesian mean with error bars for 95% confidence level; see the Materials and Methods section for details on statistical analysis). The horizontal axis shows harvest years 2008–2017. Taking into account approximate seasons of crop growth and harvest, a year was defined to start in April and end in March of the subsequent calendar year for South America or to start in October and end in September of the subsequent calendar year for all other regions. Yellow circles and lines indicate maize samples. Blue circles and lines indicate finished feed samples. Data points are shown if ≥ 20 samples per year were available.
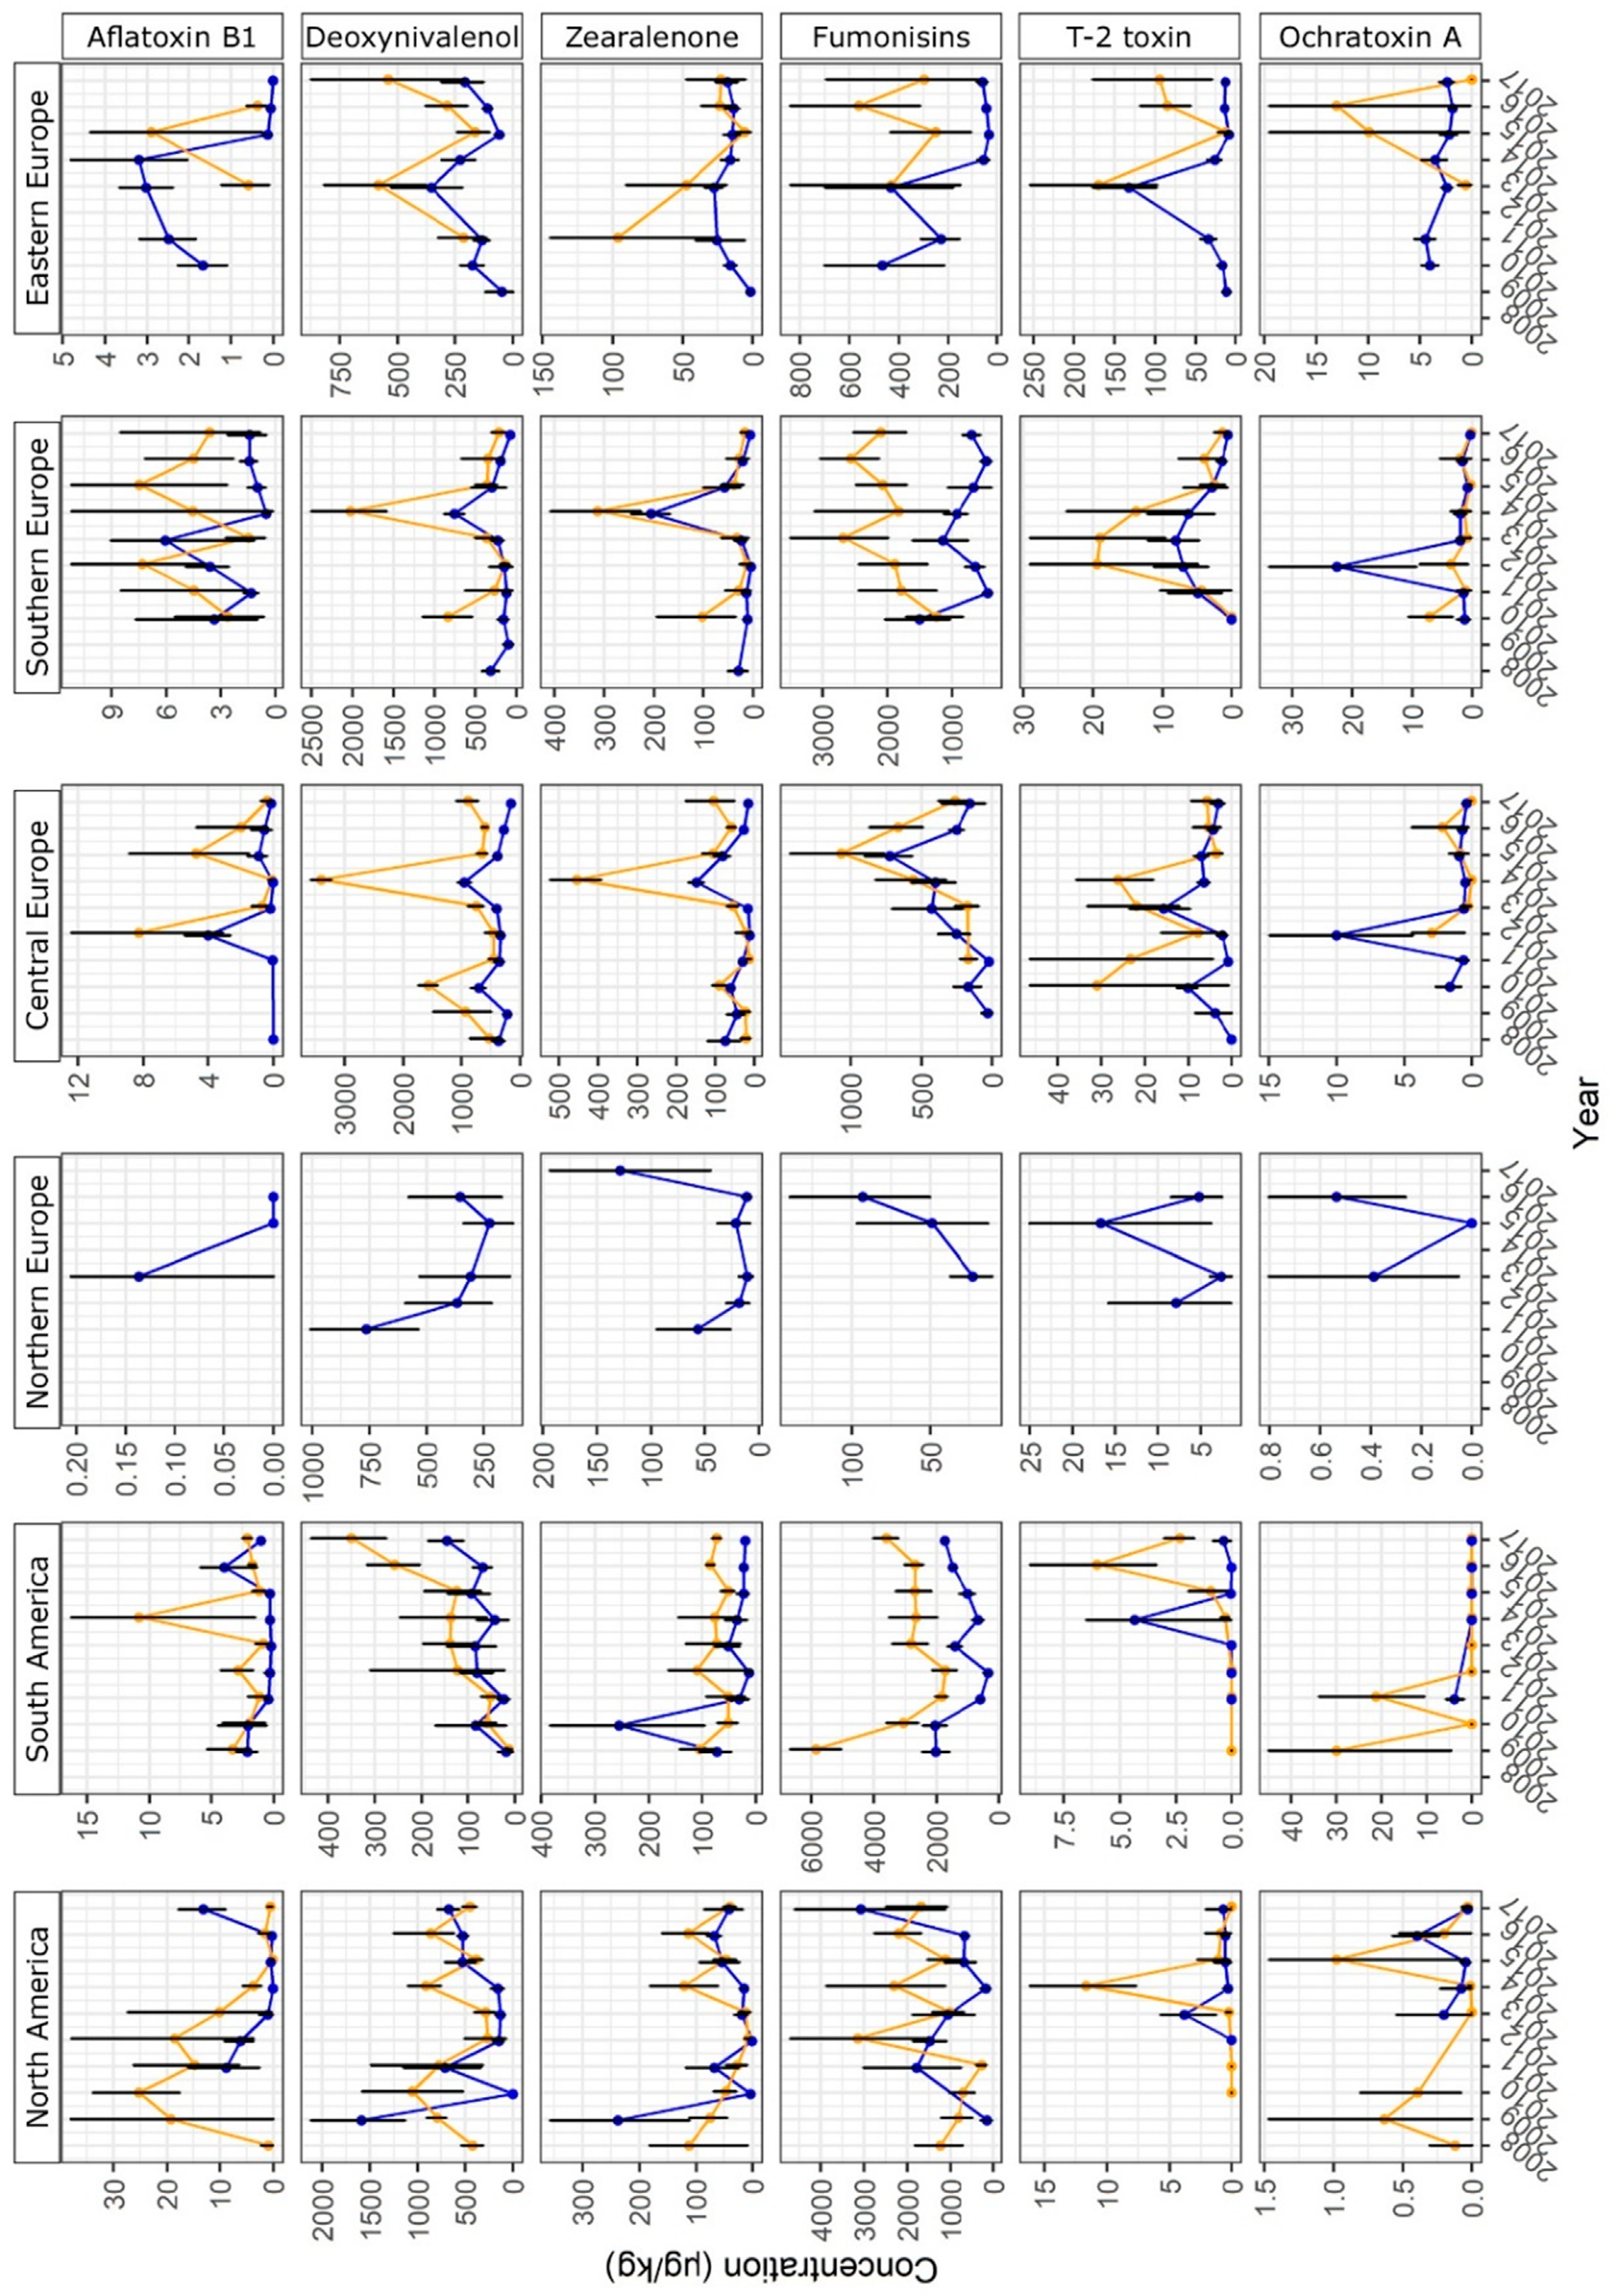
Figure 3.
Year-to-year variation of mycotoxin concentrations in Middle East/North Africa, South Africa, South Asia, Southeast Asia, and East Asia. The vertical axis shows mean concentrations of mycotoxins (Bayesian mean with error bars for 95% confidence level; see Materials and Methods section for details on statistical analysis). The horizontal axis shows harvest years 2008–2017. Taking into account approximate seasons of crop growth and harvest, a year was defined to start in April and end in March of the subsequent calendar year for South Africa or to start in October and end in September of the subsequent calendar year for all other regions. Yellow circles and lines indicate maize samples. Blue circles and lines indicate finished feed samples. Data points are shown if ≥ 20 samples per year were available.

Figure 4.
Correlation of zearalenone and deoxynivalenol concentrations in samples of maize (red circles) and wheat (turquoise circles). Both axes are in logarithmic scale.
Figure 4.
Correlation of zearalenone and deoxynivalenol concentrations in samples of maize (red circles) and wheat (turquoise circles). Both axes are in logarithmic scale.

Figure 5.
Rainfall and temperature in maize-growing areas of Central Europe, Southern Europe, Southeast Asia, and China in 2013–2017. Bars indicate weekly total rainfall. Green, black, and light blue bars correspond to the approximate maize growing season, silking period, and off-season, respectively (these timings can differ between regions and management practice, and are affected by weather). Orange dots indicate weekly mean temperature. The vertical axis shows rainfall (in mm) and temperature in (°C). The horizontal axis indicates the months (J–January, F–February, M–March, A–April, M–May, J–June, J–July, A–August, S–September, O–October, N–November, D–December).


Table 1.
Global mycotoxin occurrence in different commodities.
| Mycotoxin | n1 | Positive Samples2 | Median of Positives (µg/kg) | 1st Quartile of Positives (µg/kg) | 3rd Quartile of Positives (µg/kg) | Maximum (µg/kg) | |
|---|---|---|---|---|---|---|---|
| n1 | % | ||||||
| All samples | |||||||
| Aflatoxin B1 | 51,475 | 11,941 | 23 | 4 | 2 | 17 | 10,918 |
| Fumonisins3 | 46,477 | 27,890 | 60 | 723 | 240 | 1858 | 290,517 |
| Zearalenone | 61,413 | 27,559 | 45 | 55 | 25 | 147 | 105,000 |
| Deoxynivalenol | 59,107 | 37,940 | 64 | 388 | 200 | 885 | 84,860 |
| Ochratoxin A | 32,271 | 4858 | 15 | 3 | 2 | 7 | 2000 |
| T-2 Toxin | 27,850 | 5289 | 19 | 22 | 8 | 40 | 3,051 |
| Finished feed | |||||||
| Aflatoxin B1 | 16,563 | 4251 | 26 | 6 | 2 | 23 | 10,918 |
| Fumonisins3 | 16,285 | 11,825 | 73 | 555 | 198 | 1297 | 290,517 |
| Zearalenone | 19,171 | 10,676 | 56 | 41 | 20 | 102 | 9432 |
| Deoxynivalenol | 18,649 | 13,004 | 70 | 294 | 134 | 600 | 32,893 |
| Ochratoxin A | 11,990 | 2801 | 23 | 3 | 2 | 6 | 1582 |
| T-2 Toxin | 9884 | 2246 | 23 | 10 | 4 | 22 | 1300 |
| Maize | |||||||
| Aflatoxin B1 | 15,889 | 3835 | 24 | 4 | 1 | 22 | 6,105 |
| Fumonisins3 | 12,965 | 10,397 | 80 | 1300 | 520 | 2,940 | 218,883 |
| Zearalenone | 15,860 | 7002 | 44 | 77 | 33 | 217 | 16,495 |
| Deoxynivalenol | 12,660 | 8486 | 67 | 520 | 260 | 1240 | 51,374 |
| Ochratoxin A | 6388 | 334 | 5 | 3 | 2 | 14 | 889 |
| T-2 Toxin | 6087 | 727 | 12 | 25 | 11 | 53 | 978 |
| Maize DDGS | |||||||
| Aflatoxin B1 | 320 | 62 | 19 | 11 | 4 | 20 | 340 |
| Fumonisins3 | 329 | 256 | 78 | 814 | 398 | 1870 | 26,828 |
| Zearalenone | 368 | 275 | 75 | 102 | 60 | 237 | 2896 |
| Deoxynivalenol | 381 | 316 | 83 | 1490 | 574 | 2579 | 84,860 |
| Ochratoxin A | 280 | 62 | 22 | 4 | 2 | 11 | 53 |
| T-2 Toxin | 52 | 3 | 6 | 40 | 35 | 43 | 46 |
| Maize silage | |||||||
| Aflatoxin B1 | 3104 | 188 | 6 | 2 | 1 | 4 | 342 |
| Fumonisins3 | 3010 | 1114 | 37 | 138 | 45 | 416 | 7090 |
| Zearalenone | 3735 | 1508 | 40 | 84 | 34 | 201 | 6239 |
| Deoxynivalenol | 4206 | 2588 | 62 | 474 | 219 | 1092 | 34,861 |
| Ochratoxin A | 2830 | 161 | 6 | 3 | 2 | 6 | 69 |
| T-2 Toxin | 1800 | 58 | 3 | 20 | 10 | 51 | 685 |
| Soybean grains | |||||||
| Aflatoxin B1 | 916 | 186 | 20 | 1 | 1 | 2 | 74 |
| Fumonisins3 | 794 | 135 | 17 | 68 | 29 | 223 | 7023 |
| Zearalenone | 1024 | 364 | 36 | 43 | 26 | 71 | 4336 |
| Deoxynivalenol | 975 | 284 | 29 | 416 | 160 | 640 | 5500 |
| Ochratoxin A | 718 | 86 | 12 | 3 | 2 | 7 | 46 |
| T-2 Toxin | 557 | 102 | 18 | 29 | 23 | 37 | 317 |
| Soybean meal | |||||||
| Aflatoxin B1 | 1692 | 490 | 29 | 2 | 1 | 4 | 109 |
| Fumonisins3 | 1475 | 336 | 23 | 104 | 31 | 290 | 7210 |
| Zearalenone | 1767 | 1072 | 61 | 47 | 33 | 83 | 3720 |
| Deoxynivalenol | 802 | 247 | 31 | 119 | 25 | 424 | 5600 |
| Ochratoxin A | 606 | 82 | 14 | 4 | 2 | 10 | 141 |
| T-2 Toxin | 975 | 324 | 33 | 33 | 25 | 44 | 754 |
| Wheat | |||||||
| Aflatoxin B1 | 2210 | 221 | 10 | 1 | 1 | 3 | 161 |
| Fumonisins3 | 2219 | 304 | 14 | 117 | 31 | 246 | 28,278 |
| Zearalenone | 4925 | 1624 | 33 | 34 | 20 | 75 | 23,278 |
| Deoxynivalenol | 5949 | 3866 | 65 | 369 | 218 | 865 | 49,307 |
| Ochratoxin A | 1973 | 172 | 9 | 3 | 2 | 5 | 364 |
| T-2 Toxin | 1993 | 439 | 22 | 25 | 13 | 35 | 1300 |
| Barley | |||||||
| Aflatoxin B1 | 727 | 64 | 9 | 1 | 1 | 2 | 120 |
| Fumonisins3 | 776 | 65 | 8 | 53 | 17 | 366 | 10,485 |
| Zearalenone | 3129 | 637 | 20 | 25 | 20 | 58 | 8952 |
| Deoxynivalenol | 4046 | 2468 | 61 | 359 | 234 | 750 | 35,000 |
| Ochratoxin A | 730 | 46 | 6 | 3 | 2 | 9 | 150 |
| T-2 Toxin | 1225 | 272 | 22 | 26 | 9 | 51 | 404 |
| Rice | |||||||
| Aflatoxin B1 | 205 | 63 | 31 | 5 | 2 | 14 | 113 |
| Fumonisins3 | 244 | 49 | 20 | 142 | 63 | 382 | 6895 |
| Zearalenone | 220 | 74 | 34 | 60 | 34 | 107 | 1530 |
| Deoxynivalenol | 226 | 60 | 27 | 266 | 87 | 436 | 3859 |
| Ochratoxin A | 230 | 32 | 14 | 3 | 2 | 5 | 20 |
| T-2 Toxin | 54 | 5 | 9 | 9 | 8 | 26 | 30 |
1 Sample number; 2 Positive samples are defined as > limit of detection, excluding aflatoxins below 0.5 ng/g and other mycotoxins below 1 ng/g; 3 Sum of fumonisins B1, B2, and B3.
Table 2.
Percentage of samples exceeding lowest and highest maximum levels or guidance values for mycotoxins in feed that are in effect in the European Union.
Table 2.
Percentage of samples exceeding lowest and highest maximum levels or guidance values for mycotoxins in feed that are in effect in the European Union.
| Region | Aflatoxin B11 | Fumonisins1 | Zearalenone1 | Deoxynivalenol1 | Ochratoxin A1 | |||||
|---|---|---|---|---|---|---|---|---|---|---|
| % Exceeding | % Exceeding | % Exceeding | % Exceeding | % Exceeding | ||||||
| 5 µg/kg | 20 µg/kg | 5000 µg/kg | 60,000 µg/kg | 100 µg/kg | 2000 µg/kg | 900 µg/kg | 8000 µg/kg | 50 µg/kg | 250 µg/kg | |
| Northern Europe | 2.4 | 0.4 | 0.0 | 0.0 | 6.2 | 0.1 | 21.5 | 1.0 | 0.2 | 0.0 |
| Central Europe | 2.6 | 1.0 | 1.3 | 0.0 | 13.0 | 0.4 | 20.4 | 0.9 | 0.3 | 0.1 |
| Southern Europe | 7.4 | 2.1 | 3.3 | 0.0 | 11.8 | 0.2 | 11.7 | 0.5 | 0.9 | 0.2 |
| Eastern Europe | 5.4 | 0.2 | 0.3 | 0.0 | 4.8 | 0.1 | 4.3 | 0.1 | 0.4 | 0.2 |
| North America | 6.2 | 3.4 | 3.9 | 0.2 | 16.8 | 0.6 | 19.1 | 0.8 | 0.1 | 0.0 |
| Central America | 3.6 | 0.0 | 3.8 | 0.0 | 10.7 | 0.0 | 8.1 | 0.0 | 0.0 | 0.0 |
| South America | 6.5 | 1.3 | 8.4 | 0.2 | 13.1 | 0.2 | 5.1 | 0.0 | 0.8 | 0.5 |
| Middle East/North Africa | 7.5 | 3.5 | 1.1 | 0.0 | 8.6 | 0.0 | 5.6 | 0.0 | 0.9 | 0.0 |
| Sub-Saharan Africa | 59.1 | 38.5 | 1.0 | 0.0 | 5.0 | 0.0 | 7.0 | 0.0 | 4.2 | 0.8 |
| South Africa | 3.3 | 1.2 | 2.0 | 0.0 | 8.1 | 0.3 | 11.1 | 0.4 | 0.1 | 0.0 |
| Oceania | 3.0 | 1.0 | 0.6 | 0.0 | 11.1 | 0.7 | 5.1 | 1.1 | 0.1 | 0.0 |
| South Asia | 61.1 | 41.1 | 0.5 | 0.0 | 2.0 | 0.0 | 1.5 | 0.0 | 2.4 | 0.4 |
| Southeast Asia | 37.9 | 20.9 | 2.0 | 0.0 | 10.1 | 0.4 | 4.8 | 0.5 | 0.4 | 0.0 |
| East Asia | 10.2 | 6.6 | 3.9 | 0.0 | 27.3 | 1.3 | 20.6 | 0.7 | 0.3 | 0.0 |
1 Percentage of samples exceeding lowest or highest EU maximum levels or guidance values for mycotoxins in feed (including the lowest maximum level or guidance value stipulated for any commodity or consuming species and higher maximum levels or guidance values stipulated excluding limits for maize by-products and for oat husks). In case of fumonisins, the sum of fumonisins B1, B2, and B3 was compared to the EU guidance values, although the guidance values refer to the sum of fumonisins B1 and B2.
Table 3.
Global co-occurrence of mycotoxins in finished feed, maize, and wheat.
| Mycotoxin Combination1 | Finished Feed | Maize | Wheat |
|---|---|---|---|
| AFB1 + DON | 14% | 15% | 5% |
| AFB1 + ZEN | 14% | 11% | 3% |
| AFB1 + FUM | 22% | 24% | 1% |
| AFB1 + OTA | 12% | 2% | 1% |
| AFB1 + T-2 | 3% | 3% | 5% |
| DON + ZEN | 48% | 39% | 28% |
| DON + FUM | 48% | 49% | 8% |
| DON + OTA | 15% | 3% | 6% |
| DON + T-2 | 19% | 10% | 14% |
| ZEN + FUM | 43% | 37% | 5% |
| ZEN + OTA | 14% | 2% | 2% |
| ZEN + T-2 | 18% | 9% | 9% |
| FUM + OTA | 17% | 4% | 1% |
| FUM + T-2 | 11% | 9% | 3% |
| OTA + T-2 | 7% | 1% | 2% |
1 AFB1–aflatoxin B1; DON–deoxynivalenol; ZEN–zearalenone; FUM–fumonisins (sum of fumonisins B1, B2 and B3); OTA–ochratoxin A; T-2–T-2 toxin.
Table 4.
Sample numbers per commodity and region.
| Finished Feed | Maize | Maize DDGS | Maize Silage | Soybean Grains | Soybean Meal | Wheat | Barley | Rice | Other Feed | Total | |
|---|---|---|---|---|---|---|---|---|---|---|---|
| Northern Europe | 236 | 20 | 5 | 43 | 6 | 6 | 378 | 555 | 0 | 709 | 1958 |
| Central Europe | 5328 | 3576 | 16 | 1431 | 208 | 67 | 3866 | 3172 | 27 | 3345 | 21,036 |
| Southern Europe | 1463 | 869 | 8 | 177 | 78 | 36 | 197 | 91 | 4 | 604 | 3527 |
| Eastern Europe | 1183 | 287 | 0 | 71 | 29 | 55 | 349 | 115 | 1 | 292 | 2382 |
| North America | 1082 | 1959 | 118 | 481 | 93 | 69 | 109 | 21 | 1 | 1538 | 5471 |
| Central America | 206 | 83 | 0 | 14 | 16 | 8 | 4 | 0 | 0 | 36 | 367 |
| South America | 3428 | 8407 | 0 | 59 | 362 | 2233 | 205 | 2 | 10 | 2626 | 17,332 |
| Middle East/North Africa | 543 | 178 | 4 | 46 | 38 | 13 | 69 | 11 | 0 | 173 | 1075 |
| Sub-Saharan Africa | 92 | 40 | 0 | 1 | 9 | 7 | 9 | 4 | 0 | 46 | 208 |
| South Africa | 324 | 306 | 0 | 111 | 32 | 7 | 12 | 5 | 1 | 279 | 1077 |
| Oceania | 222 | 35 | 14 | 262 | 11 | 26 | 260 | 128 | 4 | 733 | 1695 |
| South Asia | 557 | 211 | 1 | 5 | 43 | 38 | 17 | 0 | 22 | 242 | 1136 |
| Southeast Asia | 1826 | 895 | 73 | 0 | 170 | 163 | 151 | 2 | 87 | 943 | 4310 |
| East Asia | 5098 | 2930 | 150 | 1614 | 91 | 91 | 521 | 36 | 113 | 2588 | 13,232 |
| Central Asia | 0 | 2 | 0 | 0 | 0 | 0 | 13 | 0 | 0 | 0 | 15 |
| Total | 21,588 | 19,798 | 389 | 4315 | 1186 | 2819 | 6160 | 4142 | 270 | 14,154 | 74,821 |
Table 5.
Mycotoxin analysis of feed samples.
| Analyzer | Sample Number | Method1 | Limits of Detection (µg/kg)1 | |||||||
|---|---|---|---|---|---|---|---|---|---|---|
| AFB1 | ZEN | DON | FB1 | FB2 | FB3 | OTA | T-2 | |||
| Romer Labs (Tulln, Austria) | 13,438 | ELISA | 1 | 20 | 200 | 200 | 200 | n.a. | 1.9 | 10 |
| Romer Labs (Tulln, Austria) | 10,873 | HPLC | 0.2 | 4 | 20 | 20 | 20 | n.a. | 0.2 | 2 |
| Romer Labs (Tulln, Austria) | 9747 | LC-MS/MS | 0.2 | 4 | 20 | 20 | 20 | n.a. | 0.2 | 2 |
| Romer Labs (Singapore) | 7052 | LC-MS/MS | 0.5 | 10 | 10 | 10 | 10 | n.a. | 0.5 | 10 |
| BIOMIN (Shanghai, China) | 5282 | HPLC | 3 | 30 | 150 | 300 | 300 | n.a. | 1.7 | n.a. |
| Romer Labs (Tulln, Austria) test strips operated by BIOMIN and commercial customers | 4769 | ELISA | 3 | 20 | 200 | 200 | 200 | n.a. | 2 | 20 |
| Romer Labs (Union, USA) | 4689 | HPLC | 0.2 | 4 | 20 | 20 | 20 | n.a. | 0.2 | 2 |
| Romer Labs (Union, USA) | 3636 | LC-MS/MS | 0.2 | 4 | 20 | 20 | 20 | n.a. | 0.2 | 2 |
| Biofarma (Córdoba, Argentina) | 3058 | HPLC | 1 | 20 | 250 | 250 | 250 | n.a. | n.a. | 20 |
| IFA-Tulln2 | 2696 | LC-MS/MS | 1.5 | 0.3 | 1.5 | 4 | 4 | 4 | 1.5 | 10 |
| Labocéa (Plouzané, France) | 1665 | HPLC | 0.2 | 2.8 | 1.2 | 10 | 10 | n.a. | 0.06 | 25 |
| SAMITEC (Santa Maria, Brazil) | 1191 | HPLC | 1 | 20 | 200 | 125 | 125 | n.a. | 2 | 100 |
| Romer Labs (Union, USA) | 999 | ELISA | 1 | 20 | 200 | 200 | 200 | n.a. | 1.9 | 10 |
| Spectrum®, VNITIP (Sergiev Posad, Russia) | 936 | LC-MS/MS | 2.01 | 1.8 | 7.2 | 5.4 | 5.4 | n.a. | 1.08 | 3.62 |
| Biofarma (Córdoba, Argentina) | 909 | ELISA | 1 | 20 | 200 | 125 | 125 | n.a. | n.a. | 100 |
| BIOMIN (Shanghai, China) | 760 | ELISA | 1 | 20 | 200 | 200 | 200 | n.a. | 1.9 | 10 |
| Bayrischer Tiergesund-heitsdienst (Poing, Germany) | 642 | ELISA | n.a. | 50 | 100 | n.a. | n.a. | n.a. | n.a. | n.a. |
| Royal Agricultural Stations (Thailand) | 616 | HPLC | 0.5 | 10 | 10 | 10 | 10 | n.a. | 0.5 | 10 |
| BIOMIN (Binh Duong, Vietnam) | 405 | HPLC | 1 | 10 | 10 | 25 | 25 | n.a. | 1 | 15 |
| ISU (Ames, Iowa) | 403 | LC-MS/MS | 5 | 100 | 100 | 100 | 100 | n.a. | 100 | 100 |
| BioCheck (Leipzig, Germany) | 290 | ELISA | 0.5 | 6 | 10 | 25 | 25 | n.a. | 0.2 | 3 |
| BioCheck (Leipzig, Germany) | 206 | HPLC | 2.7 | 0.5 | 3 | 1.5 | 1.5 | n.a. | 0.5 | 0.5 |
| Actlabs (Ancaster, Canada) | 190 | LC-MS/MS | 1 | 30 | 60 | 100 | 100 | n.a. | 3 | 60 |
| LAMIC (Santa Maria, Brazil) | 99 | HPLC | 1 | 20 | 200 | 125 | 125 | n.a. | n.a. | 100 |
| LUFA (Oldenburg, Germany) | 80 | ELISA | n.a. | 10 | 300 | n.a. | n.a. | n.a. | n.a. | n.a. |
| Uniwersytet Bydgoszcz (Bydgoszcz, Poland) | 41 | HPLC | n.a. | 0.2 | 6 | 5 | 5 | n.a. | 1.2 | 0.6 |
| Southern African Grain Laboratory (The Willows, South Africa) | 36 | LC-MS/MS | 5 | 50 | 100 | 20 | 20 | 20 | 5 | 10 |
| SGS (Hamburg, Germany) | 35 | LC-MS/MS | n.a. | 5 | 10 | n.a. | n.a. | n.a. | n.a. | n.a. |
| Tierklinik (St. Veit, Austria) | 27 | ELISA | n.a. | 10 | 200 | n.a. | n.a. | n.a. | n.a. | n.a. |
| SVÚ (Olomouc, Czech Republic) | 27 | ELISA | n.a. | 50 | 100 | n.a. | n.a. | n.a. | n.a. | 65 |
| SVÚ (Jihlava, Czech Republic) | 9 | ELISA | n.a. | 50 | 100 | n.a. | n.a. | n.a. | n.a. | n.a. |
| Sevaron Poradenství (Brno, Czech Republic) | 7 | ELISA | n.a. | 30 | 100 | n.a. | n.a. | n.a. | n.a. | 30 |
| University Latvia (Riga, Latvia) | 7 | HPLC | 1 | 150 | 200 | n.a. | n.a. | n.a. | n.a. | 100 |
| Zemědělská oblastní laboratoř (Chotýšany, Czech Republic) | 1 | ELISA | n.a. | 20 | n.a. | n.a. | n.a. | n.a. | n.a. | n.a. |
1 Abbreviations: AFB1–aflatoxin B1; DON–deoxynivalenol; ZEN–zearalenone; FB1–fumonisin B1; FB2–fumonisin B2; FB3–fumonisin B3; OTA–ochratoxin A; T-2–T-2 toxin; ELISA–enzyme linked immunosorbent assay; HPLC–high performance liquid chromatography; LC-MS/MS–liquid chromatography tandem mass spectrometry; n.a.–not analyzed. 2 Samples were analyzed at the Department of Agrobiotechnology (IFA-Tulln) at the University of Natural Resources and Life Sciences Vienna (BOKU) in Tulln, Austria as described by Kovalsky et al. [14].
© 2019 by the authors. Licensee MDPI, Basel, Switzerland. This article is an open access article distributed under the terms and conditions of the Creative Commons Attribution (CC BY) license (http://creativecommons.org/licenses/by/4.0/).
Share and Cite
MDPI and ACS Style
Gruber-Dorninger, C.; Jenkins, T.; Schatzmayr, G. Global Mycotoxin Occurrence in Feed: A Ten-Year Survey. Toxins 2019, 11, 375. https://0-doi-org.brum.beds.ac.uk/10.3390/toxins11070375
AMA Style
Gruber-Dorninger C, Jenkins T, Schatzmayr G. Global Mycotoxin Occurrence in Feed: A Ten-Year Survey. Toxins. 2019; 11(7):375. https://0-doi-org.brum.beds.ac.uk/10.3390/toxins11070375
Chicago/Turabian StyleGruber-Dorninger, Christiane, Timothy Jenkins, and Gerd Schatzmayr. 2019. "Global Mycotoxin Occurrence in Feed: A Ten-Year Survey" Toxins 11, no. 7: 375. https://0-doi-org.brum.beds.ac.uk/10.3390/toxins11070375
Note that from the first issue of 2016, this journal uses article numbers instead of page numbers. See further details here.