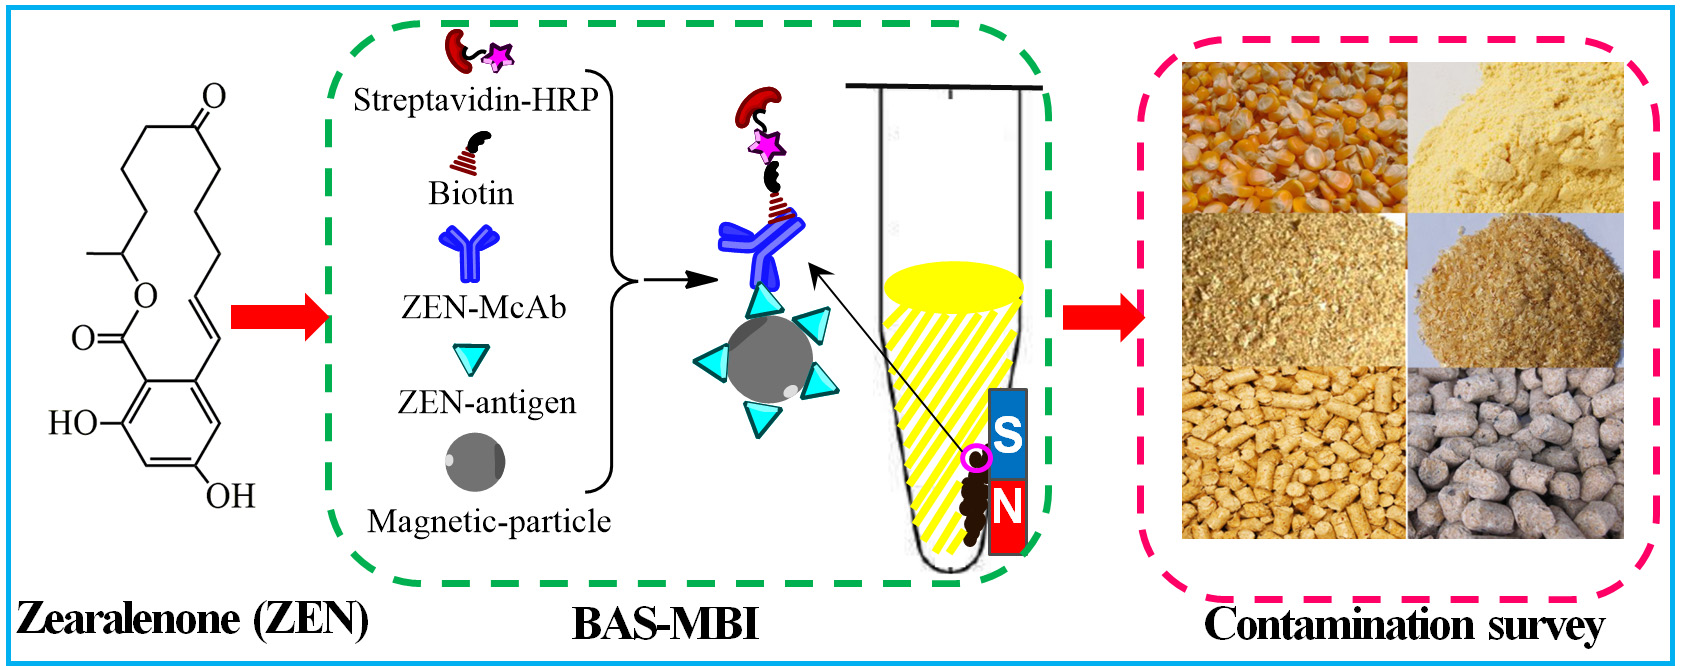
Zearalenone Contamination in Corn, Corn Products, and Swine Feed in China in 2016–2018 as Assessed by Magnetic Bead Immunoassay

Abstract
:
1. Introduction
2. Results and Discussion
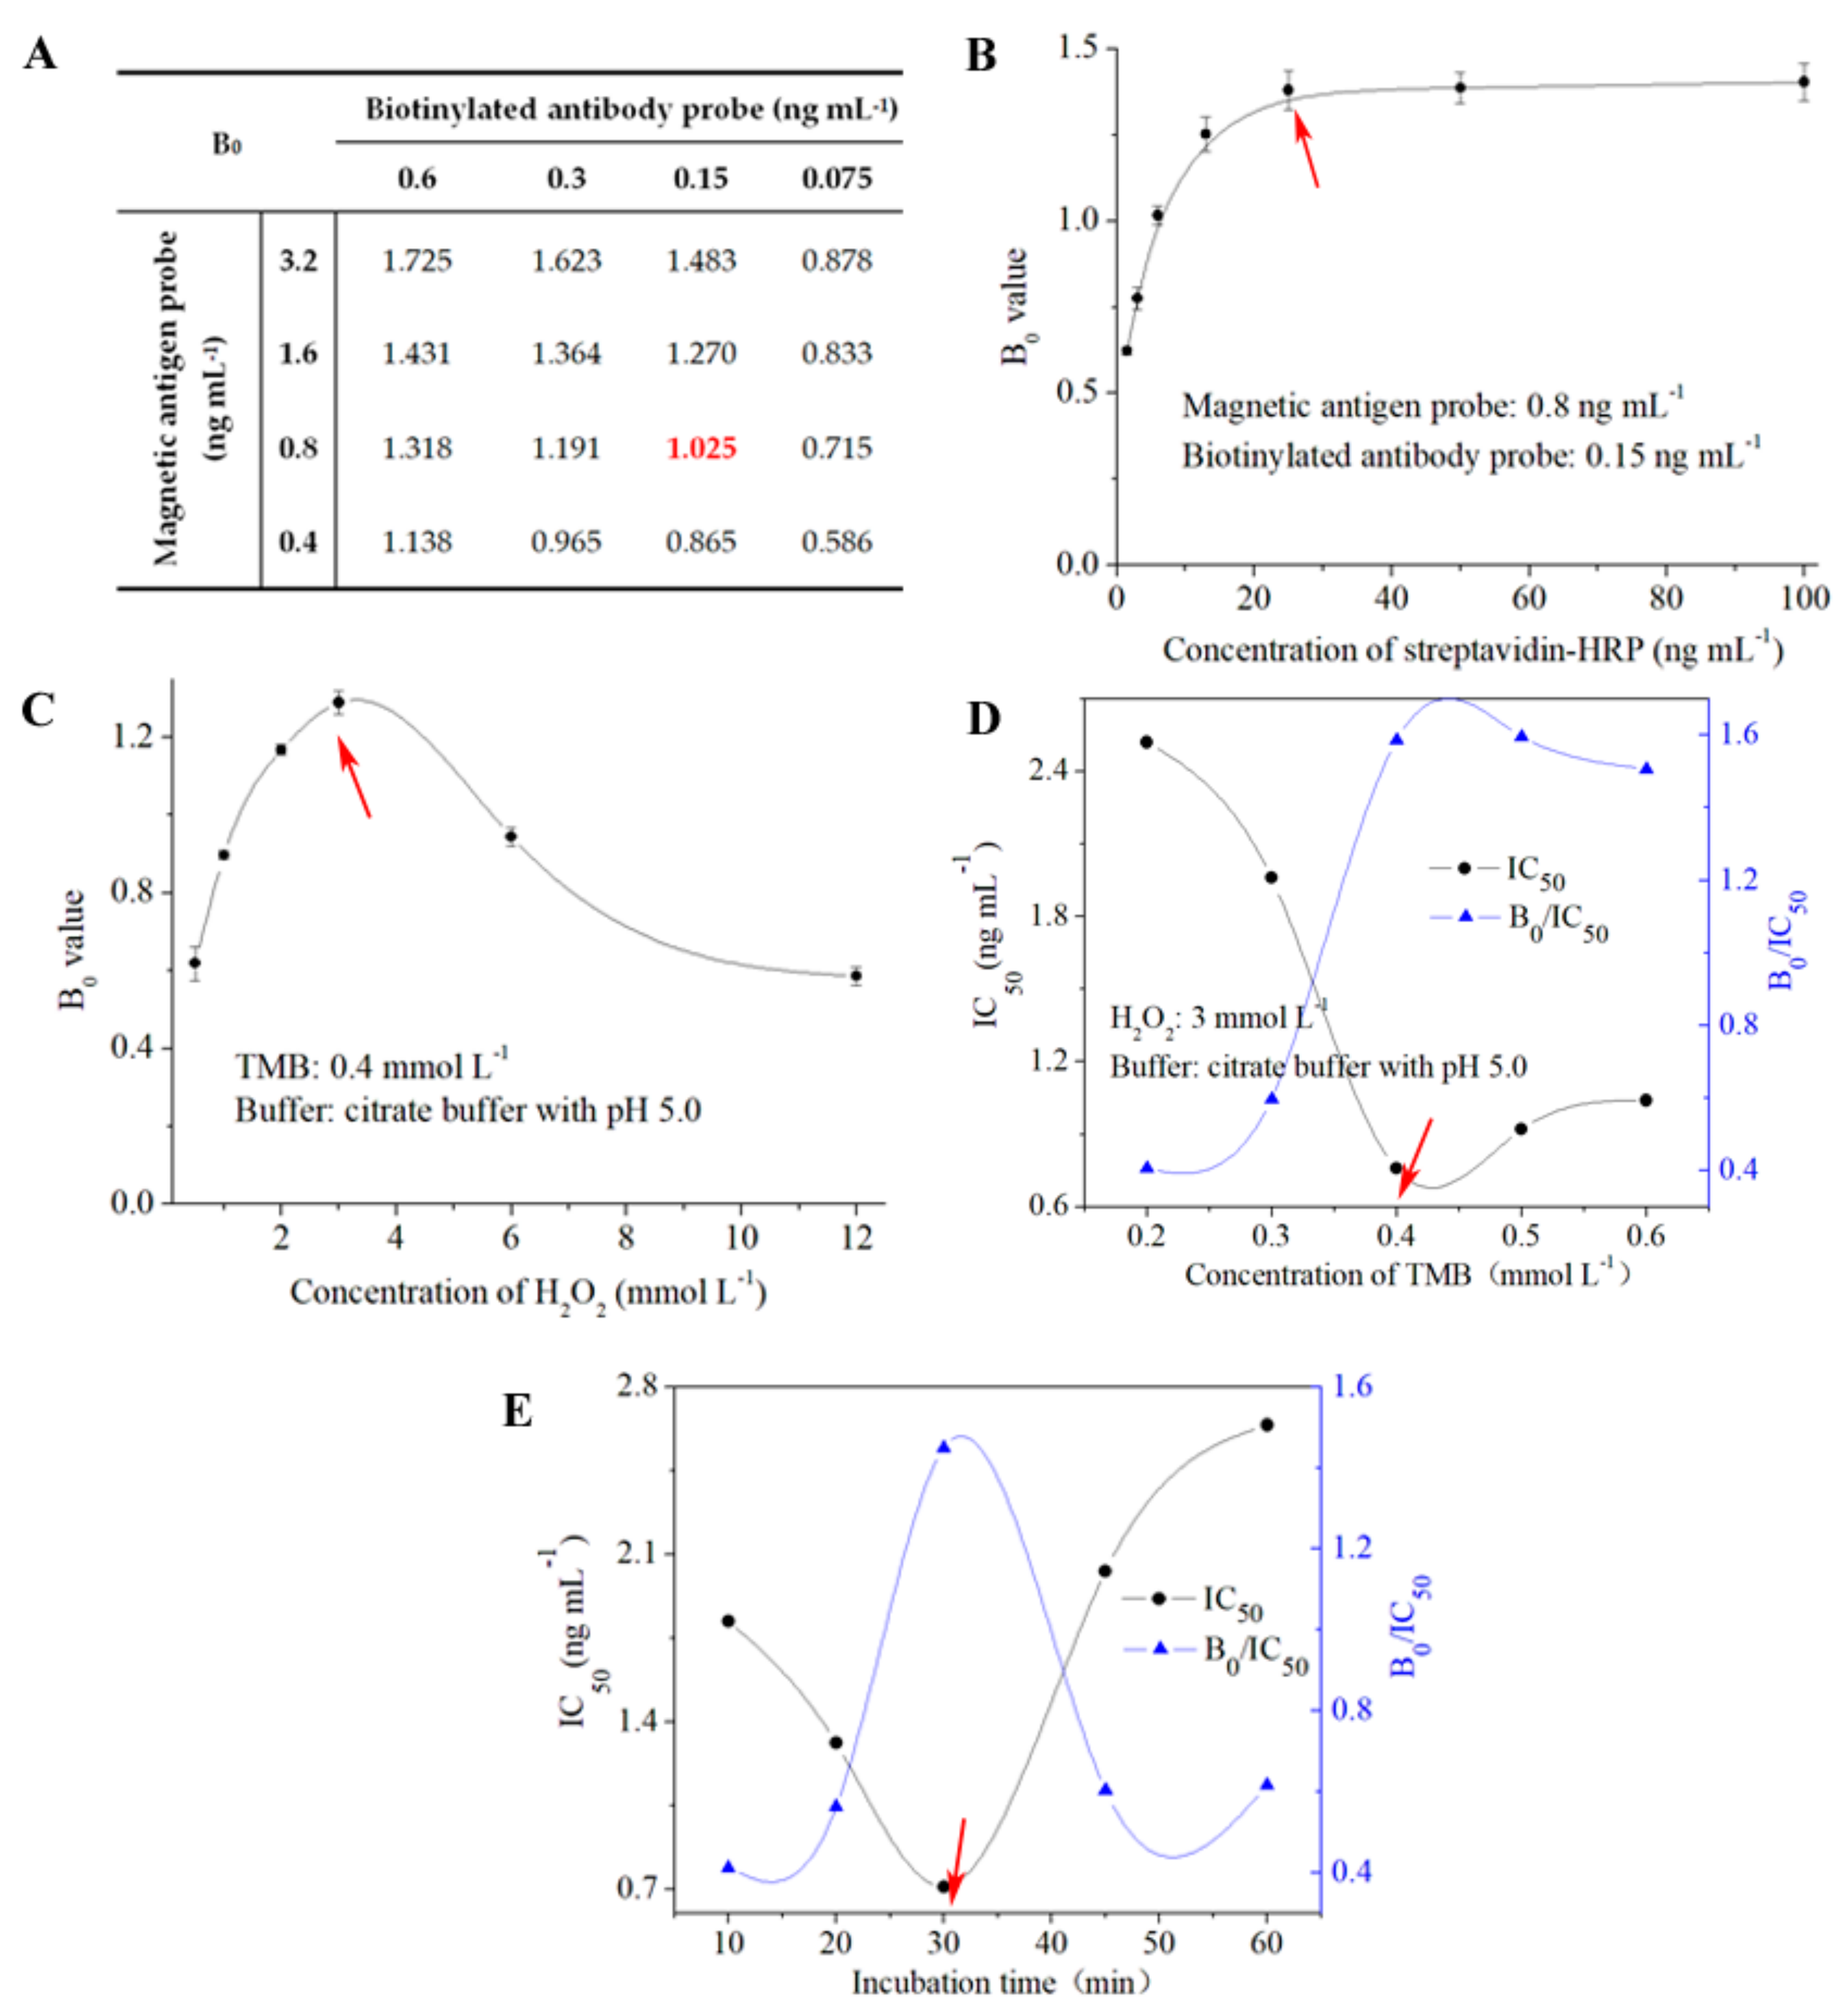
2.1. Optimum Condition of BAS-MBI
2.2. Sensitivity
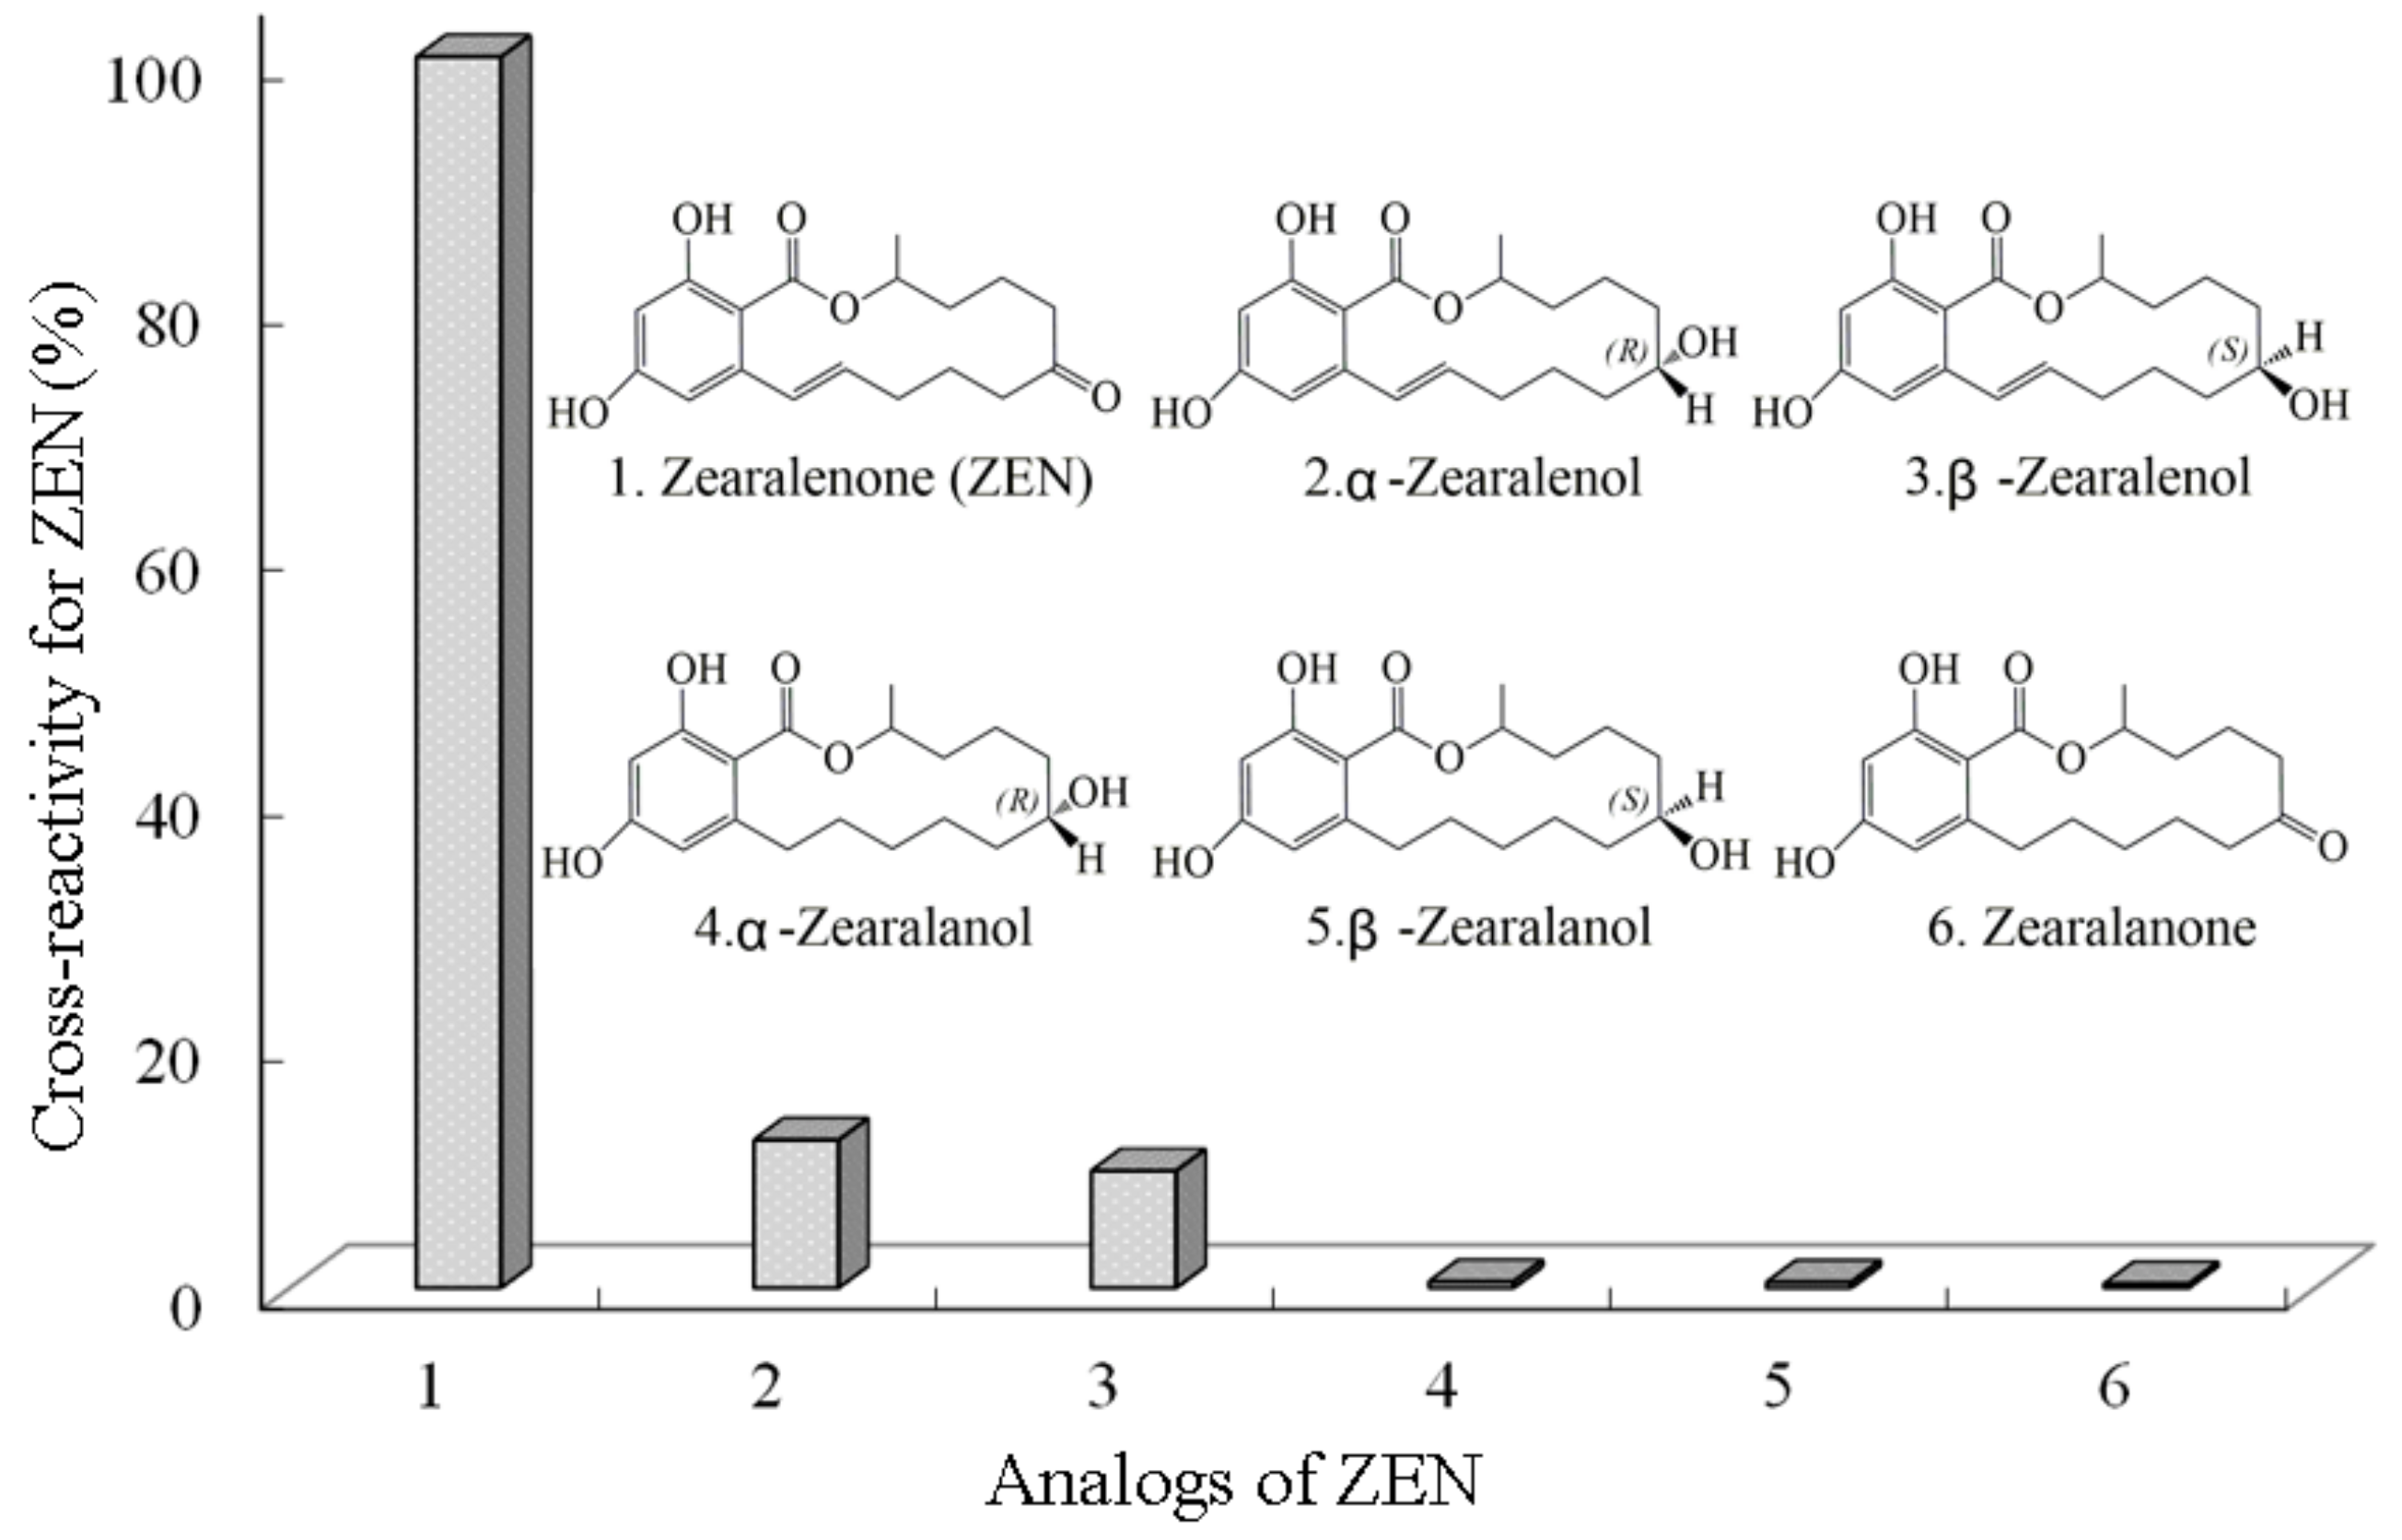
2.3. Specificity
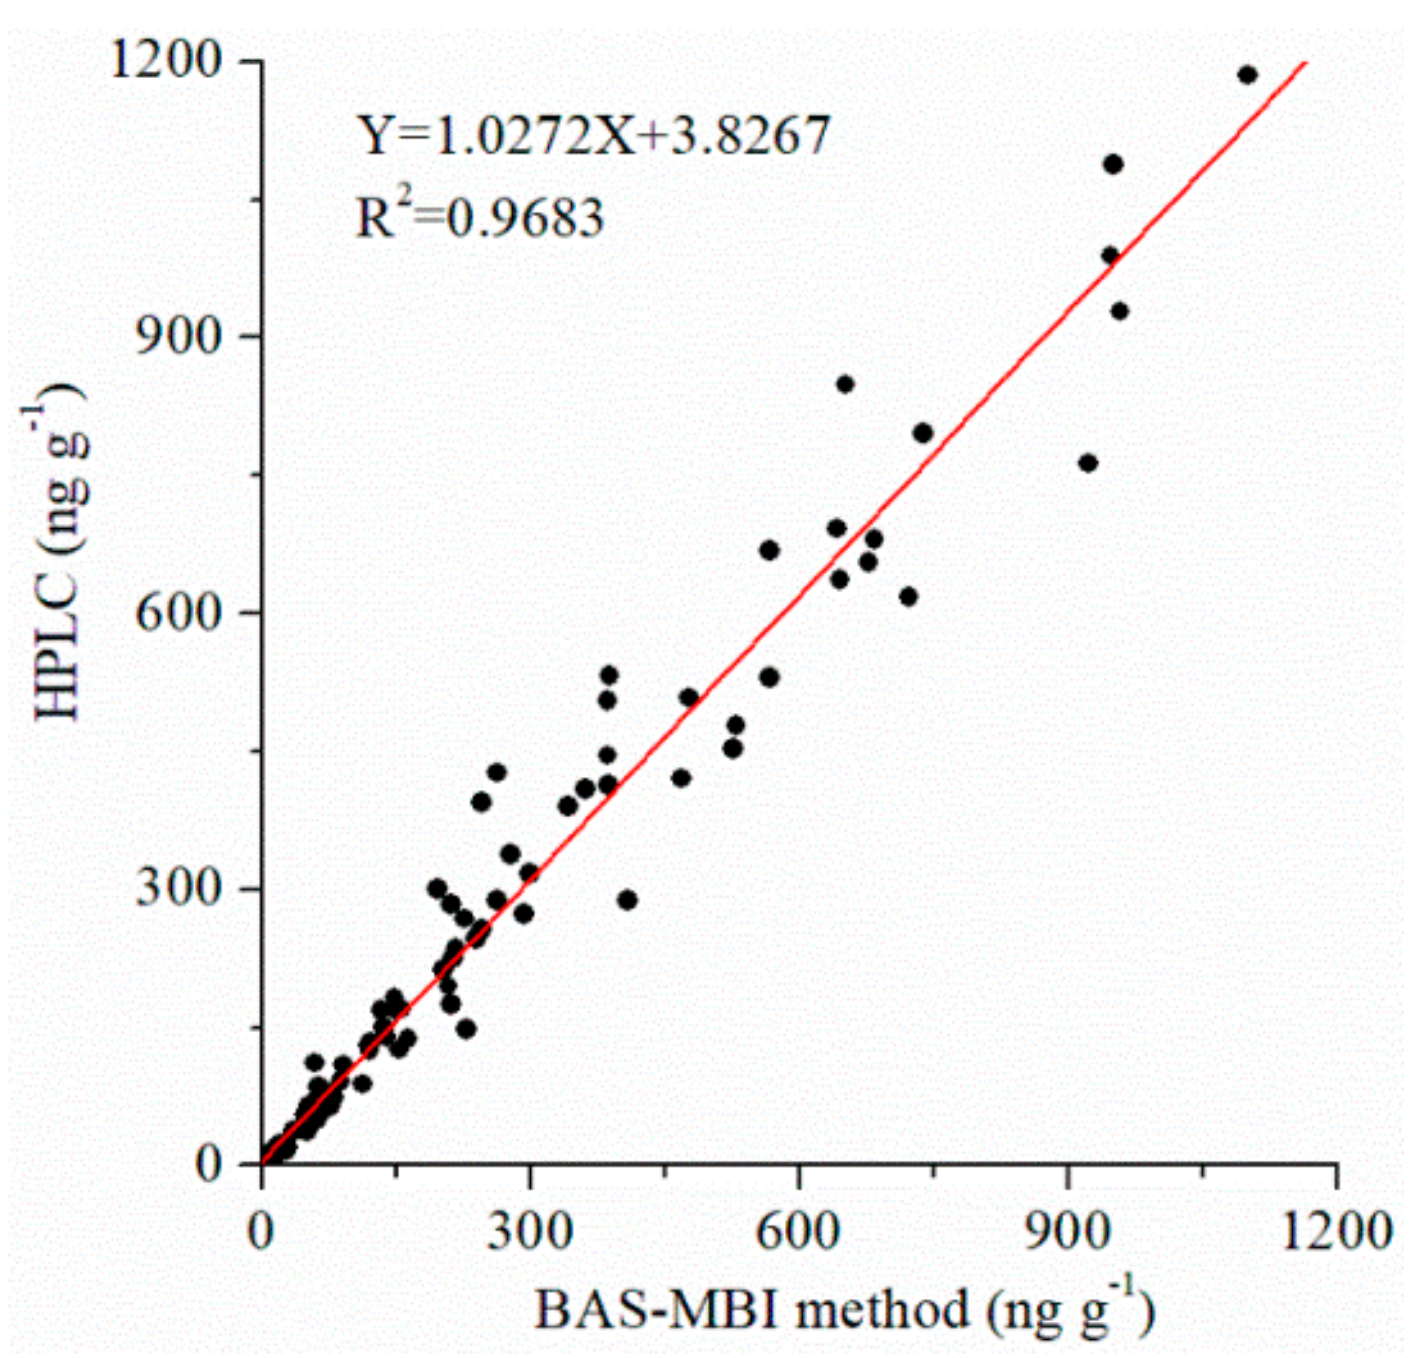
2.4. Accuracy
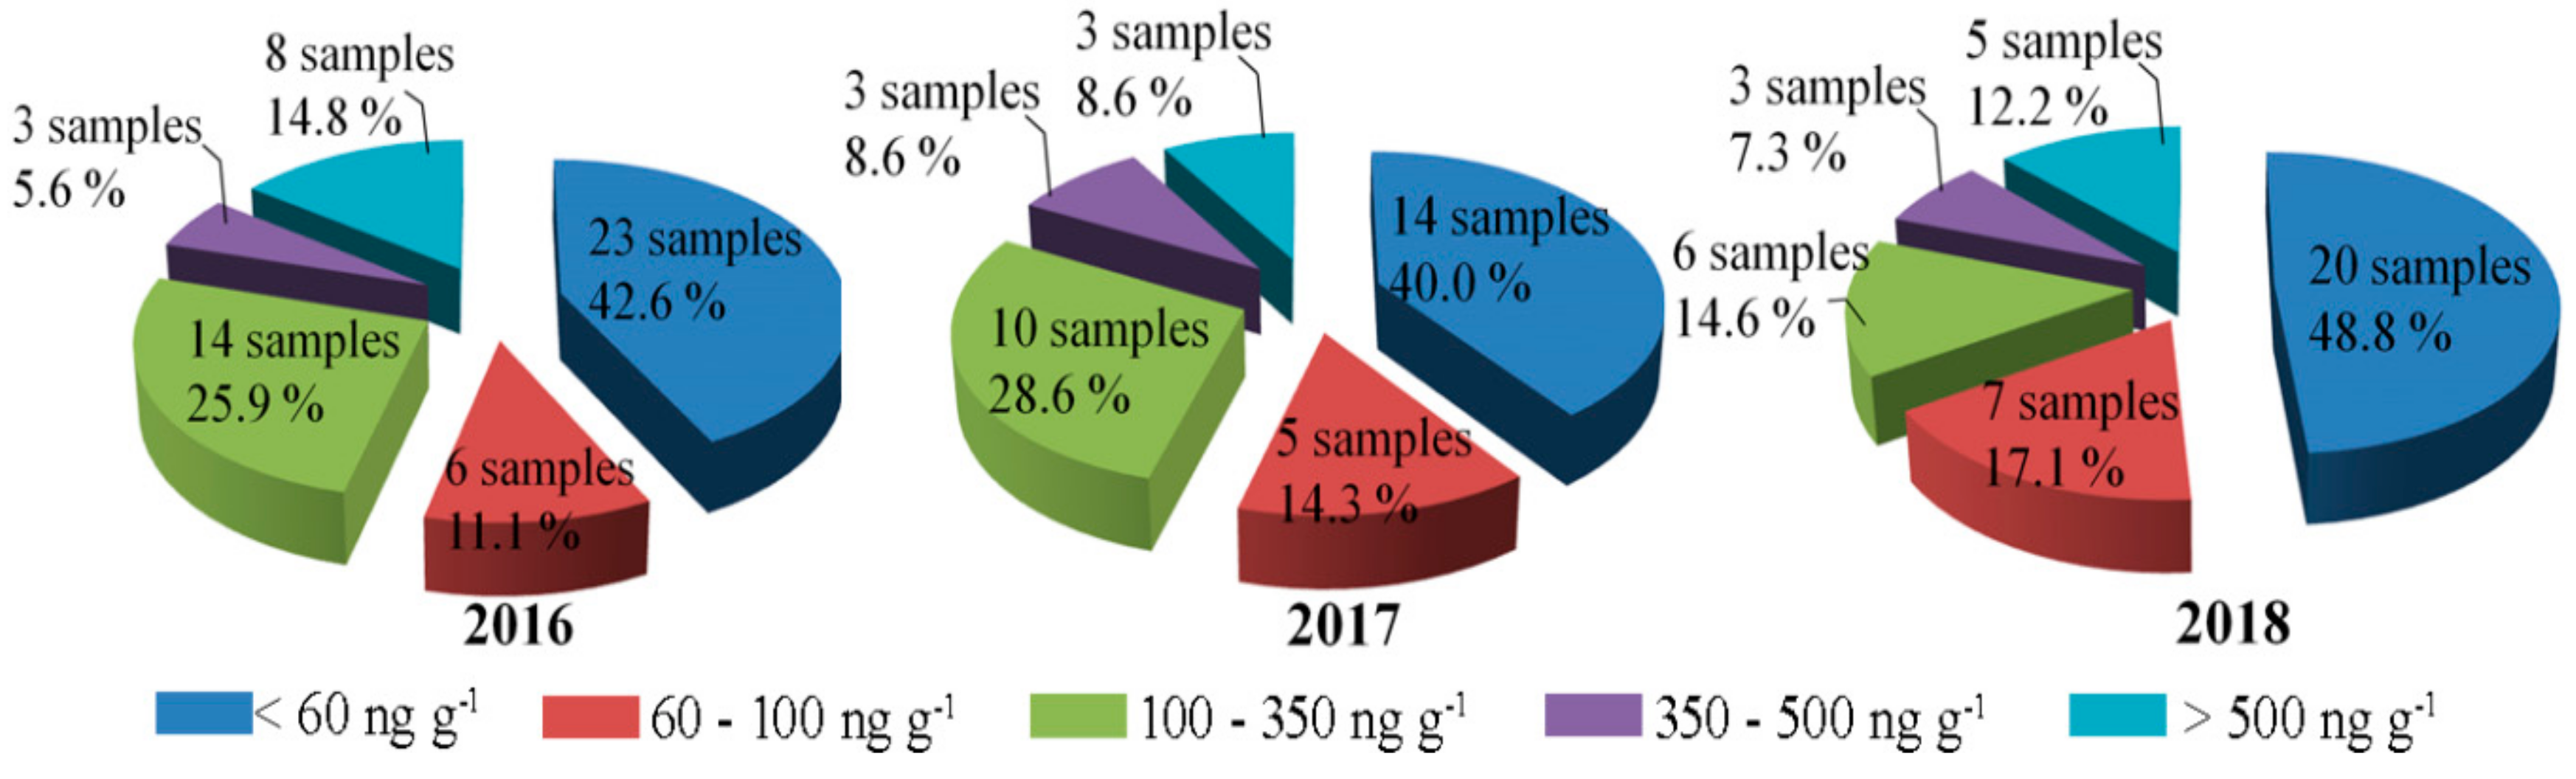
2.5. Contamination Levels of ZEN
3. Conclusions
4. Materials and Methods
4.1. Materials and Instruments
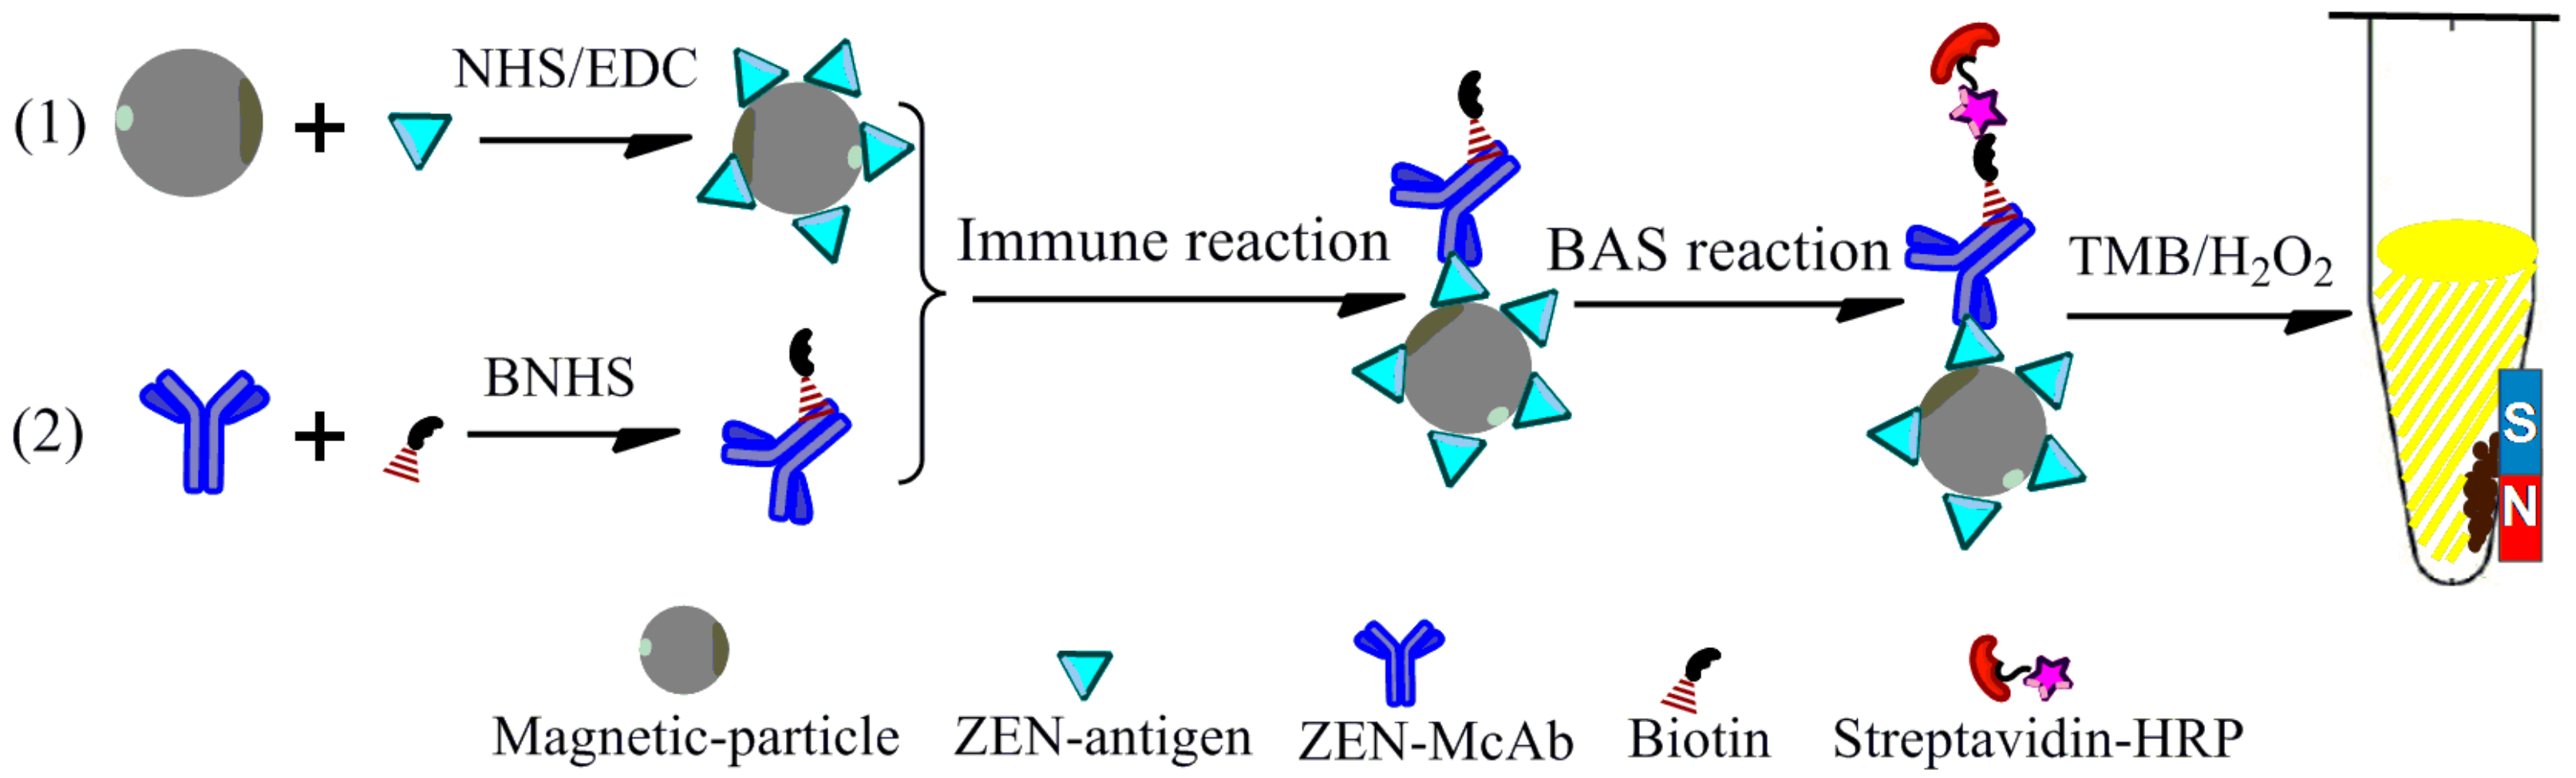
4.2. Preparation of Immunoprobe
4.3. Development and Evaluation of BAS-MBI
4.3.1. Procedures of BAS-MBI
4.3.2. Optimization and Standard Curve
4.3.3. Evaluation of BAS-MBI
4.4. Sample Collection, Pretreatment, and Detection
Author Contributions
Funding
Conflicts of Interest
References
- Yazar, S.; Omurtag, G.Z. Fumonisins, trichothecenes and zearalenone in cereals. Int. J. Mol. Sci. 2008, 9, 2062–2090. [Google Scholar] [CrossRef] [PubMed]
- Beloglazova, N.V.; Graniczkowska, K.; Ediage, E.N.; Averkieva, O.; Saeger, S.D. Sensitive flow-through immunoassay for rapid multiplex determination of cereal-borne mycotoxins in feed and feed ingredients. J. Agric. Food Chem. 2017, 65, 7131–7137. [Google Scholar] [CrossRef] [PubMed]
- Jiang, X.M.; Li, X.M.; Yang, Z.; Eremin, S.A.; Zhang, X.Y. Evaluation and optimization of three different immunoassays for rapid detection zearalenone in fodders. Food Anal. Methods 2017, 10, 256–262. [Google Scholar] [CrossRef]
- European Commission Regulation No. 1126/2007; Official Journal of the European Union: Brussels, Belgium, 2007.
- Zinedine, A.; Soriano, I.M.; Molto, I.C.; Manes, J. Review on the toxicity, occurrence, metabolism, detoxification, regulations and intake of zearalenone: An oestrogenic mycotoxin. Food Chem. Toxicol. 2007, 45, 1–18. [Google Scholar] [CrossRef] [PubMed]
- China National Standard No. GB 2761–2017; Ministry of Health of P. R. China: Beijing, China, 2017.
- Nuss, E.T.; Tanumihardjo, S.A. Maize: A paramount staple crop in the context of global nutrition. Compr. Rev. Food Sci. Food Saf. 2010, 9, 417–436. [Google Scholar] [CrossRef]
- Li, M.; Sun, M.N.; Hong, X.; Duan, J.S.; Du, D.L. Survey of deoxynivalenol contamination in agricultural products in the Chinese market using an ELISA kit. Toxins 2019, 11, 6. [Google Scholar] [CrossRef]
- Zhang, C.; Cui, H.Y.; Han, Y.F.; Yu, F.F.; Shi, X.M. Development of a biomimetic enzyme-linked immunosorbent assay based on molecularly imprinted polymers on paper for the detection of carbaryl. Food Chem. 2018, 240, 893–897. [Google Scholar] [CrossRef]
- Hou, Z.Z.; Zhuang, J.Y.; Ye, R.J.; Huang, Y.L. Pollution detection and distribution of zearalenone in chichen feed and raw materials. Cereal Feed Ind. 2018, 6, 46–49. [Google Scholar]
- Drzymala, S.S.; Weiz, S.; Heinze, J.; Marten, S.; Prinz, C.; Zimathies, A.; Garbe, L.A.; Koch, M. Automated solid-phase extraction coupled online with HPLC-FLD for the quantification of zearalenone in edible oil. Anal. Bioanal. Chem. 2015, 407, 3489–3497. [Google Scholar] [CrossRef]
- Romera, D.; Mateo, E.M.; Mateo-Castro, R.; Gómez, J.V.; Gimeno-Adelantado, J.V.; Jiménez, M. Determination of multiple mycotoxins in feedstuffs by combined use of UPLC-MS/MS and UPLC-QTOF-MS. Food Chem. 2018, 267, 140–148. [Google Scholar] [CrossRef]
- Li, C.L.; Deng, C.L.; Zhou, S.; Zhao, Y.F.; Wang, D.; Wang, X.D.; Gong, Y.Y.; Wu, Y.N. High-throughput and sensitive determination of urinary zearalenone and metabolites by UPLC-MS/MS and its application to a human exposure study. Anal. Bioanal. Chem. 2018, 410, 5301–5312. [Google Scholar] [CrossRef] [PubMed] [Green Version]
- Pei, S.C.; Lee, W.J.; Zhang, G.P.; Hu, X.F.; Eremin, S.A.; Zhang, L.J. Development of anti-zearalenone monoclonal antibody and detection of zearalenone in corn products from China by ELISA. Food Control 2013, 31, 65–70. [Google Scholar] [CrossRef]
- Wang, D.; Zhang, Z.W.; Wang, Z.Z.; Zhang, W.; Yu, L.; Li, H.; Jiang, J.; Li, P.W. Rapid and sensitive double-label based immunochromatographic assay for zearalenone detection in cereals. Electrophoresis 2018, 39, 2125–2130. [Google Scholar] [CrossRef] [PubMed]
- Suzuki, T.; Munakata, Y.; Morita, K.; Shinoda, T.; Ueda, H. Sensitive detection of estrogenic mycotoxin zearalenone by open sandwich immunoassay. Anal. Sci. 2007, 23, 65–70. [Google Scholar] [CrossRef] [PubMed]
- Ren, K.W.; Wu, J.; Zhang, Y.; Yan, F.; Ju, H.X. Proximity hybridization regulated DNA biogate for sensitive electrochemical immunoassay. Anal. Chem. 2014, 86, 7494–7499. [Google Scholar] [CrossRef] [PubMed]
- Zhan, S.N.; Huang, X.L.; Chen, R.; Li, J.; Xiong, Y.H. Novel fluorescent ELISA for the sensitive detection of zearalenone based on H2O2-sensitive quantum dots for signal transduction. Talanta 2016, 158, 51–56. [Google Scholar] [CrossRef] [PubMed]
- Li, M.; Cui, Y.; Liu, Z.J.; Xue, Y.L.; Zhao, R.J.; Li, Y.; Du, D.L. Sensitive and selective determination of butyl benzyl phthalate from environmental samples using an enzyme immunoassay. Sci. Total Environ. 2019, 687, 849–857. [Google Scholar] [CrossRef]
- Burmistrova, N.A.; Goryacheva, I.Y.; Basova, E.Y.; Franki, A.S.; Elewaut, D.; Beneden, K.V.; Deforce, D.; Peteghem, C.V.; Saeger, S.D. Application of a new anti-zearalenone monoclonal antibody in different immunoassay formats. Anal. Bioanal. Chem. 2009, 395, 1301–1307. [Google Scholar] [CrossRef]
- Wang, Y.K.; Yan, Y.X.; Ji, W.H.; Wang, H.A.; Zou, Q.; Sun, J.H. Novel chemiluminescence immunoassay for the determination of zearalenone in food samples using gold nanoparticles labeled with streptavidin-horseradish peroxidase. J. Agric. Food Chem. 2013, 61, 4250–4256. [Google Scholar] [CrossRef]
- Chun, H.S.; Choi, E.H.; Chang, H.J.; Choi, S.W.; Eremin, S.A. A fluorescence polarization immunoassay for the detection of zearalenone in corn. Anal. Chim. Acta 2009, 639, 83–89. [Google Scholar] [CrossRef]
- Kolosova, A.Y.; Saeger, S.D.; Sibanda, L.; Verheijen, R.; Peteghem, C.V. Development of a colloidal gold-based lateral-flow immunoassay for the rapid simultaneous detection of zearalenone and deoxynivalenol. Anal. Bioanal. Chem. 2007, 389, 2103–2107. [Google Scholar] [CrossRef]
- Wang, Y.K.; Yan, Y.X.; Mao, Z.W.; Wang, H.A.; Zou, Q.; Hao, Q.W.; Ji, W.H.; Sun, J.H. Highly sensitive electrochemical immunoassay for zearalenone in grain and grain-based food. Microchim. Acta 2013, 180, 187–193. [Google Scholar] [CrossRef]
- He, Q.H.; Xu, Y.; Huang, Y.H.; Liu, R.R.; Huang, Z.B.; Li, Y.P. Phage-displayed peptides that mimic zearalenone and its application in immunoassay. Food Chem. 2011, 126, 1312–1315. [Google Scholar] [CrossRef]
- Shim, W.B.; Mun, H.; Joung, H.A.; Ofori, J.A.; Chung, D.H.; Kim, M.G. Chemiluminescence competitive aptamer assay for the detection of aflatoxin B1 in corn samples. Food Control 2014, 36, 30–35. [Google Scholar] [CrossRef]
- Hendrickson, O.D.; Chertovich, J.O.; Zherdev, A.V.; Sveshnikov, P.G.; Dzantiev, B.B. Ultrasensitive magnetic ELISA of zearalenone with pre-concentration and chemiluminescent detection. Food Control 2018, 84, 330–338. [Google Scholar] [CrossRef]
- Zhang, Y.Y.; Li, M.; Hong, X.; Cui, Y.; Du, D.L. Using of tyramine signal amplification strategy to improve the sensitivity of ELISA for aflatoxin B1 in edible oil samples. Food Anal. Methods 2018, 11, 2553–2560. [Google Scholar] [CrossRef]
- Li, M.; Zhang, Y.Y.; Zhao, R.J.; Liu, Z.J.; Hong, X.; Cui, Y.; Xue, Y.L.; Du, D.L. Immunomagnetic bead-based biotin-streptavidin system for highly efficient detection of aflatoxin B1 in agricultural products. RSC. Adv. 2018, 8, 26029–26035. [Google Scholar] [CrossRef]
- Zhang, B.; Li, H.H.; Pan, W.X.; Chen, Q.S.; Ouyang, Q.; Zhao, J.W. Dual-color upconversion nanoparticles (UCNPs)-based fluorescent immunoassay probes for sensitive sensing foodborne pathogens. Food Anal. Methods 2017, 10, 2036–2045. [Google Scholar] [CrossRef]
- Ren, K.W.; Wu, J.; Yan, F.; Zhang, Y.; Ju, H.X. Immunoreaction-triggered DNA assembly for one-step sensitive ratiometric electrochemical biosensing of protein biomarker. Biosens. Bioelectron. 2015, 66, 345–349. [Google Scholar] [CrossRef]
- Ji, F.; Li, H.; Xu, J.H.; Shi, J.R. Enzyme-linked immunosorbent-assay for deoxynivalenol (DON). Toxins 2011, 3, 968–978. [Google Scholar] [CrossRef]
- Fang, Q.K.; Wang, L.M.; Cheng, Q.; Wang, Y.L.; Wang, S.Y.; Cai, J.; Liu, F.Q. Quantitative determination of butocarboxim in agricultural products based on biotinylated monoclonal antibody. Food Anal. Methods 2015, 8, 1248–1257. [Google Scholar] [CrossRef]
- Zeng, K.; Wei, W.; Jiang, L.; Zhu, F.; Du, D.L. Use of carbon nanotubes as a solid support to establish quantitative (centrifugation) and qualitative (filtration) immunoassays to detect gentamicin contamination in commercial milk. J. Agric. Food Chem. 2016, 64, 7874–7881. [Google Scholar] [CrossRef]
- Li, M.; Zhang, Y.Y.; Xue, Y.L.; Hong, X.; Cui, Y.; Liu, Z.J.; Du, D.L. Simultaneous determination of β2-agonists clenbuterol and salbutamol in water and swine feed samples by dual-labeled time-resolved fluoroimmunoassay. Food Control 2017, 73, 1039–1044. [Google Scholar] [CrossRef]
- Wang, Z.Y.; Cai, R. Market price fluctuation and yield prediction of corn in China under the background of supply-side reform. Food Econ. Res. 2018, 4, 77–86. [Google Scholar]
- Ji, J.; Zhu, P.; Cui, F.C.; Pi, F.W.; Zhang, Y.Z.; Li, Y.; Wang, J.S.; Sun, X.L. The antagonistic effect of mycotoxins deoxynivalenol and zearalenone on metabolic profiling in serum and liver of mice. Toxins 2017, 9, 28. [Google Scholar] [CrossRef]


| Factor | Parameter | Factor | Parameter |
|---|---|---|---|
| Magnetic antigen probe | 1:8000 (0.8 ng mL−1) | Methanol (v/v, %) | 5 |
| Biotinylated antibody probe | 1:40,000 (0.15 ng mL−1) | Na+ (mol L−1) | 0.5 |
| Streptavidin–HRP | 1:38,000 (26.3 ng mL−1) | pH value | 7.4 |
| Year | Item | All | Corn | Corn Products | Swine Feed |
|---|---|---|---|---|---|
| 2016 | Total sample | 133 | 56 | 48 | 29 |
| Positive sample | 54 | 14 | 18 | 22 | |
| Positive rate (%) | 40.6 | 25.0 | 37.5 | 75.9 | |
| ZEN range (ng g−1) | 1.8–1100.0 | 1.8–950.4 | 2.3–958.1 | 8.8–1100.0 | |
| Average ZEN (ng g−1) | 217.9 | 144.1 | 315.0 | 185.4 | |
| 2017 | Total sample | 143 | 48 | 23 | 72 |
| Positive sample | 35 | 11 | 11 | 13 | |
| Positive rate (%) | 24.5 | 22.9 | 47.8 | 18.0 | |
| ZEN range (ng g−1) | 1.1–722.6 | 1.1–468.5 | 9.4–722.6 | 13.1–652.1 | |
| Average ZEN (ng g−1) | 166.7 | 87.2 | 205.3 | 201.3 | |
| 2018 | Total sample | 129 | 26 | 35 | 68 |
| Positive sample | 41 | 7 | 19 | 15 | |
| Positive rate (%) | 31.8 | 26.9 | 54.3 | 22.0 | |
| ZEN range (ng g−1) | 1.3–947.8 | 1.3–76.8 | 1.4–947.8 | 5.6–567.0 | |
| Average ZEN (ng g−1) | 157.0 | 24.1 | 176.7 | 193.9 |
© 2019 by the authors. Licensee MDPI, Basel, Switzerland. This article is an open access article distributed under the terms and conditions of the Creative Commons Attribution (CC BY) license (http://creativecommons.org/licenses/by/4.0/).
Share and Cite
Li, M.; Yang, C.; Mao, Y.; Hong, X.; Du, D. Zearalenone Contamination in Corn, Corn Products, and Swine Feed in China in 2016–2018 as Assessed by Magnetic Bead Immunoassay. Toxins 2019, 11, 451. https://0-doi-org.brum.beds.ac.uk/10.3390/toxins11080451
Li M, Yang C, Mao Y, Hong X, Du D. Zearalenone Contamination in Corn, Corn Products, and Swine Feed in China in 2016–2018 as Assessed by Magnetic Bead Immunoassay. Toxins. 2019; 11(8):451. https://0-doi-org.brum.beds.ac.uk/10.3390/toxins11080451
Chicago/Turabian StyleLi, Ming, Chuqin Yang, Yuhao Mao, Xia Hong, and Daolin Du. 2019. "Zearalenone Contamination in Corn, Corn Products, and Swine Feed in China in 2016–2018 as Assessed by Magnetic Bead Immunoassay" Toxins 11, no. 8: 451. https://0-doi-org.brum.beds.ac.uk/10.3390/toxins11080451