The Effect of Low and High Dose Deoxynivalenol on Intestinal Morphology, Distribution, and Expression of Inflammatory Cytokines of Weaning Rabbits

Abstract
:1. Introduction
2. Results
2.1. Production Performance of Weaning Rabbits
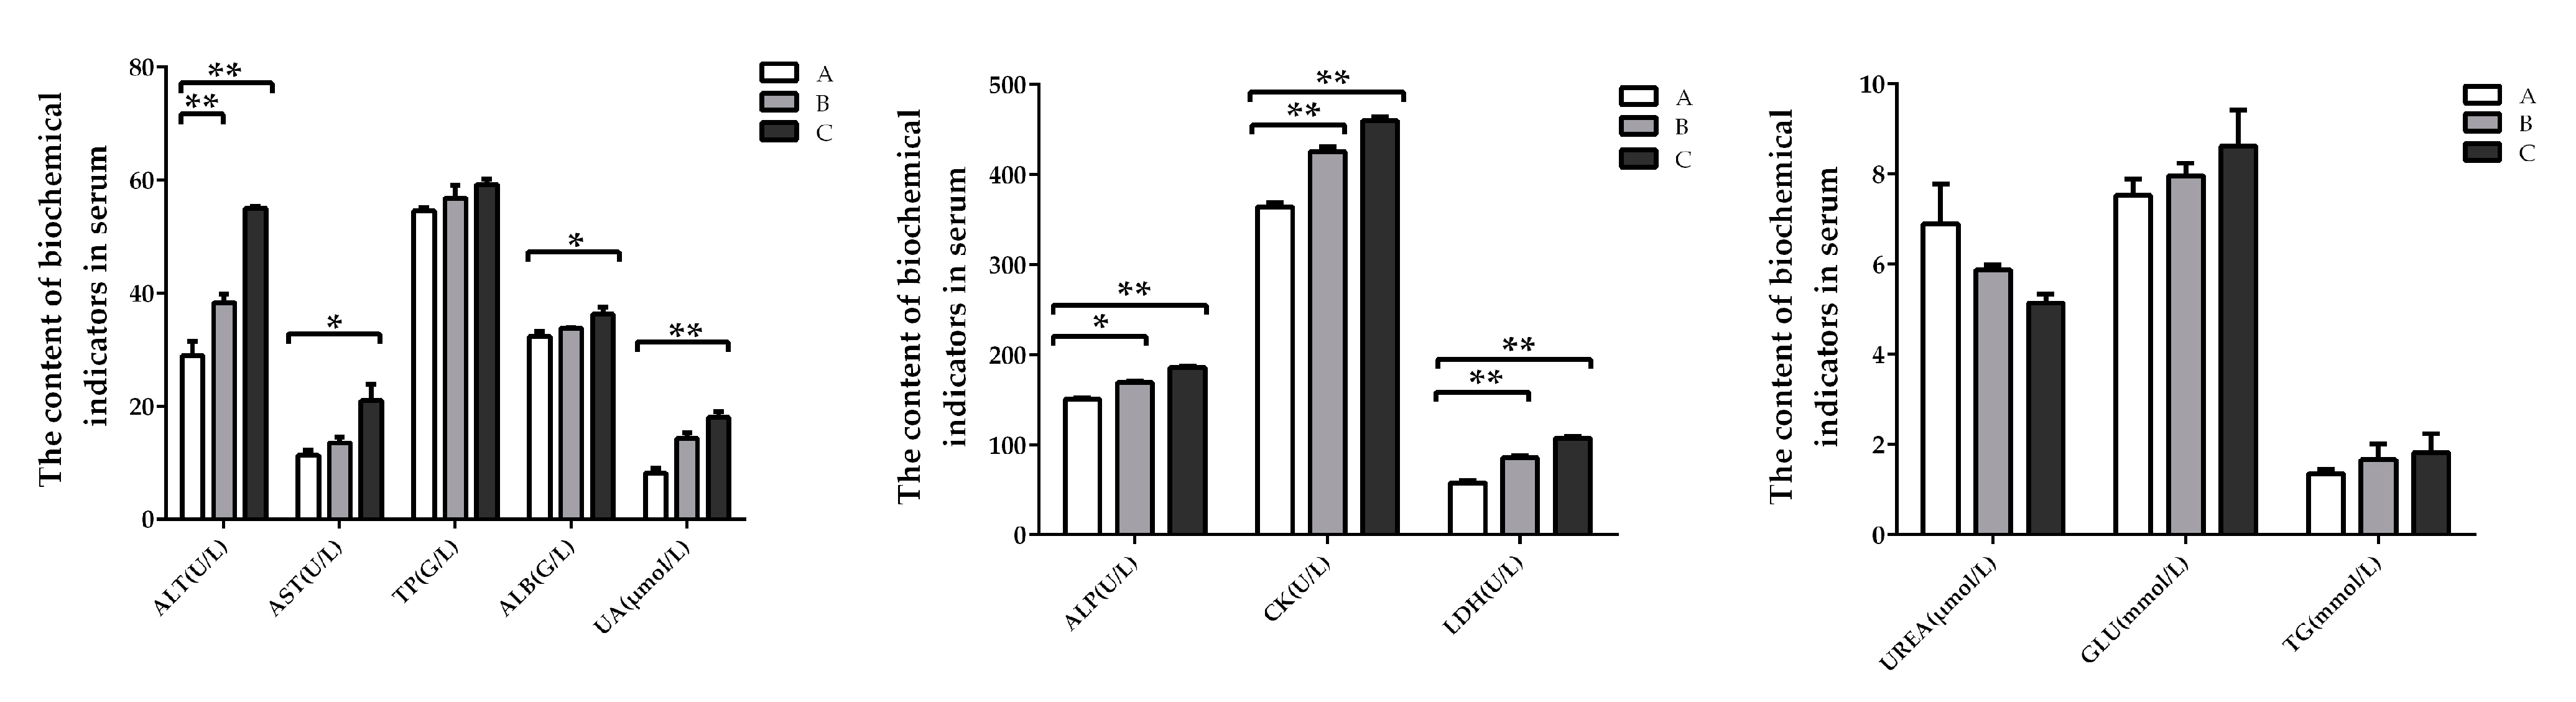
2.2. Biochemistry Factors in Serum of Weaning Rabbits
2.3. The Immunoglobulin Concentration in Serum of Weaning Rabbits
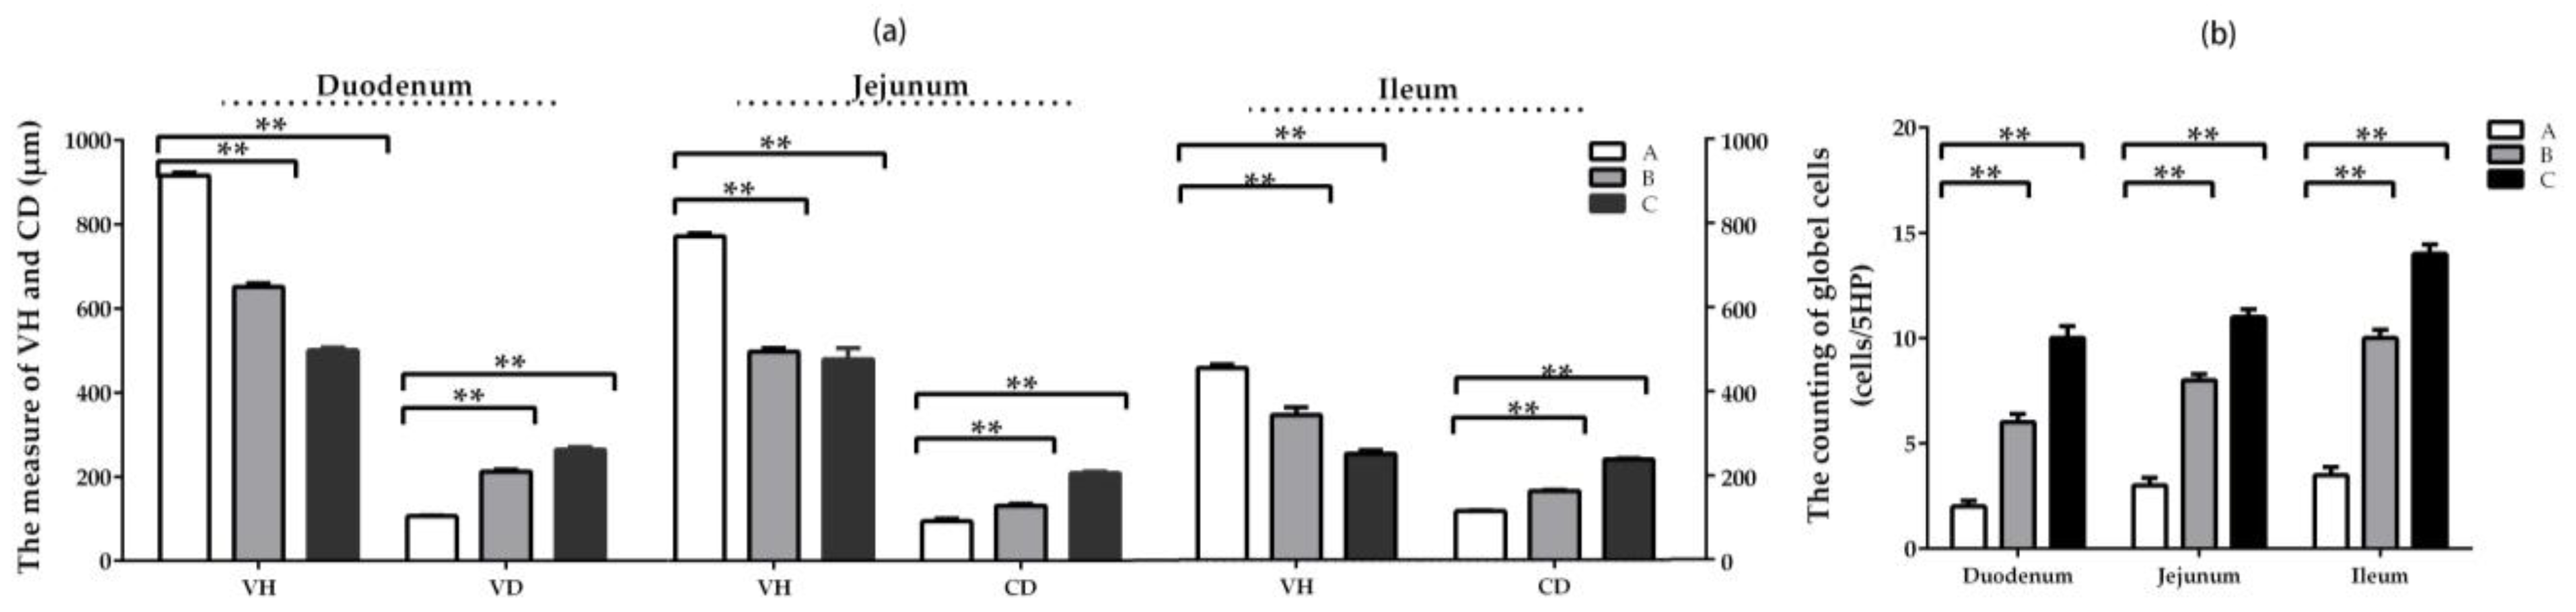
2.4. Intestinal Histomorphology of Weaning Rabbits
2.5. The Expression and Distribution of Inflammatory Factors
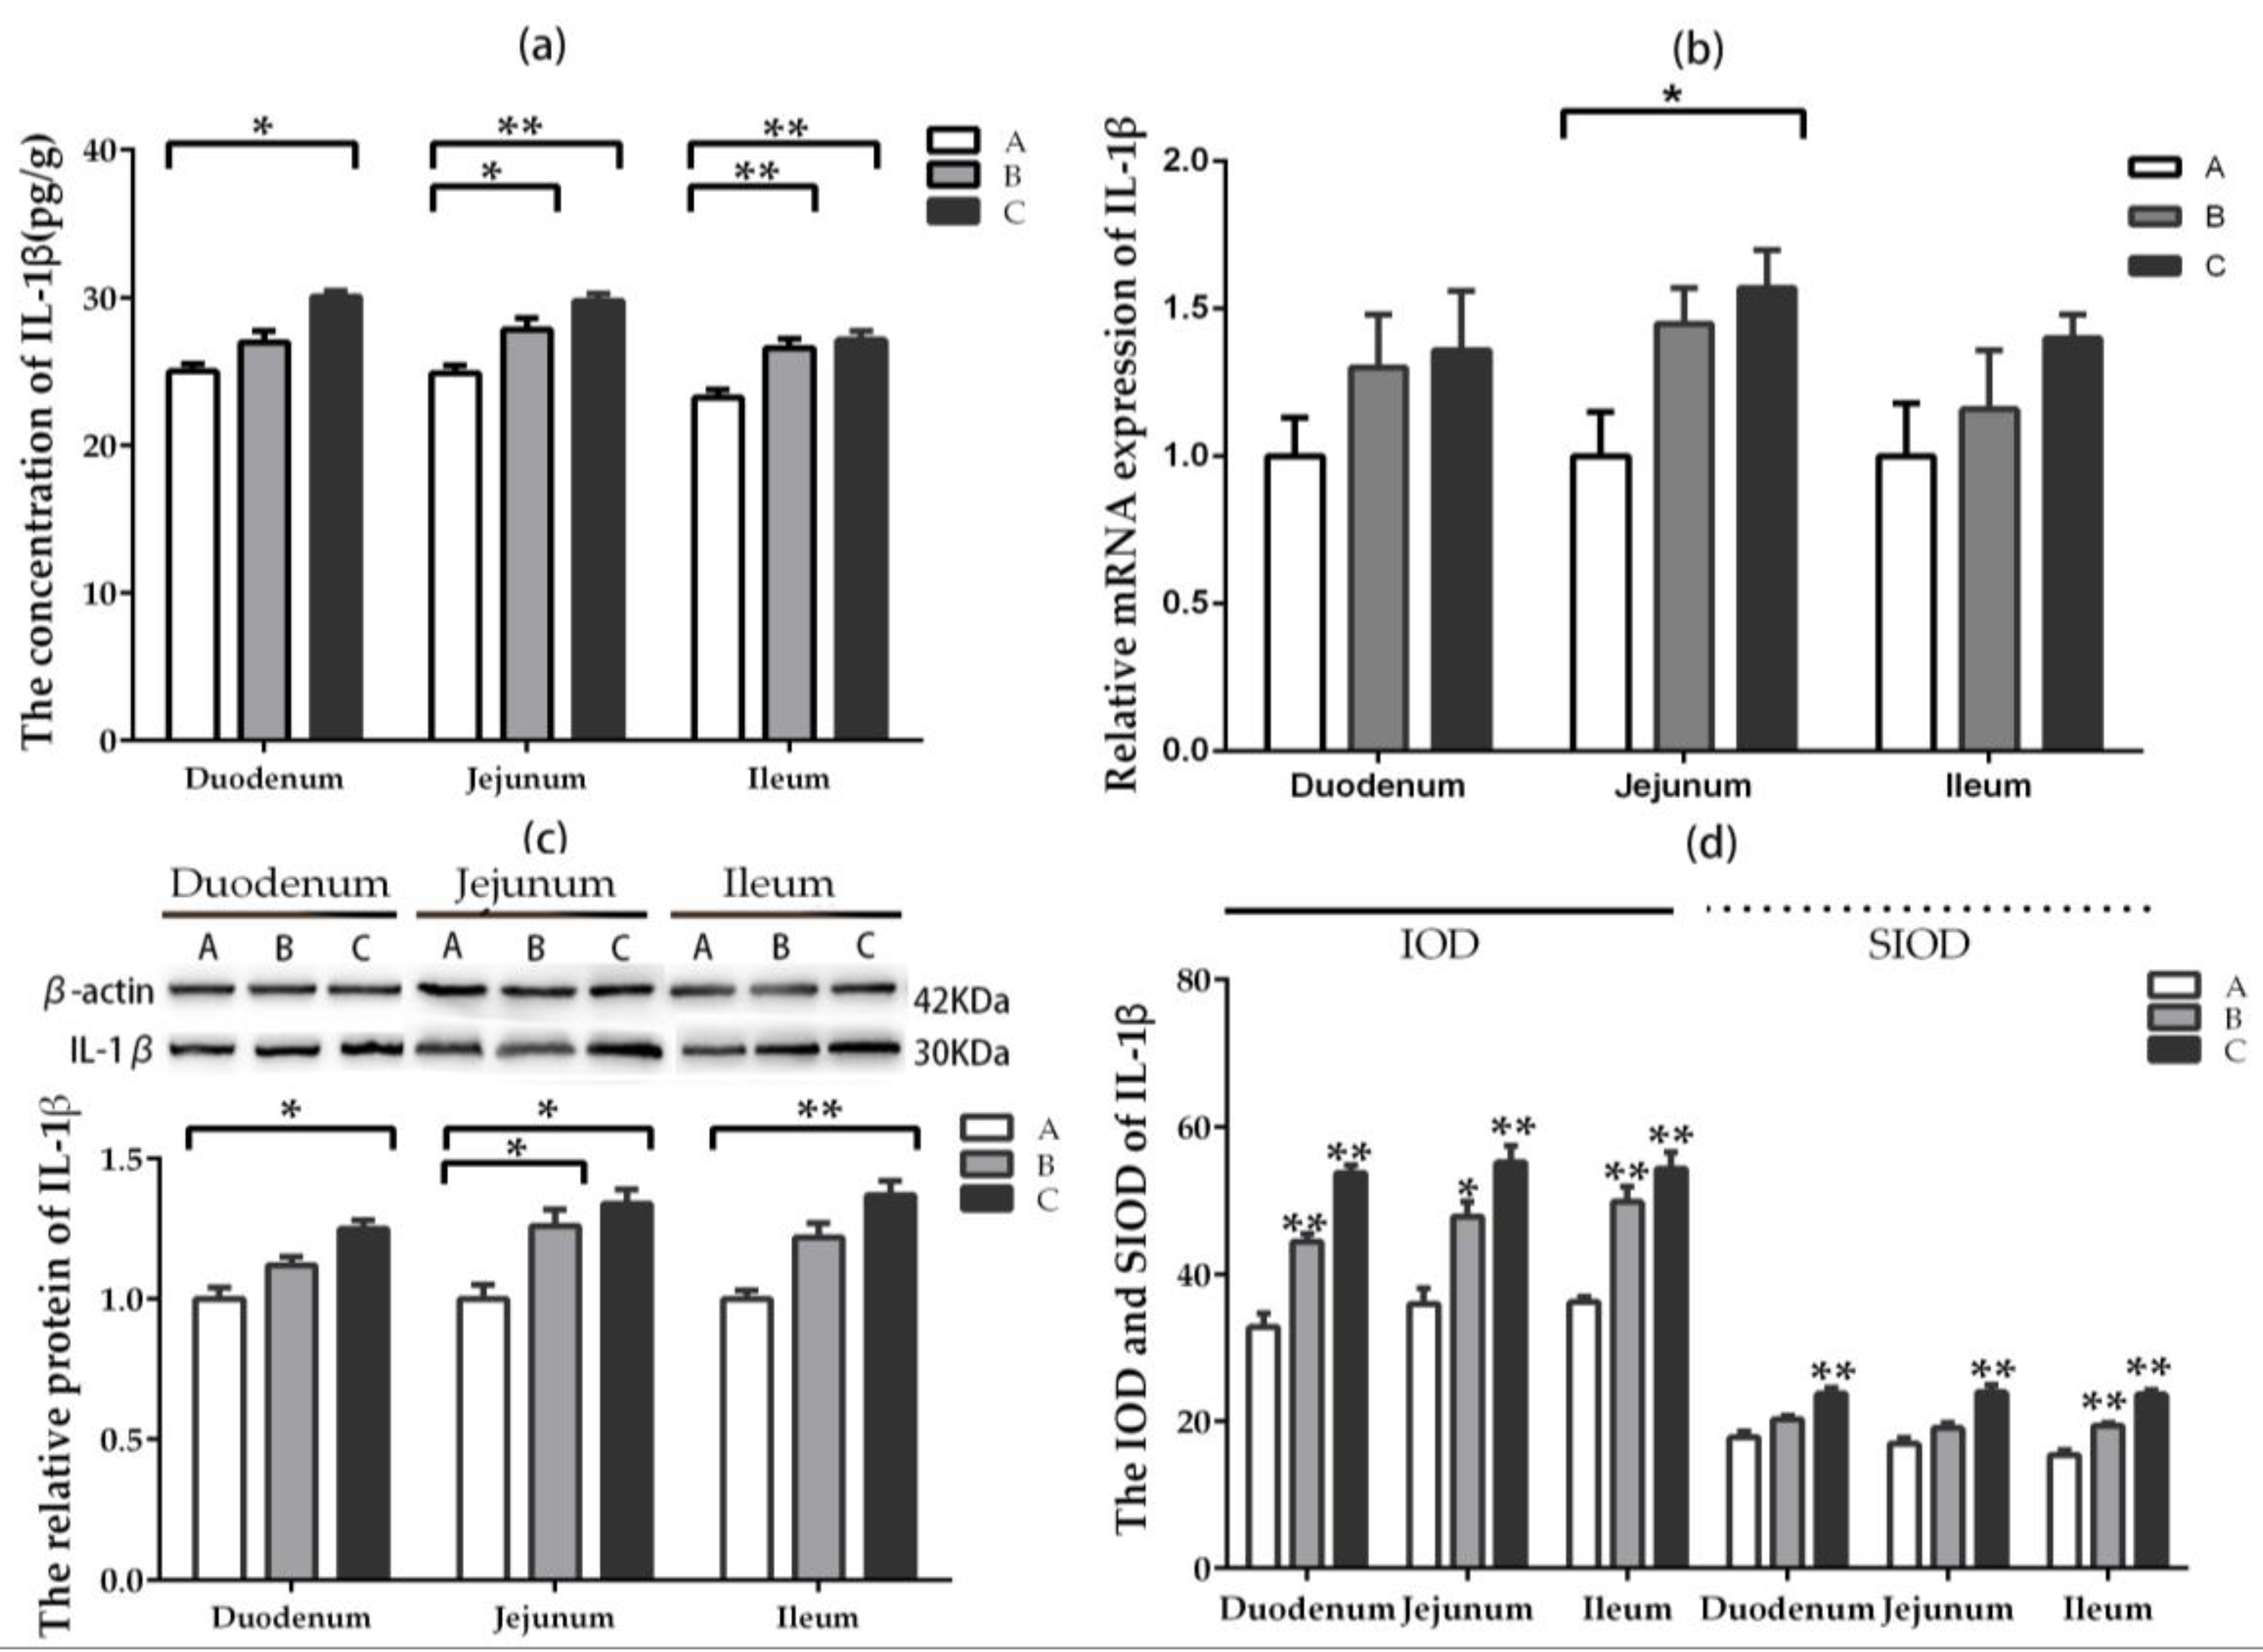
2.5.1. IL-1β
2.5.2. IL-2
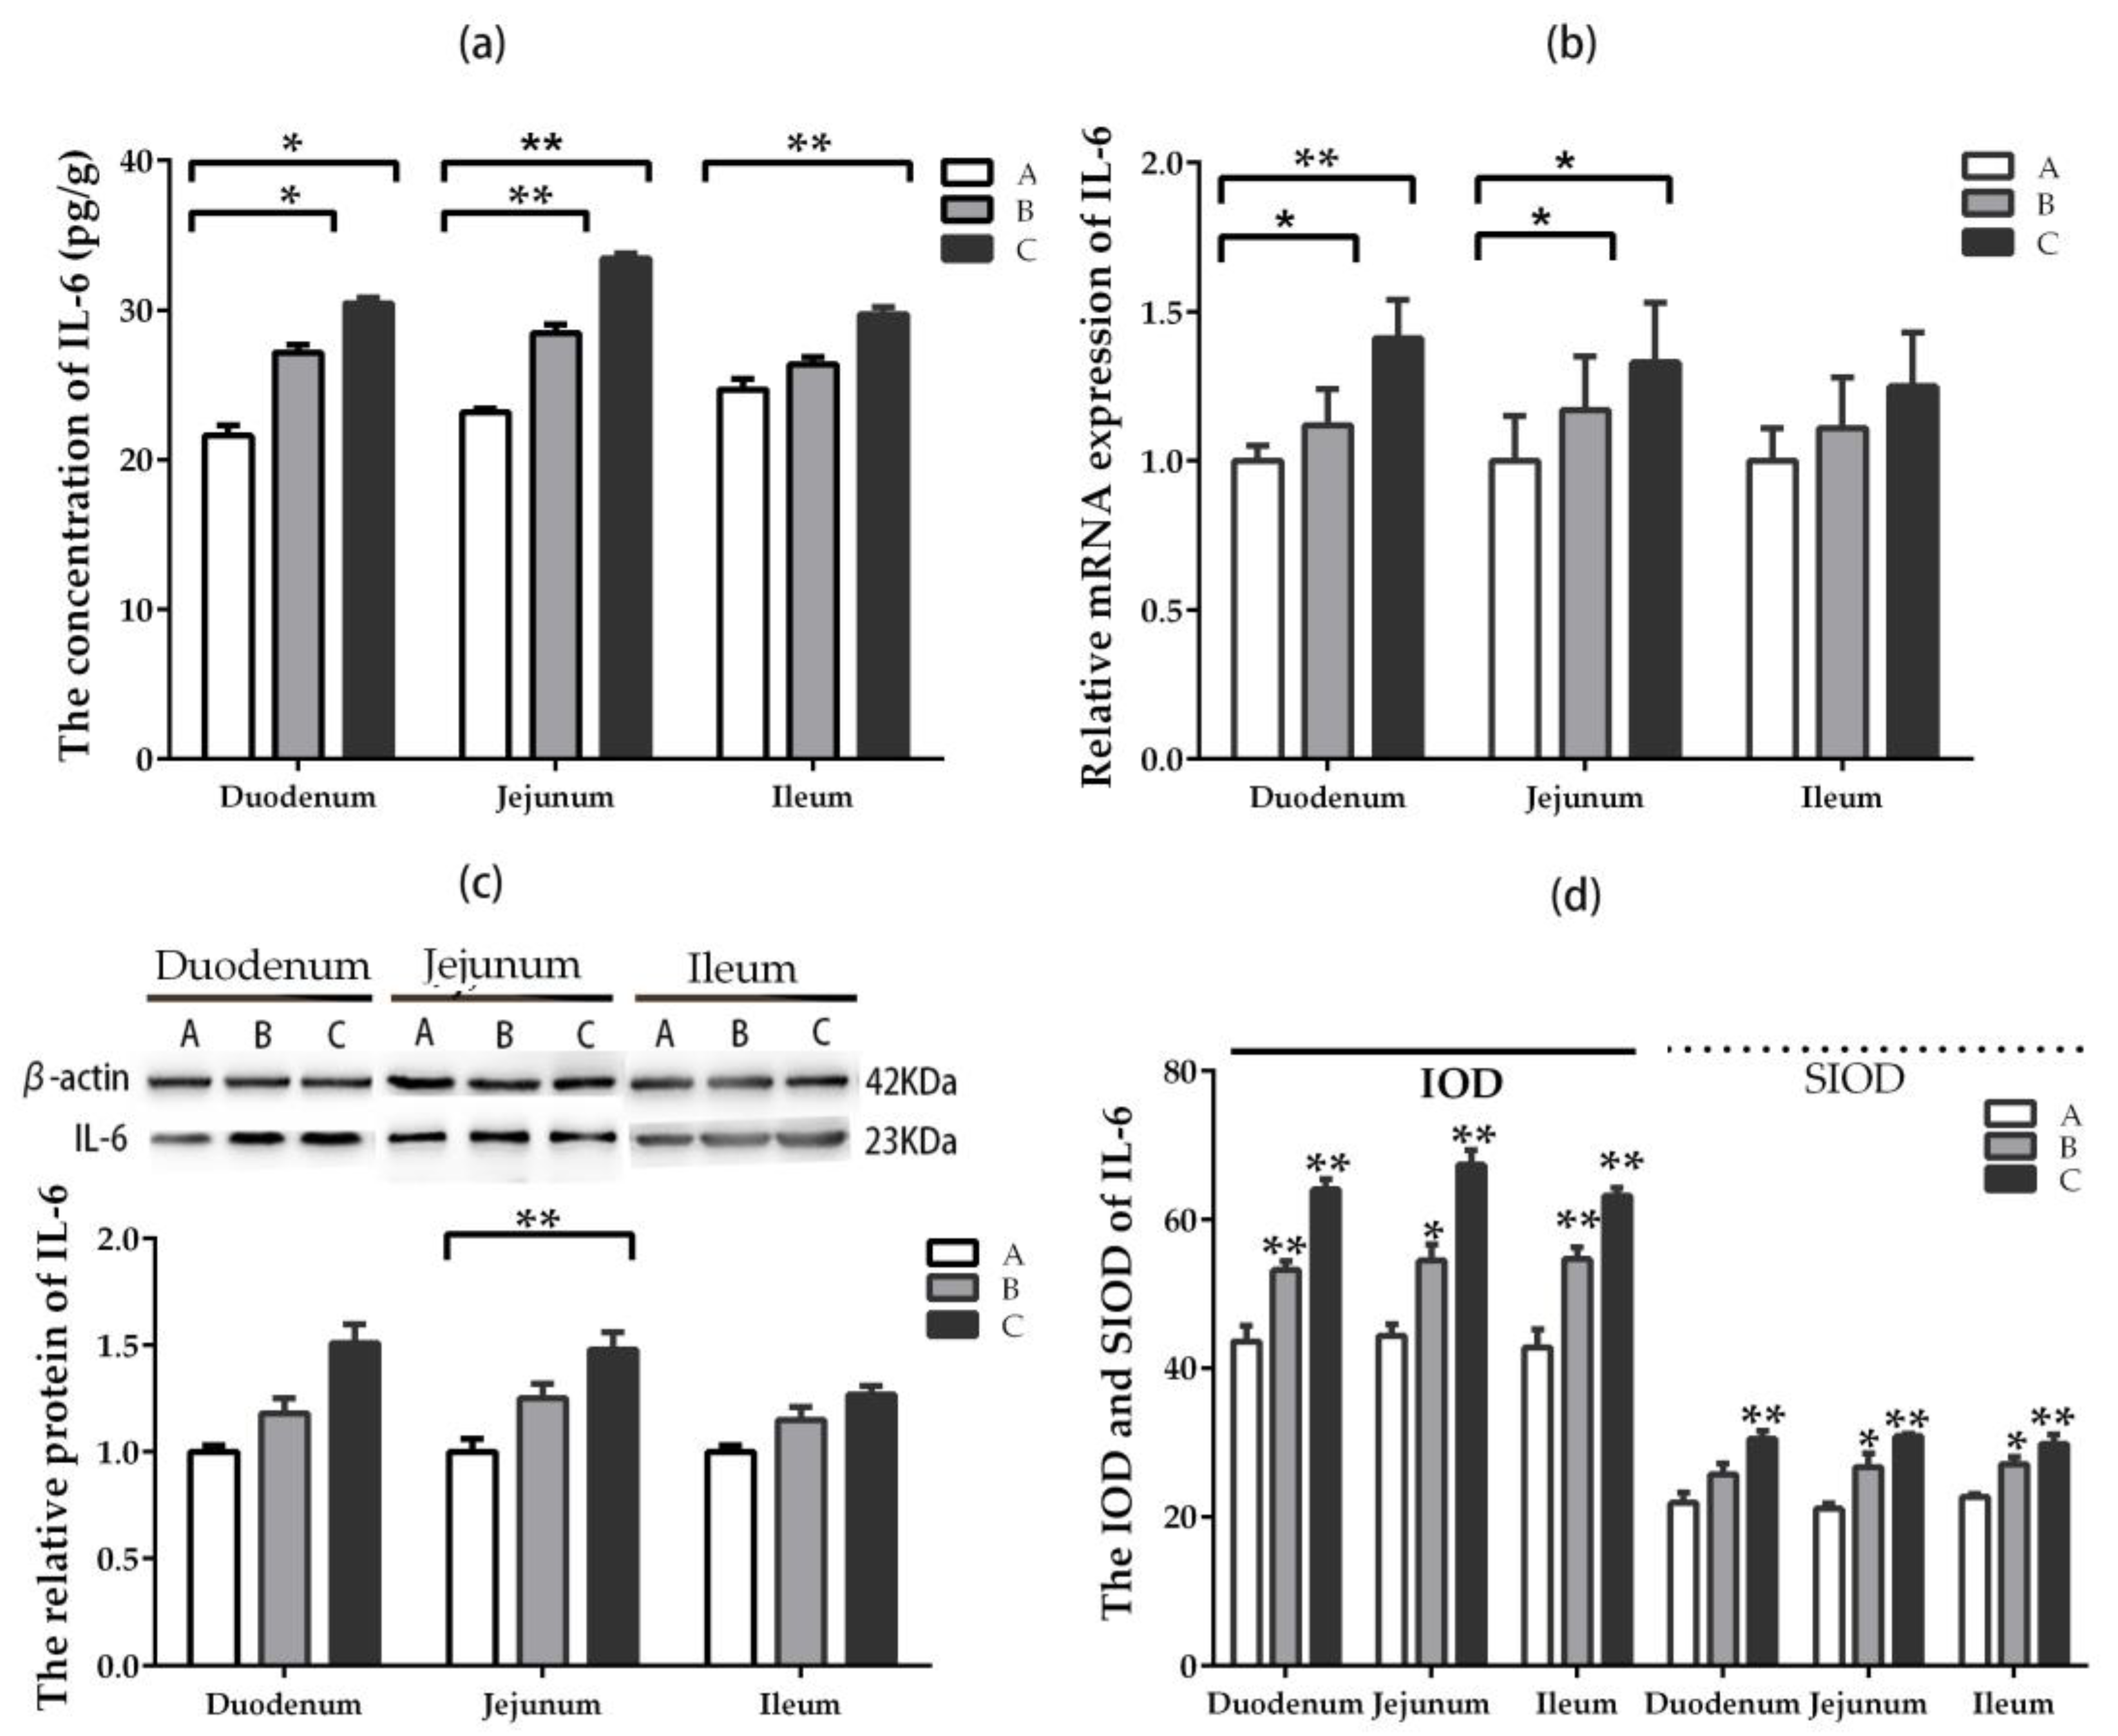
2.5.3. IL-6
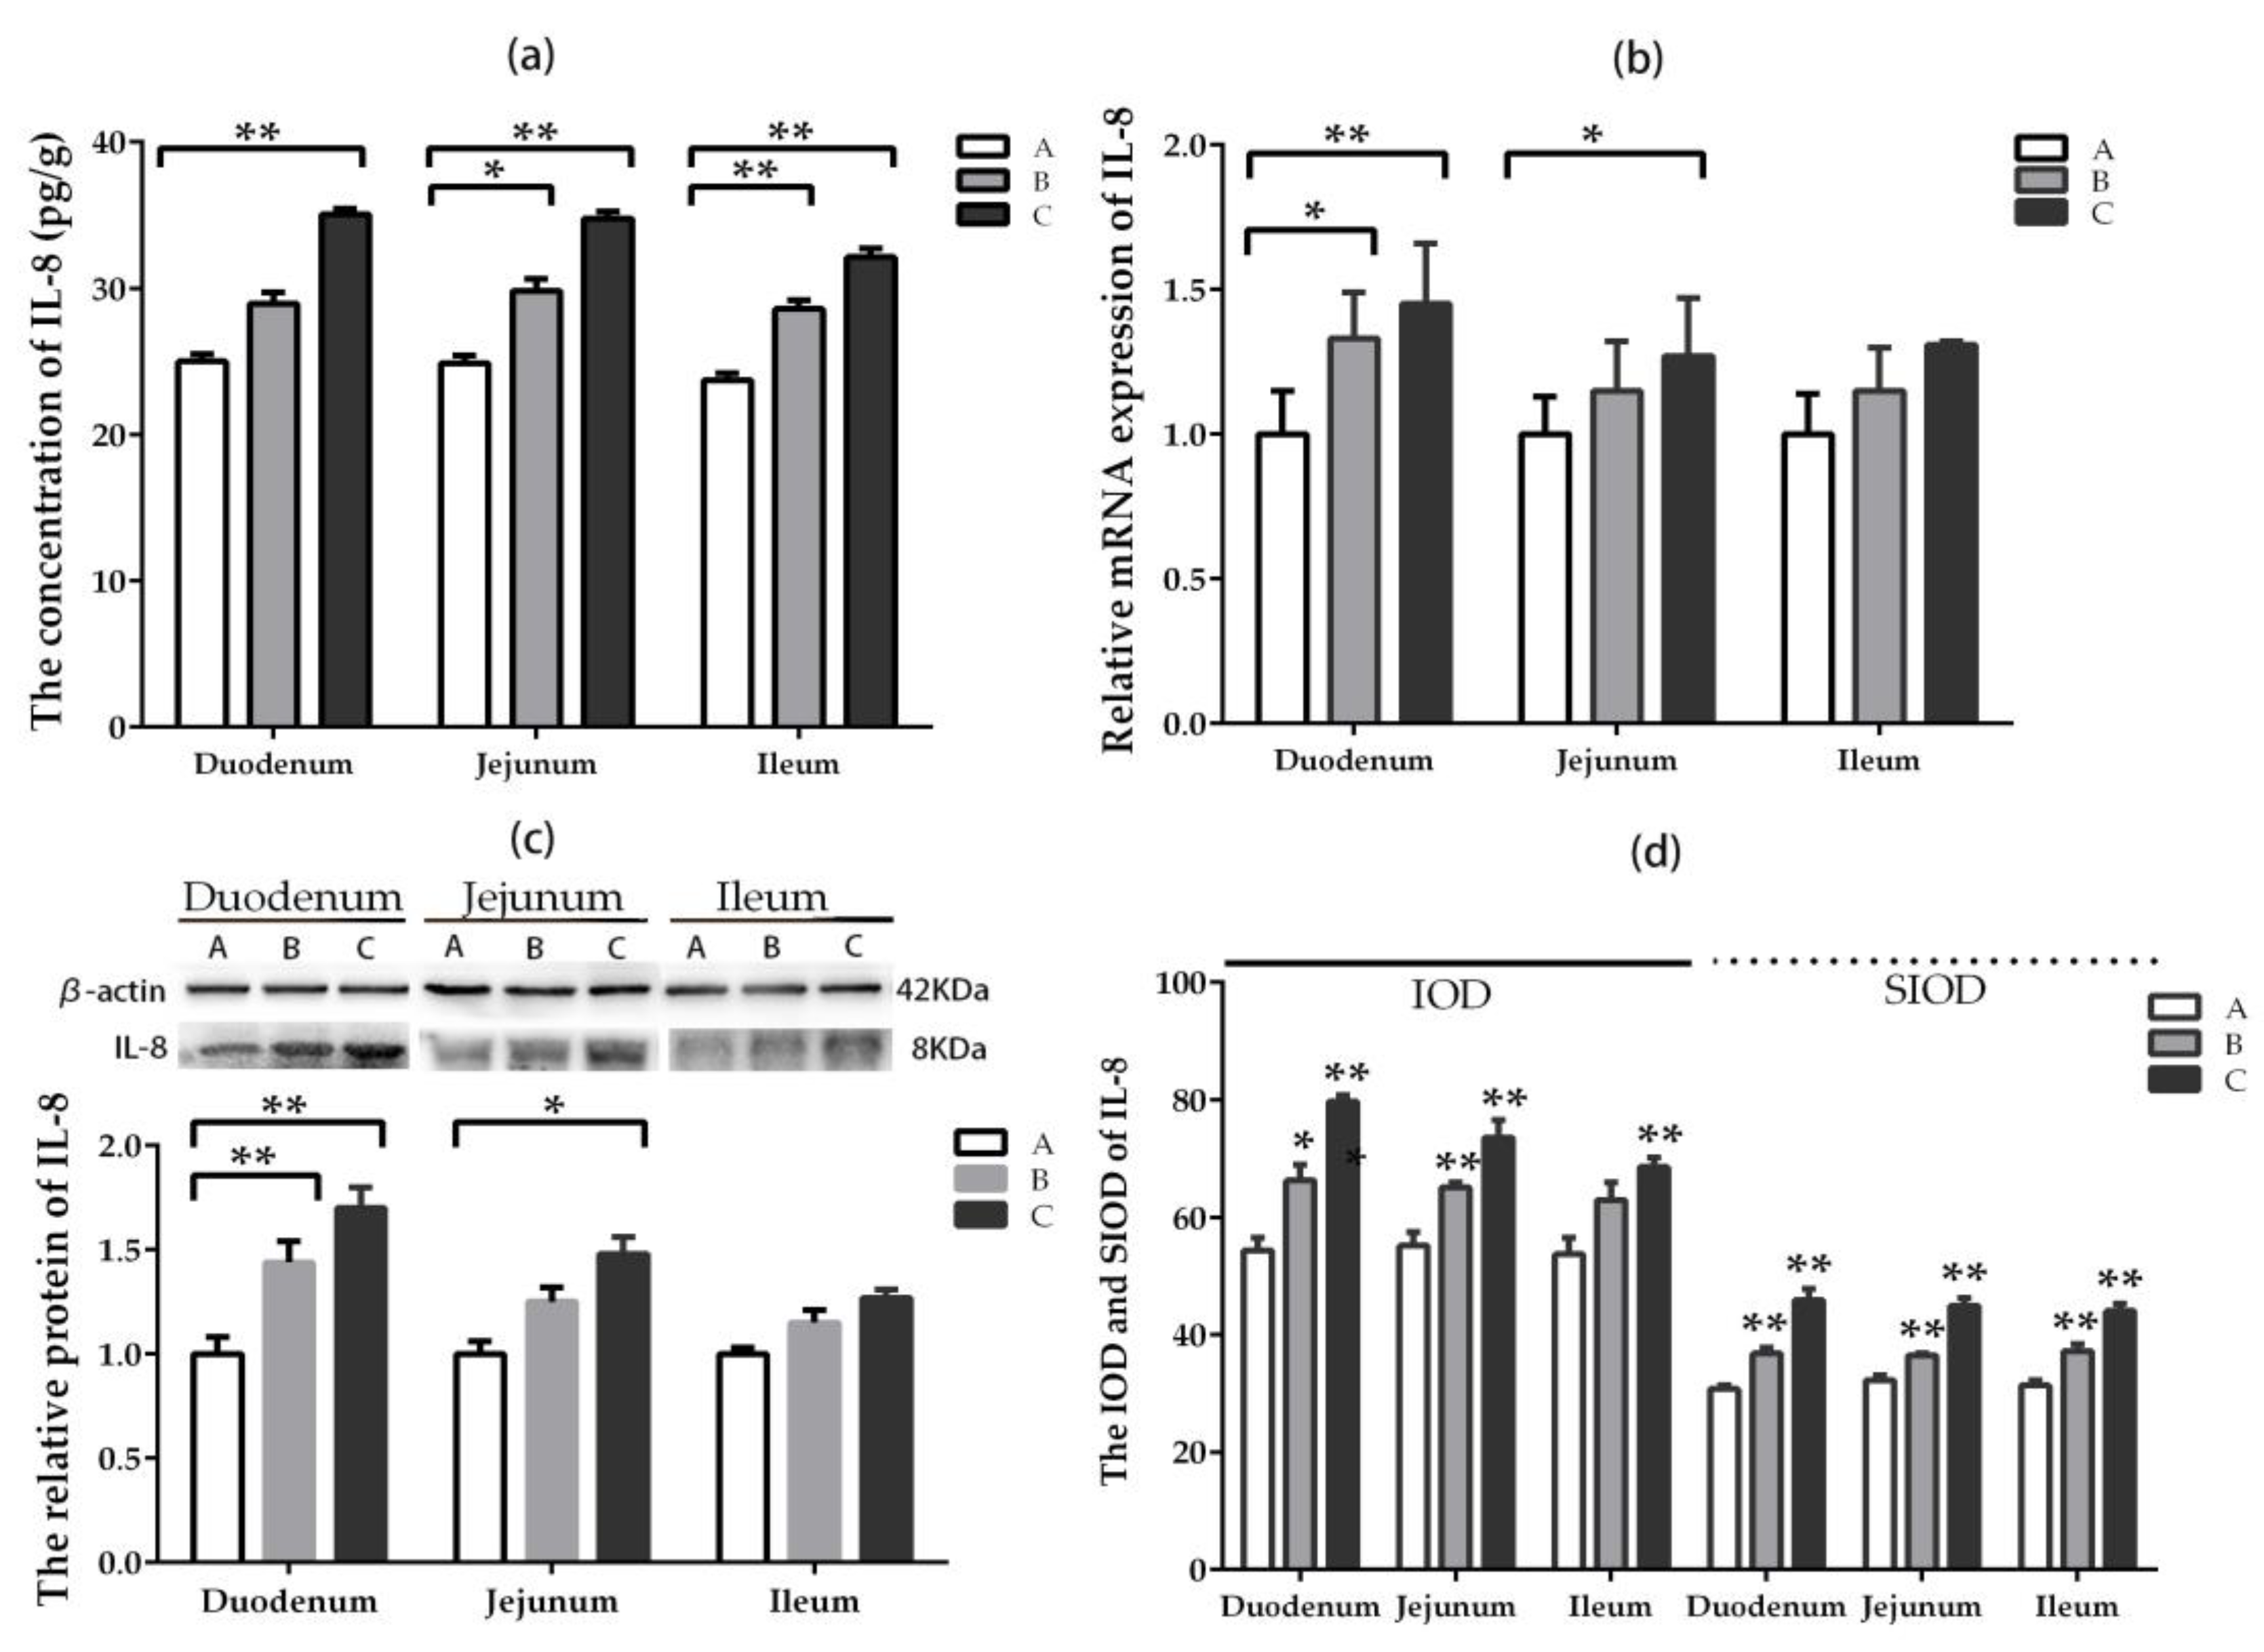
2.5.4. IL-8
3. Discussion
3.1. The Toxicity of DON and Animal Species
3.2. DON and Intestinal Morphology
3.3. DON and Inflammatory Factors
4. Conclusions
5. Materials and Methods
5.1. Ethics Statement
5.2. Diets, Animals, and Sampling
5.3. Biochemical Analysis
5.4. ELISA
5.5. Intestinal Morphology
5.6. Goblet Cells
5.7. Immunohistochemistry (IHC) of Intestinal Samples
5.8. Western Blot
5.9. qRT-PCR
5.10. Statistics
Supplementary Materials
Author Contributions
Funding
Acknowledgments
Conflicts of Interest
References
- Rohweder, D.; Kersten, S.; Valenta, H.; Sondermann, S.; Schollenberger, M.; Drochner, W.; Dänicke, S. Bioavailability of the Fusarium toxin deoxynivalenol (DON) from wheat straw and chaff in pigs. Arch. Anim. Nutr. 2013, 67, 37–47. [Google Scholar] [CrossRef] [PubMed]
- Almeida, A.P.; Shundo, L.; Silva, S.A.; Navas, S.A.; Alaburda, J.; Ruvieri, V.; Sabino, M. Occurrence of deoxynivalenol in wheat flour, instant noodle and biscuits commercialised in Brazil. Food Addit. Contam. Part B Surveill. 2016, 9, 251–255. [Google Scholar] [CrossRef] [PubMed]
- Streit, E.; Schatzmayr, G.; Tassis, P.; Tzika, E.; Marín, D.; Taranu, I.; Tabuc, C.; Nicolau, A.; Aprodu, I.; Puel, O.; et al. Current Situation of Mycotoxin Contamination and Co-occurrence in Animal Feed—Focus on Europe. Toxins 2012, 4, 788–809. [Google Scholar] [CrossRef] [PubMed]
- Payros, D.; Dobrindt, U.; Martin, P.; Secher, T.; Bracarense, A.P.F.L.; Boury, M.; Laffitte, J.; Pinton, P.; Oswald, E.; Oswald, I.P. The Food Contaminant Deoxynivalenol Exacerbates the Genotoxicity of Gut Microbiota. mBio 2017, 8, e7–e17. [Google Scholar] [CrossRef] [PubMed]
- Peng, Z.; Chen, L.; Xiao, J.; Zhou, X.; Nüssler, A.K.; Liu, L.; Liu, J.; Yang, W. Review of mechanisms of deoxynivalenol-induced anorexia: The role of gut microbiota. J. Appl. Toxicol. 2017, 8, 940–1029. [Google Scholar] [CrossRef]
- Akbari, P.; Braber, S.; Gremmels, H.; Koelink, P.J.; Verheijden, K.A.T.; Garssen, J.; Fink-Gremmels, J. Deoxynivalenol: A trigger for intestinal integrity breakdown. FASEB J. 2014, 28, 2414–2429. [Google Scholar] [CrossRef] [PubMed]
- Ghareeb, K.; Awad, W.A.; Böhm, J.Q.; Zebeli, K.G. Impacts of the feed contaminant deoxynivalenol on the intestine of monogastric animals: Poultry and swine. J. Appl. Toxicol. 2015, 35, 327–340. [Google Scholar] [CrossRef]
- Liao, Y.; Peng, Z.; Chen, L.; Nüssler, A.K.; Liu, L.; Yang, W. Deoxynivalenol, gut microbiota and immunotoxicity: A potential approach? Food Chem. Toxicol. 2018, 112, 342–354. [Google Scholar] [CrossRef]
- Pietsch, C.; Katzenback, B.A.; Garcia-Garcia, E.; Schulz, C.; Belosevic, M.; Burkhardt-Holm, P. Acute and subchronic effects on immune responses of carp (Cyprinus carpio L.) after exposure to deoxynivalenol (DON) in feed. Mycotoxin Res. 2015, 31, 151–164. [Google Scholar] [CrossRef]
- Broekaert, N.; Devreese, M.; Demeyere, K.; Berthiller, F.; Michlmayr, H.; Varga, E.; Adam, G.; Meyer, E.; Croubels, S. Comparative in vitro cytotoxicity of modified deoxynivalenol on porcine intestinal epithelial cells. Food Chem. Toxicol. 2016, 95, 103–109. [Google Scholar] [CrossRef]
- Alizadeh, A.; Braber, S.; Akbari, P.; Garssen, J.; Fink-Gremmels, J. Deoxynivalenol Impairs Weight Gain and Affects Markers of Gut Health after Low-Dose, Short-Term Exposure of Growing Pigs. Toxins 2015, 7, 2071–2095. [Google Scholar] [CrossRef] [PubMed]
- Mishra, S.; Dwivedi, P.D.; Pandey, H.P.; Das, M. Role of oxidative stress in Deoxynivalenol induced toxicity. Food Chem. Toxicol. 2014, 72, 20–29. [Google Scholar] [CrossRef] [PubMed]
- Asadullah, K.; Sterry, W.; Trefzer, U. Cytokines: Interleukin and interferon therapy in dermatology. Clin. Exp. Dermatol. 2002, 27, 578–584. [Google Scholar] [CrossRef] [PubMed]
- Cano, P.M.; Seeboth, J.; Meurens, F.; Cognié, J.; Abrami, R.; Oswald, I.P.; Guzylack-Piriou, L. Deoxynivalenol as a New Factor in the Persistence of Intestinal Inflammatory Diseases: An Emerging Hypothesis through Possible Modulation of Th17-Mediated Response. PLoS ONE 2013, 8, e53647. [Google Scholar] [CrossRef] [PubMed]
- Kadota, T.; Furusawa, H.; Hirano, S.; Tajima, O.; Kamata, Y.; Sugita-Konishi, Y. Comparative study of deoxynivalenol, 3-acetyldeoxynivalenol, and 15-acetyldeoxynivalenol on intestinal transport and IL-8 secretion in the human cell line Caco-2. Toxicol. In Vitro 2013, 27, 1888–1895. [Google Scholar] [CrossRef]
- Savard, C.; Provost, C.; Álvarez, F.; Pinilla, V.; Music, N.; Jacques, M.; Gagnon, C.A.; Chorfi, Y. Effect of deoxynivalenol (DON) mycotoxin on in vivo and in vitro porcine circovirus type 2 infections. Vet. Microbiol. 2015, 176, 257–267. [Google Scholar] [CrossRef]
- Przybylska-Gornowicz, B.; Lewczuk, B.; Prusik, M.; Hanuszewska, M.; Petrusewicz-Kosinska, M.; Gajecka, M.; Zielonka, L.; Gajecki, M. The Effects of Deoxynivalenol and Zearalenone on the Pig Large Intestine. A Light and Electron Microscopy Study. Toxins 2018, 10, 148. [Google Scholar] [CrossRef]
- Li, Q.W.; Hou, H.F.; Li, Y.L. Experimental observation of multiple organ impairment on rabbits by deoxynivalenol. Chin. J. Control Endemic Dis. 2007, 1. [Google Scholar]
- Fodor, J.S. Individual and Combined Effects of Subchronic Exposure of Three Fusarium Toxins (Fumonisin B, Deoxynivalenol and Zearalenone) in Rabbit Bucks. J. Toxicol. Clin. Toxicol. 2015, 5, 2–11. [Google Scholar] [CrossRef]
- Mézes, M.; Balogh, K. Mycotoxins in rabbit feed: A review. World Rabbit Sci. 2009, 17, 53–62. [Google Scholar]
- Wang, C.; Zhu, Y.; Li, F.; Huang, L. The Effect of Lactobacillus isolates on growth performance, immune response, intestinal bacterial community composition of growing Rex Rabbits. J. Anim. Physiol. Anim. Nutr. 2017, 101, e1–e13. [Google Scholar] [CrossRef] [Green Version]
- Prelusky, D.B.; Gerdes, R.G.; Underhill, K.L.; Rotter, B.A.; Jui, P.Y.; Trenholm, H.L. Effects of low level dietary deoxynivalenol on the haematological and clinical parameters of the pig. Nat. Toxins 1994, 2, 97–104. [Google Scholar] [CrossRef]
- Prelusky, D.B.; Trenholm, H.L. The efficacy of various classes of anti-emetics in preventing deoxynivalenol induced vomiting in pigs. Nat. Toxins 1993, 1, 296–302. [Google Scholar] [CrossRef]
- Pestka, J.J.; Lin, W.S.; Miller, E.R. Emetic activity of the trichothecene 15-acetyldeoxynivalenol in pigs. Food Chem. Toxicol. 1987, 25, 855–858. [Google Scholar] [CrossRef]
- Hughes, D.M.; Gahl, M.J.; Graham, C.H.; Grieb, S.L. Overt signs of toxicity to dogs and cats of dietary deoxynivalenol. J. Anim. Sci. 1999, 77, 693–700. [Google Scholar] [CrossRef]
- Huff, W.E.; Doerr, J.A.; Hamilton, P.B.; Vesonder, R.F. Acute Toxicity of Vomitoxin (Deoxynivalenol) in Broiler Chickens. Poult. Sci. 1981, 60, 1412–1414. [Google Scholar] [CrossRef]
- Pestka, J.J. Deoxynivalenol: Toxicity, mechanisms and animal health risks. Anim. Feed. Sci. Technol. 2007, 137, 283–298. [Google Scholar] [CrossRef]
- Fioramonti, J.; Dupuy, C.; Dupuy, J.; Bueno, L. The mycotoxin, deoxynivalenol, delays gastric emptying through serotonin-3 receptors in rodents. J. Pharmacol. Exp. Ther. 1993, 266, 1255–1260. [Google Scholar]
- Kachlek, M.; Szabó-Fodor, J.; Szabó, A.; Bors, I.; Celia, C.; Gerencsér, Z.; Matics, Z.; Szendrő, Z.; Tuboly, T.; Balogh-Zándoki, E.; et al. Subchronic exposure to deoxynivalenol exerts slight effect on the immune system and liver morphology of growing rabbits. Acta Vet. Brno. 2017, 86, 37–44. [Google Scholar] [CrossRef] [Green Version]
- Robert, H.; Payros, D.; Pinton, P.; Théodorou, V.; Mercier-Bonin, M.; Oswald, I.P. Impact of mycotoxins on the intestine: Are mucus and microbiota new targets? J. Toxicol. Environ. Health Part B 2017, 20, 249–275. [Google Scholar] [CrossRef]
- Lessard, M.; Savard, C.; Deschene, K.; Lauzon, K.; Pinilla, V.A.; Gagnon, C.A.; Lapointe, J.; Guay, F.; Chorfi, Y. Impact of deoxynivalenol (DON) contaminated feed on intestinal integrity and immune response in swine. Food Chem. Toxicol. 2015, 80, 7–16. [Google Scholar] [CrossRef]
- Li, F.; Wang, J.; Huang, L.; Chen, H.; Wang, C. Effects of Adding Clostridium sp. WJ06 on Intestinal Morphology and Microbial Diversity of Growing Pigs Fed with Natural Deoxynivalenol Contaminated Wheat. Toxins 2017, 9, 383. [Google Scholar] [CrossRef]
- Bracarense, A.P.; Lucioli, J.; Grenier, B.; Pacheco, G.D.; Moll, W.D.; Schatzmayr, G.; Oswald, I.P. Chronic ingestion of deoxynivalenol and fumonisin, alone or in interaction, induces morphological and immunological changes in the intestine of piglets. Br. J. Nutr. 2012, 107, 1776–1786. [Google Scholar] [CrossRef]
- Awad, W.A.; Hess, M.; Twaruzek, M.; Grajewski, J.; Kosicki, R.; Böhm, J.; Zentek, J. The Impact of the Fusarium Mycotoxin Deoxynivalenol on the Health and Performance of Broiler Chickens. Int. J. Mol. Sci. 2011, 12, 7996–8012. [Google Scholar] [CrossRef]
- Gerez, J.; Buck, L.; Marutani, V.H.; Calliari, C.M.; Bracarense, A.P. Low Levels of Chito-Oligosaccharides Are Not Effective in Reducing Deoxynivalenol Toxicity in Swine Jejunal Explants. Toxins 2018, 10, 276. [Google Scholar] [CrossRef]
- Graziani, F.; Pinton, P.; Olleik, H.; Pujol, A.; Nicoletti, C.; Sicre, M.; Quinson, N.; Ajandouz, E.H.; Perrier, J.; Di Pasquale, E.; et al. Deoxynivalenol inhibits the expression of trefoil factors (TFF) by intestinal human and porcine goblet cells. Arch. Toxicol. 2019, 93, 1039–1049. [Google Scholar] [CrossRef]
- Pinton, P.; Graziani, F.; Pujol, A.; Nicoletti, C.; Paris, O.; Ernouf, P.; Pasquale, E.D.; Perrier, J.; Oswald, I.P.; Maresca, M. Deoxynivalenol inhibits the expression by goblet cells of intestinal mucins through a PKR and MAP kinase dependent repression of the resistin-like molecule beta. Mol. Nutr. Food Res. 2015, 59, 1076–1087. [Google Scholar] [CrossRef]
- Becker, C.; Reiter, M.; Pfaffl, M.W.; Meyer, H.H.D.; Bauer, J.; Meyer, K.H.D. Expression of immune relevant genes in pigs under the influence of low doses of deoxynivalenol (DON). Mycotoxin Res. 2011, 27, 287–293. [Google Scholar] [CrossRef]
- Pierron, A.; Alassane-Kpembi, I.; Oswald, I.P. Impact of mycotoxin on immune response and consequences for pig health. Anim. Nutr. 2016, 2, 63–68. [Google Scholar] [CrossRef]
- Antonissen, G.; Mountzouris, K.C.; Su, S.; Wong, E.A.; Verlinden, M.; Novak, B.; Dohnal, I.; Van Immerseel, F.; Pasmans, F.; Ducatelle, R.; et al. Mycotoxins Deoxynivalenol and Fumonisins Alter the Extrinsic Component of Intestinal Barrier in Broiler Chickens. J. Agric. Food Chem. 2015, 63, 10846–10855. [Google Scholar] [CrossRef]
- Peng, Z.; Chen, L.; Nussler, A.K.; Liu, L.; Yang, W. Current sights for mechanisms of deoxynivalenol -induced hepatotoxicity and prospective views for future scientific research: A mini review. J. Appl. Toxicol. 2017, 37, 518–529. [Google Scholar] [CrossRef]
- Van De Walle, J.; Romier, B.; Larondelle, Y.; Schneider, Y.J. Influence of deoxynivalenol on NF-kappaB activation and IL-8 secretion in human intestinal Caco-2 cells. Toxicol. Lett. 2008, 177, 205–214. [Google Scholar] [CrossRef]
- Wang, X.; Zuo, Z.; Deng, J.; Zhang, Z.; Chen, C.; Fan, Y.; Peng, G.; Cao, G.S.; Hu, Y.; Yu, S.; et al. Protective Role of Selenium in Immune-Relevant Cytokine and Immunoglobulin Production by Piglet Splenic Lymphocytes Exposed to Deoxynivalenol. Biol. Trace Elem. Res. 2018, 184, 83–91. [Google Scholar] [CrossRef]
- Choi, B.-K.; Jeong, S.-H.; Cho, J.-H.; Shin, H.-S.; Son, S.-W.; Yeo, Y.-K.; Kang, H.-G. Effects of oral deoxynivalenol exposure on immune-related parameters in lymphoid organs and serum of mice vaccinated with porcine parvovirus vaccine. Mycotoxin Res. 2013, 29, 185–192. [Google Scholar] [CrossRef]
- Muqader, S.; Hafsa, Z.; Saima, M.; Rifat, U.K.; Muhammad, M.; Imad, K.; Salahud, D.; Muhammad, S.K.; Habib, U.R.; Antonella, T. Single or Combined Applications of Zinc and Multi-strain Probiotic on Intestinal Histomorphology of Broilers Under Cyclic Heat Stress. Probiotics Antimicrob. Proteins 2019, 1–8. [Google Scholar] [CrossRef]
- Leknes, I. Histochemical study on the intestine goblet cells in cichlid and poecilid species (Teleostei). Tissue Cell 2010, 42, 61–64. [Google Scholar] [CrossRef]
- Liu, L.; Liu, H.; Ning, L.; Li, F. Rabbit SLC15A1, SLC7A1 and SLC1A1 genes are affected by site of digestion, stage of development and dietary protein content. Animal 2019, 13, 326–332. [Google Scholar] [CrossRef]


| Group | Initial Weight (g) | Final Weight (g) | ADG (g) | ADFI (g) | F/G |
|---|---|---|---|---|---|
| A | 1079 ± 35 | 1634 ± 61 | 23.13 ± 1.78 a | 133 ± 9 | 5.72 ± 0.43 b |
| B | 1099 ± 43 | 1644 ± 65 | 22.73 ± 1.09 a | 129 ± 9 | 5.66 ± 0.31 b |
| C | 1103 ± 46 | 1621 ± 59 | 21.55 ± 1.30 b | 126 ± 8 | 5.86 ± 0.49 a |
| Group | Liver | Kidney | Spleen | Stomach |
|---|---|---|---|---|
| A | 35.77 ± 1.12 a | 8.00 ± 0.23 | 0.70 ± 0.08 a | 16.73 ± 1.04 |
| B | 29.07 ± 0.57 b | 7.17 ± 0.26 | 0.54 ± 0.04 b | 16.59 ± 0.27 |
| C | 30.87 ± 1.45 b | 7.84 ± 0.33 | 0.50 ± 0.05 b | 17.45 ± 0.80 |
| Ingredient (%) | Calculated Composition | ||
|---|---|---|---|
| Maize | 14 | Dry matter | 88.64 |
| Soybean meal | 17 | Crude protein | 20.05 |
| Wheat bran | 13 | Crude fiber | 18.78 |
| Corn germ meal | 19 | Crude ash | 10.45 |
| Rice hulls | 10 | Crude fat | 3.34 |
| Soybean straw powder | 7 | Calcium | 0.72 |
| Alfalfa | 10 | Total Phosphorus | 0.55 |
| Malt Sprout | 5 | Digestible energy (MJ/kg) | 10.06 |
| Sweet wormwood | 3.5 | ||
| Premix material 1 | 1.5 | ||
| Total | 100 | ||
| Content of Mycotoxin (μg/kg) 2 | |||
| Deoxynivalenol (DON) | 23.18 | ||
| Zearalenone (ZEA) | 257.76 | ||
| Aflatoxin B1 (AFB1) | 7.08 | ||
| Target Gene | GenBank Number | Primer Sequence (5′-3′) |
|---|---|---|
| IL1β-F | NC_013670 | TTCCGGATGTATCTCGAGCA |
| IL1β-R | GTGGATCGTGGTCGTCTTCA | |
| IL2-F | NC_013683 | GCTTCGATGCCAGTGCATAA |
| IL2-R | CAGGCAGAGTTCTCTTCCATCA | |
| IL6-F | NC_013678 | GCCAACCCTACAACAAGA |
| IL6-R | AGAGCCACAACGACTGAC | |
| IL8-F | NC_013683 | TGCCCAAGAAGGTCACAGAA |
| IL8-R | ACTCGATGCTGAGATGATGCT | |
| GAPDH-F | NM_001082253 | TGCCACCCACTCCTCTACCTTCG |
| GAPDH-R | CCGGTGGTTTGAGGGCTCTTACT |
© 2019 by the authors. Licensee MDPI, Basel, Switzerland. This article is an open access article distributed under the terms and conditions of the Creative Commons Attribution (CC BY) license (http://creativecommons.org/licenses/by/4.0/).
Share and Cite
Yang, W.; Huang, L.; Wang, P.; Wu, Z.; Li, F.; Wang, C. The Effect of Low and High Dose Deoxynivalenol on Intestinal Morphology, Distribution, and Expression of Inflammatory Cytokines of Weaning Rabbits. Toxins 2019, 11, 473. https://0-doi-org.brum.beds.ac.uk/10.3390/toxins11080473
Yang W, Huang L, Wang P, Wu Z, Li F, Wang C. The Effect of Low and High Dose Deoxynivalenol on Intestinal Morphology, Distribution, and Expression of Inflammatory Cytokines of Weaning Rabbits. Toxins. 2019; 11(8):473. https://0-doi-org.brum.beds.ac.uk/10.3390/toxins11080473
Chicago/Turabian StyleYang, Wanying, Libo Huang, Pengwei Wang, Zhichao Wu, Fuchang Li, and Chunyang Wang. 2019. "The Effect of Low and High Dose Deoxynivalenol on Intestinal Morphology, Distribution, and Expression of Inflammatory Cytokines of Weaning Rabbits" Toxins 11, no. 8: 473. https://0-doi-org.brum.beds.ac.uk/10.3390/toxins11080473