Structure of the Diphtheria Toxin at Acidic pH: Implications for the Conformational Switching of the Translocation Domain

 ,
,
Abstract
:
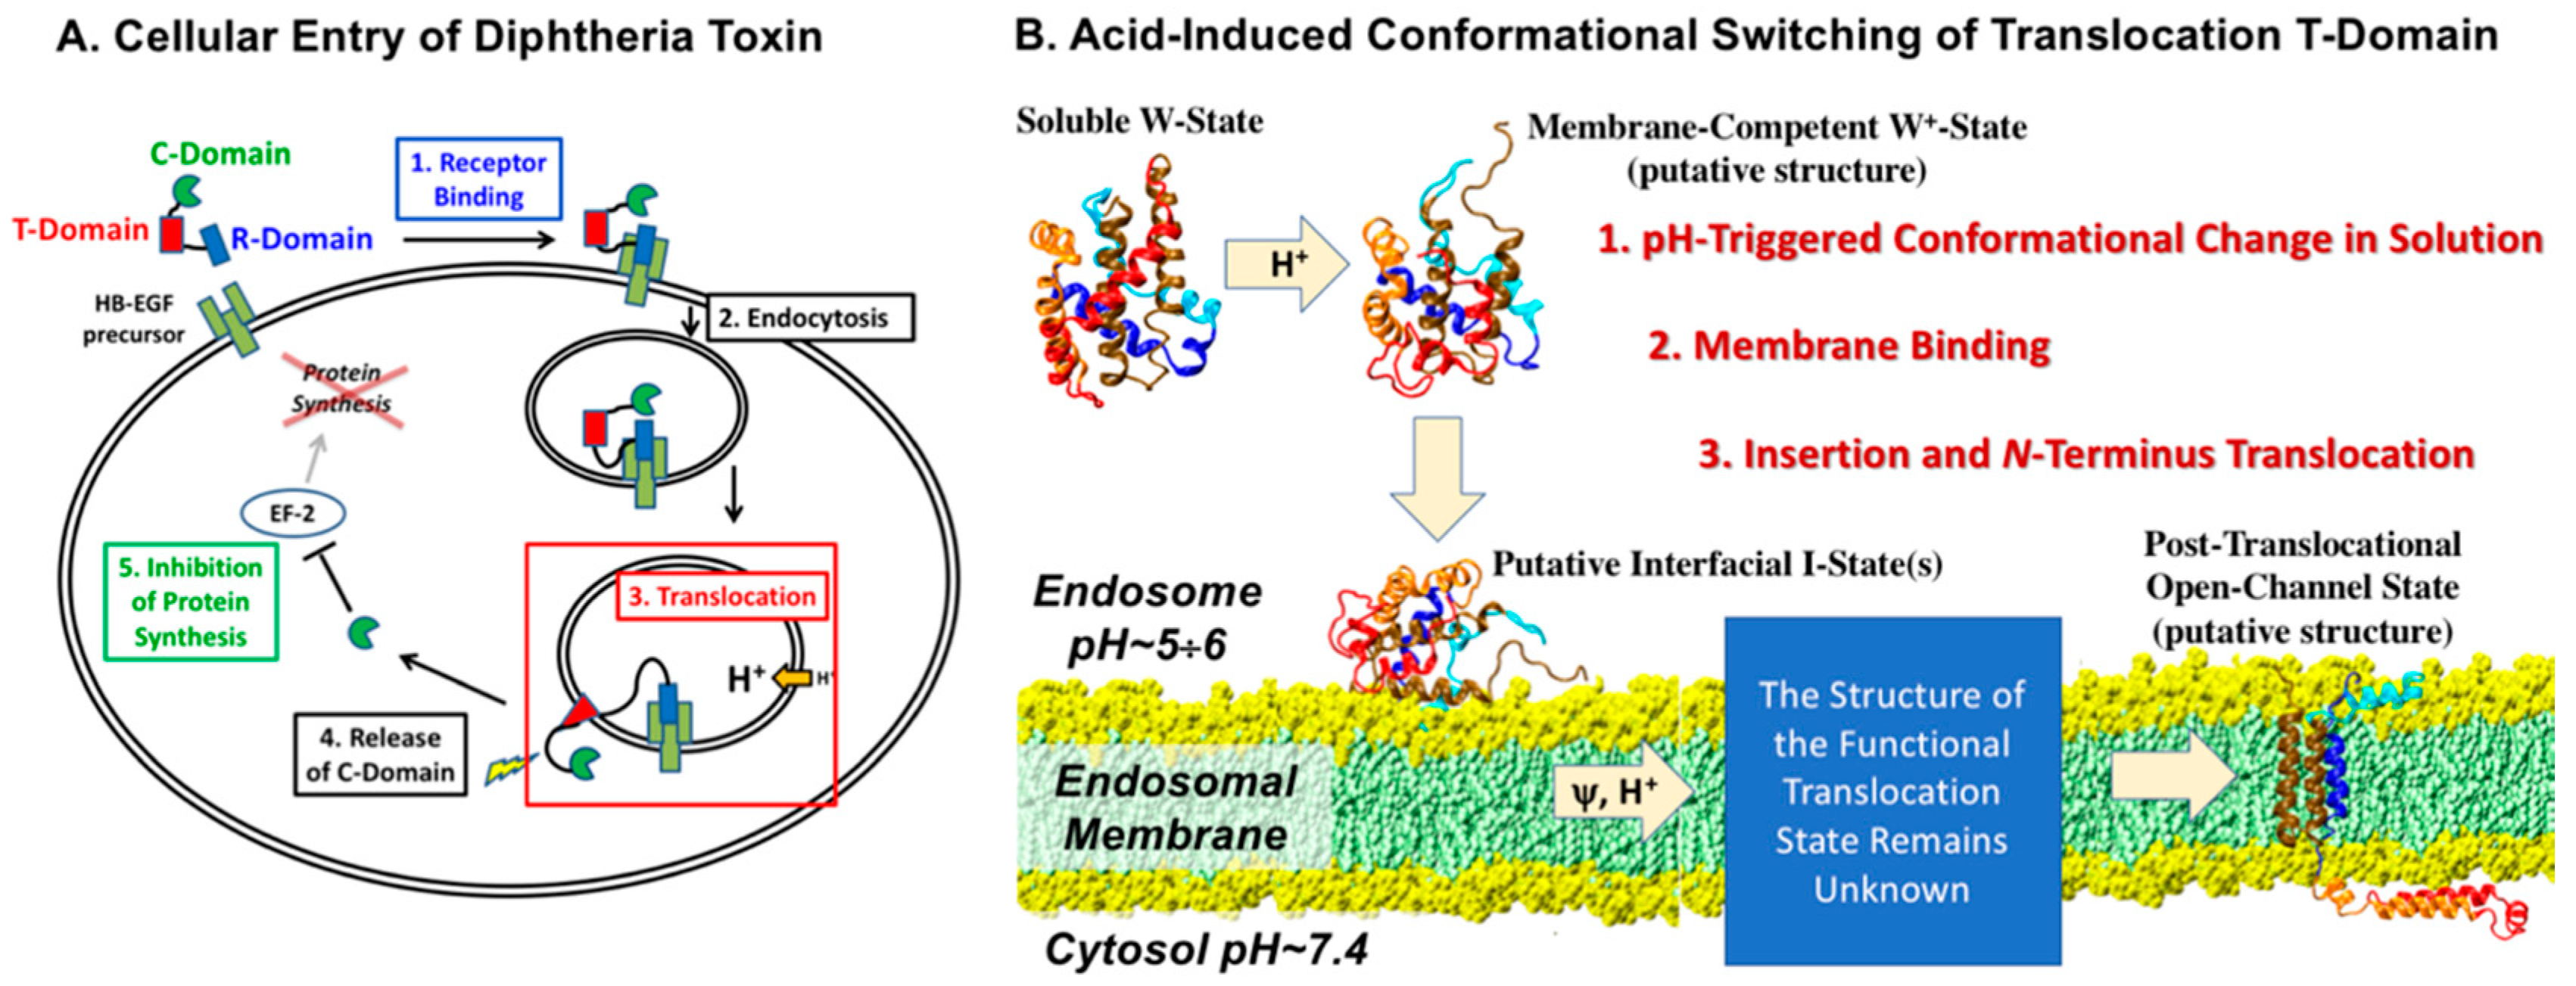
1. Introduction
2. Results
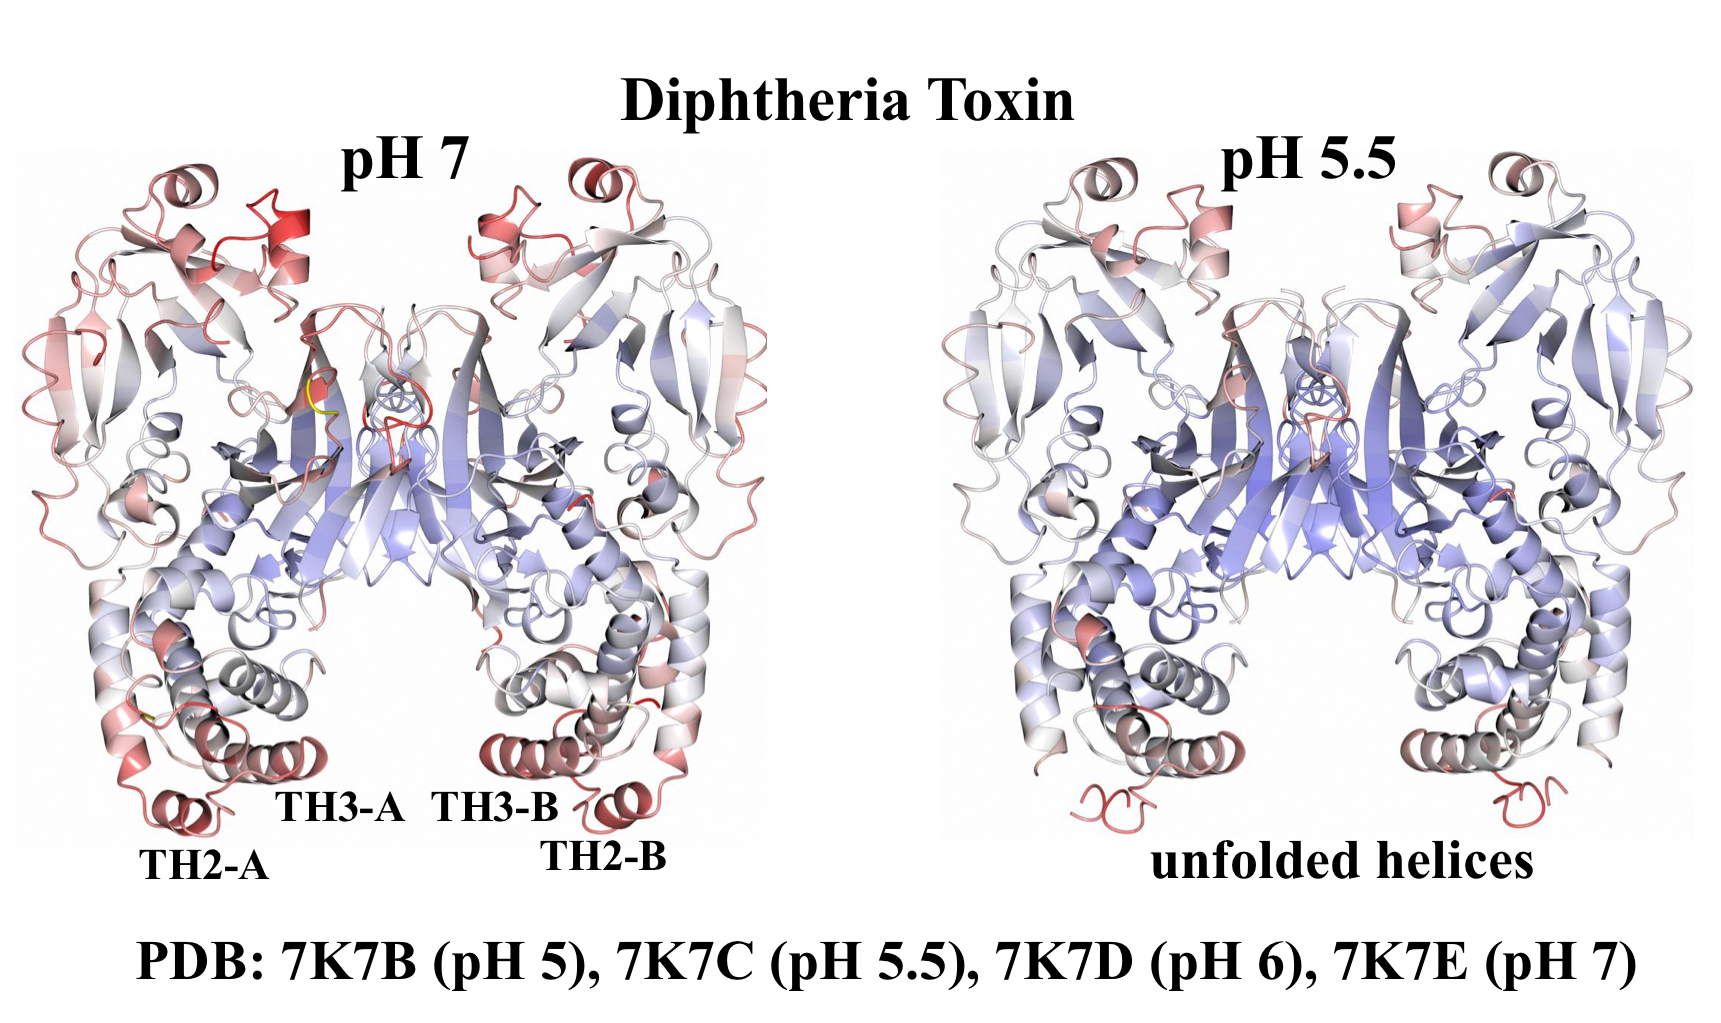
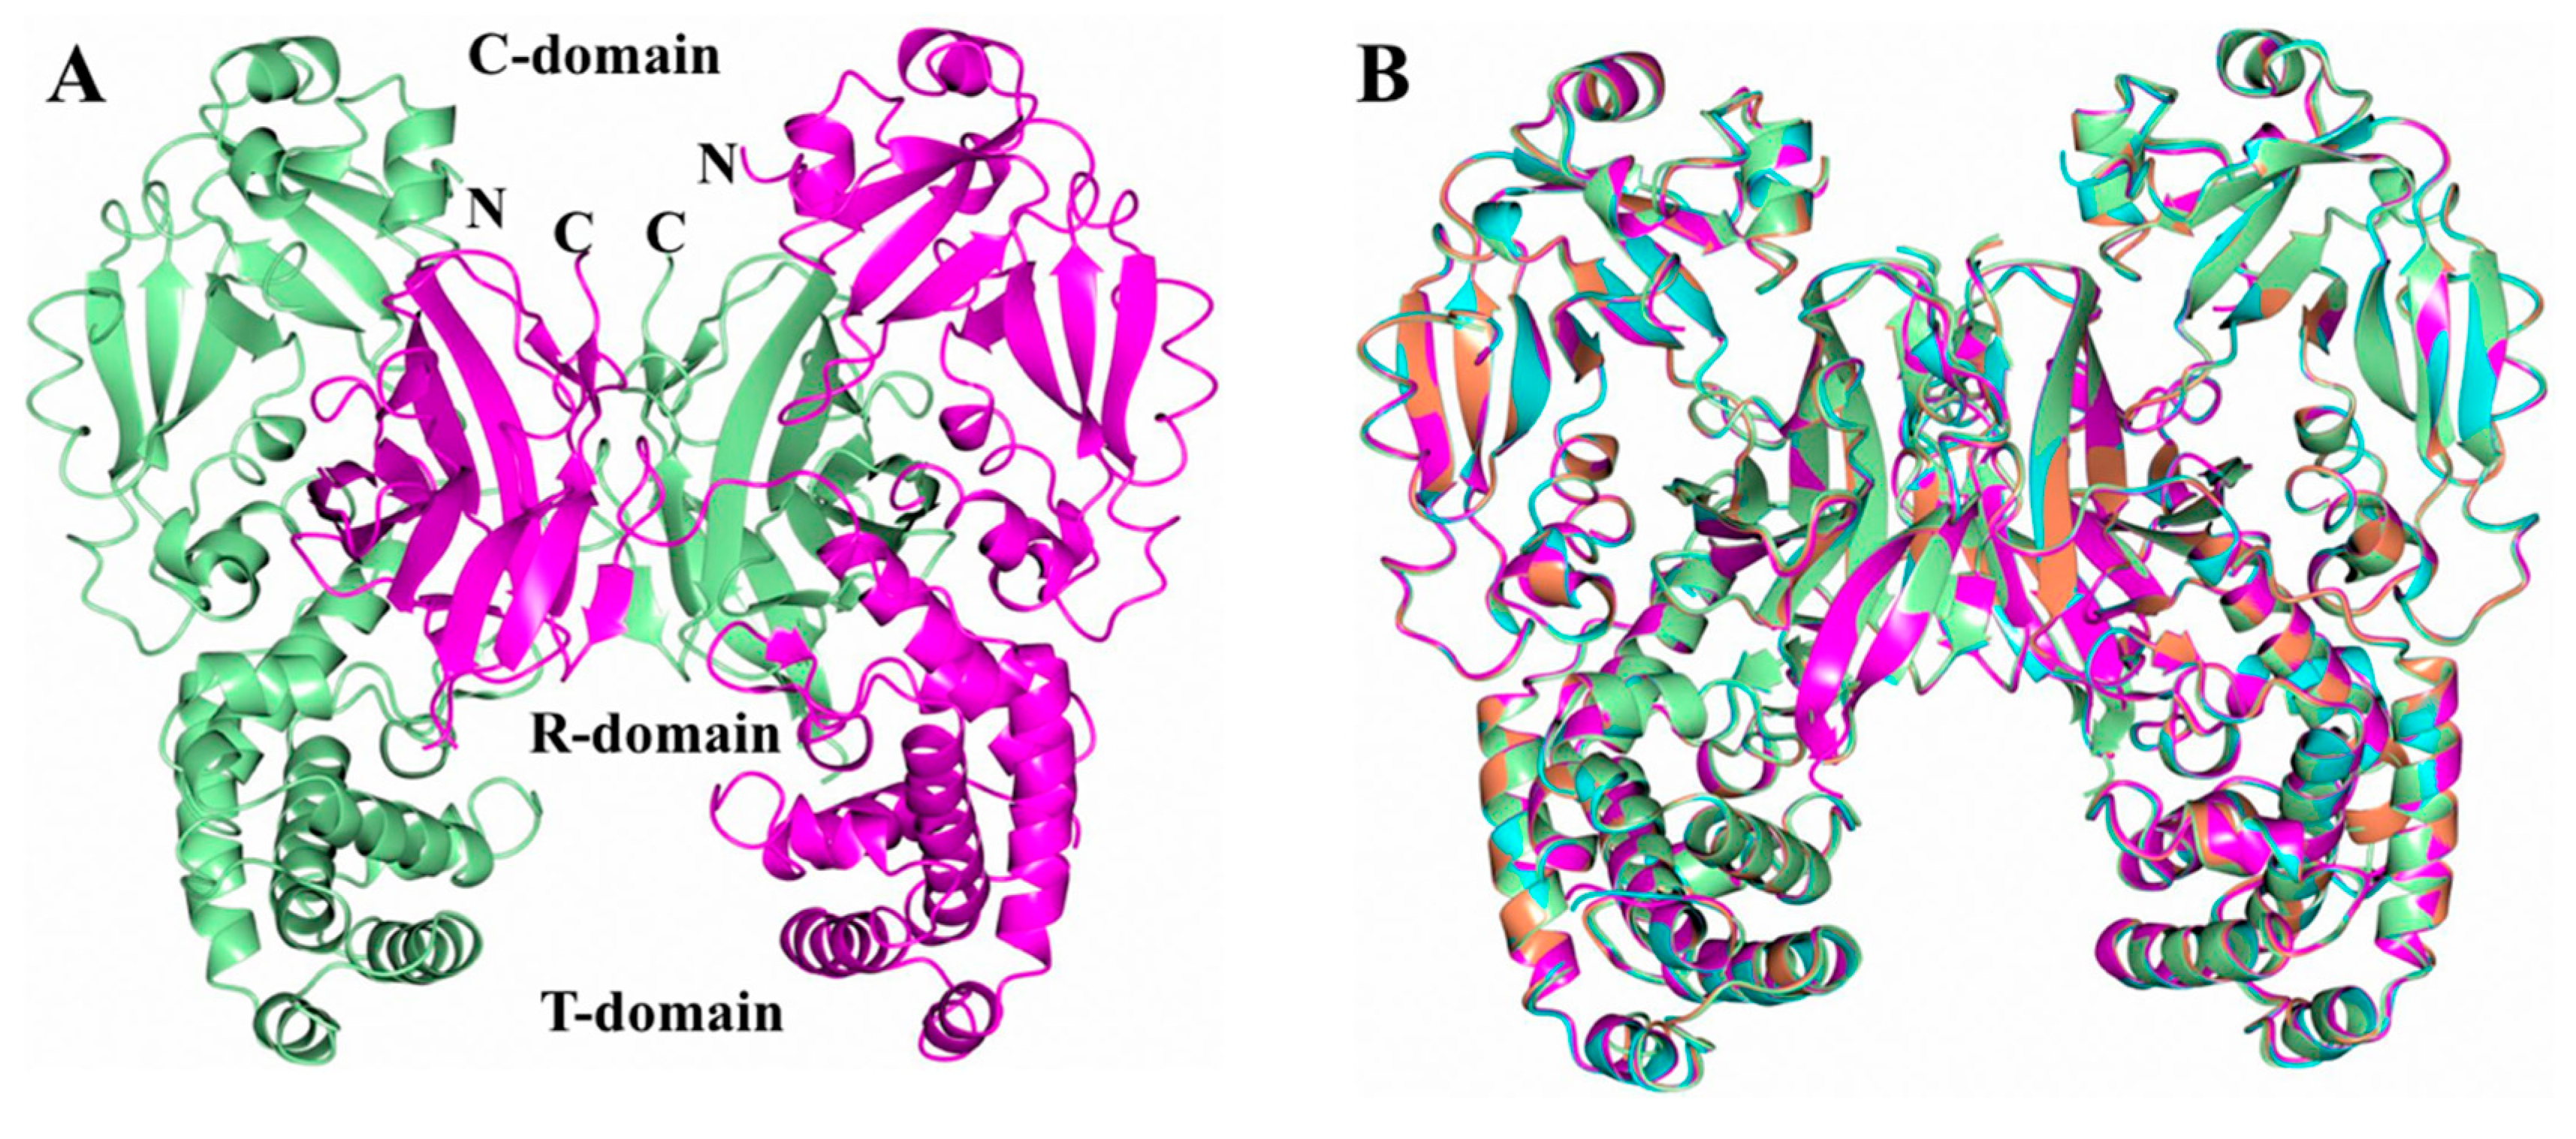
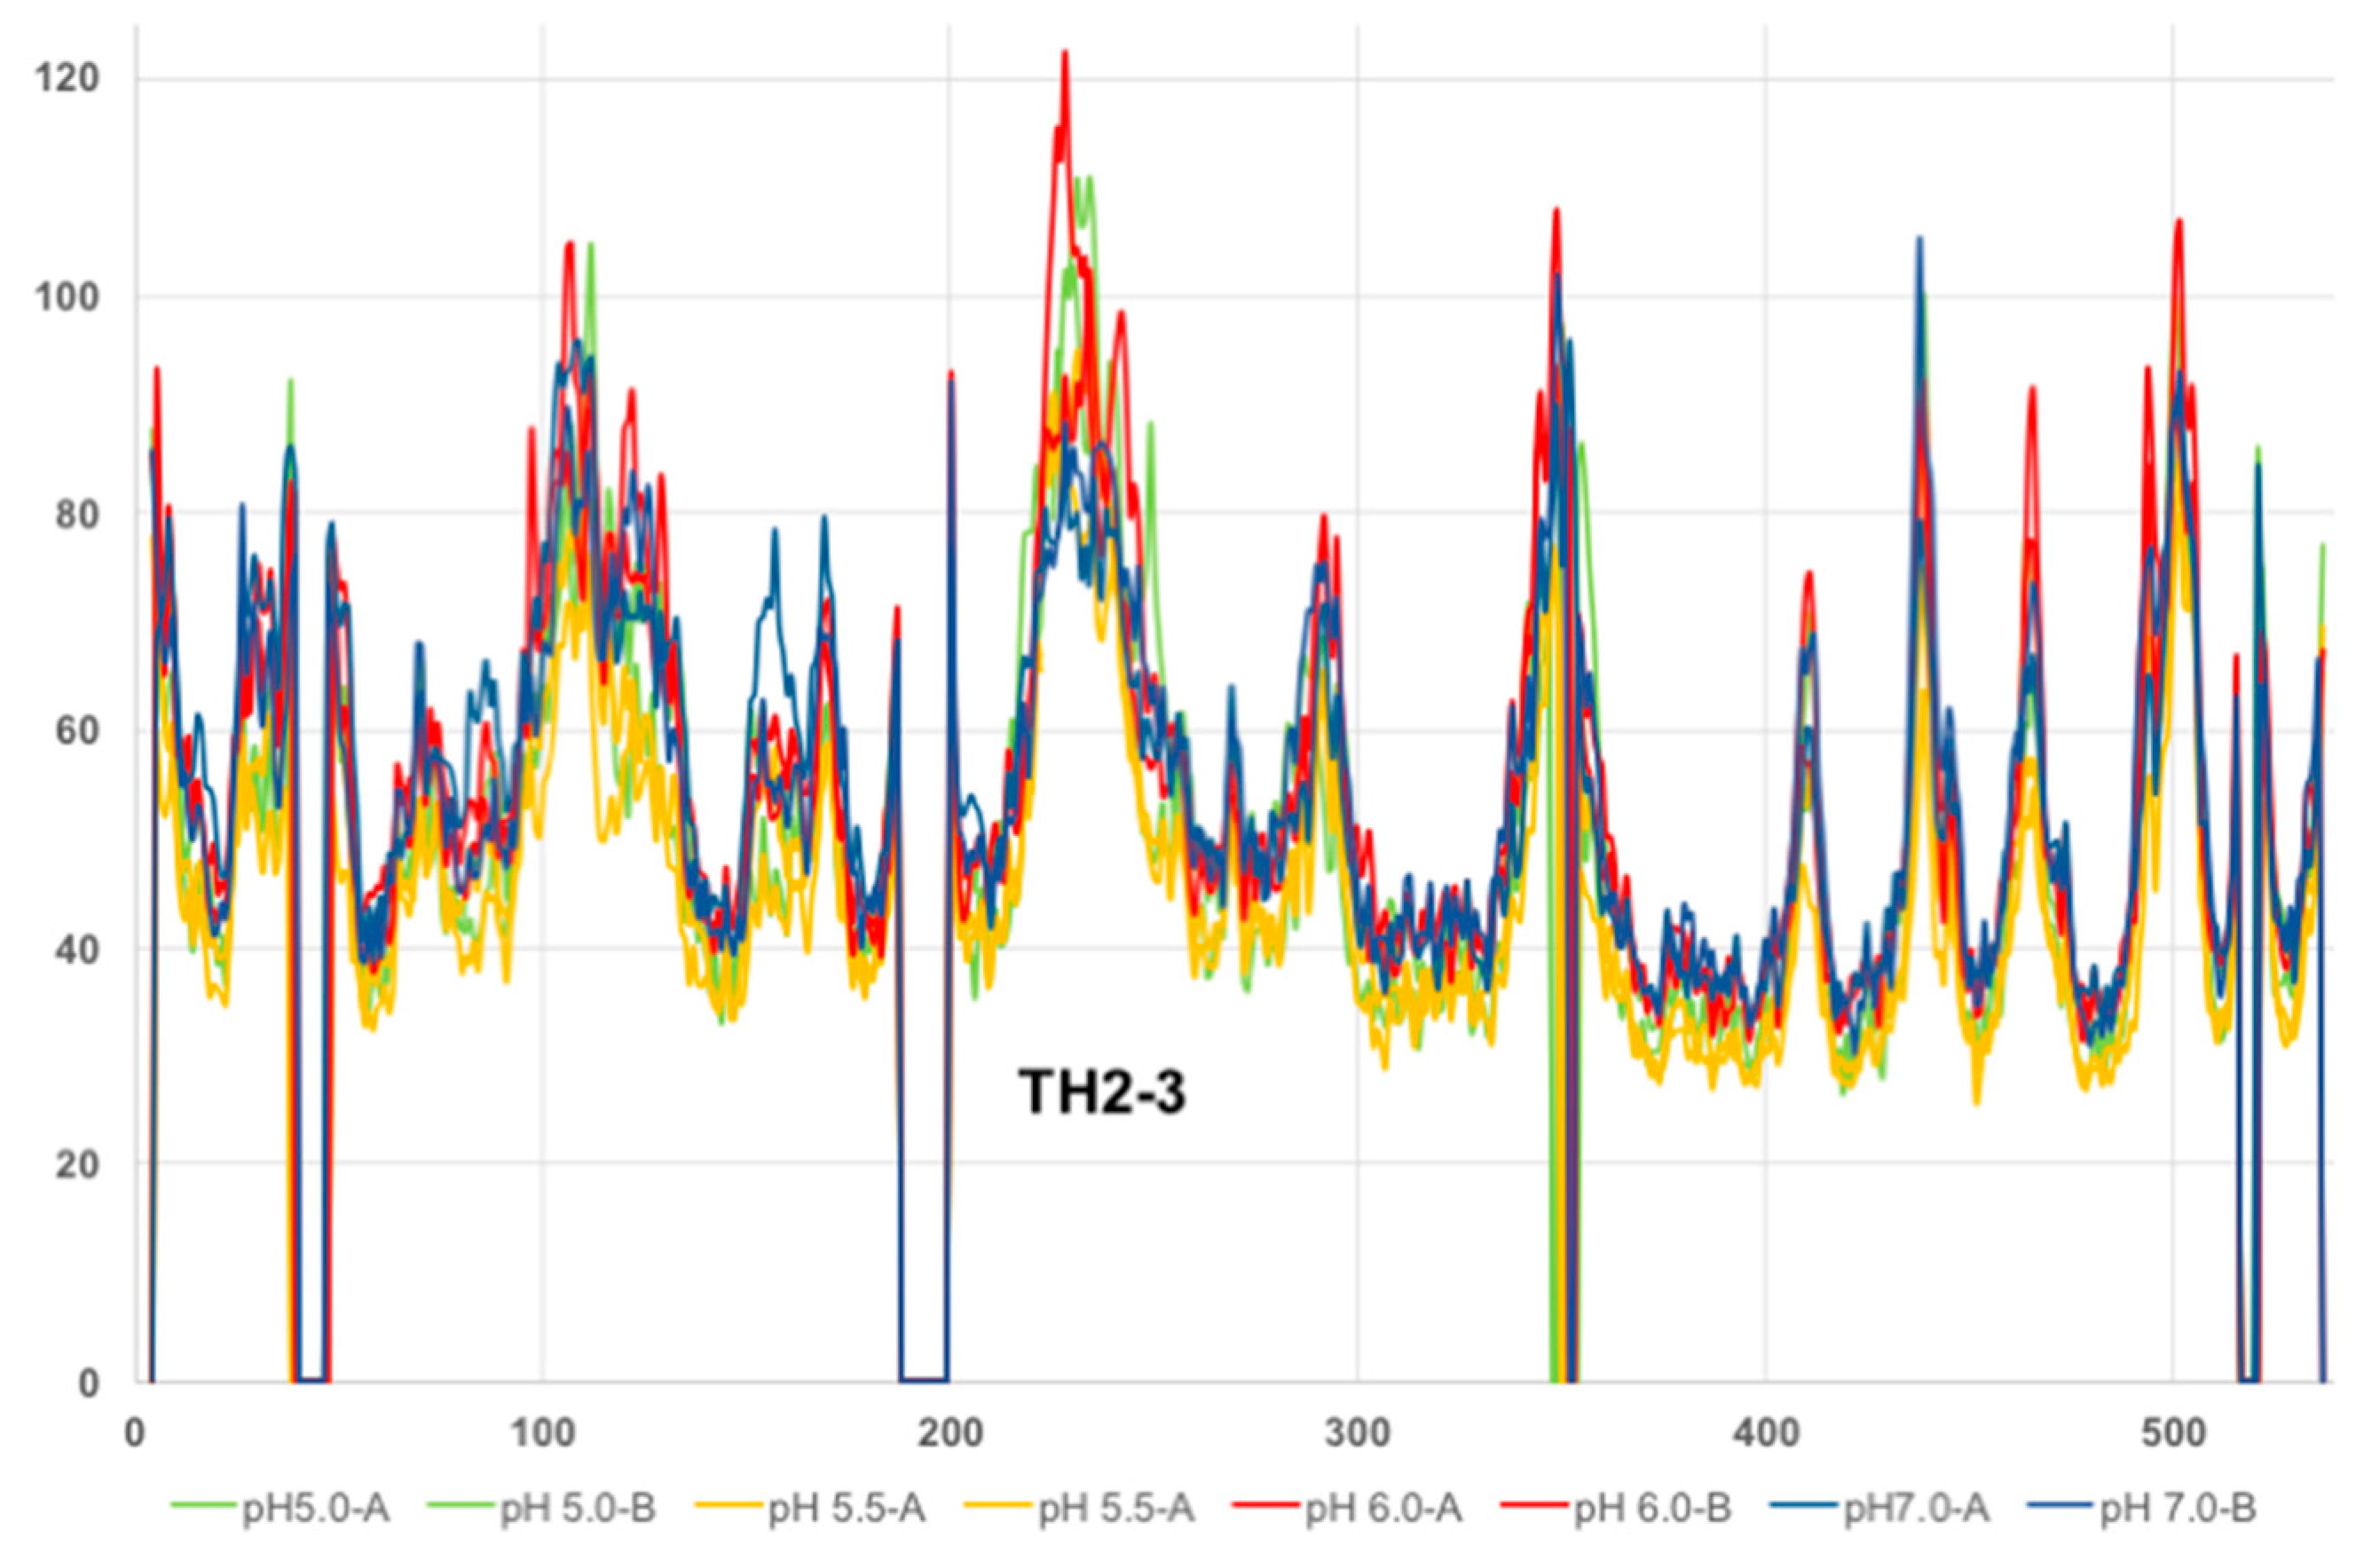
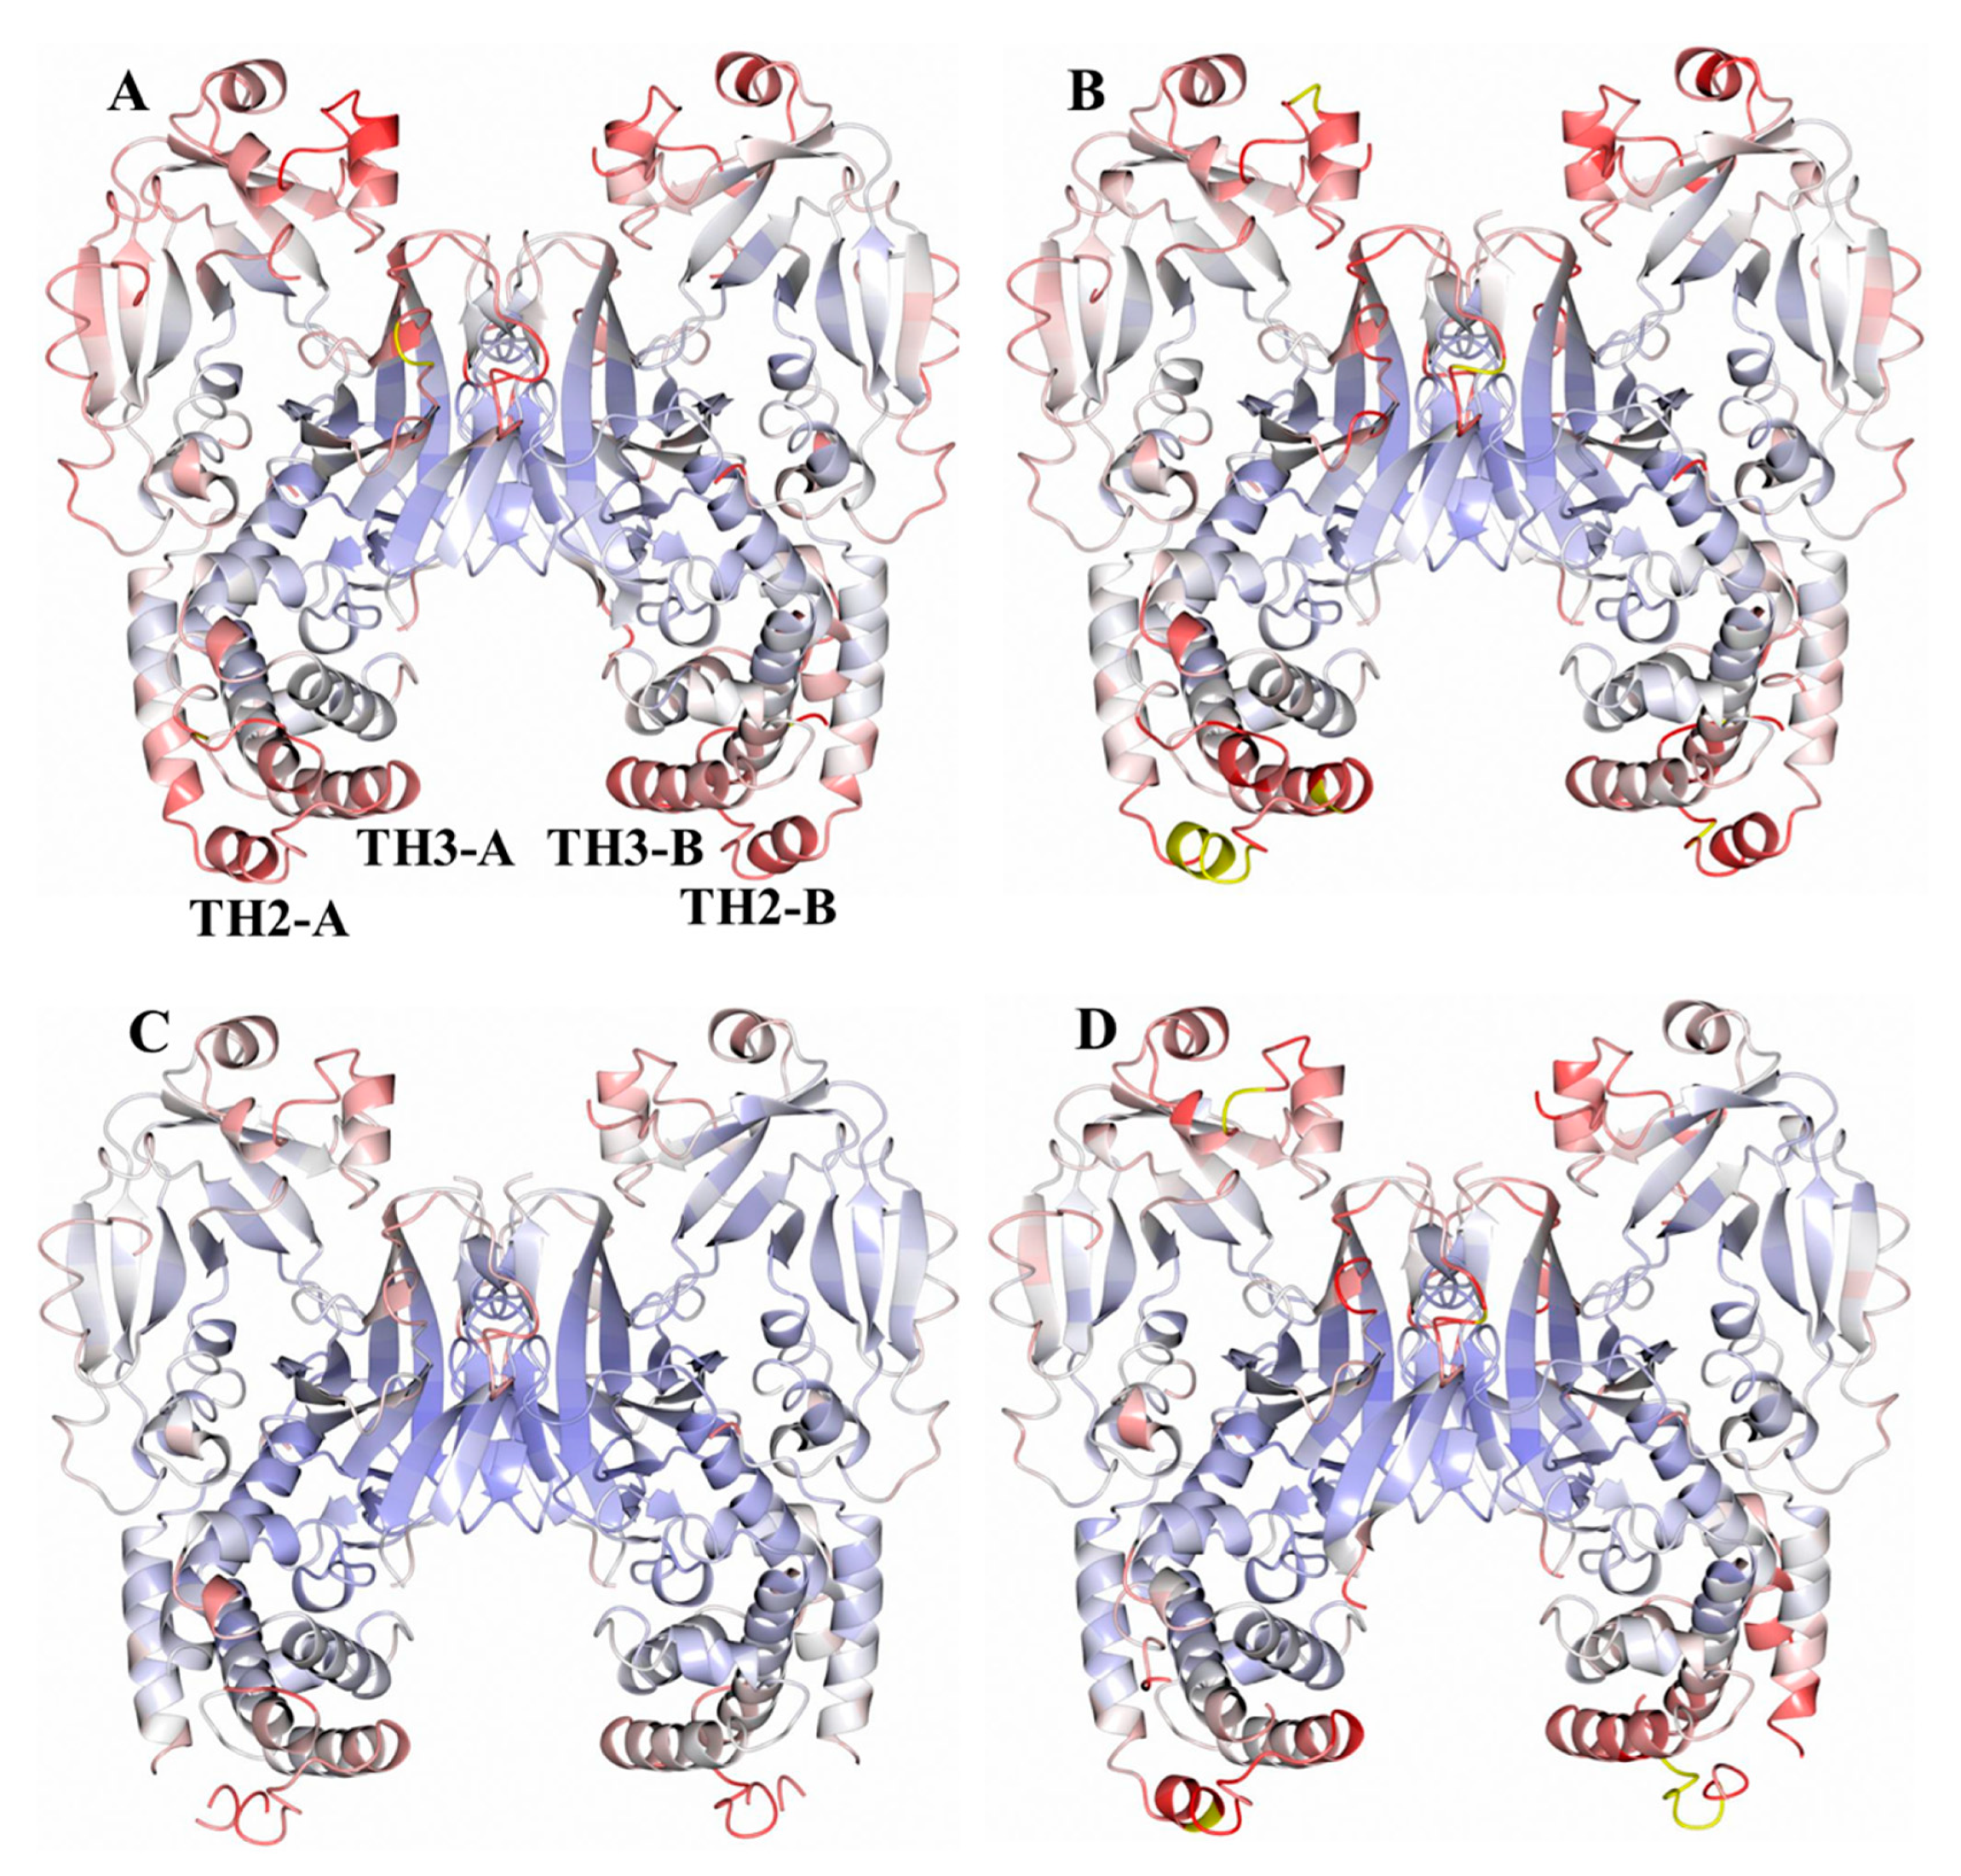
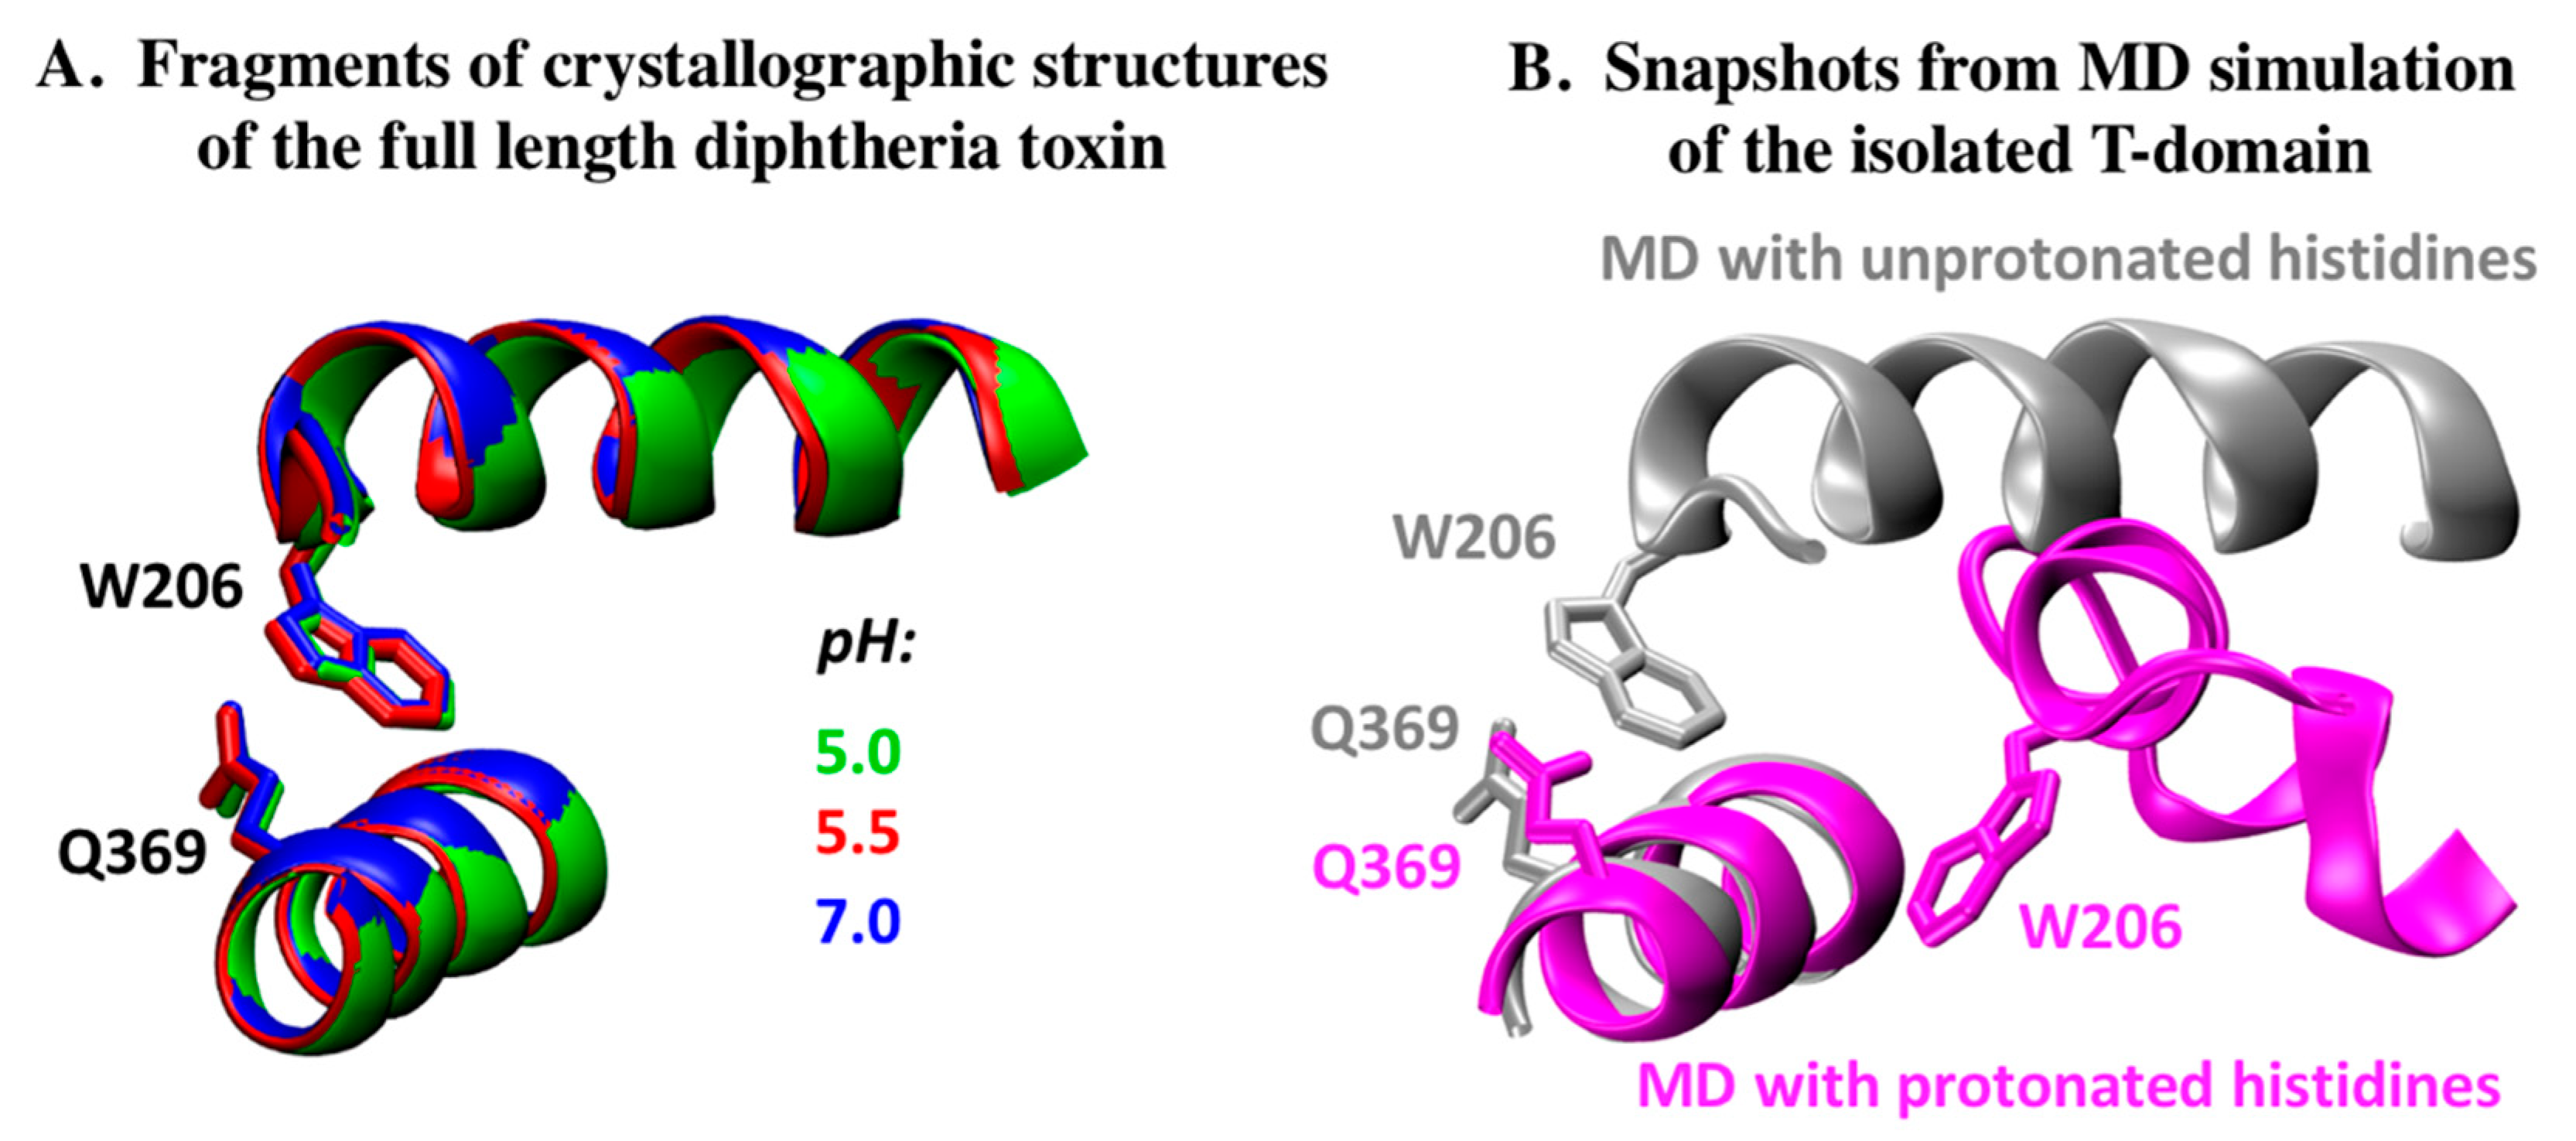
2.1. Analysis of DT Structures Obtained at Varying pH
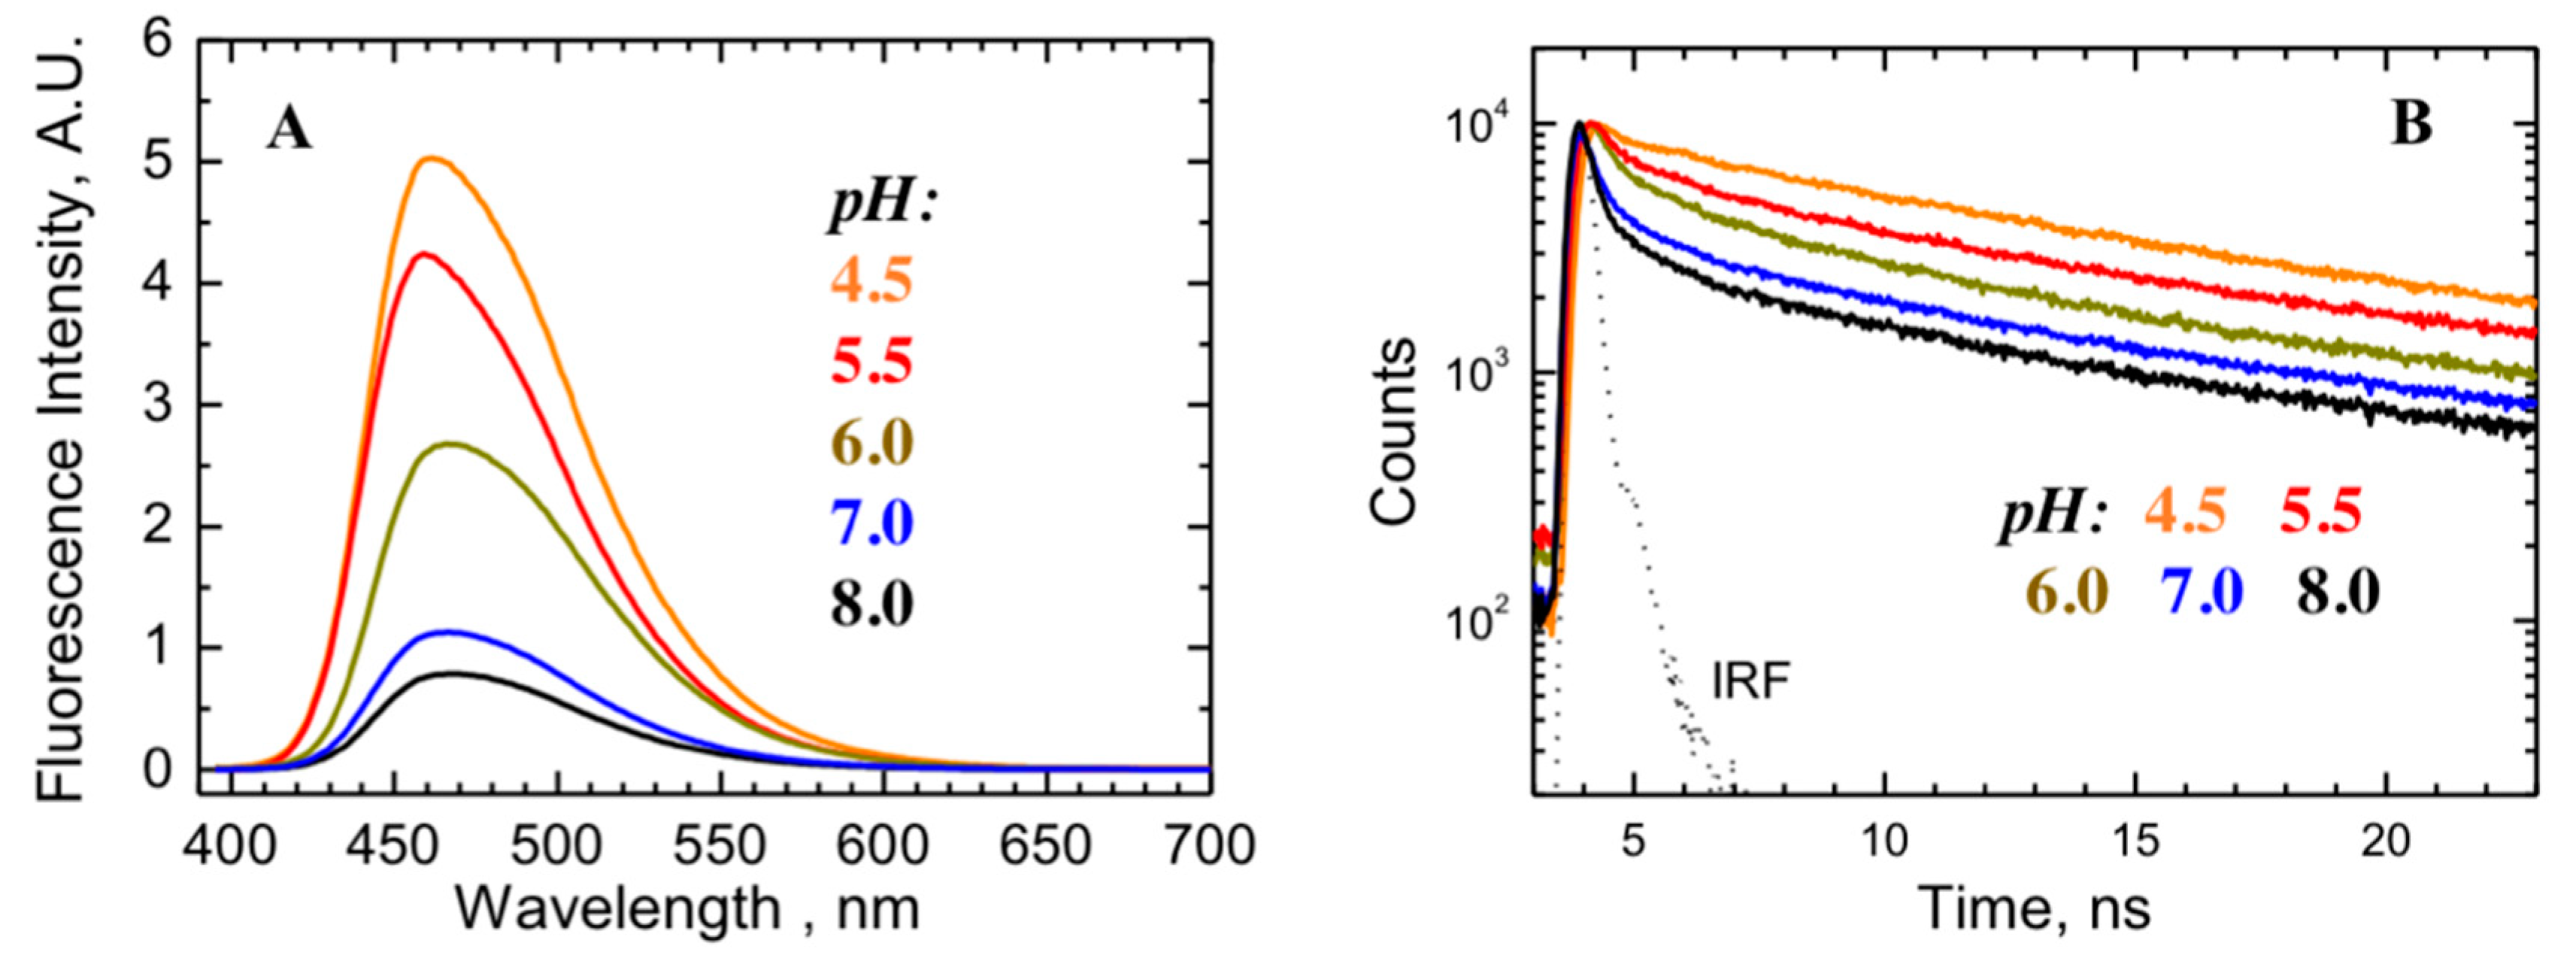
2.2. Comparison to pH-Dependent Refolding of Isolated T-Domain
3. Discussion
4. Conclusions
5. Materials and Methods
5.1. Materials
5.2. Preparation of the T-Domain and Full-Length DT
5.3. Crystallization and Data Collection
5.4. Structure Solution and Refinement
5.5. Fluorescence Measurements
Supplementary Materials
Author Contributions
Funding
Acknowledgments
Conflicts of Interest
References
- Murphy, J.R. Mechanism of diphtheria toxin catalytic domain delivery to the eukaryotic cell cytosol and the cellular factors that directly participate in the process. Toxins 2011, 3, 294. [Google Scholar] [CrossRef] [PubMed] [Green Version]
- Hoch, D.H.; Romero-Mira, M.; Ehrlich, B.E.; Finkelstein, A.; DasGupta, B.R.; Simpson, L.L. Channels formed by botulinum, tetanus, and diphtheria toxins in planar lipid bilayers: Relevance to translocation of proteins across membranes. Proc. Natl. Acad. Sci. USA 1985, 82, 1692. [Google Scholar] [CrossRef] [PubMed] [Green Version]
- Neale, E.A. Moving across membranes. Nat. Struct. Biol. 2003, 10, 2–3. [Google Scholar] [CrossRef] [PubMed]
- Koriazova, L.K.; Montal, M. Translocation of botulinum neurotoxin light chain protease through the heavy chain channel. Nat. Struct. Biol. 2003, 10, 13–18. [Google Scholar] [CrossRef] [PubMed]
- Collier, R.J.; Young, J.A. Anthrax toxin. Annu. Rev. Cell Dev. Biol. 2003, 19, 45–70. [Google Scholar] [CrossRef] [PubMed]
- Oh, K.J.; Senzel, L.; Collier, R.J.; Finkelstein, A. Translocation of the catalytic domain of diphtheria toxin across planar phospholipid bilayers by its own t domain. Proc. Natl. Acad. Sci. USA 1999, 96, 8467–8470. [Google Scholar] [CrossRef] [PubMed] [Green Version]
- Gordon, M.; Finkelstein, A. The number of subunits comprising the channel formed by the T domain of diphtheria toxin. J. Gen. Physiol. 2001, 118, 471–480. [Google Scholar] [CrossRef] [Green Version]
- Palchevskyy, S.S.; Posokhov, Y.O.; Olivier, B.; Popot, J.-L.; Pucci, B.; Ladokhin, A.S. Chaperoning of insertion of membrane proteins into lipid bilayers by hemifluorinated surfactants: Application to diphtheria toxin. Biochemistry 2006, 45, 2629–2635. [Google Scholar] [CrossRef] [PubMed]
- Ren, J.; Kachel, K.; Kim, H.; Malenbaum, S.E.; John, R.; Collier; London, E. Interaction of diphtheria toxin t domain with molten globule-like proteins and its implications for translocation. Science 1999, 284, 955. [Google Scholar] [CrossRef]
- Kyrychenko, A.; Posokhov, Y.O.; Rodnin, M.V.; Ladokhin, A.S. Kinetic intermediate reveals staggered ph-dependent transitions along the membrane insertion pathway of the diphtheria toxin T-domain. Biochemistry 2009, 48, 7584–7594. [Google Scholar] [CrossRef] [Green Version]
- Kurnikov, I.V.; Kyrychenko, A.; Flores-Canales, J.C.; Rodnin, M.V.; Simakov, N.; Vargas-Uribe, M.; Posokhov, Y.O.; Kurnikova, M.; Ladokhin, A.S. pH-triggered conformational switching of the diphtheria toxin T-domain: The roles of N-terminal histidines. J. Mol. Biol. 2013, 425, 2752–2764. [Google Scholar] [CrossRef] [PubMed] [Green Version]
- Rodnin, M.V.; Kyrychenko, A.; Kienker, P.; Sharma, O.; Posokhov, Y.O.; Collier, R.J.; Finkelstein, A.; Ladokhin, A.S. Conformational switching of the diphtheria toxin T domain. J. Mol. Biol. 2010, 402, 1–7. [Google Scholar] [CrossRef] [PubMed]
- Rodnin, M.V.; Li, J.; Gross, M.L.; Ladokhin, A.S. The pH-dependent trigger in diphtheria toxin T domain comes with a safety latch. Biophys. J. 2016, 111, 1946–1953. [Google Scholar] [CrossRef] [PubMed] [Green Version]
- Wang, Y.; Malenbaum, S.E.; Kachel, K.; Zhan, H.; Collier, R.J.; London, E. Identification of shallow and deep membrane-penetrating forms of diphtheria toxin T domain that are regulated by protein concentration and bilayer width. J. Biol. Chem. 1997, 272, 25091–25098. [Google Scholar] [CrossRef] [Green Version]
- Chenal, A.; Savarin, P.; Nizard, P.; Guillain, F.; Gillet, D.; Forge, V. Membrane protein insertion regulated by bringing electrostatic and hydrophobic interactions into play: A case study with the translocation domain of the diphtheria toxin. J. Biol. Chem. 2002, 277, 43425–43432. [Google Scholar] [CrossRef] [Green Version]
- Ladokhin, A.S.; Legmann, R.; Collier, R.J.; White, S.H. Reversible refolding of the diphtheria toxin T-domain on lipid membranes. Biochemistry 2004, 43, 7451–7458. [Google Scholar] [CrossRef]
- Montagner, C.; Perier, A.; Pichard, S.; Vernier, G.; Ménez, A.; Gillet, D.; Forge, V.; Chenal, A. Behavior of the N-terminal helices of the diphtheria toxin T domain during the successive steps of membrane interaction. Biochemistry 2007, 46, 1878–1887. [Google Scholar] [CrossRef] [PubMed]
- Rodnin, M.V.; Kyrychenko, A.; Kienker, P.; Sharma, O.; Vargas-Uribe, M.; Collier, R.J.; Finkelstein, A.; Ladokhin, A.S. Replacement of C-terminal histidines uncouples membrane insertion and translocation in diphtheria toxin T-domain. Biophys. J. 2011, 101, L41–L43. [Google Scholar] [CrossRef] [Green Version]
- Vargas-Uribe, M.; Rodnin, M.V.; Kienker, P.; Finkelstein, A.; Ladokhin, A.S. Crucial role of H322 in folding of the diphtheria toxin T-domain into the open-channel state. Biochemistry 2013, 52, 3457–3463. [Google Scholar] [CrossRef] [Green Version]
- Senzel, L.; Gordon, M.; Blaustein, R.O.; Oh, K.J.; Collier, R.J.; Finkelstein, A. Topography of diphtheria toxin’s T domain in the open channel state. J. Gen. Physiol. 2000, 115, 421–434. [Google Scholar] [CrossRef] [Green Version]
- Mindell, J.A.; Silverman, J.A.; Collier, R.J.; Finkelstein, A. Structure function relationships in diphtheria toxin channels: II. A residue responsible for the channel’s dependence on trans pH. J. Membr. Biol. 1994, 137, 29–44. [Google Scholar] [CrossRef] [PubMed]
- Mindell, J.A.; Silverman, J.A.; Collier, R.J.; Finkelstein, A. Structure-function relationships in diphtheria toxin channels: III. Residues which affect the cis pH dependence of channel conductance. J. Membr. Biol. 1994, 137, 45–57. [Google Scholar] [CrossRef] [PubMed]
- Huynh, P.D.; Cui, C.; Zhan, H.; Oh, K.J.; Collier, R.J.; Finkelstein, A. Probing the structure of the diphtheria toxin channel: Reactivity in planar lipid bilayer membranes of cysteine-substituted mutant channels with methanethiosulfonate derivatives. J. Gen. Physiol. 1997, 110, 229–242. [Google Scholar] [CrossRef] [Green Version]
- Kyrychenko, A.; Lim, N.M.; Vasquez-Montes, V.; Rodnin, M.V.; Freites, J.A.; Nguyen, L.P.; Tobias, D.J.; Mobley, D.L.; Ladokhin, A.S. Refining protein penetration into the lipid bilayer using fluorescence quenching and molecular dynamics simulations: The case of diphtheria toxin translocation domain. J. Membr. Biol. 2018, 251, 379–391. [Google Scholar] [CrossRef]
- Ladokhin, A.S. Cellular entry of binary and pore-forming bacterial toxins. Toxins 2018, 10, 11. [Google Scholar] [CrossRef] [Green Version]
- Bennett, M.J.; Choe, S.; Eisenberg, D. Refined structure of dimeric diphtheria toxin at 2.0 Å resolution. Protein Sci. 1994, 3, 1444–1463. [Google Scholar] [CrossRef] [PubMed] [Green Version]
- Bennett, M.J.; Eisenberg, D. Refined structure of monomelic diphtheria toxin at 2.3 Å resolution. Protein Sci. 1994, 3, 1464–1475. [Google Scholar] [CrossRef]
- Evans, P. An introduction to data reduction: Space-group determination, scaling and intensity statistics. Acta Crystallogr. 2011, D67, 282–292. [Google Scholar] [CrossRef] [Green Version]
- Evans, P. Scaling and assessment of data quality. Acta Crystallogr. 2006, D62, 72–82. [Google Scholar] [CrossRef]
- Diederichs, K.; Karplus, P.A. Improved R-factors for diffraction data analysis in macromolecular crystallography. Nat. Struct. Biol. 1997, 4, 269–275. [Google Scholar] [CrossRef]
- Weiss, M.S. Global indicators of X-ray data quality. J. Appl. Crystallogr. 2001, 34, 130–135. [Google Scholar] [CrossRef]
- Karplus, P.A.; Diederichs, K. Linking crystallographic model and data quality. Science 2012, 336, 1030. [Google Scholar] [CrossRef] [Green Version]
- Evans, P. Resolving some old problems in protein crystallography. Science 2012, 336, 986. [Google Scholar] [CrossRef]
- Mansoor, S.E.; McHaourab, H.S.; Farrens, D.L. Mapping proximity within proteins using fluorescence spectroscopy. A study of T4 lysozyme showing that tryptophan residues quench bimane fluorescence. Biochemistry 2002, 41, 2475–2484. [Google Scholar] [CrossRef]
- Mansoor, S.E.; DeWitt, M.A.; Farrens, D.L. Distance mapping in proteins using fluorescence spectroscopy: The tryptophan-induced quenching (TRIQ) method. Biochemistry 2010, 49, 9722–9731. [Google Scholar] [CrossRef] [Green Version]
- Li, J.; Rodnin, M.V.; Ladokhin, A.S.; Gross, M.L. Hydrogen-deuterium exchange and mass spectrometry reveal the pH-dependent conformational changes of diphtheria toxin T domain. Biochemistry 2014, 53, 6849–6856. [Google Scholar] [CrossRef]
- Perier, A.; Chassaing, A.; Raffestin, S.; Pichard, S.; Masella, M.; Ménez, A.; Forge, V.; Chenal, A.; Gillet, D. Concerted protonation of key histidines triggers membrane interaction of the diphtheria toxin T domain. J. Biol. Chem. 2007, 282, 24239–24245. [Google Scholar] [CrossRef] [Green Version]
- Ladokhin, A. pH-triggered conformational switching along the membrane insertion pathway of the diphtheria toxin T-domain. Toxins 2013, 5, 1362–1380. [Google Scholar] [CrossRef] [Green Version]
- Ladokhin, A.S.; Vargas-Uribe, M.; Rodnin, M.V.; Ghatak, C.; Sharma, O. Cellular entry of the diphtheria toxin does not require the formation of the open-channel state by its translocation domain. Toxins 2017, 9, 299. [Google Scholar] [CrossRef] [PubMed] [Green Version]
- Barbieri, J.T.; Collier, R.J. Expression of a mutant, full-length form of diphtheria toxin in escherichia coli. Infect. Immun. 1987, 55, 1647–1651. [Google Scholar] [CrossRef] [Green Version]
- Haugland, R.P. Handbook of Fluorescent Probes and Research Chemicals, 6th ed.; Molecular Probes, Inc.: Eugene, OR, USA, 1996; p. 390. [Google Scholar]
- Kabsch, W. Automatic indexing of rotation diffraction patterns. J. Appl. Crystallogr. 1988, 21, 67–72. [Google Scholar] [CrossRef]
- Kabsch, W. XDS. Acta Crystallogr. 2010, D66, 125–132. [Google Scholar] [CrossRef] [PubMed] [Green Version]
- Vonrhein, C.; Flensburg, C.; Keller, P.; Sharff, A.; Smart, O.; Paciorek, W.; Womack, T.; Bricogne, G. Data processing and analysis with the autoPROC toolbox. Acta Crystallogr. 2011, D67, 293–302. [Google Scholar] [CrossRef] [Green Version]
- Matthews, B.W. Solvent content of protein crystals. J. Mol. Biol. 1968, 33, 491–497. [Google Scholar] [CrossRef]
- McCoy, A.J.; Grosse-Kunstleve, R.W.; Adams, P.D.; Winn, M.D.; Storoni, L.C.; Read, R.J. Phaser crystallographic software. J. Appl. Crystallogr. 2007, 40, 658–674. [Google Scholar] [CrossRef] [Green Version]
- Emsley, P.; Lohkamp, B.; Scott, W.G.; Cowtan, K. Features and development of coot. Acta Crystallogr. 2010, D66, 486–501. [Google Scholar] [CrossRef] [Green Version]
- Chen, V.B.; Arendall, W.B., III; Headd, J.J.; Keedy, D.A.; Immormino, R.M.; Kapral, G.J.; Murray, L.W.; Richardson, J.S.; Richardson, D.C. MolProbity: All-atom structure validation for macromolecular crystallography. Acta Crystallogr. 2010, D66, 12–21. [Google Scholar] [CrossRef] [Green Version]
- Potterton, L.; McNicholas, S.; Krissinel, E.; Gruber, J.; Cowtan, K.; Emsley, P.; Murshudov, G.N.; Cohen, S.; Perrakis, A.; Noble, M. Developments in the CCP4 molecular-graphics project. Acta Crystallogr. 2004, D60, 2288–2294. [Google Scholar] [CrossRef] [Green Version]
- Krissinel, E. Enhanced fold recognition using efficient short fragment clustering. J. Mol. Biochem. 2012, 1, 76–85. [Google Scholar]


| DT-5.0 | DT-5.5 | DT-6.0 | DT-7.0 | |
|---|---|---|---|---|
| Data Collection | ||||
| Unit-cell parameters (Å, °) | a = 69.04 b = 69.16 c = 73.38 α = 122.1 β = 93.7 γ = 97.9 | a = 69.55 b = 69.67 c = 73.40 α = 117.6 β = 93.5 γ = 98.1 | a = 69.44 b = 69.61 c = 73.12 α = 117.9 β = 93.9 γ = 97.9 | a = 69.38 b = 69.64 c = 73.15 α = 117.5 β = 93.3 γ = 98.3 |
| Space group | P1 | P1 | P1 | P1 |
| Resolution (Å) 1 | 49.59-2.05 | 46.77-2.05 | 46.57-2.10 | 46.74-2.30 |
| Wavelength (Å) | 1.0000 | 1.0000 | 1.0000 | 1.0000 |
| Temperature (K) | 100 | 100 | 100 | 100 |
| Observed reflections | 239,575 | 253,521 | 236,012 | 183,332 |
| Unique reflections | 68,617 | 72,784 | 67,346 | 51,695 |
| <I/ (I)> 1 | 10.0 (1.7) | 9.8 (1.7) | 10.7 (1.8) | 9.7 (1.8) |
| Completeness (%) 1 | 97.3 (96.6) | 96.9 (96.8) | 97.4 (96.9) | 97.7 (97.3) |
| Multiplicity 1 | 3.5 (3.5) | 3.5 (3.5) | 3.5 (3.5) | 3.5 (3.6) |
| Rmerge (%) 1,2 | 6.2 (79.2) | 6.6 (79.8) | 5.7 (69.6) | 7.3 (75.4) |
| Rmeas (%) 1,4 | 7.4 (93.6) | 8.2 (93.9) | 7.3 (83.1) | 8.6 (88.5) |
| Rpim (%) 1,4 | 3.9 (49.3) | 4.2 (49.8) | 3.6 (43.9) | 4.5 (46.0) |
| CC1/2 1 | 0.998 (0.681) | 0.998 (0.656) | 0.998 (0.753) | 0.997 (0.698) |
| Refinement | ||||
| Resolution (Å) 1 | 36.61-2.05 | 35.03-2.05 | 36.43-2.10 | 32.72-2.30 |
| Reflections (working/test) 1 | 65,164/3424 | 69,202/3554 | 64,135/3175 | 49,240/2428 |
| Rfactor / Rfree (%) 1,3 | 19.7/25.0 | 18.3/24.3 | 21.0/25.8 | 18.5/24.1 |
| No. of atoms (Protein/Water) | 7444/321 | 7401/353 | 7491/227 | 7591/201 |
| Model Quality | ||||
| R.M.S deviations | ||||
| Bond lengths (Å) | 0.009 | 0.009 | 0.010 | 0.009 |
| Bond angles (°) | 0.915 | 0.905 | 0.941 | 0.959 |
| Mean B-factor (Å2) | ||||
| All Atoms | 50.3 | 46.6 | 56.0 | 56.3 |
| Protein | 50.5 | 46.7 | 56.3 | 56.5 |
| Water | 46.0 | 44.4 | 48.4 | 48.9 |
| Coordinate error (maximum likelihood) (Å) | 0.28 | 0.25 | 0.28 | 0.32 |
| Ramachandran Plot | ||||
| Most favored (%) | 96.1 | 97.1 | 95.6 | 96.2 |
| Additionally allowed (%) | 3.5 | 2.4 | 3.6 | 2.9 |
Publisher’s Note: MDPI stays neutral with regard to jurisdictional claims in published maps and institutional affiliations. |
© 2020 by the authors. Licensee MDPI, Basel, Switzerland. This article is an open access article distributed under the terms and conditions of the Creative Commons Attribution (CC BY) license (http://creativecommons.org/licenses/by/4.0/).
Share and Cite
Rodnin, M.V.; Kashipathy, M.M.; Kyrychenko, A.; Battaile, K.P.; Lovell, S.; Ladokhin, A.S. Structure of the Diphtheria Toxin at Acidic pH: Implications for the Conformational Switching of the Translocation Domain. Toxins 2020, 12, 704. https://0-doi-org.brum.beds.ac.uk/10.3390/toxins12110704
Rodnin MV, Kashipathy MM, Kyrychenko A, Battaile KP, Lovell S, Ladokhin AS. Structure of the Diphtheria Toxin at Acidic pH: Implications for the Conformational Switching of the Translocation Domain. Toxins. 2020; 12(11):704. https://0-doi-org.brum.beds.ac.uk/10.3390/toxins12110704
Chicago/Turabian StyleRodnin, Mykola V., Maithri M. Kashipathy, Alexander Kyrychenko, Kevin P. Battaile, Scott Lovell, and Alexey S. Ladokhin. 2020. "Structure of the Diphtheria Toxin at Acidic pH: Implications for the Conformational Switching of the Translocation Domain" Toxins 12, no. 11: 704. https://0-doi-org.brum.beds.ac.uk/10.3390/toxins12110704