Author Contributions
Conceptualization, Y.-C.C. and W.-J.C.; Validation, Y.-C.C., Y.-T.C., J.-F.C. and W.-J.C.; Data analysis, Y.-C.C., J.-H.S., C.-H.H. and W.-J.C.; Resources, Y.-C.C., Y.-T.C., J.-F.C., C.-Y.C., C.-H.C. and W.-J.C.; Data curation, Y.-C.C., Y.-T.C. J.-F.C. and W.-J.C.; Supervision, W.-J.C.; Writing—original draft, Y.-C.C. Writing—review & editing, Y.-C.C. and W.-J.C.; Funding acquisition, W.-J.C. All authors have read and agreed to the published version of the manuscript.
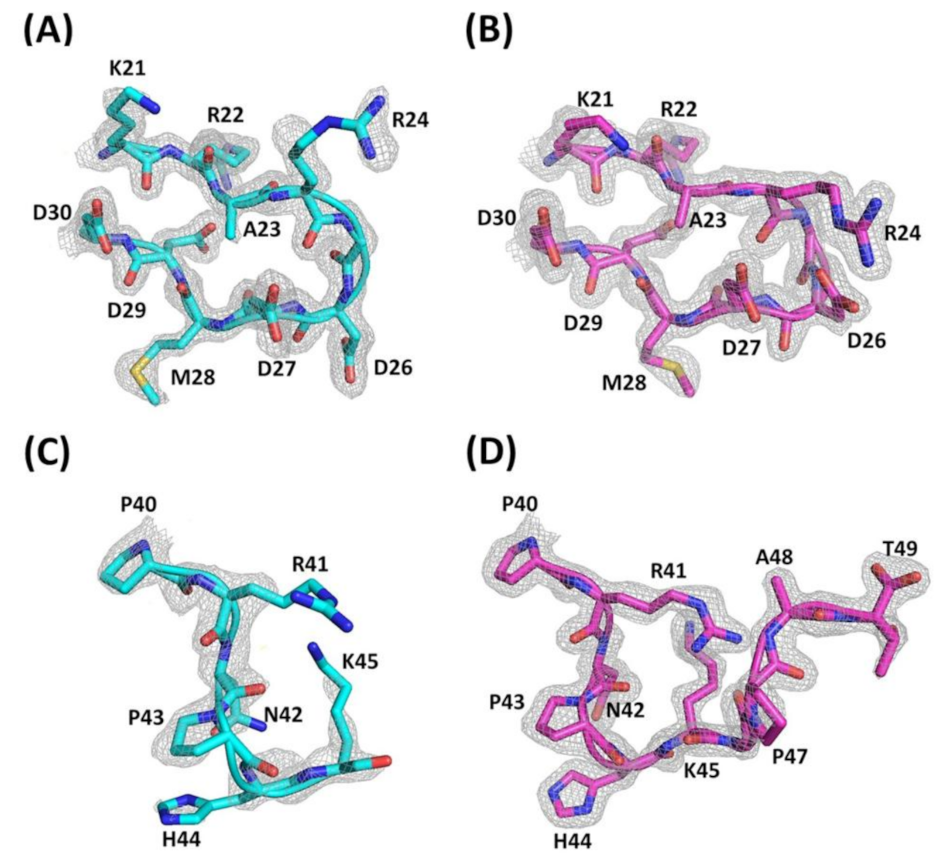
Figure 1.
Electron density map of the RGD loop and C-termini of Ech. The 2|Fo|- |Fc| electron density map at 1.80 Å resolution is contoured at 1.0 σ around the residues from the RGD loop (K21-D30) and C-terminus (P40-T49). (A) Electron density map of the RGD loop with residues K21 to D30 (chain A); (B) Electron density map of the RGD loop with residues K21 to D30 (chain B); (C) Electron density map of the C-terminus with residues P40 to K45 (chain A); (D) Electron density map of the C-terminus with residues P40 to T49 (chain B).
Figure 2.
Comparison of X-ray and NMR structures of Ech. The β-sheet secondary structure is shown in cyan. The side chains of the R and D residues in the RGD loop are shown in blue and red, and disulfide bond linkages are shown in red. (A) Crystal structure of Ech chain A; (B) Crystal structure of Ech chain B; (C) Superimposition of Ech chain A and B, shown in cyan and magenta, respectively; (D) Superimposition of Ech chain A and B RGD loop with residues K21 to D30; (E) Superimposition of Ech chain A and B C-terminus with residues P40 to T49; (F) NMR structure (2Ech) of Ech; (G) Superimposition of Ech chain A and NMR structure (2Ech). Chain A and the NMR structure are shown in cyan and gray, respectively.
Figure 3.
Structural comparison of the RGD loops (K21-D30) and sequence alignment of Ech and trimestatin (1J2L). (A) The conformation of Ech’s RGD loop (chain A). The Cα to Cα distance between residues R24 and D26 is shown; (B) The conformation of Ech’s RGD loop (chain B). The Cα to Cα distance between residues R24 and D26 is shown; (C) The conformation of trimestatin’s RGD loop. The Cα to Cα distance between residues R49 and D51 is shown; (D) Hydrogen bonds (residues K21-D30, A23-D29, and R24-D27) of Ech’s RGD loop (chain A); (E) Hydrogen bonds (residues K21-D30, A23-D29, and R24-D27) of Ech’s RGD loop (chain B); (F) Hydrogen bonds (residues R46-D55 and A48-D54) of trimestatin’s RGD loop; (G) Sequence alignment of Ech and trimestatin. The conserved residues are boxed in gray.
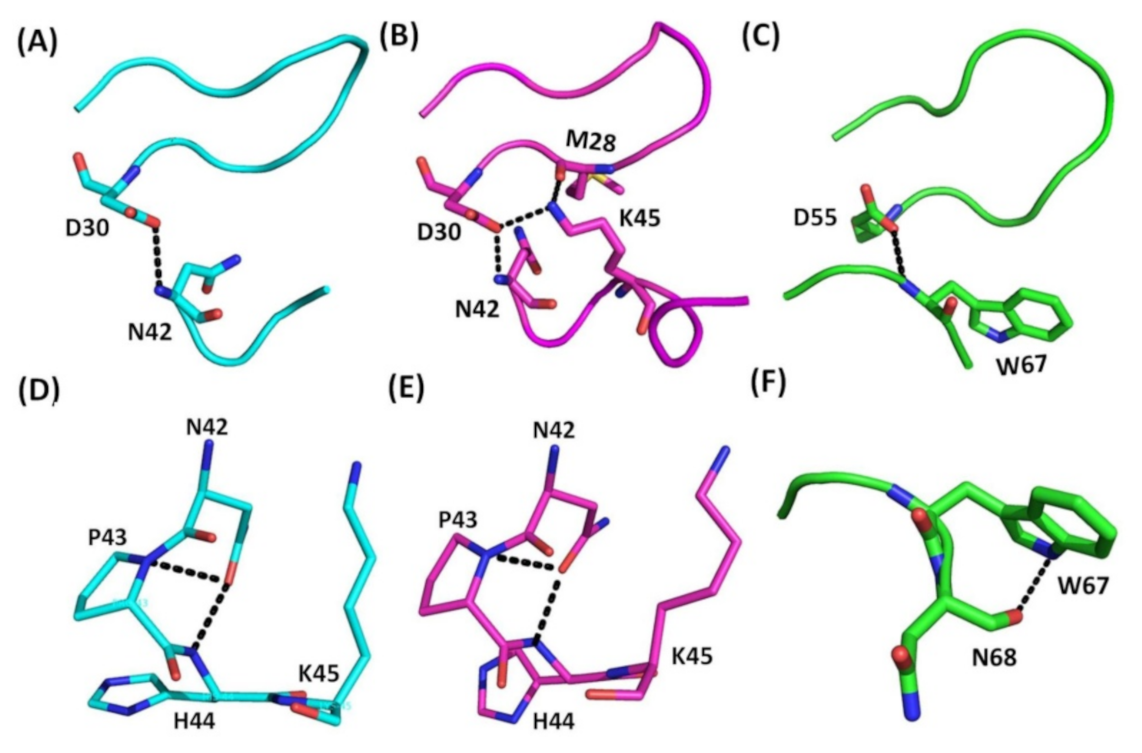
Figure 4.
Comparison of hydrogen bonding interactions between the RGD loop and C-terminus in Ech and trimestatin, as well as those within the C-terminus. (A) Hydrogen bond between RGD loop and C-terminus (chain A); The hydrogen bond between the side chain of the D30 residue in the RGD loop and the amide proton of the N42 residue in the C-terminus is shown; (B) Hydrogen bonds between the RGD loop and C-terminus (chain B). Three hydrogen bonds between the carboxyl group of residue M28 and the sidechain Nζ proton of residue K45, between the side chain of residue D30 and the amide proton of residue N42, and between the side chain of residue D30 and the sidechain Nζ proton of residue K45; (C) Hydrogen bond between the RGD loop and C-terminus in trimestatin. The hydrogen bond between the side chain of the D55 residue in the RGD loop and the amide proton of the W67 residue in the C-terminus is shown; (D) Interaction in Ech C-terminus (chain A). The interaction between the side chain of the N42 residue and the mainchain amide proton of residues P43 and H44; (E) Interaction in Ech C-terminus (chain B). The interaction between the side chain of the N42 residue and the mainchain amide proton of residues P43 and H44; (F) Hydrogen bond in the C-terminus of trimestatin. The hydrogen bond between the side chain of residue W67 and the backbone carboxyl group of residue N68.
![Toxins 12 00709 g004]()
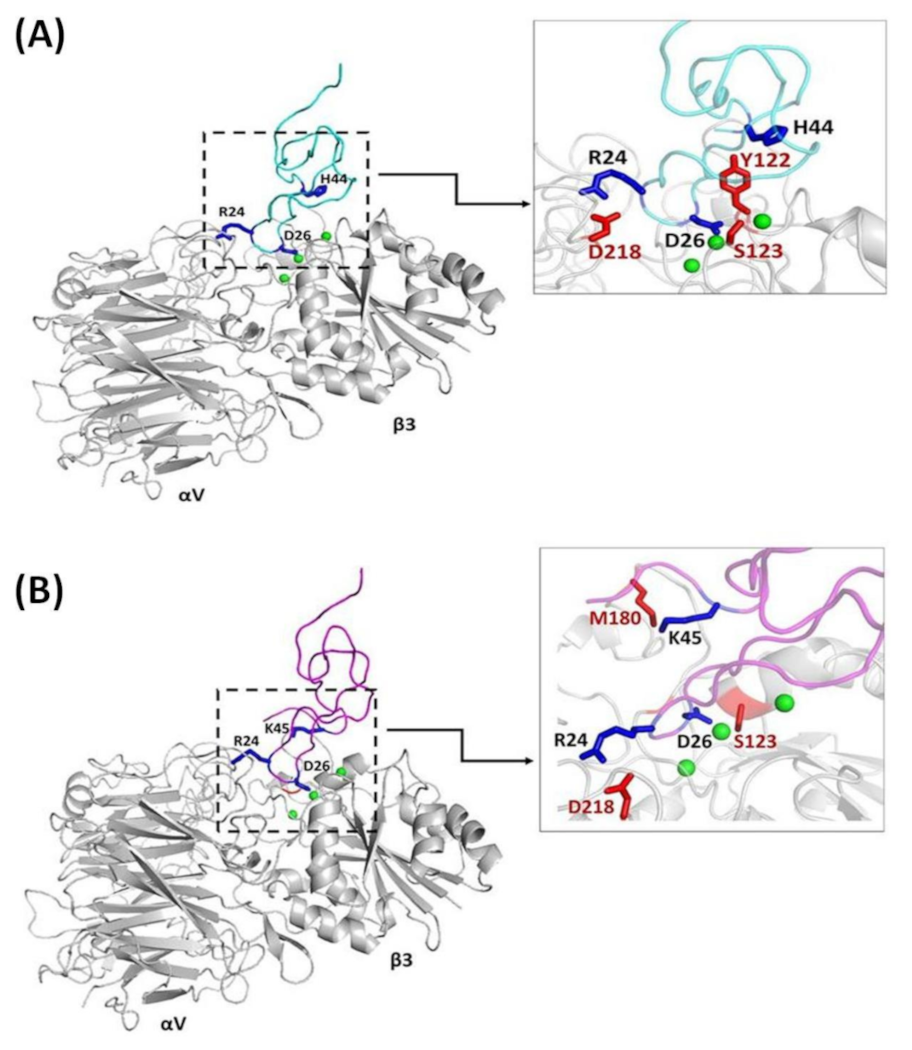
Figure 5.
The interactions between Ech and αvβ3 integrin. (A) Ech chain A (cyan) docked on αvβ3 (PDB code 1L5G, gray); the main chains and side chains of the RGD loop and C-terminal interacting residues are labeled; (B) Ech chain B (magenta) docked on αvβ3; the main chains and side chains of the RGD loop and C-terminal interacting residues are labeled.
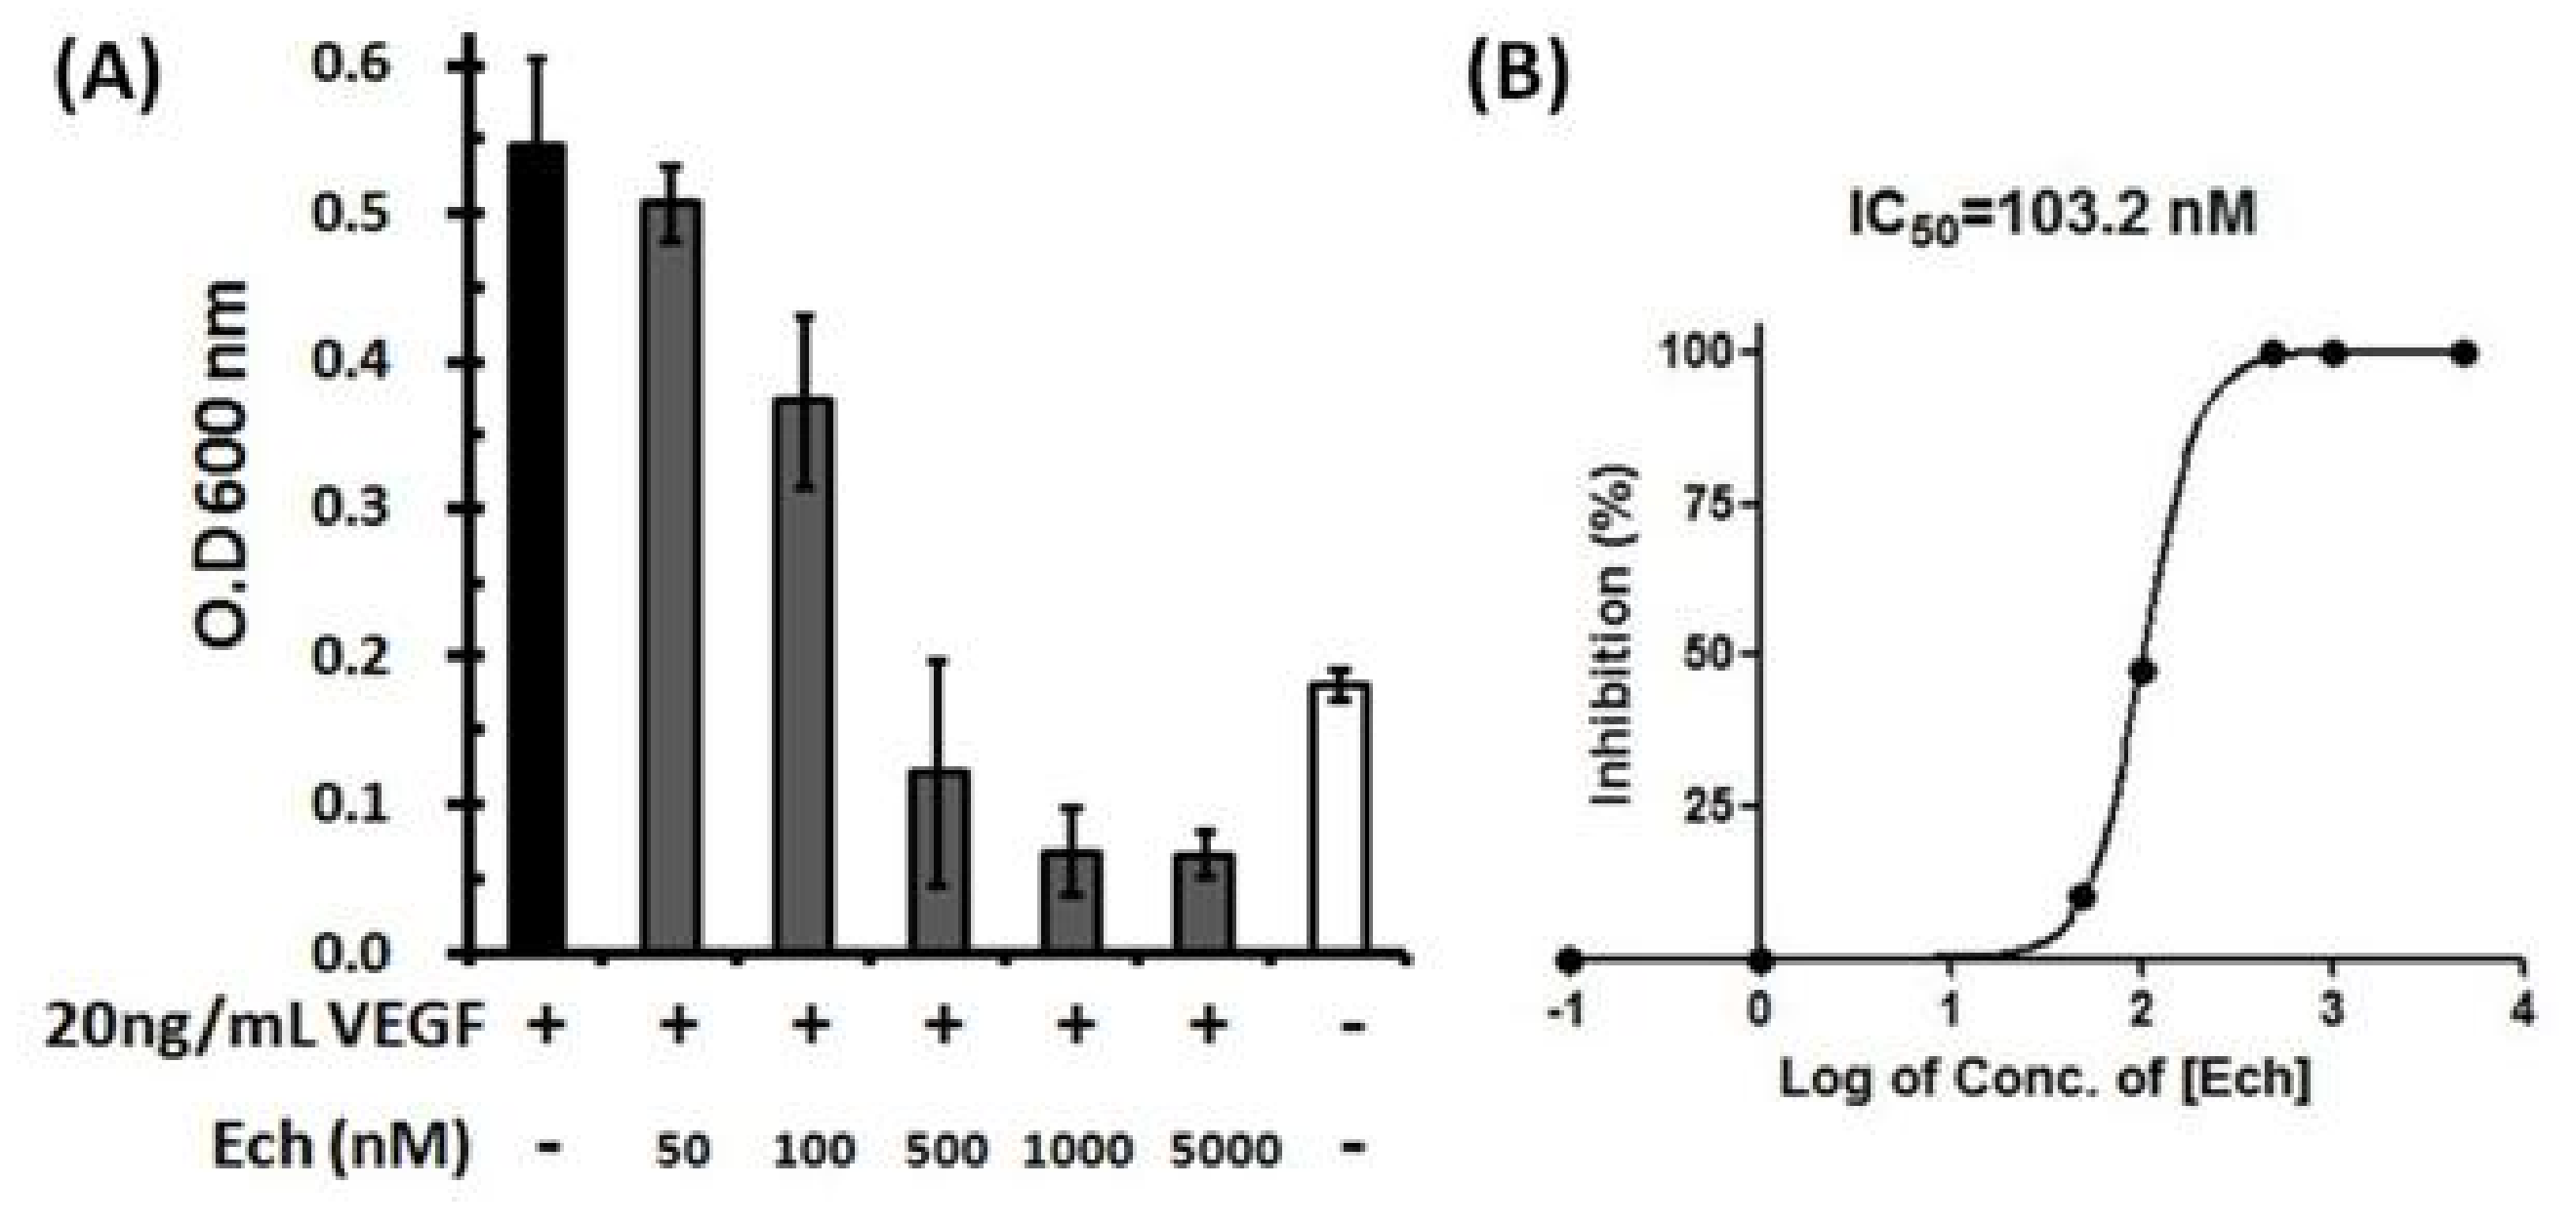
Figure 6.
Inhibition of VEGF-induced HUVEC proliferation by Ech. (A) Quantitative analysis of HUVECs is shown in the histogram. The results are shown as the percentage of inhibition, and three independent experiments were performed; (B) A representative fitting curve from one independent experiment is shown, and the resulting IC50 value was 103.2 nM. HUVECs were plated in 96-well plates in the presence or absence of Ech and allowed to grow for 48 h. The cells were incubated with 20 ng/mL VEGF and then treated with 50, 100, 500, 1000, and 5000 nM Ech. The numbers of cells were quantified using crystal violet stain, and the absorbance was determined by an ELISA reader at 600 nm.
Figure 7.
Inhibition of human glioblastoma U373 MG cell migration by Ech and its K45E mutant. (A) Human glioblastoma U373 MG cells were plated on a transwell filter in the presence or absence of Ech proteins and allowed to migrate for 6 h. The cells were treated with 1.53, 5.1, 15.3, 51, 153, and 1530 nM recombinant Ech proteins. The numbers of migrated cells were quantified by counting stained cells microscopically; (B) The results are expressed as the percentage of inhibition, and the inhibition of U373 MG cell migration by Ech and its K45E mutant was dose dependent. The mean of three independent experiments is shown.
Figure 8.
Inhibition of human pancreatic Panc-1 cell migration by Ech and its K45E mutant. (A) Human pancreatic Panc-1 cells were plated on a transwell filter in the presence or absence of Ech proteins and allowed to migrate for 6 h. The cells were treated with 1.53, 5.1, 15.3, 51, 153, and 1530 nM recombinant Ech proteins. The numbers of migrated cells were quantified by counting stained cells microscopically; (B) The results are expressed as the percentage of inhibition, and the inhibition of Panc-1 cell migration by Ech and its K45E mutant was dose dependent. The mean of three independent experiments is shown.
Table 1.
Data collection and structure refinement.
Table 1.
Data collection and structure refinement.
Crystals
PDB Code | Echistatin
6LSQ |
|---|
| Data collection | |
| Radiation source | NSRRC TPS05A |
| Wavelength (Å) | 0.99984 |
| Space group | P3221 |
| Unit cell parameters | |
| a (Å) | 33.79 |
| b (Å) | 33.79 |
| c (Å) | 120.90 |
| α | 90.00 |
| β | 90.00 |
| γ | 120.00 |
| Resolution (Å) | 30.00–1.80 (1.91–1.80) |
| No. of reflections | 7695 (1245) |
| Completeness (%) | 92.5 (90.0) |
| I/σ (I) | 7.88 (2.96) |
| CC1/2 | 99.1 (95.1) |
| Refinement | |
| Resolution (Å) | 28.44–1.80 |
| Reflections (work) | 7541 |
| Reflections (free) | 419 |
| Rwork (%) | 21.2 |
| Rfree (%) | 25.5 |
| Geometry deviations | |
| Bond length (Å) | 0.009 |
| Bond angles (°) | 1.461 |
| Mean B values (Å2) | 28.851 |
| Ramachandran plot 1 (%) | |
| Favored | 95.7 |
| Allowed | 4.3 |
Table 2.
Comparison of the Cα(Ri)-Cα(Di + 2), Cβ(Ri)-Cβ(Di + 2), Cζ(Ri)-Cγ(Di + 2), and Cα(Ri)-Cα(Xi + 3) distances (Å) of echistatin and trimestatin.
Table 2.
Comparison of the Cα(Ri)-Cα(Di + 2), Cβ(Ri)-Cβ(Di + 2), Cζ(Ri)-Cγ(Di + 2), and Cα(Ri)-Cα(Xi + 3) distances (Å) of echistatin and trimestatin.
| Ligands | RGD Motif | Cα(Ri)-Cα(Di + 2) | Cβ(Ri)-Cβ(Di + 2) | Cζ(Ri)-Cγ(Di + 2) | Cα(Ri)-Cα(Xi + 3) |
|---|
| Echistatin (NMR) 1 | ARGDDM | 6.2 ± 0.75 | 8.2 ± 1.1 | 12.3 ± 0.7 | 6.3 ± 0.8 |
| Echistatin (A chain) | ARGDDM | 6.5 | 8.6 | 12.4 | 6.2 |
| Echistatin (B chain) | ARGDDM | 5.8 | 6.0 | 4.8 | 5.4 |
| Trimestatin 2 | ARGDFP | 6.7 | 9.2 | 11.1 | 6.8 |
Table 3.
Summary of the interactions between Ech chain A and αvβ3 integrin.
Table 3.
Summary of the interactions between Ech chain A and αvβ3 integrin.
| Ech | αvβ3 |
|---|
| Chain A | αv | β3 |
|---|
| R22 | | N313 |
| R24 | D150, D218 | |
| G25 | D218 | |
| D26 | | S121, Y122, S123, N215, R216, D217 |
| Y31 | | D126 |
| H44 | | Y122 |
Table 4.
Summary of the interactions between Ech chain B and αvβ3 integrin.
Table 4.
Summary of the interactions between Ech chain B and αvβ3 integrin.
| Ech | αvβ3 |
|---|
| Chain B | αv | β3 |
|---|
| R24 | D150, D218 | |
| D26 | | S121, Y122, S123, N215, R216, D217 |
| M28 | | D126 |
| Y31 | | D126 |
| K45 | | M180 |
Table 5.
Summary of inhibition of cell adhesion by Ech and its C-terminal truncated mutant.
Table 5.
Summary of inhibition of cell adhesion by Ech and its C-terminal truncated mutant.
| Protein | Sequence | | | IC50 (nM) | | | |
|---|
| (Mutant) | RGD Loop | C-Terminus | αvβ3 | αIIbβ3 | α5β1 | αvβ5 |
|---|
| Ech | 23ARGDDM | 42NPHKGPAT | 20.7 ± 8.0 | 51.5 ± 3.9 | 132.6 ± 15.7 | 286.4 ± 53.6 |
| Ech (P43∆) | 23ARGDDM | 42NP | 132.0 ± 12.0 | 362.3 ± 56.3 | 2469.5 ± 97.7 | 3358.3 ± 1040.4 |
Table 6.
Summary of inhibition of cell adhesion by Ech and its C-terminal alanine mutants.
Table 6.
Summary of inhibition of cell adhesion by Ech and its C-terminal alanine mutants.
| Protein | RGD Loop | C-Terminus | | IC50 (nM) | |
|---|
| (Mutant) | Sequence | Sequence | αvβ3 | αIIbβ3 | α5β1 |
|---|
| Ech | 23ARGDDM | 42NPHKGPAT | 20.7 ± 8.0 | 51.5 ± 3.9 | 132.6 ± 15.7 |
| Ech (P43A) | 23ARGDDM | 42NAHKGPAT | 13.8 ± 1.1 | 67.7 ± 35.0 | 58.5 ± 9.5 |
| Ech (H44A) | 23ARGDDM | 42NPAKGPAT | 16.4 ± 6.9 | 20.7 ± 4.5 | 30.0 ± 5.3 |
| Ech (K45A) | 23ARGDDM | 42NPHAGPAT | 14.7 ± 4.0 | 132.5 ± 53.3 | 84.9 ± 24.9 |
Table 7.
Summary of inhibition of angiogenesis activity by Ech and other disintegrins.
Table 7.
Summary of inhibition of angiogenesis activity by Ech and other disintegrins.
| Protein | RGD Motif | C-Terminal Sequence | IC50 (nM) |
|---|
| Echistatin | ARGDDM | NPHKGPAT | 103.2 |
| Saxatilin | ARGDDM | NPFHA | 100.0 |
| Salmosin | ARGDDL | NPFHA | 130.0–270.0 |
| Triflavin | ARGDFP | WNGL | 100.0–400.0 |
| Rhodostomin | PRGDMP | YH | 108.0 |
Table 8.
Summary of inhibition of tumor cell migration by Ech and its C-terminal mutants.
Table 8.
Summary of inhibition of tumor cell migration by Ech and its C-terminal mutants.
| Protein | Sequence | IC50 (nM) | |
|---|
| RGD Loop | C-Terminus | A375 | U373MG | Panc-1 |
|---|
| Ech | 23ARGDDM | 42NPHKGPAT | 1.5 | 5.7 | 154.5 |
| Ech (K45E) | 23ARGDDM | 42NPHEGPAT | 13.3 | 27.2 | 1603.0 |


