Article

A Lateral Flow Strip Based on a Truncated Aptamer-Complementary Strand for Detection of Type-B Aflatoxins in Nuts and Dried Figs

1
Hebei University, No. 180 Wusi Dong Road, Lian Chi District, Baoding 071002, Hebei Province, China
2
Beijing Research Center for Agricultural Standards and Testing, No. 9 Middle Road of Shuguanghuayuan, Haidian Dist. Beijing 100097, China
3
Institute of Quality Standards and Testing Technology for Agro-products, Key Laboratory of Agro-product Quality and Safety, Chinese Academy of Agricultural Sciences, Beijing 100081, China
*
Authors to whom correspondence should be addressed.
Submission received: 30 January 2020 / Revised: 18 February 2020 / Accepted: 20 February 2020 / Published: 22 February 2020
(This article belongs to the Section Mycotoxins)

Abstract

:
Type-B aflatoxins (AFB1 and AFB2) frequently contaminate food, especially nuts and fried figs, and seriously threaten human health; hence, it is necessary for the newly rapid and sensitive detection methods to prevent the consumption of potentially contaminated food. Here, a lateral flow aptasensor for the detection of type-B aflatoxins was developed. It is based on the use of fluorescent dye Cy5 as a label for the aptamer, and on the competition between type-B aflatoxins and the complementary DNA of the aptamer. This is the first time that the complementary strand of the aptamer has been used as the test line (T-line) to detect type-B aflatoxins. In addition, the truncated aptamer was used to improve the affinity with type-B aflatoxins in our study. Therefore, the lengths of aptamer and cDNA probe were optimized as key parameters for higher sensitivity. In addition, binding buffer and organic solvent were investigated. The results showed that the best pair for achieving improved sensitivity and accuracy in detecting AFB1 was formed by a shorter aptamer (32 bases) coupled with the probe complementary to the AFB1 binding region of the aptamer. Under the optimal experimental conditions, the test strip showed an excellent linear relationship in the range from 0.2 to 20 ng/mL with a limit of detection of 0.16 ng/mL. This aptamer-based strip was successfully applied to the determination of type-B aflatoxins in spiked and commercial peanuts, almonds, and dried figs, and the recoveries of the spiked samples were from 93.3%−112.0%. The aptamer-complementary strand-based lateral flow test strip is a potential alternative tool for the rapid and sensitive detection of type-B aflatoxins in nuts and dried figs. It is of help for monitoring aflatoxins to avoid the consumption of unsafe food.
Key Contribution: Based on the truncated aptamer and its complementary DNA, a sensitive fluorescent lateral flow aptasensor for simultaneous detection of AFB1 and AFB2 was developed. This sensor was successfully applied to the determination of type-B aflatoxins in peanuts, almonds, and dried figs, with a limit of detection of 0.16 ng/mL.

1. Introduction

Type-B aflatoxins, including aflatoxin B1 and B2 (AFB1 and AFB2), produced by Aspergillus species, have the highest toxicity among mycotoxins that seriously threaten the health of humans and animals [1]. AFB1 is highly carcinogenic, mutagenic, and teratogenic, as reported by the International Agency for Cancer (IARC) [2]. It is estimated that up to 28% of the total worldwide cases of hepatocellular carcinoma were caused by AFB1 [3]. In fact, consumption of nuts and dried fruits is one of the most important contributors to human exposure to mycotoxins, especially AFB1 [4]. According to data from the Rapid Alert System for Food and Feed (RASFF), there was a total of 460 border rejections in 2018 for mycotoxins, of which 90.2% were for aflatoxins, mainly from nuts, nut products, and figs. To ensure food safety and protect human health, many countries and regions in the world have set maximum allowable limits for AFB1 in nuts and dried figs, which are typically set as 2–8 μg/kg by the European Union [5], and 5–20 μg/kg by China [6]. However, a recent survey showed that the nuts and dried figs collected from China were seriously contaminated by AFB1, with the highest levels of 40.7 and 384.1 μg/kg [6], respectively, which far exceeded China’s limits. Therefore, it is necessary to develop rapid, sensitive, and reliable detection methods for type-B aflatoxins monitoring to prevent the consumption of insecure food.
Conventional approaches, including high-performance liquid chromatography (HPLC) [7,8] and HPLC-tandem mass spectrometry (HPLC-MS/MS) [5,6], have been widely used for AFB1 detection in nuts and dried fruits, but generally these methods need expensive instruments, highly skilled personnel, and complex pretreatment steps, making them difficult to use for real-time, fast and in-field detection. In addition to instrumental methods, immunoassays have proven to be effective in routine diagnostic applications for type-B aflatoxins. In particular, the lateral flow immunoassay (LFIA) is more attractive due to its advantages of visual observation, simple operations, and low testing costs [9]. However, classic LFIA detection uses antibodies as the bioreceptor elements, which are susceptible to physical and chemical conditions [10,11]. Aptamers are single-stranded DNA or RNA fragments obtained by the Systematic Evolution of Ligands by Exponential Enrichment (SELEX) [12]. Compared with antibodies, aptamers possess outstanding features, including non-immunogenicity, better thermal and chemical stability, high reproducibility, easy modification with various chemical groups, and a low synthesis cost [13,14,15]. Furthermore, aptamer-based lateral flow strips (ALFs) show more long-term preservation and cost effectiveness.
To date, AFLs have been reported for the detection of ochratoxin A [16,17,18], zearalenone [19] and AFB1 [20]. However, the existing AFLs was based on the competition between free AFB1 and immobilized hapten-albumin from bovine serum (BSA) for binding to the AFB1 aptamer. It is well known that the preparation for hapten conjugate is expensive, toxic, and difficult to synthesize. In addition, the truncated aptamer for AFB1 detection showed better performance than the parent aptamers [21]. Therefore, the aim of our study was to find suitable complementary strands to achieve a balance between reduced affinity to aptamer and high efficiency of hybridization with truncated aptamer, and then develop a fluorescent lateral flow strip based on a truncated aptamer-complementary strand for rapid and sensitive detection of type-B aflatoxins in nuts and dried figs. After optimization, this protocol was evaluated and validated by LC-MS/MS. To the best of our knowledge, this is the first time that the complementary strand of the aptamer was used as the test line (T-line) to detect type-B aflatoxins.

2. Results and Discussion

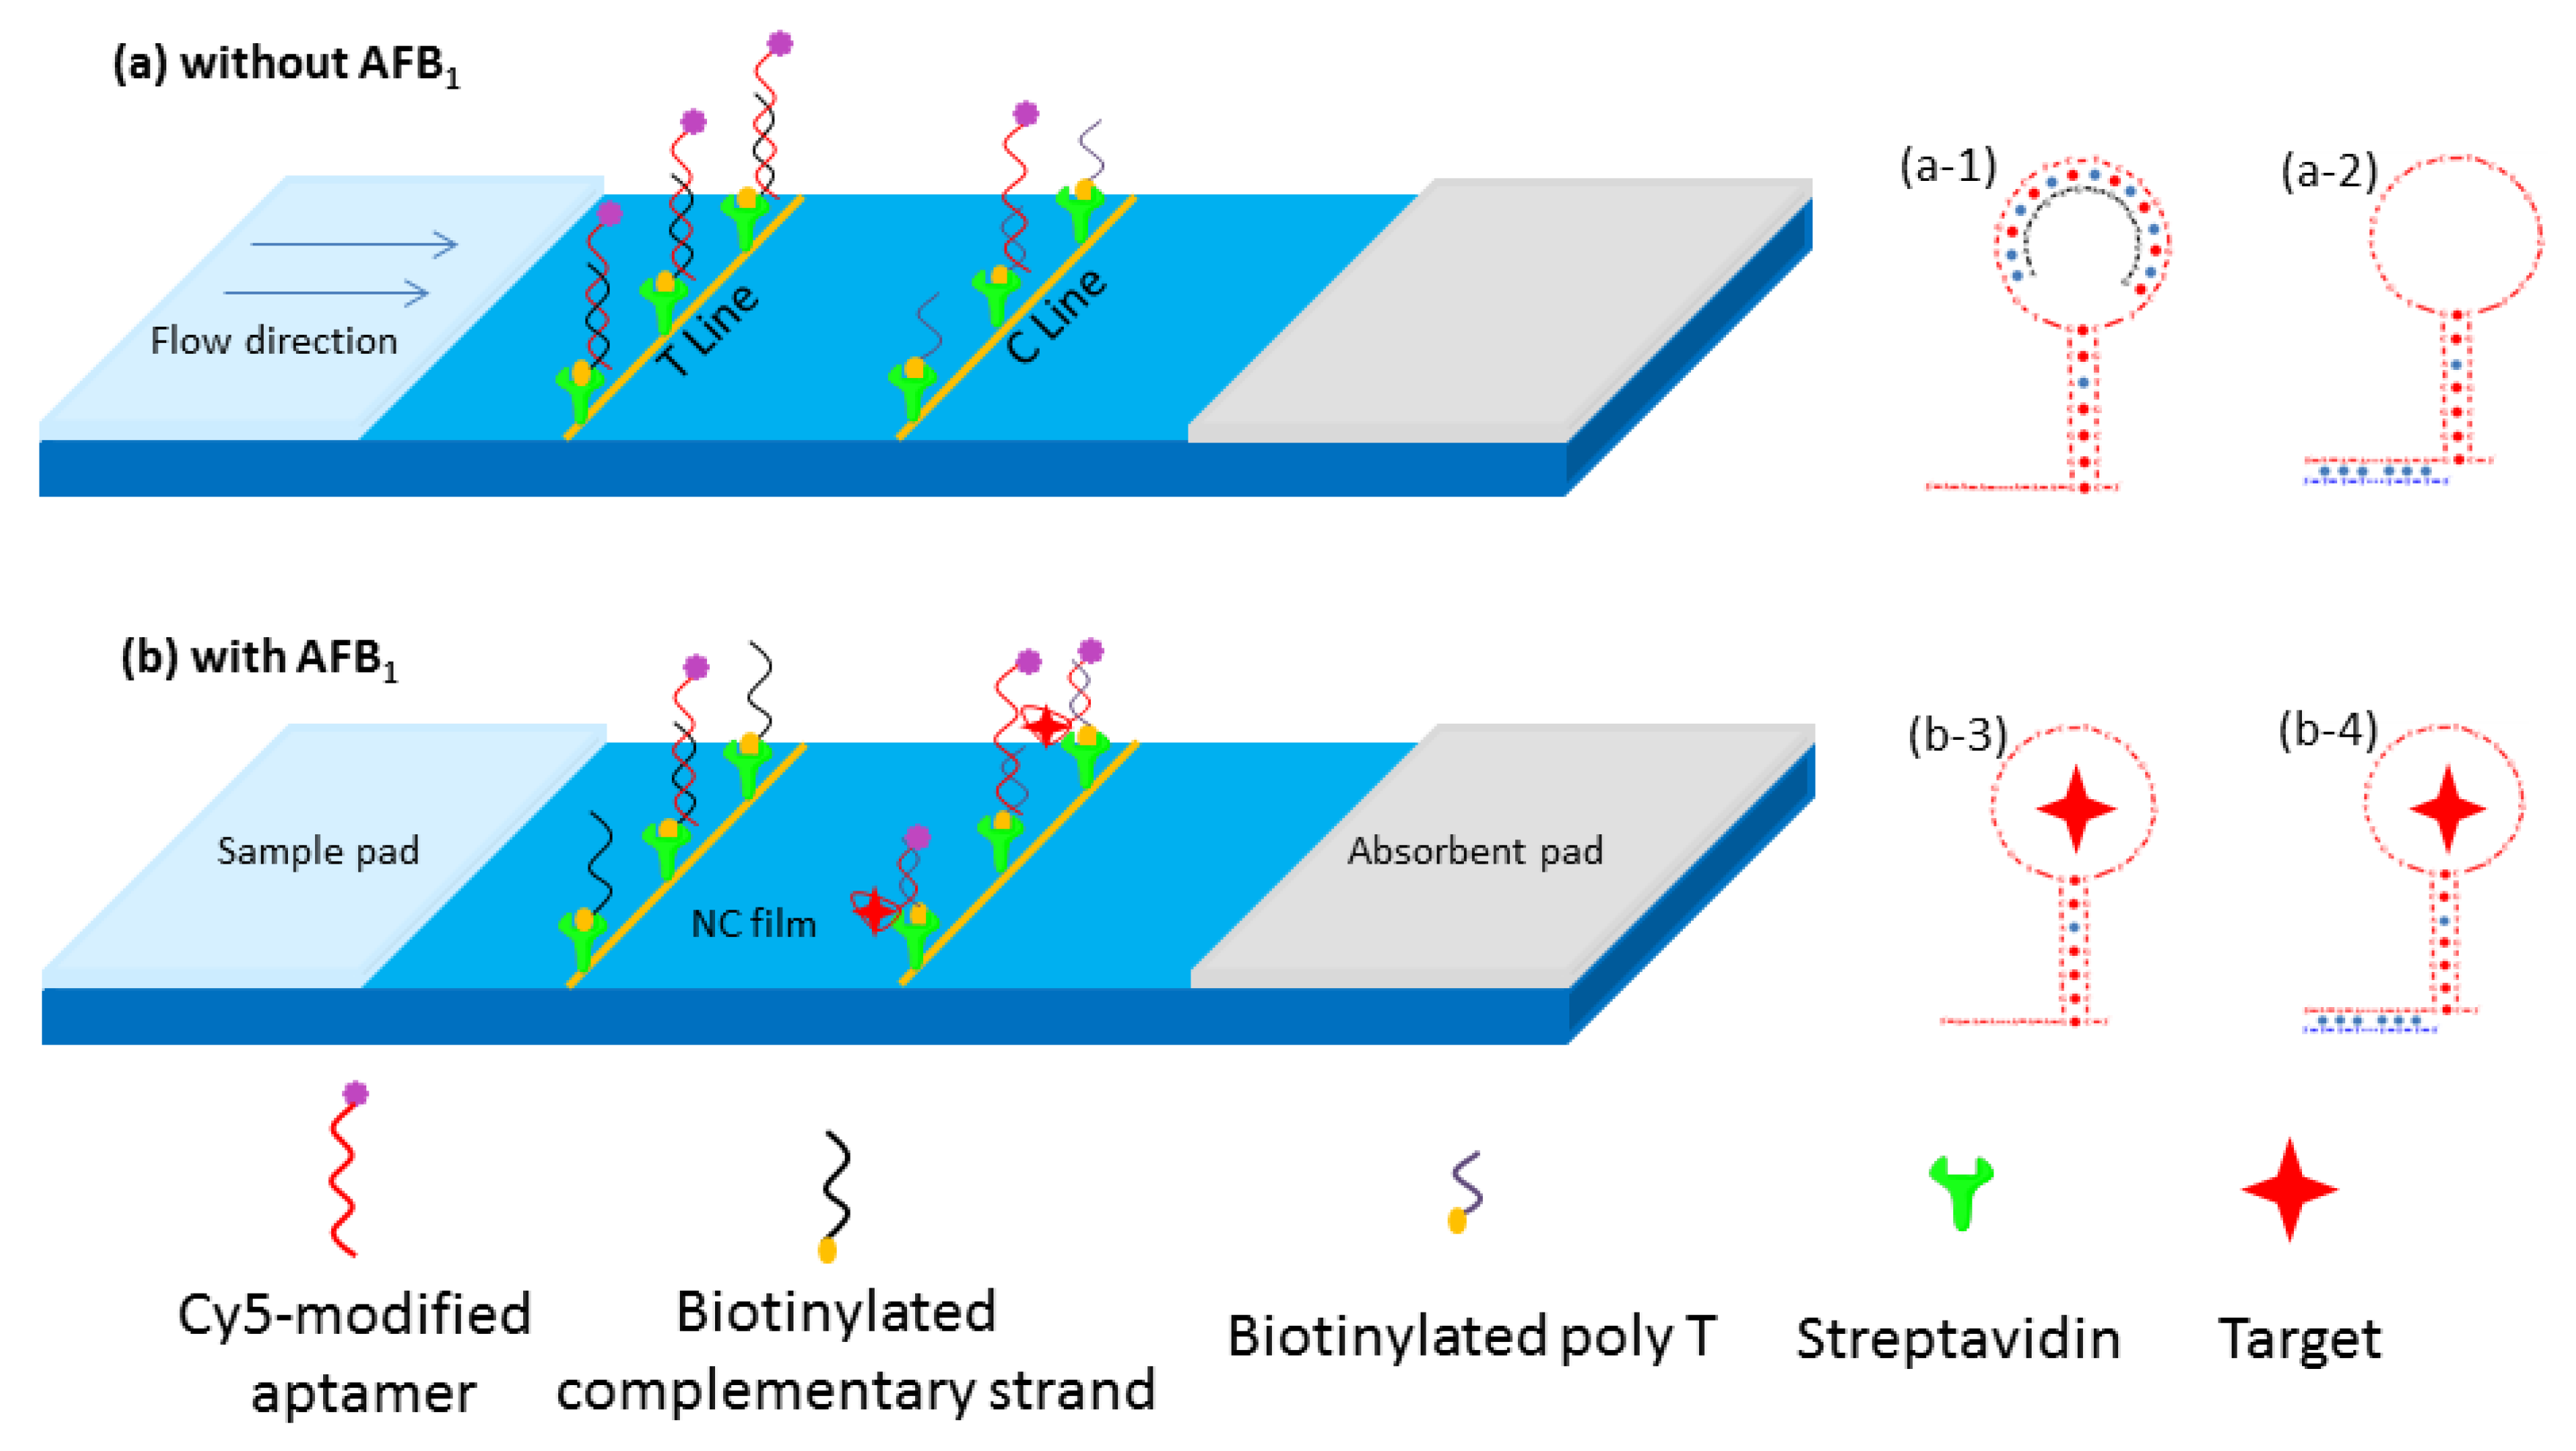
2.1. Principles for the Aptamer-Complementary Strand-Based Lateral Flow Test Strip

The principle for the aptamer-based lateral flow test strip (ALFs) was based on the competition for Cy5-Apt between the complementary strand on the test-line and AFB1 in the samples (Figure 1). In the absence of AFB1, the solution was chromatographed from the sample pad to the nitrocellulose (NC) membrane, and the Cy5-labeled aptamer was first combined with a partially complementary strand at the test-line, as shown in Figure 1a-1. The remaining aptamer was then combined with the poly T (Table 1) of the control line, as shown in Figure 1a-2, which resulted in a higher fluorescence value of the test-line and a lower fluorescence value of the control line. Conversely, in the presence of AFB1, the Cy5-labeled aptamer preferred to bind with AFB1 (Figure 1b-3), rather than couple with the partially complementary strand at the test-line (Figure 1b). In other words, the more aptamer-AFB1 complexes there were in the solution, the less free Cy5-labeled aptamer was captured on the test-line. As a result, the fluorescence intensity of the test-line was decreased. Moreover, aptamer probes would hybridize with poly T on the control line in any case, ensuring the detection validity. Quantitative analysis was performed by measuring the fluorescent intensity of the two lines with analysis software, and the intensity ratio of the test-line to control line (T/C) was inversely proportional to the AFB1 concentration in the samples.

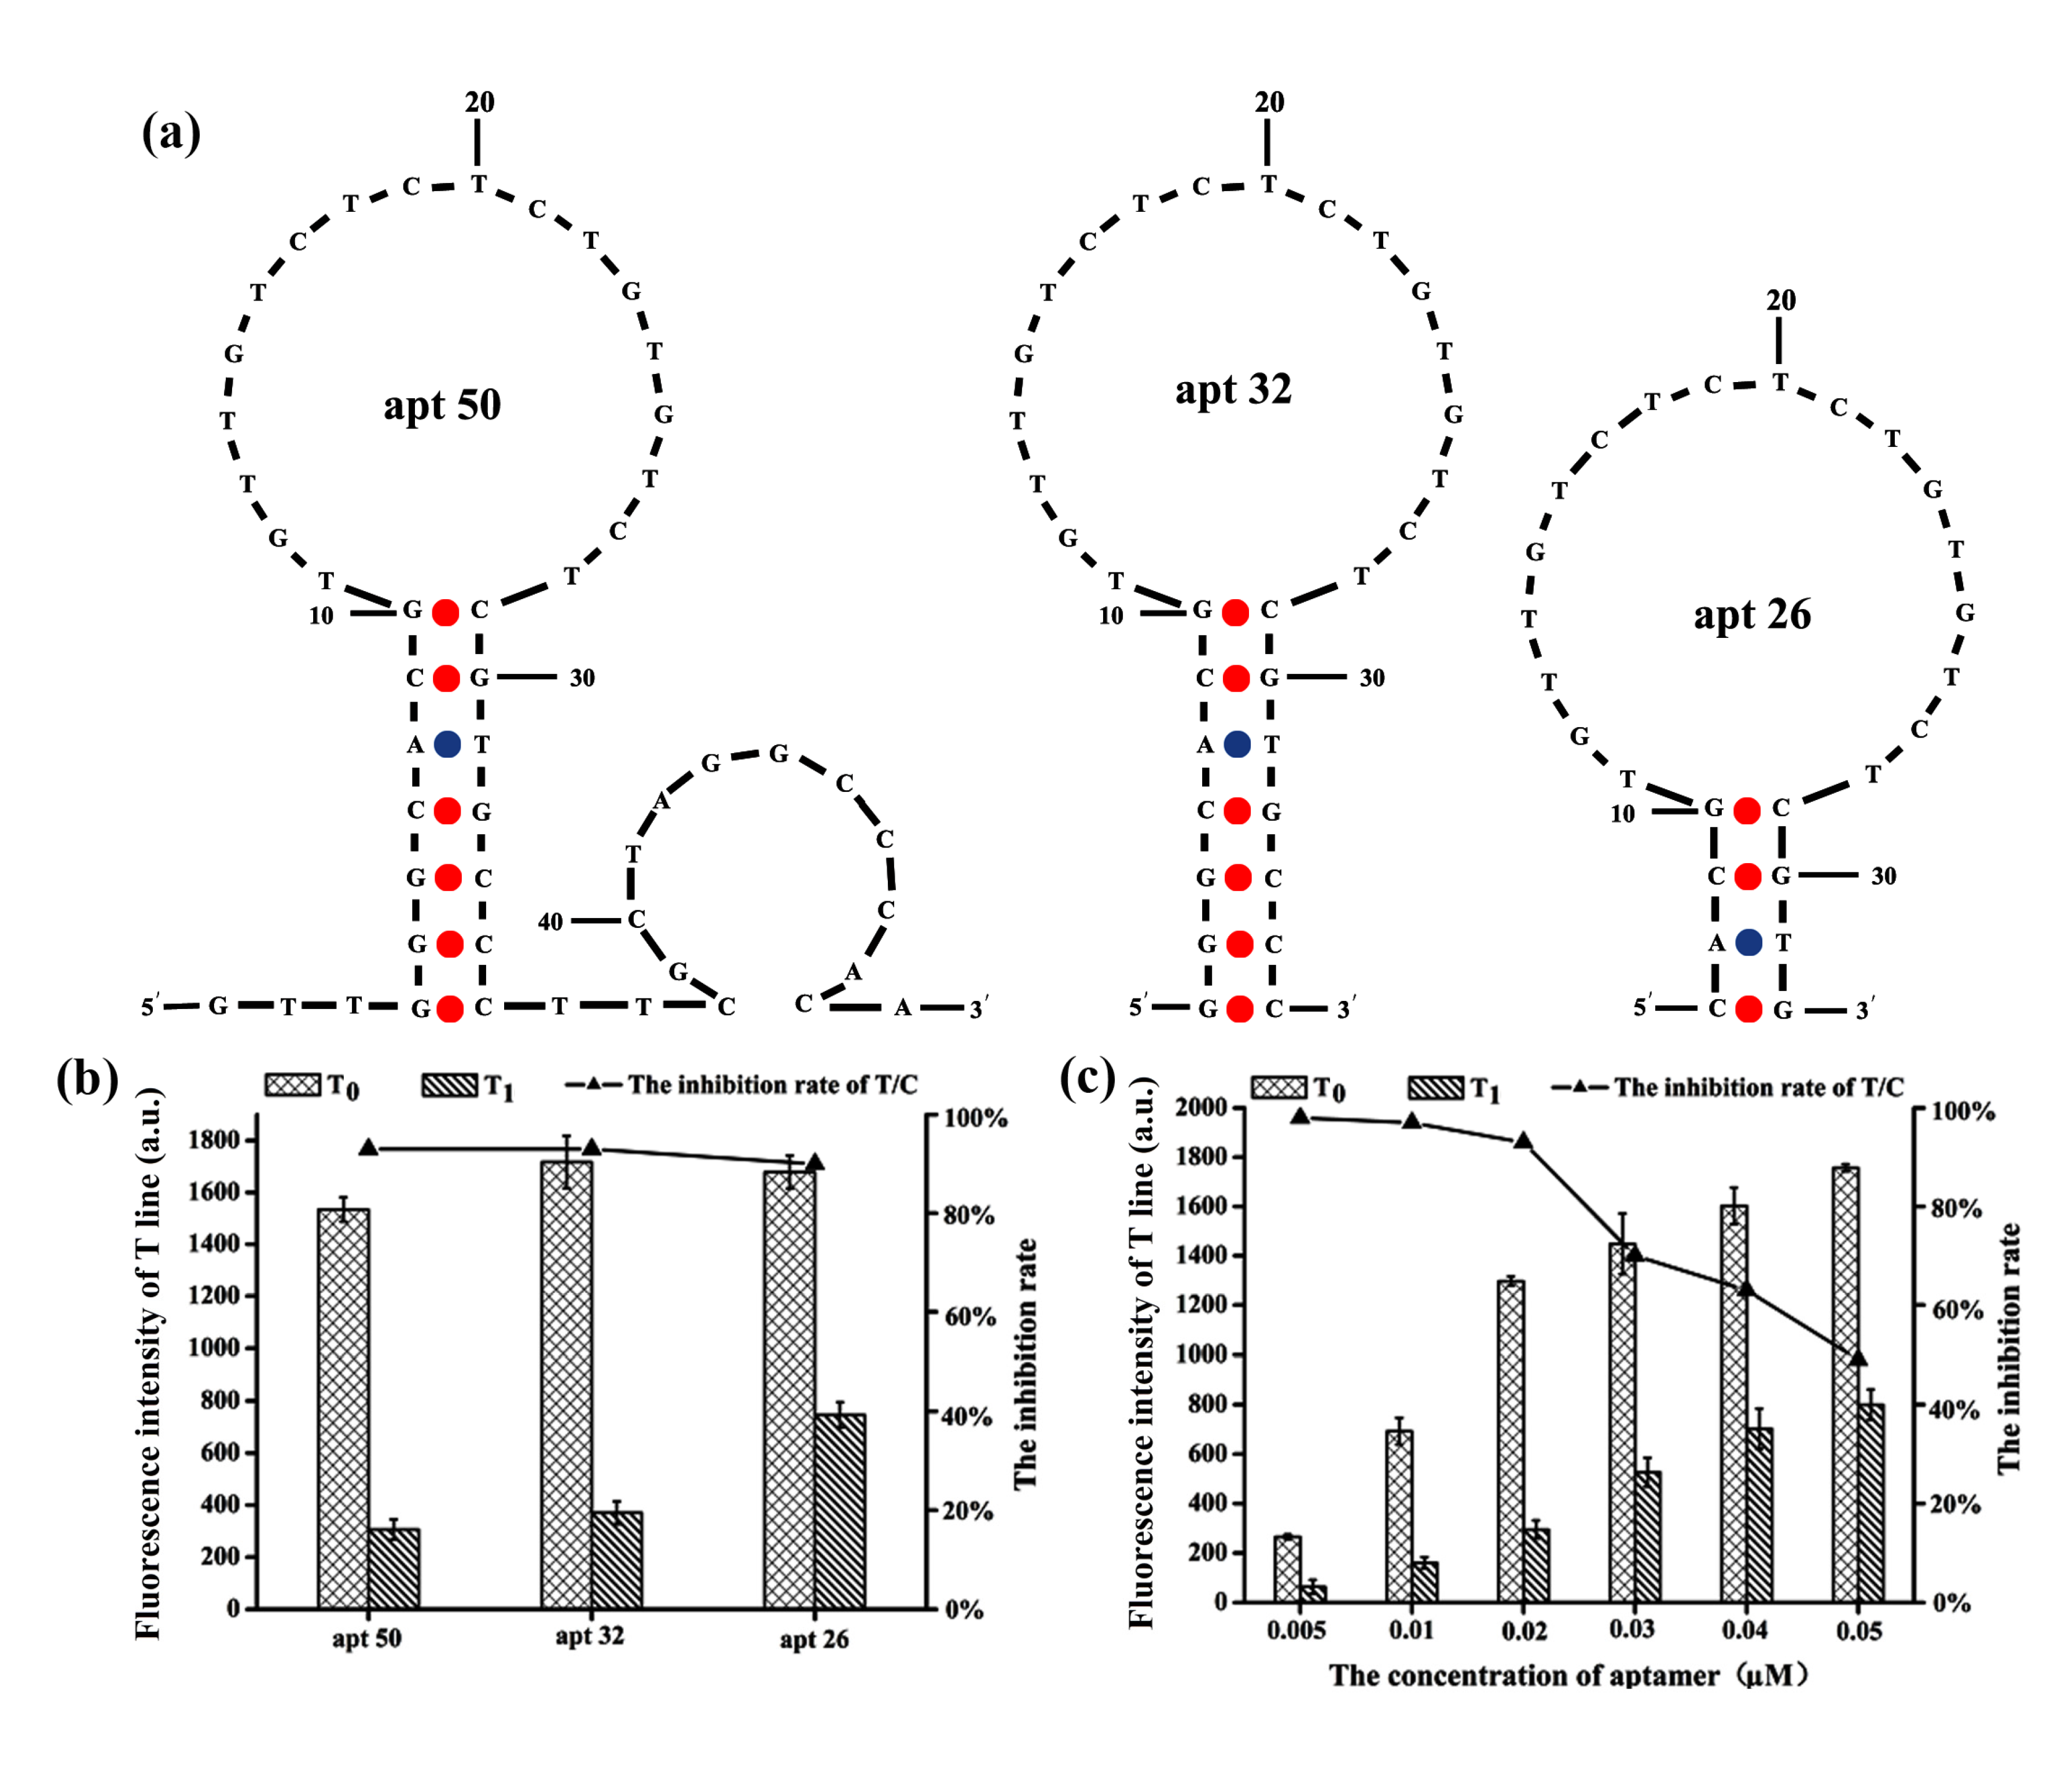
2.2. Optimization of the Aptamer Length and Concentration

The length of AFB1 aptamer is a key factor for consideration when rationally designing a structure-switching aptamer [22,23]. A previous study showed that the short segment close to the 3’ end of the 50-mer AFB1 aptamer was not essential for target binding [21], and the use of the shorter aptamer could save costs without compromising the AFB1 recognition capability. Based on this result, the length of AFB1 aptamer was optimized with ALFs analysis. The DNA sequences of the aptamers are presented in Table 1. The apt 32 and apt 26 for AFB1 binding in our study were truncated from the reference aptamer (apt 50), which was first reported by Le et al. [24], and their predicted secondary structures are shown in Figure 2a. The three Cy5-labeled aptamers were mixed with the AFB1 standard of 100 ng/mL at a ratio of 1:9. Fluorescence intensities were measured with and without the target. As shown in Figure 2b, there was no significant difference in the T/C values among three aptamers. However, for the T-line, the fluorescence intensity of apt 50 and apt 32 added to the target was lower than that of apt 26, indicating weaker binding between AFB1 and apt 26. All three aptamers could bind with the AFB1, which further confirmed that the sequence of the loop region is important for aptamer binding affinity. Moreover, compared with apt 26, apt 32 contains three more G-C base pairs, which may further stabilize the secondary structure and strengthen the binding towards AFB1. The previous study also showed that the proper numbers of base pairs in the stem region is required for the aptamer to have strong binding affinity to AFB1, which is helpful to form a stable stem loop structure [21]. Judging by the performance of these three aptamers, apt 32 was selected as the AFB1 binding aptamer in this study.
The concentration of the aptamer has a great influence on the sensitivity and detection limit of the test strip. In order to determine the optimal aptamer concentration, the target was mixed with different concentrations of apt 32 (0.005, 0.01, 0.02, 0.03, 0.04, 0.05 μM) in a ratio of 9:1, and 60 μL mixture was loaded onto the test strip. The T/C inhibition rate was used to evaluate the analytical performance. The fluorescence intensities (T and C-line) were gradually enhanced with the increase of aptamer levels, but the T/C inhibition rate sharply decreased from 0.02 to 0.05 μM apt 32 (Figure 2c). Moreover, there was no significant difference in the T/C inhibition rate from 0.005 to 0.02 μM apt 32. Since the T-line fluorescence intensity with 0.005 and 0.01 μM of aptamer concentration was low, this may lead to large systematic errors. Hence, 0.02 μM apt 32 was the best choice for the optimal concentration for further studies.

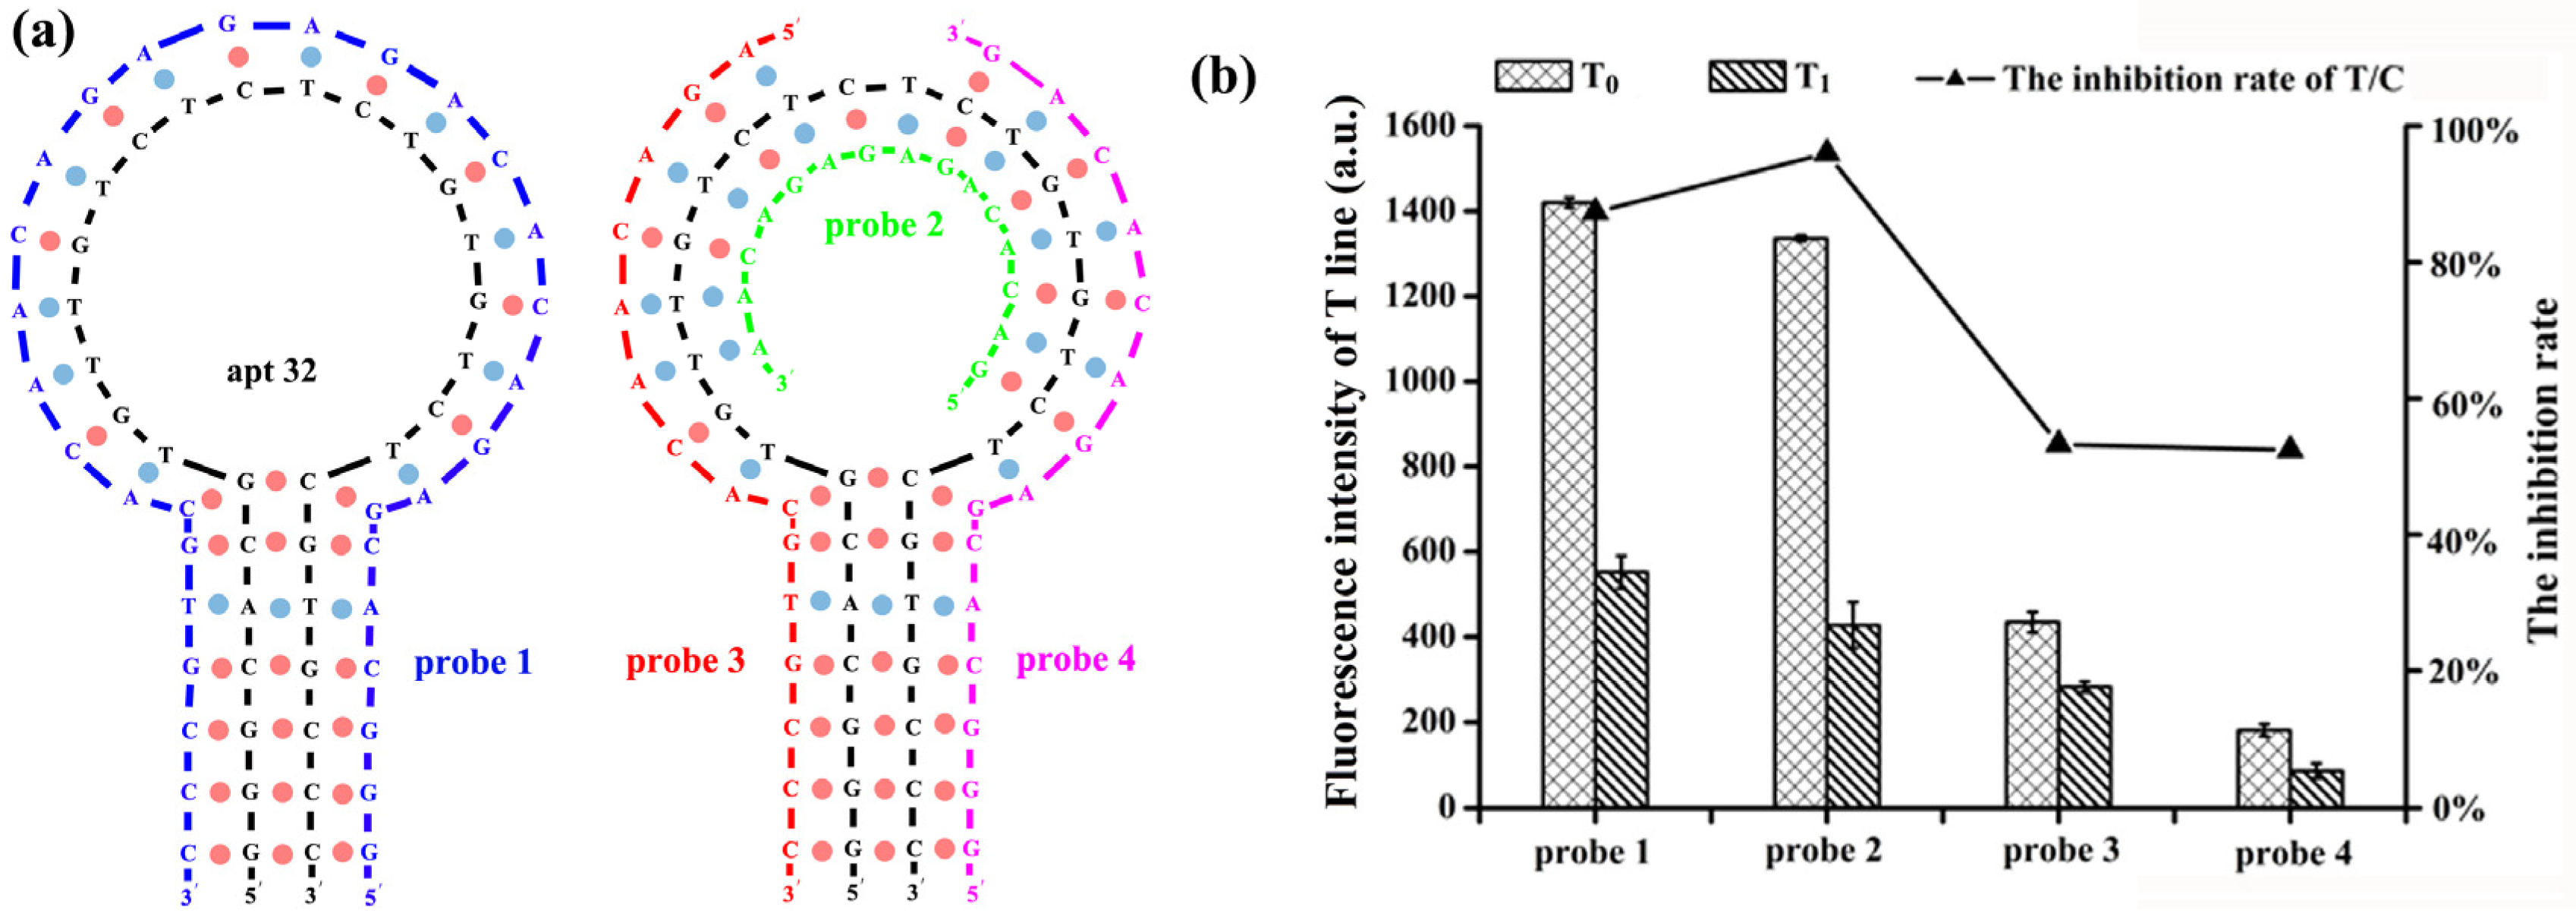
2.3. Optimization of the Complementary Strand on the T-Line

Apart from forming a complex with its target, the aptamer can also hybridize with a complementary DNA strand. Therefore, the sequence of the complementary strand could also have a significant impact on the interaction between aptamer and target [22,23]. Ideally, the complementary strand on the T-line should be able to capture free aptamer in the absence of target. On the other hand, it should not compete with the target for aptamer binding. In this study, we synthesized four types of complementary DNA modified with biotin. The sequences of the complementary DNA are listed in Table 1, which include one full complement sequence (probe 1) with apt 32, and three partial complementary sequences (probe 2, probe 3, and probe 4) as DNA probes. The length of each partial complementary (Figure 3a) strand was 15 bases. All DNA probes were tested to identify the optimal DNA probe as the complementary strand for the ALFs assay. As shown in Figure 3b, in the presence of 100 ng/mL AFB1 standard, the T-line fluorescence intensity of all four DNA probes decreased. However, the inhibition rates of probe 3 and 4 were significantly lower than that of probe 1 and 2, suggesting that neither of them is suitable for serving as the complementary strand. In the case of probe 1 and 2, the inhibition rates were calculated as 87.4% (probe 1) and 95.9% (probe 2), respectively. The relatively lower inhibition rate of probe 1 might be caused by the competitive binding between the complementary strand and AFB1 target. A previous study showed that the aptamer tends to hybridize more strongly with complementary DNA than a target if the length of complementary DNA is the same as that of an aptamer [25]. Based on this result, probe 2, with the highest inhibition rate, was chosen as the complementary strand for the T-line.

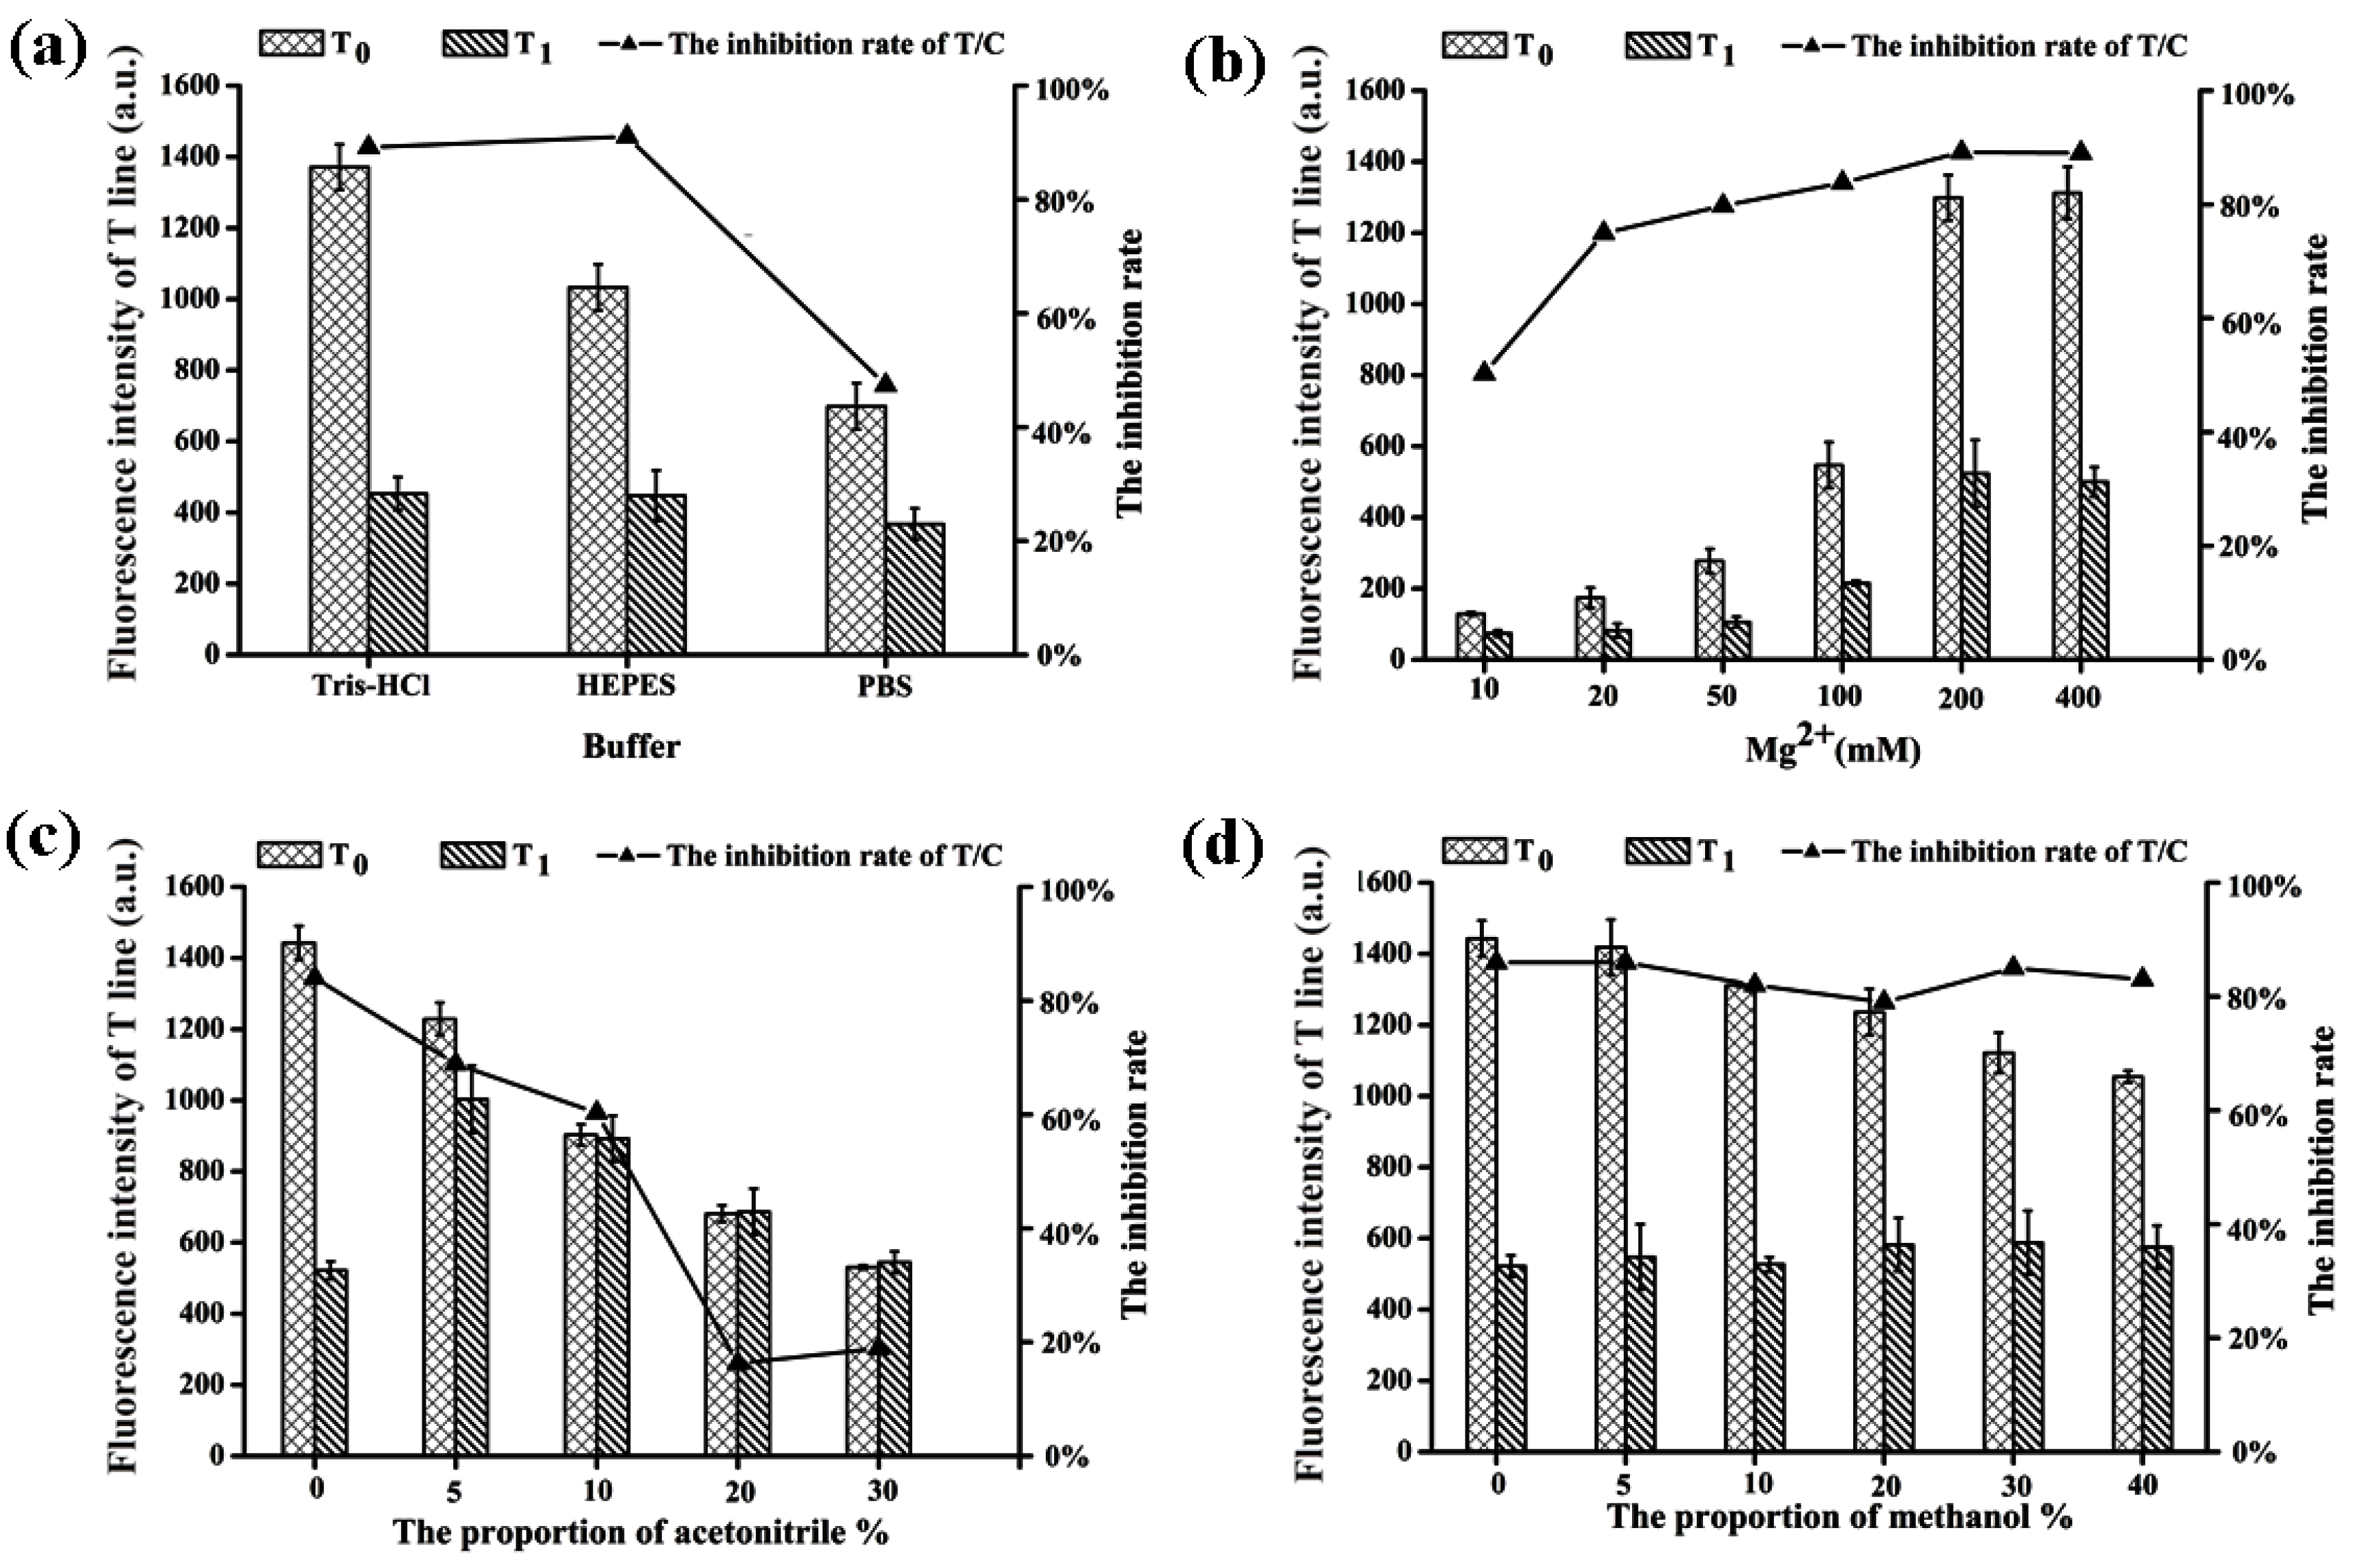
2.4. Optimization of Reaction Conditions between Aptamer and AFB1

The composition of the binding buffer has a crucial effect on spatial conformation of the aptamer, which directly affects the binding strength between aptamer and target. Therefore, the composition of the binding buffer was also optimized in this study. Firstly, three commonly used binding buffers (Tris-HCl, HEPES, and PBS) were compared, then the concentration of Mg2+ was investigated. Finally, the type and maximum concentration of organic solvent in the binding buffer was evaluated.
The ideal buffer can improve the specificity and stability of the test strips, and thus the fluorescence intensity of C-line was measured in order to determine the binding strength between the aptamer and poly-T in different buffer systems. Among the three tested buffers, Tris-HCl and HEPES provided similar inhibition rates (89.2% and 91.1%, respectively), while the inhibition rate was significantly lower in the PBS buffer system (Figure 4a). On the other hand, the T-line fluorescence intensity of Tris-HCl buffer was higher than that of HEPES buffer. According to this result, Tris-HCl buffer was identified as the binding buffer for the subsequent experiments.
The concentration of Mg2+ has a significant effect on the hybridization of DNA strands, it also affects the binding affinity of targets and aptamers by influencing DNA structure [26,27]. For the purpose of optimizing Mg2+ concentration in our system, binding buffers with different concentrations of MgCl2 (10, 20, 50, 100, 200, 400 mM) were prepared. As the concentration of Mg2+ increased, not only did the fluorescence intensity of T-line increase significantly, but also the inhibition rate increased from 50.3% to 89.1% (Figure 4b). As a result, 200 mM of Mg2+ in Tris-HCl buffer was identified to be the optimal concentration.
Acetonitrile and methanol are widely introduced to address the poor solubility of AFB1 in aqueous medium. However, an excess amount of organic solvent might lead to incomplete binding between DNA strands [28] and could even brake down the structure of the NC membrane. Therefore, it is necessary to determine which type of organic solvent is more suitable for this sensor. Moreover, the maximum ratio of organic solvent should also be determined. In this experiment, different volumes of acetonitrile or methanol were added to prepare the binding buffer with 0, 5, 10, 20, 30, and 40% of organic solvent, respectively. The results in Figure 4c showed that the addition of acetonitrile greatly affected the binding between the aptamer and target, as the inhibition rate obviously decreased from 84.0% to 16.3% with the increase of acetonitrile concentration (0 to 20%). In contrast, the inhibition rate was basically unchanged upon addition of methanol (Figure 4d). Further comparing of T-line fluorescence intensity revealed that the concentration of methanol should not exceed 10% to guarantee the minimum interference induced by the solvent.

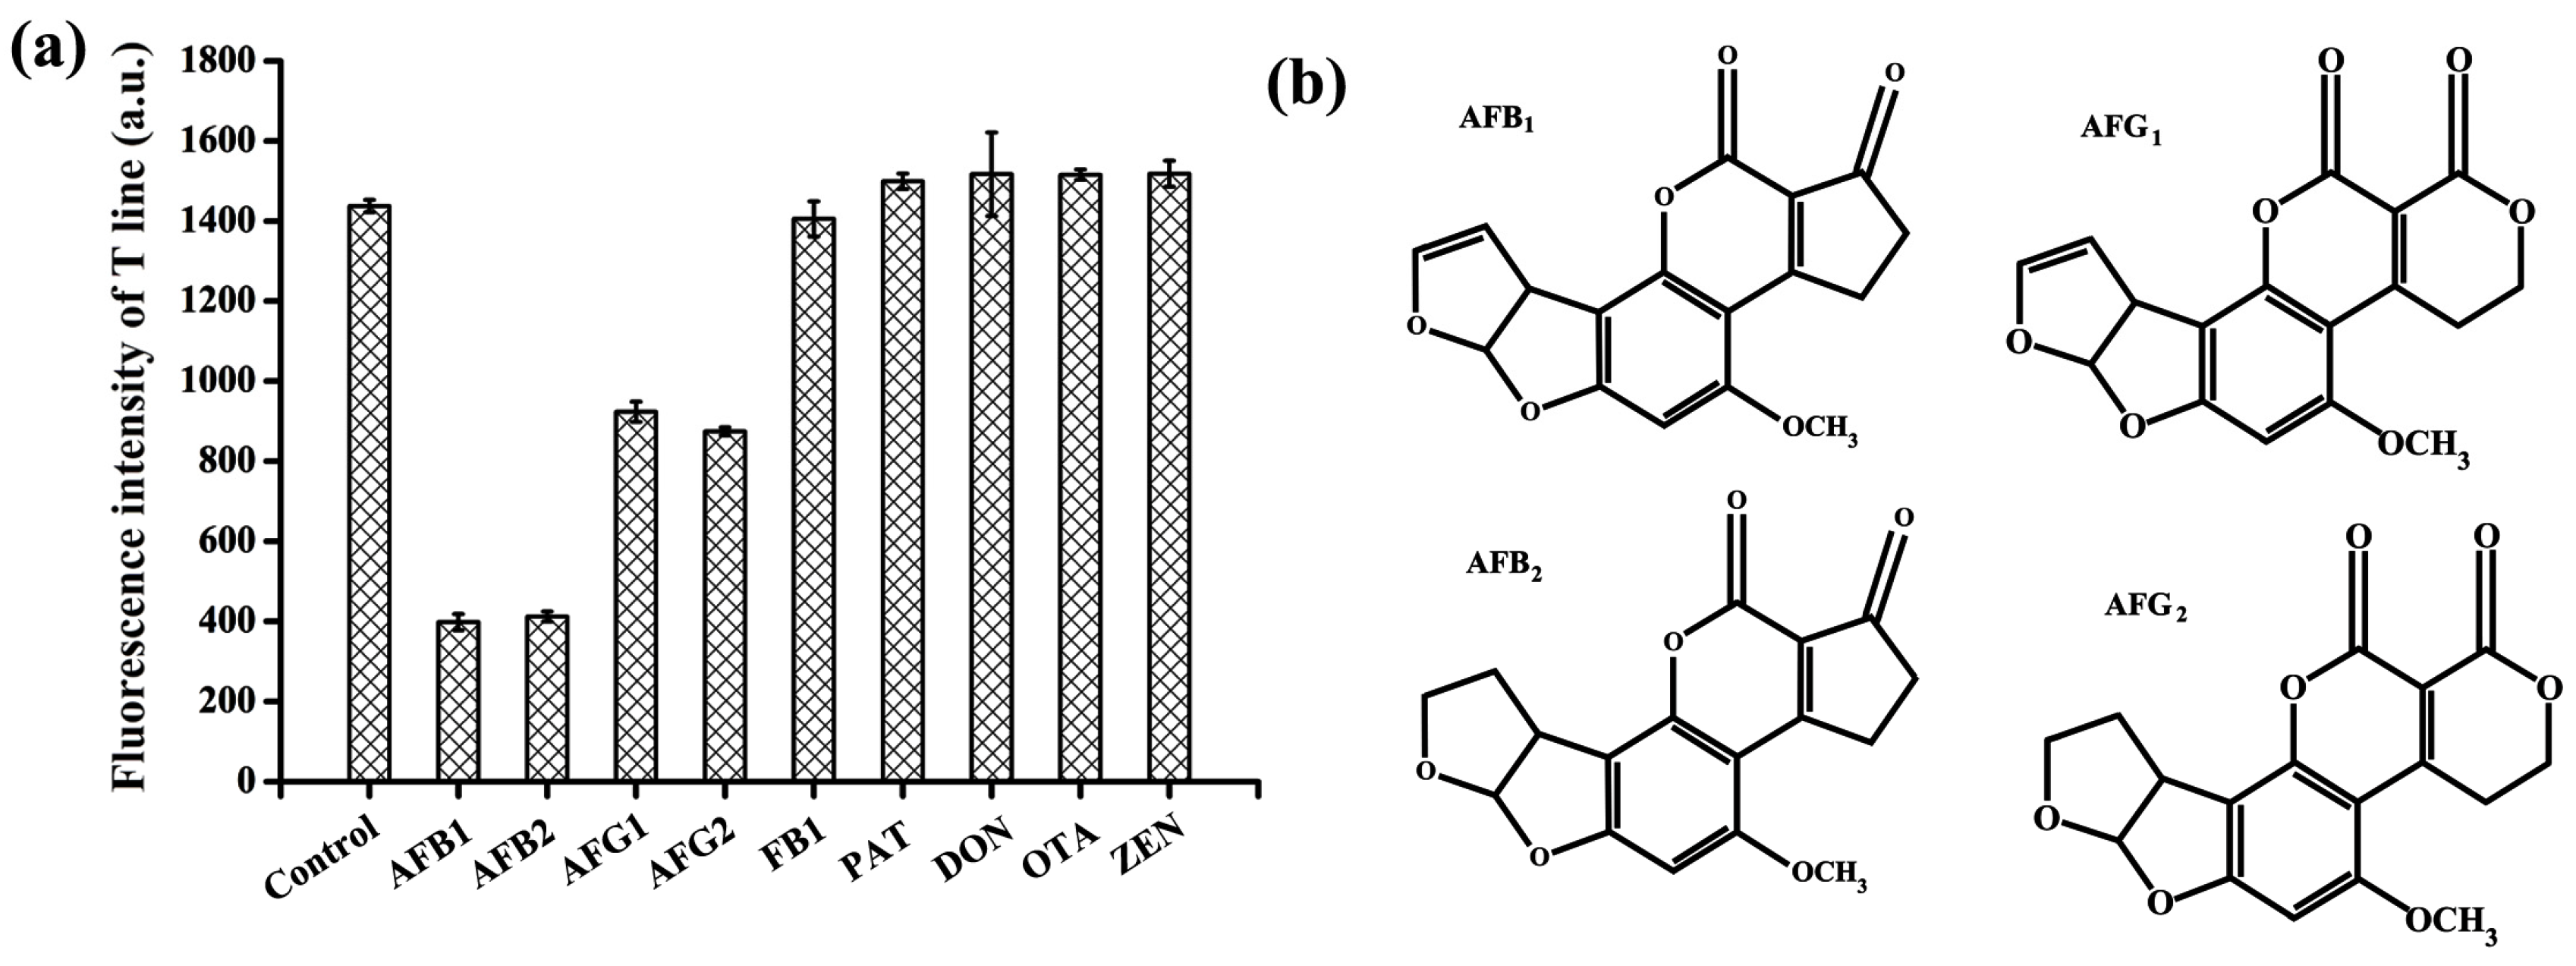
2.5. Specificity Test

The specificity towards the target AFB1 by using our developed ALFs was studied. Several relevant mycotoxins including AFB2, aflatoxin G1 (AFG1), AFG2, ochratoxin A (OTA), zearalenone (ZEN), fumonisin B1 (FB1), and deoxynivalenol (DON) were measured at the same concentration of 100 ng/mL. As shown in Figure 5a, the aptamer showed similar high binding affinity to AFB1 and AFB2. No change of T-line fluorescence intensity was observed compared with the control for the other types of mycotoxins, which indicated that the ALFs had high specificity for type-B aflatoxins. Furthermore, it showed much decreased binding strength to AFG1 and AFG2. The T-line fluorescence intensity of AFG1 and AFG2 was 2.3- and 2.2-fold higher than that of AFB1, respectively. The distinction of AFB1 and AFB2 proved to be challenging because of the high similarity between their chemical structures (Figure 5b). Presumably, the C-C double bond on one of the furan rings of AFB1 does not participate in the aptamer binding. However, it is clear that the tested sensor showed high binding affinity to these two groups of aflatoxins than other types of mycotoxins. More importantly, the ALFs can simultaneously detect both AFB1 and AFB2, which is an advantage for food security.

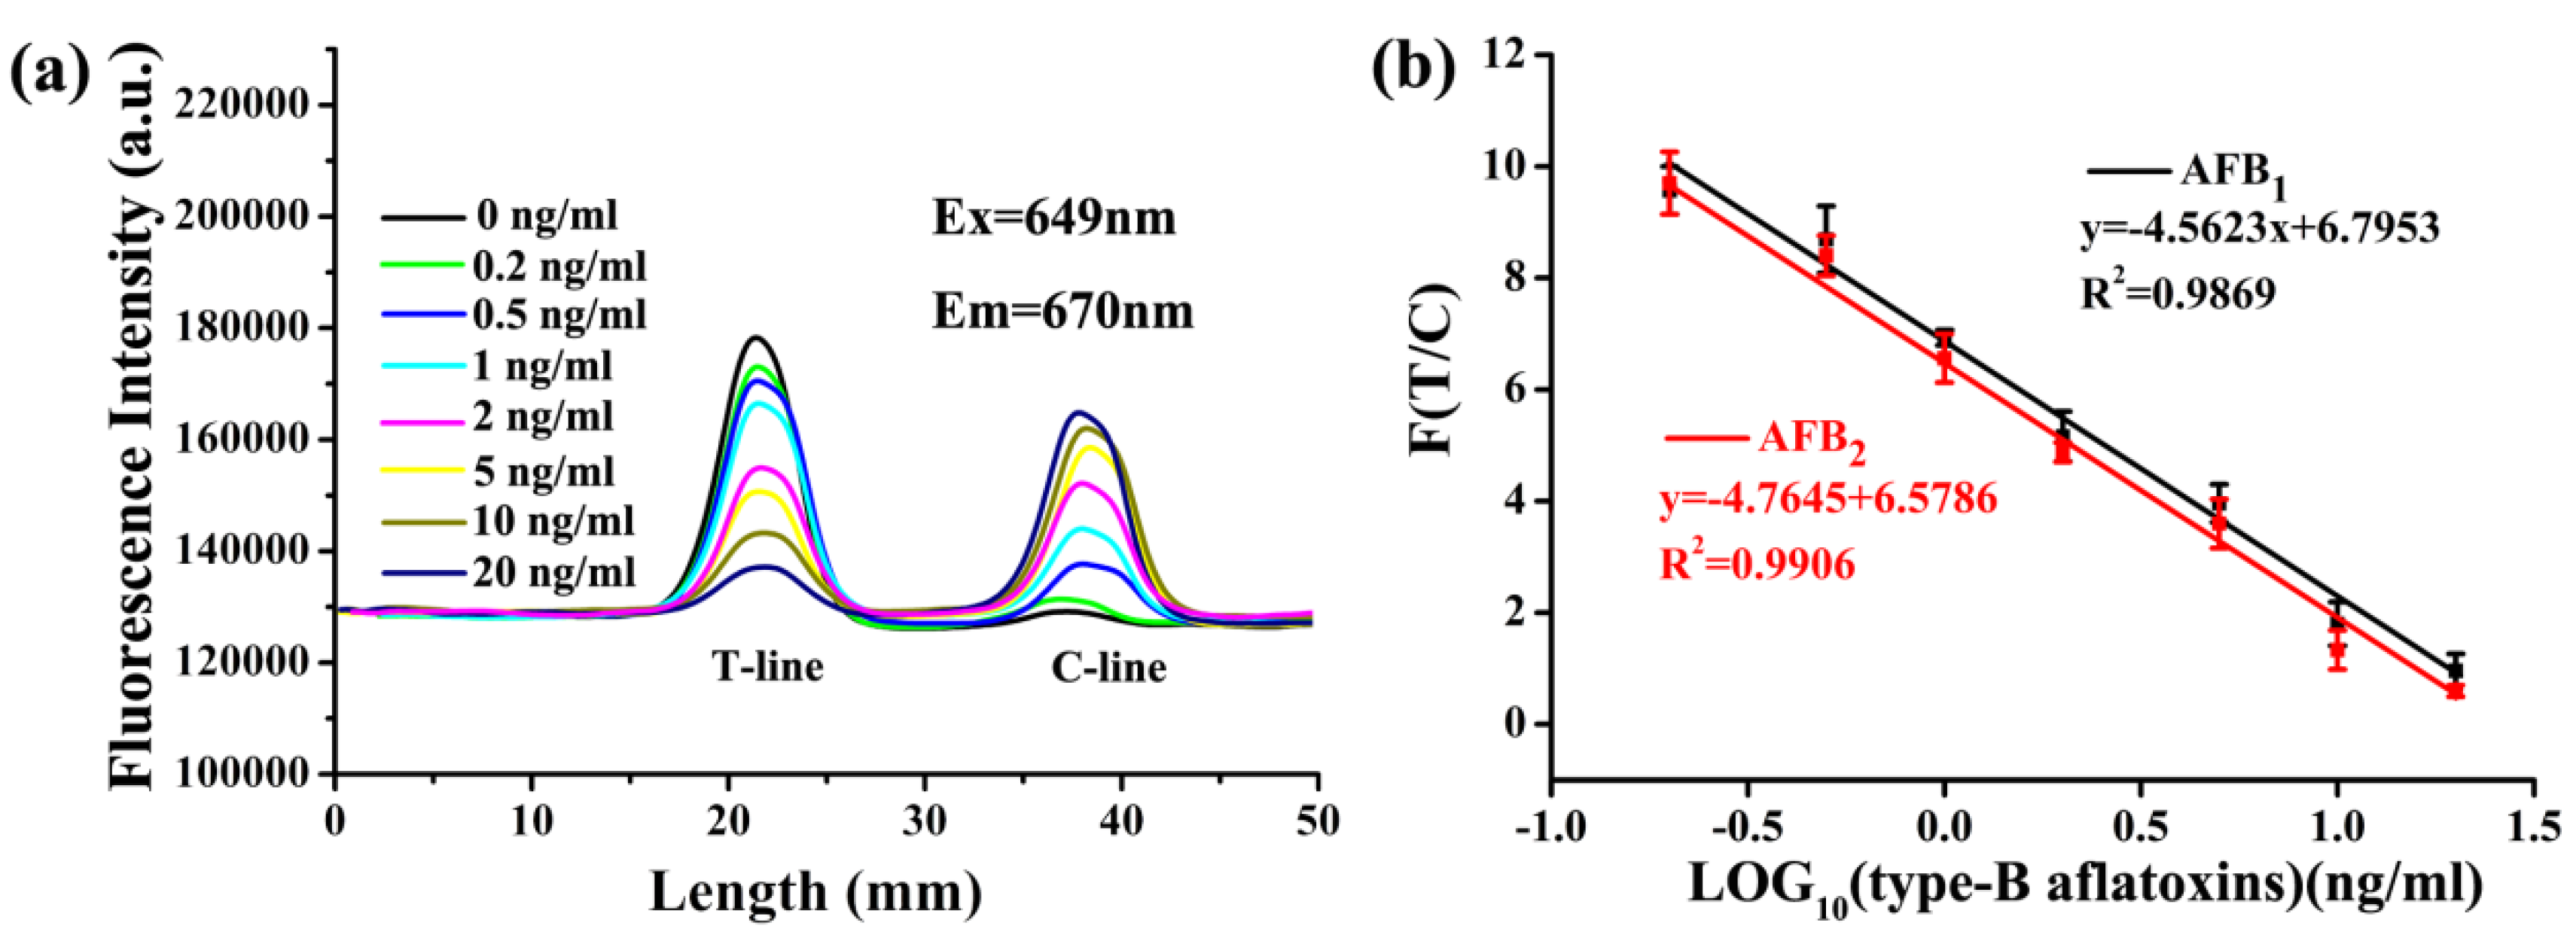
2.6. Quantitative Analysis of Type-B Aflatoxins

Under the optimized conditions, the sensitivity of the test strip was examined. The AFB1 and AFB2 stock solution were diluted into the concentrations of 0.2, 0.5, 1, 2, 5, 10, 20 ng/mL. The standard solutions were mixed with 0.02 μM aptamer solution with the ratio of 9:1. After 10 min, the mixed solution was loaded onto the test strip and subsequently scanned with a card reader. It was shown that, as the concentration of type-B aflatoxins increased, the fluorescence intensity of the T-line gradually decreased, while that the fluorescence intensity of the C-line increased, which resulted in the value of T/C decreasing (Figure 6a). The calculated F (T/C) value had a good linear relationship with the logarithm of the type-B aflatoxins concentration. A linear range between 0.2 and 20 ng/mL was determined for AFB1 and AFB2 with a correlation coefficient (r) of 0.9869 and 0.9906, respectively (Figure 6b). The limit of detection (LOD) was determined to be as low as 0.16 ng/mL. This result demonstrated that our test strip is capable of quantitative analysis of type-B aflatoxins at an extremely low level. Although the sensitivity of our developed ALFs is similar to that of a previous study (Table 2), this is the first time that ALFs have been applied for the simultaneous detection of AFB1 and AFB2. Moreover, the other benefit of these ALFs is that the complementary strand instead of hapten-BSA as test line can save costs, and facilitate synthesis and reproducibility.

2.7. Analysis of Type-B Aflatoxins in Foods

To evaluate the reliability and accuracy of the prepared ALFs biosensors, peanuts, almonds, and dried figs samples were spiked with type-B aflatoxins standard solution at a concentration of 3 and 10 μg/kg. The spiked samples were processed by simply extracting with acetonitrile and filtering through an solid phase extraction (SPE) cartridge. The extracts were re-dissolved in binding buffer and analyzed by our ALFs. The recovery rates were summarized in Table 3. The recovery range of the different matrix for AFB1 was 96.5%–109.4% with the relative standard deviation (RSD) of 2.0% to 6.5%; for AFB2 it was 93.3%–112.0%, and the RSD ranged from 2.7% to 7.9%. The limit of quantitation (LOQ) was determined to be 0.5 μg/kg, which is far below the European Union (EU) limit. This result matches well with the standard HPLC-MS/MS method. It is proven in this study that the proposed ALFs are capable of detecting type-B aflatoxins in food samples. Seventeen samples of peanuts, dried figs, and almonds were selected and extracted. The extracts were measured using ALFs and HPLC-MS/MS, respectively. The comparison results showed that AFB1 and AFB2 were not detected from the collected samples, and the results of the two detection methods were consistent.

3. Conclusions

In summary, we introduced an ultrafast, sensitive, specific, and easy-to-operate method for type-B aflatoxins analysis by designing and preparing a lateral flow strip biosensor based on the specific recognition of type-B aflatoxins by an aptamer labeled with a fluorescent tag. This sensor improved the sensitivity and accuracy towards AFB1 by employing a shortened aptamer sequence, which made it more suitable for practical applications. The fluorescence intensity on the strip could be recorded by a portable strip reader. For quantitative detection, the ratio of fluorescence intensities between T and C-line provided a good linear relationship with the logarithm of the type-B aflatoxins concentration (0.2–20 ng/mL). By using this ALFs sensor, rapid detection of type-B aflatoxins could be achieved within 20 minutes. Finally, peanuts, almonds, and dried figs samples were spiked with type-B aflatoxins and analyzed using this method. The result verified that our ALFs could satisfy the requirement of on-site detection of spiked samples. Compared with the traditional HPLC-MS/MS technique, the reported sensing device has the advantages of being low cost, fast to analyze and easy to operate, which make it more suitable for on-site and rapid monitoring of type-B aflatoxins contamination in food samples. Moreover, this strategy is also applicable to construct test strips for other mycotoxins.

4. Materials and Methods

4.1. Reagents and Instruments

Aflatoxin B1 (AFB1), aflatoxin B2 (AFB2), aflatoxin G1 (AFG1), aflatoxin G2 (AFG2), ochratoxin A (OTA), zearalenone (ZEN), fumonisin B1 (FB1), and deoxynivalenol (DON) were purchased from Romer international trading Co., Ltd (Beijing, China). Streptavidin was ordered from Solarbio Biological Technology Company (Beijing, China). PEG 20000, Tween-20 and sucrose were bought from J&K Scientific Ltd (Beijing, China). Tris (hydroxymethyl) aminomethane and 4-hydroxyethylpiperazineethanesulfonic acid (HEPES) were purchased from Sigma-Aldrich (Beijing, China). All other chemicals were purchased from Beijing Chemical Reagent Company (Beijing, China). All reagents were of analytical grade and used without further purification or treatment unless specified.
The composition of binding buffer A was 10 mM Tris, 120 mM NaCl, 5 mM KCl, and 200 mM MgCl2. The composition of binding buffer B was 10 mM HEPES and 200 mM MgCl2. Binding buffer C was made up of 8 mM Na2HPO4, 136 mM NaCl, 2 mM KH2PO4, 2.6 mM KCl, and 200 mM MgCl2. All three buffers contained 5% methanol (v/v), 1% PEG 20000 (m/v), 2% sucrose (m/v), 0.1% Tween-20 (v/v), and the pH was adjusted to 7.4.
The absorbent pad (H5076), sample pad (GL-b04), nitrocellulose (NC) membrane (Sartorius CN140), and PVC plastic adhesive backing used in the experiments were purchased from Shanghai Jieyi Biotechnology Co., Ltd, China. Each lateral flow chromatography strip was cut using a 3050 dispensing platform and KM-3100 Cutter (BioDot, Irvine, CA, USA). The fluorescence signals of the test strip were scanned by an ESEQuant LR3 FL Premium reader (Qiagen, Frankfurt, Germany).
The AFB1 aptamer sequence [23,24] and complementary probe sequences used in this project were listed in Table 1. All DNA probes were synthesized by Sangon Biotechnology Co., Ltd. (Shanghai, China).

4.2. Preparation of ALFs

The ALFs are composed of four parts: a sample pad, a NC membrane, an absorbent pad, and a PVC plastic adhesive backing. The sample pad, NC membrane, and absorbent pad is sequentially attached to the PVC plastic adhesive backing from left to right according to the direction of migration. The sample pad and absorbent pad sequentially laminate 3 mm with the NC membrane to guarantee smooth migration of solutions. The NC membrane was used to prepare test zones.
The NC membrane can only immobilize proteins on its surface, so the detection probe and the control probe labeled with biotin are reacted with streptavidin to form a biotin-streptavidin conjugate, which was anchored on the NC membrane in advance. The 3 μM biotin labeled partial complementary strand (biotin-probe 1) and 3 μM poly-T (biotin-probe 2) were mixed separately with streptavidin (1 mg mL−1) by 7: 1 (v/v) and incubated for 2 hours at room temperature. The streptavidin-biotin labeled DNA probe 1 (SA-biotin probe 1) and probe 2 (SA-biotin probe 2) were dispensed on the NC membrane of test (T) line and control (C) line using the 3050-dispensing platform, respectively. The distance between the two lines is 5 mm. It was dried at 37 °C for 1 h and the whole assembled sheet was cut into 4 mm strips by KM-3100 Cutter, and then stored in a desiccator before use.

4.3. Type-B Aflatoxins Analysis

The sample was mixed with Cy5-labeled aptamer in an Eppendorf tube at a ratio of 9:1 (v/v) and incubated at room temperature for 10 min. After that, each 60 µL portion of the mixture was loaded on the sample pad of an ALFs. All liquid was allowed to migrate freely along the strip until absorbed by the absorbent pad. After 10 min, the fluorescence intensity on the T and C-lines was recorded by scanning the test strip with ESEQuant LR3 FL Premium Reader.

4.4. Optimization of Test Conditions

In order to achieve the desirable performance of the ALFs, a series of impact factors that potentially affect the T and C-lines in the test strip were optimized, including the lengths and concentrations of the aptamer, the sequence of the complementary strands and the compositions of binding buffer solution (including which type of buffer, the concentration of Mg2+, and the ratio of organic solvent). The inhibition rate was introduced for evaluating the performance of the sensors under different conditions. It was calculated following the formula:
i n h i b i t i o n   r a t e = ( T 0 C 0 T 1 C 1 ) / T 0 C 0
T0 and C0 correspond to the fluorescence intensity of T and C-line in the absence of AFB1, while T1 and C1 represent the fluorescence intensity of T and C-line in the presence of 100 ng/mL AFB1. In the case of conditions with similar inhibition rates, the value of T1 was compared to determine the optimal condition.
For quantitative analysis, the ratio of T and C fluorescence intensities was calculated as the concentration evaluation index of type-B aflatoxins, which was used to draw the standard curve.

4.5. Analysis of Food Samples

In this study, peanut, almond, and dried figs were chosen as food samples to further confirm the outcome of practical application by spiked recovery. A total of 17 samples consisting of peanuts (9), almonds (3), and dried figs (5) were randomly collected from different supermarkets and local markets in Beijing, China. The extraction of the specimen was performed following previous work [32]. In detail, 5.0 g of sample spiked with known amount of AFB1 was placed into a 50 mL polypropylene centrifugation tube and diluted with 25 mL 80% acetonitrile aqueous solution containing 100 mM citric acid. After that, the tube was transferred to a shaker and shaken at room temperature with a speed of 150 rpm for 30 minutes. Subsequently, the sample was centrifuged at 10,000 rpm for 10 min at 4 °C using a centrifuge. A volume of 5.0 mL supernatant layer was aspirated and filtered through a SPE cartridge column. Finally, the collected solution was evaporated to dryness at 50 °C under nitrogen atmosphere, and re-dissolved in 1 mL binding buffer as the extract solution. For each measurement, a mixture containing 54 µL of the extract solution and 6 µL of the Cy5 labeled aptamer solution was added on the aptamer-based flow chromatography test strip. The average recovery was calculated by comparing with the actual concentration of type-B aflatoxins.

Author Contributions

Z.Z. and H.W. conceived and designed the experiment; H.W. performed the experiment; Z.Z. analyzed the data and wrote the manuscript; W.Z. assisted with the experiment and edited the manuscript; X.F. (Xiaoyuan Feng), X.F. (Xia Fan), A.C., and M.W. supervised the researched, edited, and approved the final manuscript. All authors have read and agreed to the published version of the manuscript.

Funding

The authors are grateful for the financial support from the National Key Research and Development Program of China (2016YFD0400902), Nation Natural Science Foundation of China (31872907), and Natural Science Foundation of Beijing (KM201610858001).

Conflicts of Interest

The authors declare no conflict of interest.

References

  1. Wu, J.H.; Zeng, L.W.; Li, N.L.; Liu, C.S.; Chen, J. A wash-free and label-free colorimetric biosensor for naked-eye detection of aflatoxin B1 using G-quadruplex as the signal reporter. Food Chem. 2019, 298, 125034. [Google Scholar] [CrossRef] [PubMed]
  2. Xue, Z.H.; Zhang, Y.X.; Yu, W.C.; Zhang, J.C.; Wang, J.Y.; Wan, F.; Kim, Y.; Liu, Y.D.; Kou, X.H. Recent advances in aflatoxin B1 detection based on nanotechnology and nanomaterials-A review. Anal. Chim. Acta 2019, 1069, 1–27. [Google Scholar] [CrossRef] [PubMed]
  3. Wu, F. Perspective: Time to face the fungal threat. Nature 2014, 516, S7. [Google Scholar] [CrossRef] [PubMed]
  4. Van de Perre, E.; Jacxsens, L.; Lachat, C.; El Tahan, F.; De Meulenaer, B. Impact of maximum levels in European legislation on exposure of mycotoxins in dried products: Case of aflatoxin B1 and ochratoxin A in nuts and dried fruits. Food Chem. Toxicol. 2015, 75, 112–117. [Google Scholar] [CrossRef]
  5. Hidalgo-Ruiz, J.L.; Romero-González, R.; Martínez Vidal, J.L.; Garrido Frenich, A. Determination of mycotoxins in nuts by ultra high-performance liquid chromatography-tandem mass spectrometry: Looking for a representative matrix. J. Food Compos. Anal. 2019, 82, 103228. [Google Scholar] [CrossRef]
  6. Wang, Y.J.; Nie, J.Y.; Yan, Z.; Li, Z.X.; Cheng, Y.; Farooq, S. Multi-mycotoxin exposure and risk assessments for Chinese consumption of nuts and dried fruits. J. Integr. Agr. 2018, 17, 1676–1690. [Google Scholar] [CrossRef]
  7. Campone, L.; Piccinelli, A.L.; Aliberti, L.; Rastrelli, L. Application of pressurized liquid extraction in the analysis of aflatoxins B1, B2, G1 and G2 in nuts. J. Sep. Sci. 2009, 32, 3837–3844. [Google Scholar] [CrossRef]
  8. Masood, M.; Iqbal, S.Z.; Asi, M.R.; Malik, N. Natural occurrence of aflatoxins in dry fruits and edible nuts. Food Control. 2015, 55, 62–65. [Google Scholar] [CrossRef]
  9. Cheng, N.; Song, Y.; Shi, Q.; Du, D.; Liu, D.; Luo, Y.; Xu, W.; Lin, Y. Au@Pd nanopopcorn and aptamer nanoflower assisted lateral flow strip for thermal detection of exosomes. Anal. Chem. 2019, 91, 13986–13993. [Google Scholar] [CrossRef]
  10. Chen, Y.; Cheng, N.; Xu, Y.; Huang, K.; Luo, Y.; Xu, W. Point-of-care and visual detection of P. aeruginosa and its toxin genes by multiple LAMP and lateral flow nucleic acid biosensor. Biosens. Bioelectron. 2016, 81, 317–323. [Google Scholar] [CrossRef]
  11. Zhang, L.; Chen, Y.; Cheng, N.; Xu, Y.; Huang, K.; Luo, Y.; Wang, P.; Duan, D.; Xu, W. Ultrasensitive detection of viable enterobacter sakazakii by a continual cascade nanozyme biosensor. Anal. Chem. 2017, 89, 10194–10200. [Google Scholar] [CrossRef] [PubMed]
  12. Tuerk, C.; Gold, L. Systematic evolution of ligands by exponential enrichment RNA ligands to bacteriophage T4 DNA polymerase. Science 1990, 249, 505–510. [Google Scholar] [CrossRef] [PubMed]
  13. Famulok, M.; Hartig, J.S.; Mayer, G. Functional aptamers and aptazymes in biotechnology, diagnostics, and therapy. Chem. Rev. 2007, 107, 3715–3743. [Google Scholar] [CrossRef] [PubMed]
  14. Xiao, X.; Zhu, L.; He, W.; Luo, Y.; Xu, W. Functional nucleic acids tailoring and its application. Trac Trends Anal. Chem. 2019, 118, 138–157. [Google Scholar] [CrossRef]
  15. Shao, X.; Zhu, L.; Feng, Y.; Zhang, Y.; Luo, Y.; Huang, K.; Xu, W. Detachable nanoladders: A new method for signal identification and their application in the detection of ochratoxin A (OTA). Anal. Chim. Acta 2019, 1087, 113–120. [Google Scholar] [CrossRef] [PubMed]
  16. Wu, S.J.; Liu, L.H.; Duan, N.; Wang, W.Y.; Yu, Q.R.; Wang, Z.P. A test strip for ochratoxin A based on the use of aptamer-modified fluorescence upconversion nanoparticles. Microchim. Acta 2018, 185, 497. [Google Scholar] [CrossRef] [PubMed]
  17. Zhou, W.L.; Kong, W.J.; Dou, X.W.; Zhao, M.; Ouyang, Z.; Yang, M.H. An aptamer based lateral flow strip for on-site rapid detection of ochratoxin A in Astragalus membranaceus. J. Chromatogr. B 2016, 1022, 102–108. [Google Scholar] [CrossRef]
  18. Zhang, G.L.; Zhu, C.; Huang, Y.F.; Yan, J.; Chen, A.L. A lateral flow strip based aptasensor for detection of ochratoxin A in corn samples. Molecules 2018, 23, 291. [Google Scholar] [CrossRef] [Green Version]
  19. Wu, S.J.; Liu, L.H.; Duan, N.; Li, Q.; Zhou, Y.; Wang, Z.P. Aptamer-based lateral flow test strip for rapid detection of zearalenone in corn samples. J. Agr. Food Chem. 2018, 66, 1949–1954. [Google Scholar] [CrossRef]
  20. Zhu, C.; Zhang, G.L.; Huang, Y.F.; Yang, S.M.; Ren, S.Y.; Gao, Z.X.; Chen, A.L. Dual-competitive lateral flow aptasensor for detection of aflatoxin B1 in food and feedstuffs. J. Hazard. Mater. 2018, 344, 249–257. [Google Scholar] [CrossRef]
  21. Sun, L.L.; Zhao, Q. Direct fluorescence anisotropy approach for aflatoxin B1 detection and affinity binding study by using single tetramethylrhodamine labeled aptamer. Talanta 2018, 189, 442–450. [Google Scholar] [CrossRef] [PubMed]
  22. Nutiu, R.; Li, Y. Structure-Switching Signaling Aptamers. J. Am. Chem. Soc. 2003, 125, 4771–4778. [Google Scholar] [CrossRef] [PubMed]
  23. Chen, J.; Fang, Z.; Liu, J.; Zeng, L. A simple and rapid biosensor for ochratoxin A based on a structure-switching signaling aptamer. Food Control. 2012, 25, 555–560. [Google Scholar] [CrossRef]
  24. Le, L.C.; Cruz-Aguado, J.A.; Penner, G.A. DNA ligands for aflatoxin and zearalenone. U.S. Patent Application U.S. PCT/CA2010/001292, 6 September 2012. [Google Scholar]
  25. Shim, W.B.; Kim, M.J.; Mun, H.; Kim, M.G. An aptamer-based dipstick assay for the rapid and simple detection of aflatoxin B1. Biosens. Bioelectron. 2014, 62, 288–294. [Google Scholar] [CrossRef]
  26. Li, Y.P.; Sun, L.L.; Zhao, Q. Aptamer-structure switch coupled with horseradish peroxidase labeling on a microplate for the sensitive detection of small molecules. Anal. Chem. 2019, 91, 2615–2619. [Google Scholar] [CrossRef]
  27. Sun, L.L.; Zhao, Q. Competitive horseradish peroxidase-linked aptamer assay for sensitive detection of aflatoxin B1. Talanta 2018, 179, 344–349. [Google Scholar] [CrossRef]
  28. Liu, H.; Luan, Y.; Lu, A.; Li, B.; Yang, M.; Wang, J. An oligosorbent-based aptamer affinity column for selective extraction of aflatoxin B2 prior to HPLC with fluorometric detection. Mikrochim. Acta 2017, 185, 71. [Google Scholar] [CrossRef]
  29. Wang, D.; Zhang, Z.; Li, P.; Zhang, Q.; Zhang, W. Time-resolved fluorescent immunochromatography of aflatoxin B1 in soybean sauce: A rapid and sensitive quantitative analysis. Sensors 2016, 16, 1094. [Google Scholar] [CrossRef] [Green Version]
  30. Yu, L.; Li, P.W.; Ding, X.X.; Zhang, Q. Graphene oxide and carboxylated graphene oxide: Viable two-dimensional nanolabels for lateral flow immunoassays. Talanta 2017, 165, 167–175. [Google Scholar] [CrossRef]
  31. Hu, S.R.; Dou, X.W.; Zhang, L.; Xie, Y.J.; Yang, S.H.; Yang, M.H. Rapid detection of aflatoxin B1 in medicinal materials of radix and rhizome by gold immunochromatographic assay. Toxicon 2018, 150, 144–150. [Google Scholar] [CrossRef]
  32. Wang, M.; Jiang, N.; Xian, H.; Wei, D.; Shi, L.; Feng, X. A single-step solid phase extraction for the simultaneous determination of 8 mycotoxins in fruits by ultra-high performance liquid chromatography tandem mass spectrometry. J. Chromatogr. A 2016, 1429, 22–29. [Google Scholar] [CrossRef] [PubMed]
Figure 1. Schematic illustration of adapter side-flow tomography sensor for detecting aflatoxin B1 (AFB1). (a) In the absence of AFB1, the Cy5-labeled aptamer was first combined with a partially complementary strand at the test-line (T-line) (a-1); the remaining aptamer was then combined with the poly T of the control line (C-line) (a-2). (b) In the presence of AFB1, the Cy5-labeled aptamer preferred to bind with AFB1 (b-3), and the fluorescence intensity of the T-line decreased. The aptamer bound to AFB1 was still bound to poly T of the C-line (b-4), while the fluorescence intensity of the C-line increased, and the value of test-line to control line (T/C) was used to quantify AFB1.
Toxins 12 00136 g001
Figure 2. Optimization of aptamer sequences and concentrations (T0 and T1 correspond to the fluorescence intensity of T-line in the absence and presence of 100 ng/mL AFB1). (a) The predicted secondary structure of the 50-mer aptamer (apt 50), apt 32, and apt 26. The apt 32 and apt 26 probes were truncated from the apt 50 [21]. (b) Fluorescence intensity of T-line and the inhibition rates of apt 50, apt 32, and apt 26 with and without AFB1. (c) Fluorescence intensity of T-line and the inhibition rates with different concentrations of apt 32.
Toxins 12 00136 g002
Figure 3. Optimization of the complementary sequence on the T-line (T0 and T1 correspond to the fluorescence intensity of T-line in the absence and presence of 100 ng/mL AFB1). (a) The complementary relationship of probe 1, probe 2, probe 3, and probe 4 with apt 32. (b) The variation of the fluorescence intensity of T-line and inhibition rate with different complementary DNA probes.
Toxins 12 00136 g003
Figure 4. Optimization of the type and composition of the binding buffer (T0 and T1 correspond to the fluorescence intensity of T-line in the absence and presence of 100 ng/mL AFB1). (a) The trend of fluorescence intensity and inhibition rates with three different binding buffers. (b) The trend of fluorescence intensity and inhibition rates with different concentrations of Mg2+ in Tris-HCl buffer. (c) The variation of fluorescence intensity and inhibition rates with the increase of acetonitrile concentration. (d) The variation of fluorescence intensity and inhibition rates with the increase of methanol concentration.
Toxins 12 00136 g004
Figure 5. Specificity of the aptamer-based lateral flow strips (ALFs) by analyzing AFB1 against other mycotoxins at 100 ng/mL. (a) The T-line fluorescence intensity of other mycotoxins. (b) Chemical structures of AFB1, AFB2, aflatoxin G1 (AFG1) and AFG2.
Toxins 12 00136 g005
Figure 6. Quantitative determination of type-B aflatoxins with prepared strips. (a) Fluorescence spectra of T-line and C-line at different concentrations of AFB1. (b) The linear relationship between the ratio of fluorescence intensity (F(T/C)) of the detection line and the control line and the logarithm of the concentration of type-B aflatoxins at different concentrations.
Toxins 12 00136 g006
Table 1. Sequences of oligonucleotides used in the study.
NameSequence (5’–3’)
apt 50Cy5-A12-GTTGGGCACGTGTTGTCTCTCTGTGTCTCGTGCCCTTCGCTAGGCCCACA
apt 32Cy5-A12-GGGCACGTGTTGTCTCTCTGTGTCTCGTGCCC
apt 26Cy5-A12-CACGTGTTGTCTCTCTGTGTCTCGTG
probe 1biotin-GGGCACGAGACACAGAGAGACAACACGTGCCC
probe 2biotin-GACACAGAGAGACAA
probe 3biotin-GGGCACGAGACACAG
probe 4biotin-AGACAACACGTGCCC
poly Tbiotin-TTTTTTTTTTTT
Table 2. Summary of the analytical performance of different test strip detection methods for AFB1 based on the AFB1−BSA as the Test Line.
MethodTest LineRange (μg/kg)LOD1 (μg/kg)SampleReference
Antibody-stripAFB1−BSA0.3–100.1Soybean sauce[29]
Antibody-stripAFB1−BSA0.3–10.3Agricultural products[30]
Antibody-stripAFB1−BSA0.1medicinal materials[31]
Aptamer-stripAFB1−BSA0.1–10000.1food and feedstuffs[20]
Aptamer-stripDNA single strand0.2–200.16nuts and dried figspresent
1LOD: limit of detection
Table 3. Detection results of the type-B aflatoxins levels in spiked peanut and fig samples.
SampleMycotoxinsSpiked
(μg/kg)
HPLC-MS/MS
Detected (μg/kg)
RSD1
(%)
Proposed Method Detected (μg/kg)Recovery (%)RSD
(%)
PeanutAFB132.94.13.1103.72.2
1010.12.99.696.56.5
AFB233.11.43.0101.03.3
1010.50.810.9108.76.9
Dried figsAFB132.93.63.3109.42.0
109.53.210.2102.22.2
AFB233.10.472.893.35.9
1010.50.5711.4112.02.7
AlmondAFB132.90.43.1102.22.2
1010.02.09.897.64.9
AFB232.71.22.893.74.1
109.890.69.293.57.9
1 RSD: relative standard deviation.

