1. Introduction
Mycotoxins are fungal secondary metabolites with adverse effects on human and animal health. To date, more than 400 different molecules, produced by several types of fungi, have been characterized [
1]. Because of their high toxicity, aflatoxins B
1, B
2, G
1, and G
2 (AFB
1, AFB
2, AFG
1, and AFG
2) are the most important, and are produced by the species of
Aspergillus section
Flavi, mainly
Aspergillus flavus [
2]. These toxins can contaminate a wide range of agricultural commodities, either in the field or during storage, and they are considered ubiquitous contaminants of the food supply throughout the developing world [
3]. AFB
1 has been described as the most toxic naturally occurring human carcinogen and as the cause of hepatocellular carcinoma in humans and animals [
3,
4]. The International Agency for Research on Cancer (IARC) has classified the “naturally occurring mixes of aflatoxins” as a Group 1 human carcinogens [
5].
Aflatoxin (AF) contamination of feed and food products poses a serious risk to food security and leads to important economic losses due to the impossibility to market contaminated products as well as veterinary and health costs. Most countries have established maximum levels of these contaminants allowed in food products [
5]. One of the main problems is that mycotoxins are extremely stable compounds. They are heat-resistant, with melting temperatures above 250 °C, and tolerate a wide pH range, from 3 to 10 [
6,
7]. Furthermore, mycotoxins have nondetectable sensory characteristics and they do not change the organoleptic properties of food products. Thus, once mycotoxins are present in raw ingredients, they are very difficult to eliminate. Therefore, preventing contamination is the best approach and thus it is essential to establish adequate control methods to prevent AFs from entering the food chain [
8]. The best strategy to prevent their presence in agrifood products is to completely avoid fungal growth. However, this might be complicated due to the way food and feed materials are harvested, stored and processed. Moreover, the presence of the fungus is not always associated with the presence of mycotoxins, as the ecological conditions for mycotoxin production are narrower than for fungal growth. Thus, it becomes more important to look for methods that not only focus on controlling fungal growth in food matrices, but also on preventing the synthesis of mycotoxins [
6,
9].
Many factors influence
A. flavus growth and AF production in food products, including nutritional composition, temperature, pH, water activity (a
w), atmospheric composition, and storage times, as well as the presence and concentration of preservatives [
10]. The application of food preservatives to control mycotoxin-producing fungi is effective. However, consumers are now demanding safer and more ecofriendly products free from chemicals. In this context, natural plant extracts are considered to be good alternatives [
11]
Essential oils (EOs) are aromatic extracts obtained mostly from plant material and have demonstrated strong antimicrobial, antitoxigenic and food preservative properties as well as low toxicity towards animals and humans [
12]. They are allowed in food products, have less environmental impact and, therefore, a wider public acceptance [
13]. These natural plant extracts are recognized as safe on the GRAS (Generally Recognized As Safe) list, and are used in various sectors, such as agriculture (plant fortifiers, biostimulants, pesticides, postharvest or herbicides), food industry (preservatives or flavorings) and pharmaceutics (aroma compounds or functional ingredients) [
13]. In addition, their use is approved for ecological agriculture [
14]. Several EOs have been reported to reduce not only the growth of toxigenic fungal species but also to interfere in mycotoxin biosynthesis to some extent [
15,
16].
Satureja montana (SM) and
Origanum virens (OV) EOs are highly rich in carvacrol and thymol, respectively, which are responsible for their antifungal properties [
17].
It is well known that controlling the dose of preservatives is crucial, since suboptimal concentrations could lead to stimulation of both growth and toxin accumulation [
18]. The efficacy of EOs is also influenced by the environmental conditions, mainly a
w and temperature [
19]. Therefore, it is important to unravel the interactions between these environmental factors and antifungal compounds. The study of these interactions required laborious in vitro ecophysiological studies to evaluate fungal growth and mycotoxin production, which requires the use of a lot of material and the planning of long-term experiments. The use of Bioscreen-C Microbiological Growth Analyzer for mycological studies is a quick method to study the effects of multiple factors on mold growth [
10,
20,
21].
The aim of this work was to evaluate the effect of two EOs extracted from SM and OV on the early growth and ability to produce AFs by two A. flavus strains (A7 and A10) at several EO concentrations (0, 350, 700, and 1000 μg/mL) and three aw conditions (0.94, 0.96, and 0.98).
2. Results
2.1. Effect of Satureja montana and Origanum virens Essential Oils under Different Water Activities on Aspergillus flavus Growth
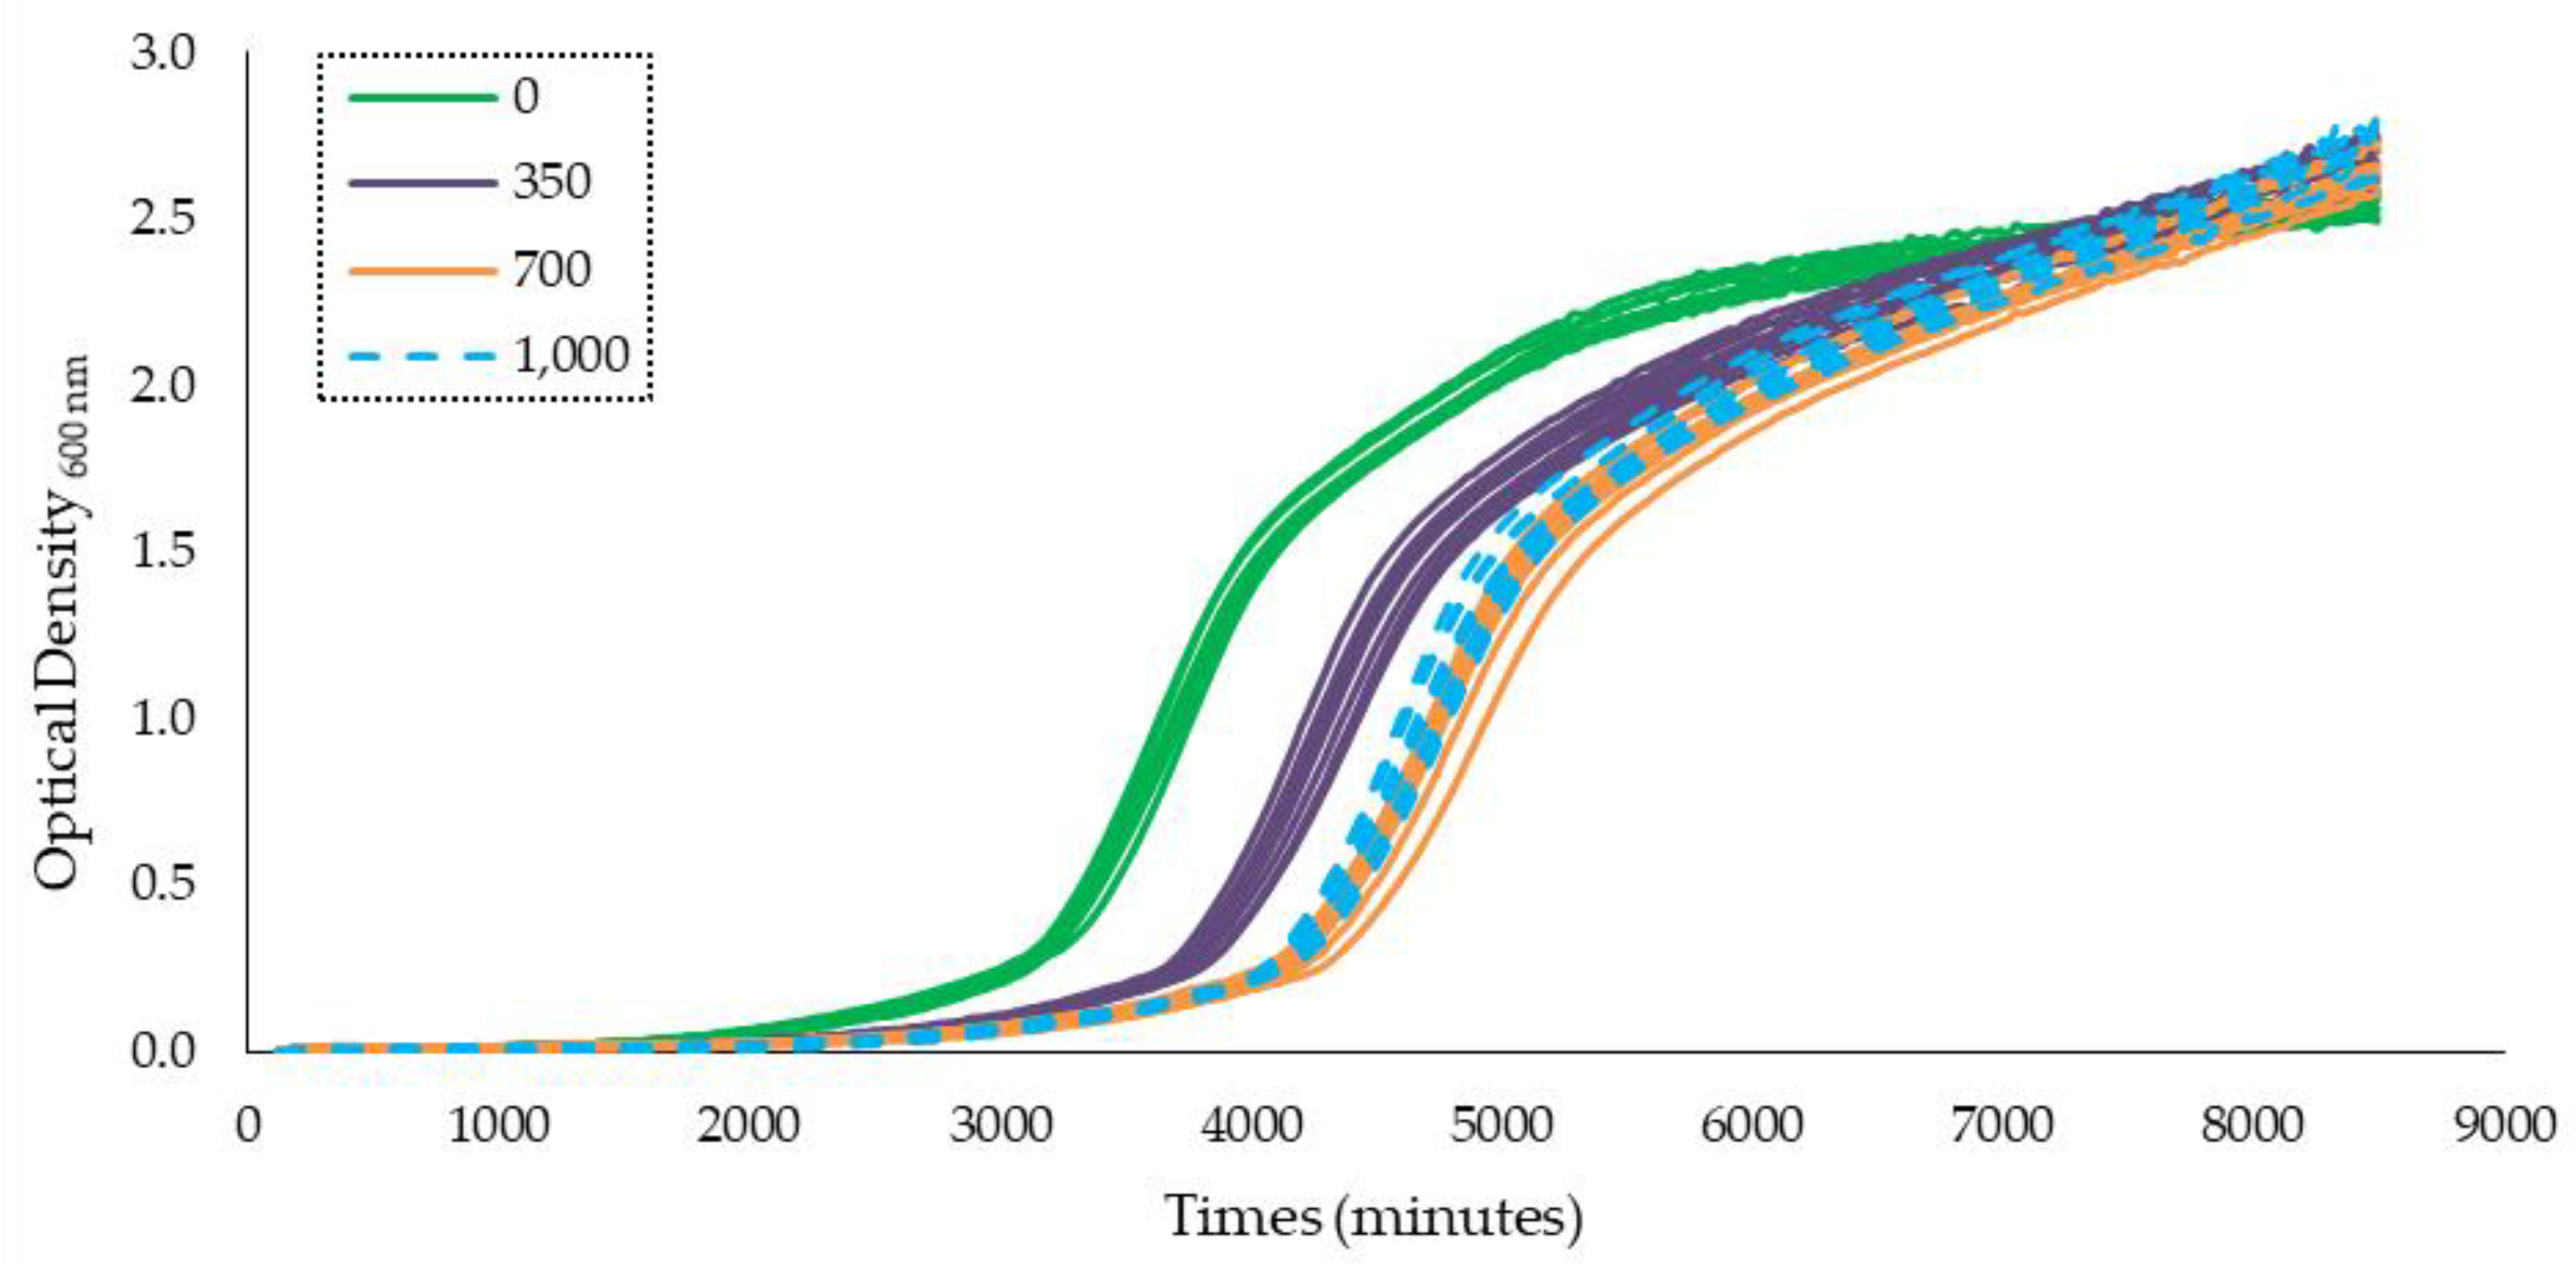
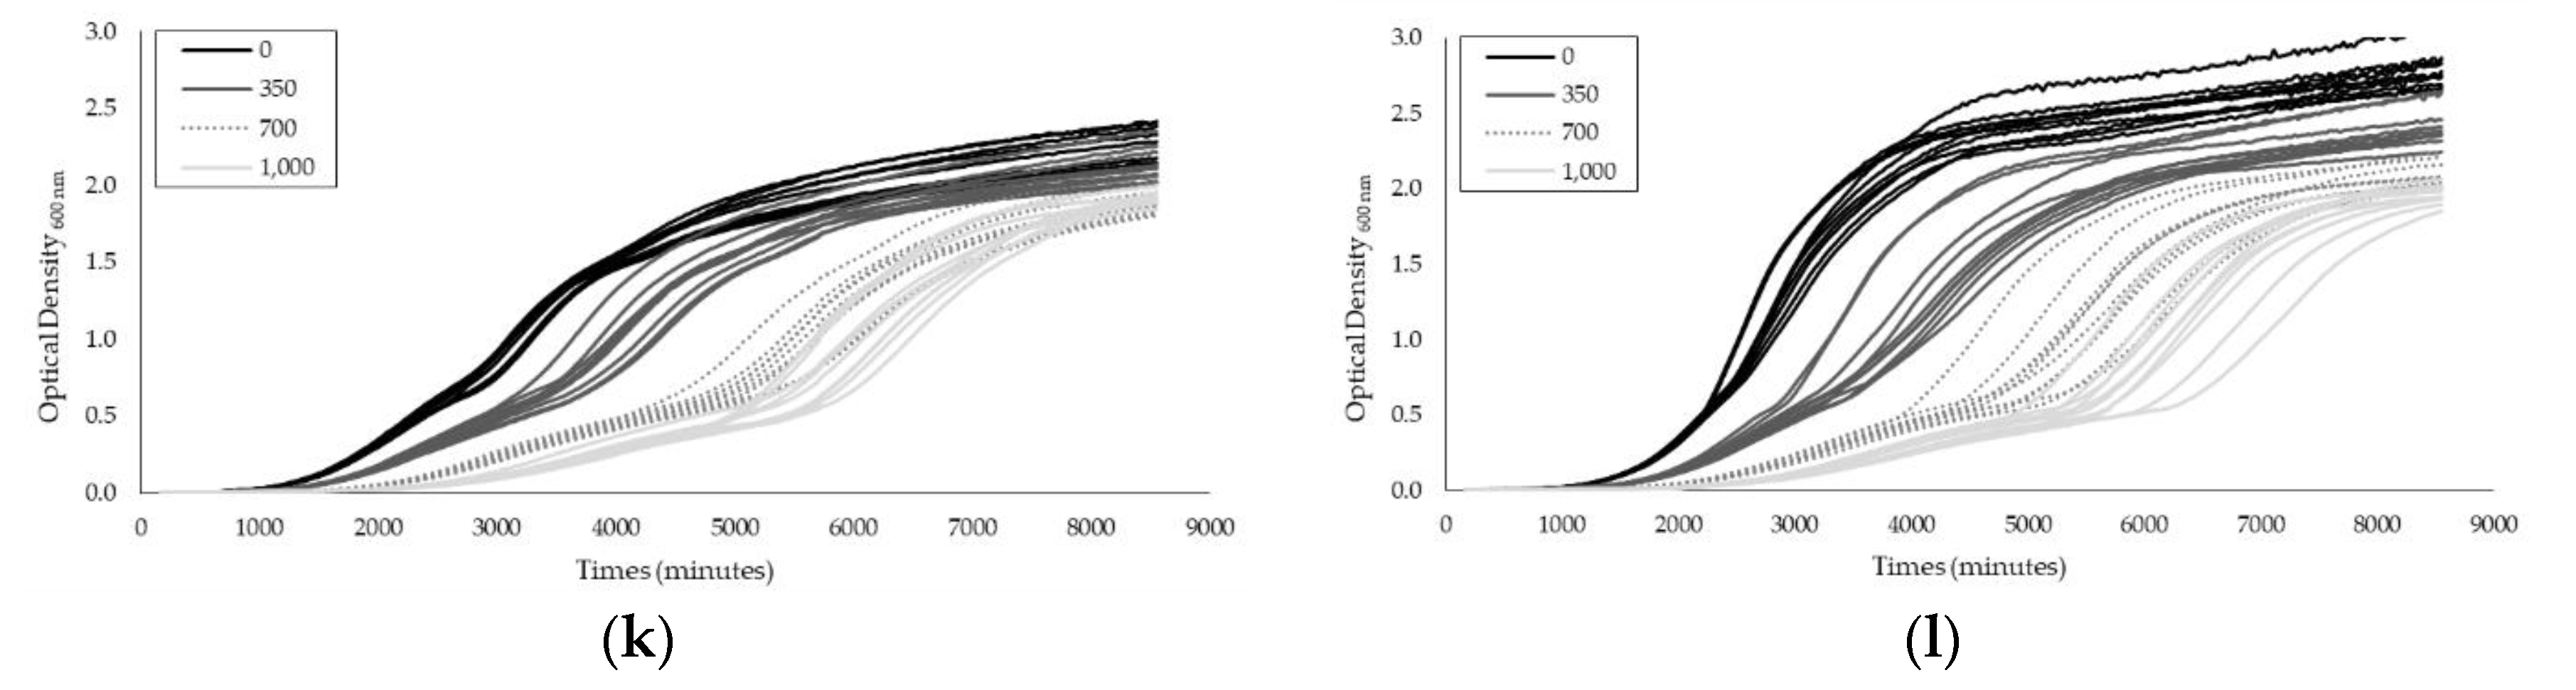
The growth curves obtained using Bioscreen-C for the two strains of
A. flavus (A10 and A7), in Yeast Extract Sucrose (YES) medium supplemented by different concentrations (0, 350, 700, and 1000 µg/mL) of
Satureja montana (SM) and
Origanum virens (OV) essential oils (EOs), under the three water activities tested (0.94, 0.96, and 0.98 a
w), are shown in
Appendix A. As an example,
Figure 1 shows the growth curve of
A. flavus A7 strain at 0.94 a
w with different OV EO concentrations. The growth curves represent the optical density (O.D) units at 600 nm over time.
In this study, comparisons between treatments were done using the time to detection (TTD). TTD is described as the necessary time for fungal growth to reach a specific O.D level with a treatment. Medina et al. (2012) also described a direct relationship between O.D and
A. flavus biomass [
20]. In this work, the TTD was calculated using an O.D at 600 nm = 0.2.
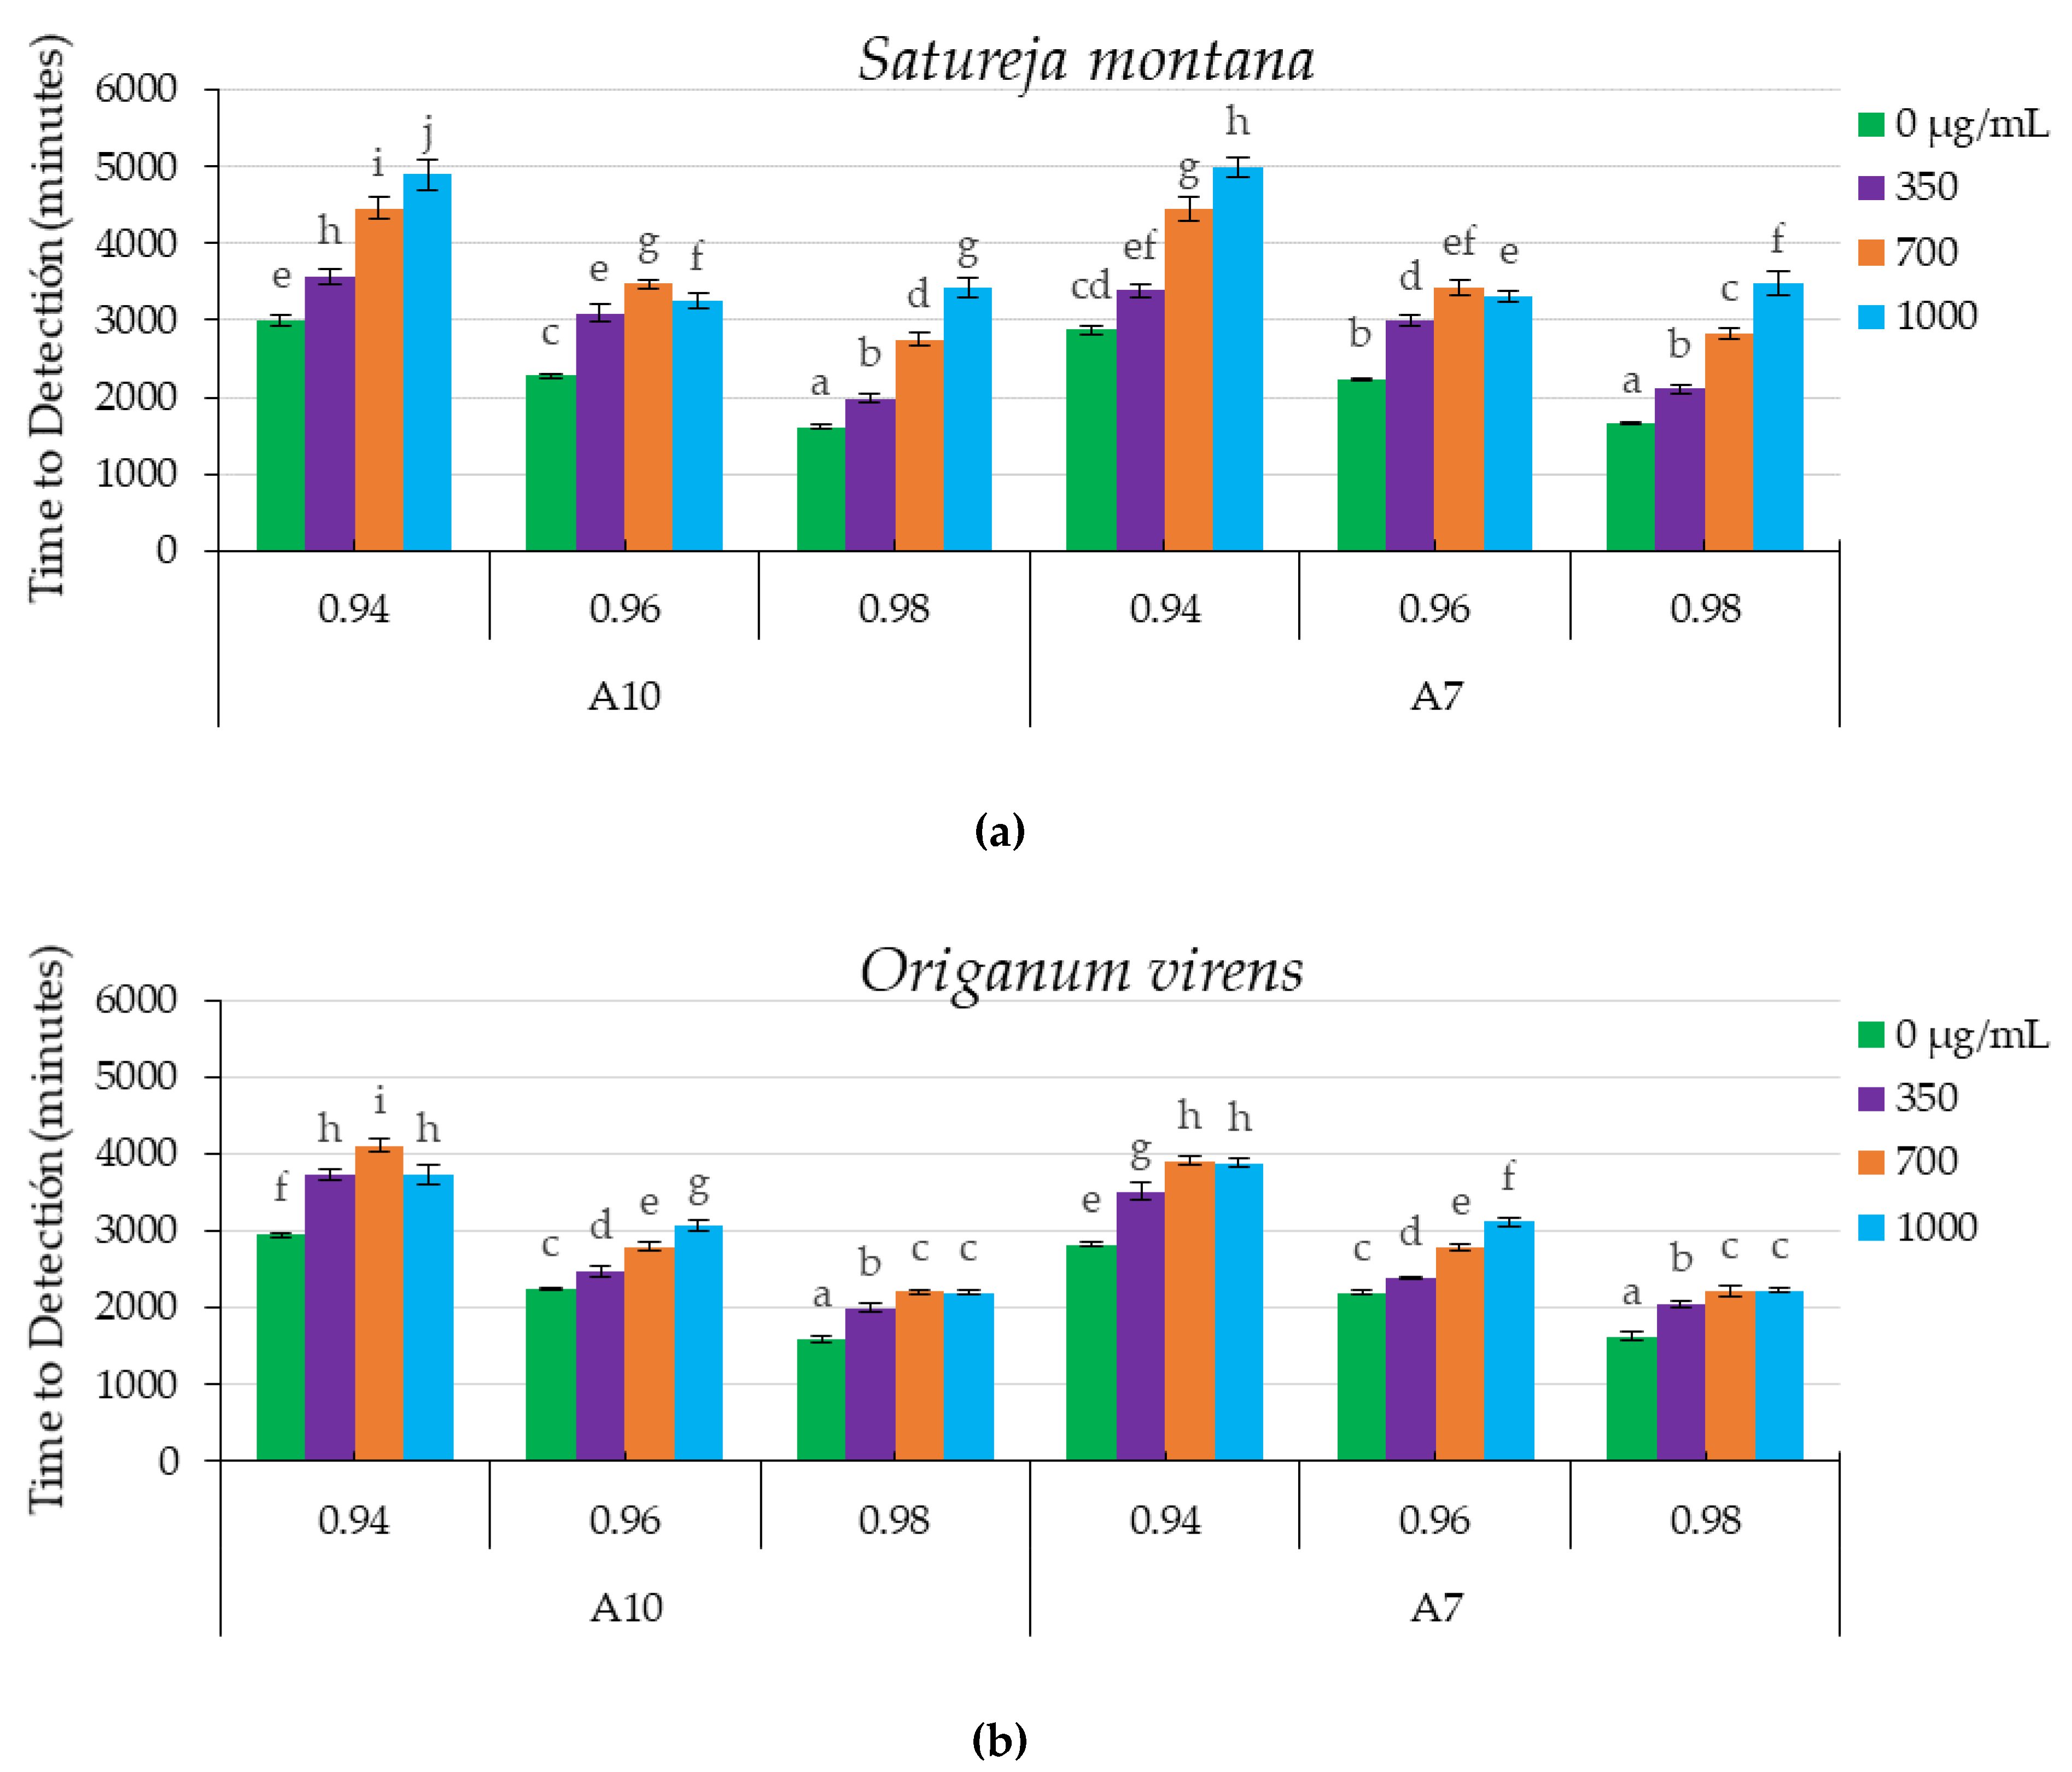
Figure 2 shows the TTD for all the combinations of EO concentrations and a
w for the two
A. flavus strains tested.
The statistical analyses regarding the influence of SM EO treatment on the growth of both strains (
Figure 2a) showed a significant effect of EO concentrations (
p < 0.0001), and a
w levels (
p < 0.0001). The interaction between both factors (a
w and EO concentration) was also statistically significant (
p < 0.0001). The highest antifungal properties, related to the less favorable conditions for growth (highest TTD), were obtained with 1000 µg/mL of SM EO and 0.94 a
w, with approximate TTD values of 4900 and 5000 min in the cases of A7 and A10 strains, respectively. There was a direct relationship between the highest SM EO concentrations and increases in TTD, showing delayed fungal growth. Interestingly, at 0.96 a
w and for both
A. flavus strains, more inhibition was observed at 700 µg/mL than at 1000 µg/mL. In general, the treatment with SM EO retarded fungal growth in relation to the corresponding control at all a
w levels tested.
The statistical analyses showed that, for OV EO, the growth of both strains tested (
Figure 2b) was significantly affected by the EO concentrations (
p < 0.0001) and a
w levels (
p < 0.0001). As previously shown, the interactions between both factors were also statistically significant (
p < 0.0001). The highest antifungal effect was observed at 0.94 a
w and 700 µg/mL, with values of approximately 4000 min for both isolates of
A. flavus. For the A7 strain, there were no significant differences between the two higher doses tested (700 and 1000 µg/mL) of OV EO at 0.94 and 0.98 a
w. In the case of the A10 strain, the maximum delay in fungal growth was obtained at 0.94 a
w and 700 µg/mL. In all a
w conditions tested, the application of OV EO delayed fungal growth with respect to the corresponding control.
In order to further study the effect of different concentrations of EOs and their interaction with environmental factors in
Figure 3, we represented the rate to detection (RTD, 1/TTD) at 0.2 nm calculated in all conditions tested and normalized by the RTD
0, which corresponds to the control without EO treatment (RTD/RTD
0). If the effectiveness of the EOs was the same under the different environmental conditions, in these graphs, the lines should be superposed to each other. This also allows for the comparison of the efficacy between different antifungals.
In the specific case of SM EO shown in
Figure 3a,b, it can be observed that wetter conditions (0.98 a
w) will allow higher control under the highest concentrations in comparison with the other dryer conditions tested. For OV EO, it can be observed in
Figure 3c,d that there is a clear interaction at 0.96 a
w where the antifungal effect is decreased.
For both A. flavus isolates, the presence of SM EO showed higher antifungal activity compared to OV EO treatment at all the aw levels tested.
2.2. Effectiveness of Satureja montana and Origanum virens Essential Oils at Different Water Activity Levels in Reducing Aflatoxin Production
The amount of aflatoxin B
1 and B
2 (AFB
1 and AFB
2) produced after 7 days of incubation at three a
w after the treatments with SM and OV EOs was determined, and results are shown in
Table 1.
The statistical analyses regarding AFB1 and AFB2 produced by A. flavus A10 strain in the presence of SM EO showed significant differences among concentrations (p < 0.0001), aw (p < 0.0001) and their interaction (p < 0.0001). Comparing between strains, the A10 isolate was able to produce higher levels of AFB1 and AFB2. Significant reductions were achieved for both toxins when SM EO was used at 0.96 and 0.98 aw, with percentages of 85% and 94%, respectively, in AFB1 concentrations of 1000 µg/mL of SM EO. For AFB2, 90% and 94% reductions were observed at the same dose of SM EO. It is important to highlight the reduction in AF production found at 0.96 aw. Aspergillus flavus A10 reached very high levels of production in control assays and more than 84% of reduction was obtained even at the low dose of SM EO (350 µg/mL) tested.
The treatment with OV EO had a lower effect on AF production. The statistical analyses of AFB1 for the A10 strain showed significant differences between aw (p < 0.0001) but no effect on EO concentration (p = 0.3140) or the interaction of both factors (p = 0.3323). In the case of AFB2, there were significant differences among the aw levels (p < 0.0001) and EO concentrations (p = 0.050), whereas the interaction between factors was not significant.
Aspergillus flavus A7 produced lower levels of AFB1 and AFB2 than A10. In most cases, the levels were below the detection limits. The statistical analyses regarding AFB1 and AFB2 produced in the presence of SM EO showed significant differences among the concentrations (p < 0.0001) and aw levels (p < 0.0001), as well as a significant interaction between both factors (p < 0.0001). The OV EO treatment showed significant differences among aw levels (p < 0.0001) and EO concentrations (pB1 < 0.0001 and pB2 = 0.0040), as well as the interaction of factors (pB1 = 0.0003 and pB2 = 0.0008).
3. Discussion
Environmental sustainability, as well as ensuring food safety, are important issues which have increased the search for new products that might be applied as fungicides or natural preservatives, to replace synthetic chemicals to control the growth of toxigenic species in agrifood products. It has been widely demonstrated that essential oils (EOs) could be a good alternative to reduce fungal growth and mycotoxin production by several toxigenic species [
11]. However, to develop appropriate control strategies to be applied in food matrices, it is important to study fungal behavior under different environmental conditions. Several authors have reported a variation in the effectiveness of fungicide treatments under different environmental conditions, mainly temperature or humidity [
9,
22]. In order to establish the interaction of these compounds with environmental factors (i.e., storage or conservation conditions), in vitro ecophysiological studies are a good option since they provide accurate and rapid results. There is also a need for rapid in vitro techniques that give significant information on the range of actions of these compounds under different environmental conditions. The Microbiological Growth Analyzer, Bioscreen-C, is a fast system that allows the evaluation of the effects of these new control agents under a combination of various environmental factors [
23]. Moreover, this method has been successfully applied to evaluate the growth of filamentous organisms through automated monitoring [
20,
24]. In addition, this system provides an inexpensive tool to simultaneously test various compounds and to establish their optimal environmental conditions to be applied. This method allows us to plan large-scale studies since it is composed of two 100-well plates, requiring a minimal volume (300–500 µL/well), and all wells can be treated independently [
20]. As mentioned before, the parameter studied in this work was the time to detection (TTD, time in which fungal growth is detected at a certain biomass level), which makes the calculation independent of the experimental time [
20]. The study of these parameters is a very good approximation to understand the growth of fungal colonies in a 3D space and at very low biomass levels [
10].
Recent consumer trends towards safer foodstuffs, produced using sustainable and ecofriendly methods, have sparked great interest in new alternatives to traditional chemical food preservatives or synthetic fungicides [
13]. In a recently published work carried out by our group, the EOs extracted from
Satureja montana (SM) and
Origanum virens (OV) were demonstrated to be effective to controlling
A. flavus growth and its ability to produce aflatoxins (AF) in vitro or in maize grains when humidity was maintained at high levels [
25]. Considering the influence of environmental factors on the effectiveness of EOs, the objective of the present work was to determine if they were able to control fungal growth and AF production at three different water activity (a
w) levels. Moreover, it is known that the additional stress posed by fungicide agents may stimulate mycotoxin production as a defense reaction when environmental conditions vary [
26]. Our results, which showed that under specific temperature x a
w combinations, the amount of toxin was increased, confirming the necessity of performing this kind of integrated experiment to test the effectiveness of antifungal compounds at different doses and in a wide range of conditions. This is especially important in the case of low-producing strains, such as the one we used (A7), which without EOs would not be considered as a problem in terms of food safety. However, AF production spikes were detected at certain conditions of a
w under the presence of both EOs, increasing the potential risk for consumers.
In this study, we have demonstrated that SM EO was able to retard fungal growth and reduce AF production, mainly at the highest a
w levels tested. The results obtained regarding the effect of SM EO on fungal growth and AF production by
A. flavus at 0.98 a
w using Bioscreen C are similar to those reported in previous in vitro studies in our laboratory [
25]. The most significant results in this case were observed at 0.96 a
w, which is coincident with the conditions in which both isolates reached the highest levels of AF production. In this latter case, the levels of inhibition reached significant values in the case of fungal growth and AF production, respectively, even at the lowest dose tested (350 µg/mL). Therefore, the application of this EO might be adequate during storage when the moisture levels of the products are quite high. As mentioned above, the treatment with SM EO was not effective to significantly reduce AF production at 0.94 a
w. However, production levels reached at this a
w are quite low, even at control conditions compared with other conditions, which again reveals the relevance of maintaining good storage conditions to avoid the AF contamination of agrifood products, and it would not be necessary to apply any fungicide treatment. Besides, this treatment would be applied in regions with wet weather conditions where the maintenance of these good storage practices is difficult and expensive.
Taking into account our results, the application of SM EO would be appropriate in food products with high water content and those that are frequently contaminated by AFs such as sorghum, almonds, pistachio and rice. On the contrary, the treatment of dried food matrices might not be necessary due to the inability of A. flavus to produce AFs in these extreme conditions.
5. Materials and Methods
5.1. Microorganism and Essential Oils
5.1.1. Fungal Strains
Two aflatoxin-producing strains of
A. flavus were used (A7 and A10). They were isolated from maize and oats in different works performed in our laboratory. The correct identification of these isolates was confirmed using a species-specific PCR protocol [
27]. The strains were selected due to their ability to produce aflatoxins (AFs). The strain A10 was classified as a high toxin-producing isolate (5.90 ng/µL AFB
1 + 0.43 ng/µL AFB
2), whereas the strain A7 was able to produce low levels of AFs (0.33 ng/µL AFB
1 + 0.03 ng/µL AFB
2).
The strains were maintained by regular subculturing on potato dextrose agar medium (PDA (Pronadisa, Madrid, Spain)) at 25 ± 1 °C for 5 days in the dark, and stored as a spore suspension in 15% glycerol (Panreac, Madrid, Spain) at −80 °C until required.
5.1.2. Essential Oils of Plant
The essential oils (EOs) tested from
Satureja montana L. (SM) and
Origanum virens Hoffmanns and Link (OV) were provided by The Agricultural Research Centre of Albaladejito (Cuenca, Spain). Extraction was previously described by García-Díaz et al. (2019) [
25]. Briefly, each plant species was extracted by hydrodistillation of the dried aerial parts of aromatic plants, following the methodology proposed by the European Pharmacopoeia in a Clevenger-type apparatus for 2 h. The chromatograms are shown in
Appendix B.
These compounds were filtered with sterile 0.22 μm pore size filters (Fisher Scientific, Madrid, Spain) and stored at −20 °C in amber glass vials (Thermo Scientific, Madrid, Spain), until required.
5.2. Experimental Design
Semisolid YES (Yeast Extract Sucrose) medium (20 g/L of yeast extract, 150 g/L of sucrose, 0.5 g/L of magnesium sulfate and 0.5 g/L of agar [
20]) at different water activities (a
w) (0.94, 0.96, and 0.98) was spiked with different concentrations of the EOs. The a
w of the YES medium was modified by substituting water with glycerol [
28].
The essentials oils of SM and OV were diluted in 5 mL of YES media to obtain final concentrations of 350, 700, and 1000 μg/mL. The control medium was supplemented by the same volume of water instead of EO.
The initial spore suspensions of each strain were prepared in sterile saline solution (9 g/L sodium chloride (Merck, Darmstadt, Germany)). After homogenizing, the spore concentrations of the solutions were measured using a Thoma counting chamber (Marienfeld, Lauda-Königshofen, Germany) and then adjusted with a sterile solution to a final concentration of 107 spores per mL.
Every medium was inoculated with 50 μL of a 107 spores/mL suspension of the corresponding strain. The resulting final concentration was 105 spore/mL in the YES medium for each strain, EO concentration and aw. A total of 48 conditions were evaluated. Ten replicates per treatment were carried out.
Three hundred µL of inoculated media, as well as noninoculated controls, were placed in 100-well honeycomb plates and incubated at 25 ± 1 °C for 7 days in the Bioscreen C Microbiological Growth Analyser (Labsystems, Helsinki, Finland).
The optical density (O.D) was automatically recorded every 30 min using a 600 nm filter over 7 days (10,080 min). The data were recorded using the software Easy Bioscreen Experiment (EZExperiment) provided by the manufacturer and then exported to a Microsoft Excel Professional 2010 (Microsoft Corporation, Washington, USA) datasheet for further analyses.
5.3. Aflatoxin Assessment
For each treatment and condition, 3 replicates corresponding to the content of 3 wells were transferred to 2 mL Eppendorf tubes. AF extraction was carried out with 0.8 mL of chloroform (Merck, Darmstadt, Germany), by vigorous shaking for 60 min. The mix was then centrifuged for 5 min at 5000 rpm (Centrifuge 5417 R (Eppendorf, Stevenage, UK)). The aqueous phase was decanted, and the chloroform phase was transferred to a new tube. The samples were evaporated to dryness in a miVac vacuum centrifuge (SP Scientific, Suffolk, United Kingdom), and the residues were redissolved in 500 μL methanol/water (50:50; v/v). The samples were filtered using a nylon syringe filter, 0.22 μm pore size (Minisart®, Sartorius Stedim, Germany), and were transferred into HPLC-FLD vials and stored at −20 °C until analysis.
The samples were analyzed by an HPLC-FLD detector (Agilent1200 series HPLC, Agilent, Cheadle, UK), coupled to a UVE photochemical derivatizer (LCTech, Obertaufkirchen, Germany). The FLD detector excitation and emission wavelengths were 330 and 460 nm, respectively. Chromatographic separations were performed on a C18 column ZORBAX-Eclipse Plus (4.6 × 150 cm, 3.5 µm (Agilent, Cheadle, UK)). Methanol/water/acetonitrile (30:60:10; v/v/v) was used as the mobile phase at a flow rate of 1 mL/min. AFG2, AFG1, AFB2 and AFB1 were eluted at 6.5, 7.6, 8.7 and 10.4 min, respectively. The signals were processed by Agilent Chem-Station software (Agilent Technologies, Palo Alto, CA, USA). AFs were quantified on the basis of the HPLC fluorimetric response compared to a range of mycotoxin standards supplied by Romer Labs (Romer Labs, Runcorn, UK). The limit of detection (LOD) of the analysis was 0.52 ng for AFB1 and AFG1, and 0.06 ng for AFB2 and AFG2, based on a signal to noise ratio of 3:1.
5.4. Data Analysis
The raw datasets obtained from the Bioscreen C were subjected to two further steps before analysis. First of all, the average of the first 5 measurements (180 min) for each well was calculated, and the average was subtracted from all subsequent measurements in order to correct the different signal backgrounds. Subsequently, the time to detection (TTD) for 0.2 nm of O.D was obtained using a Microsoft Excel template (kindly provided by Dr. R. Lambert), which used linear interpolation between successive O.D readings [
29].
Once the TTDs were obtained, analysis of variance (ANOVA) was performed using the different concentrations of EOs (0, 350, 700 and 1000 μg/mL) and aw (0.94, 0.96 and 0.98) as independent variables to evaluate the effect of SM and OV essential oils on the fungal growth of A7 and A10 strains of A. flavus. In all cases, statistical analysis was performed independently for each EO and isolate. Because of the lack of normality of the AF production datasets, ANOVA analysis was performed using a log-transformed dataset. The mean comparisons for each independent variable (EO concentration and aw) were done using Tukey’s HSD. The statistical package JMP 8 (SAS Institute Inc., 2008; Cary, NC, USA) was used in the analysis.


 ,
, 


