ERβ and NFκB—Modulators of Zearalenone-Induced Oxidative Stress in Human Prostate Cancer Cells

 , , ,
, , , 
Abstract
:1. Introduction
2. Results
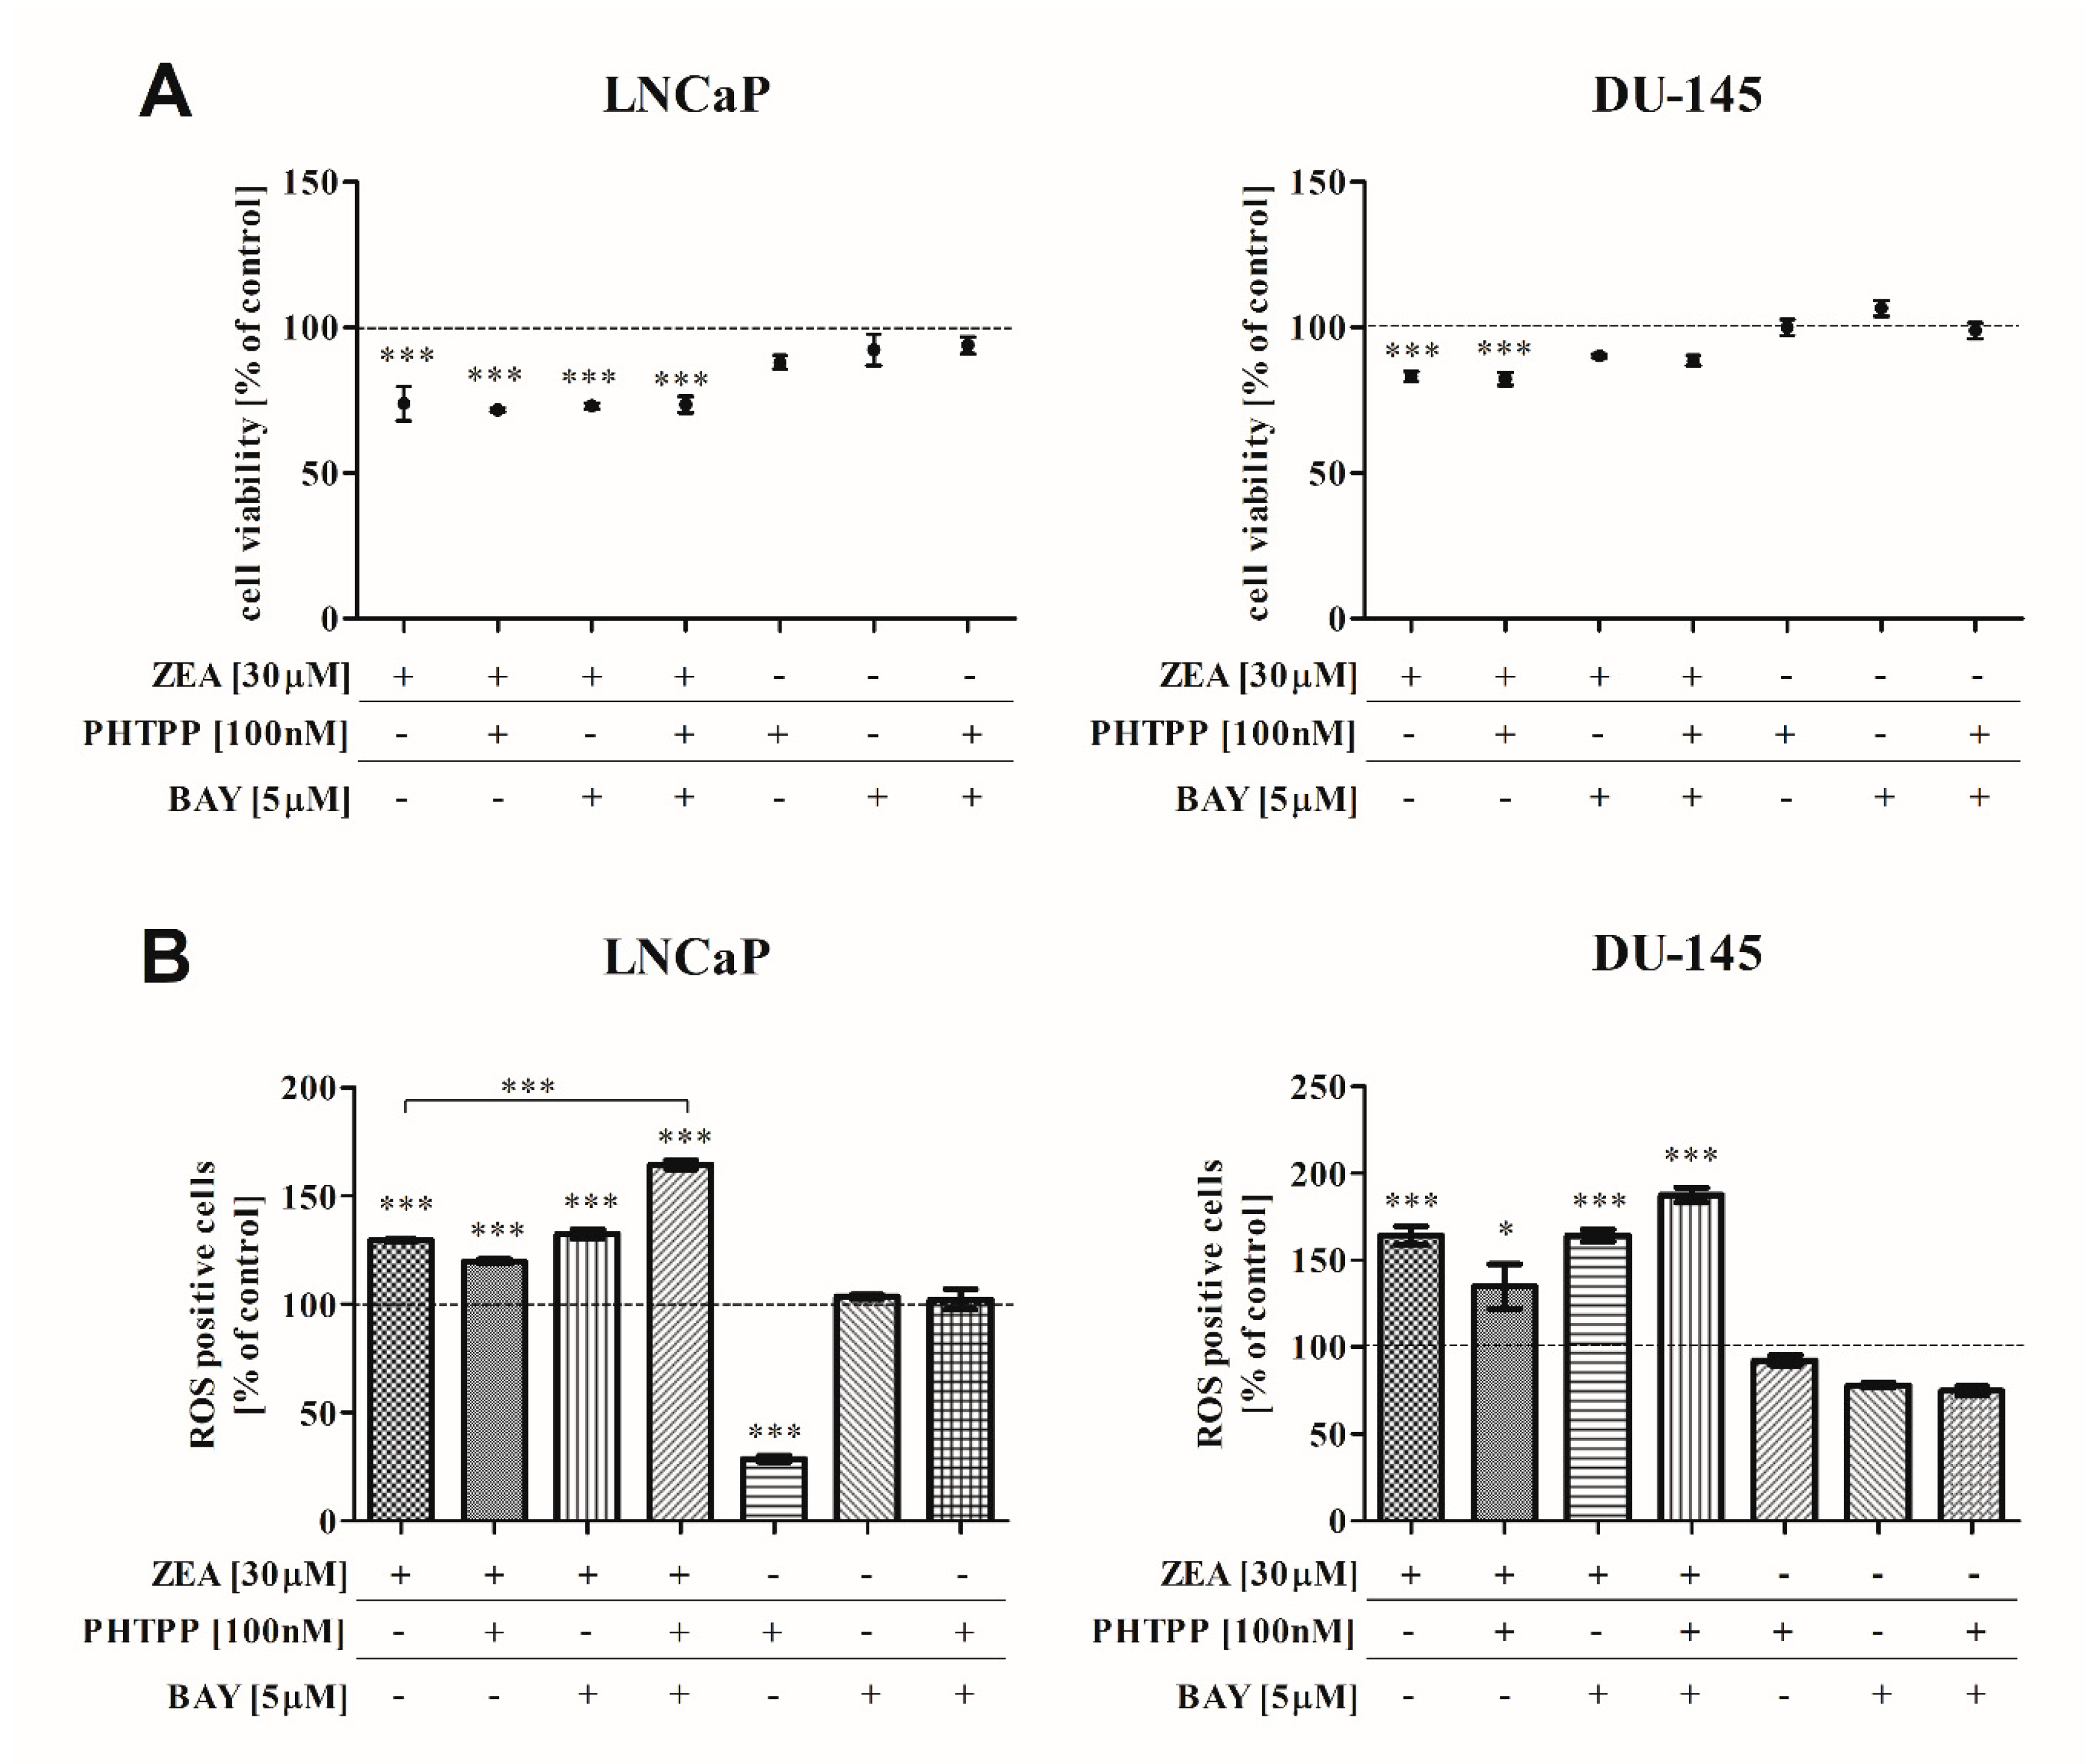
2.1. The Effect of ZEA on PCa Cell Viability
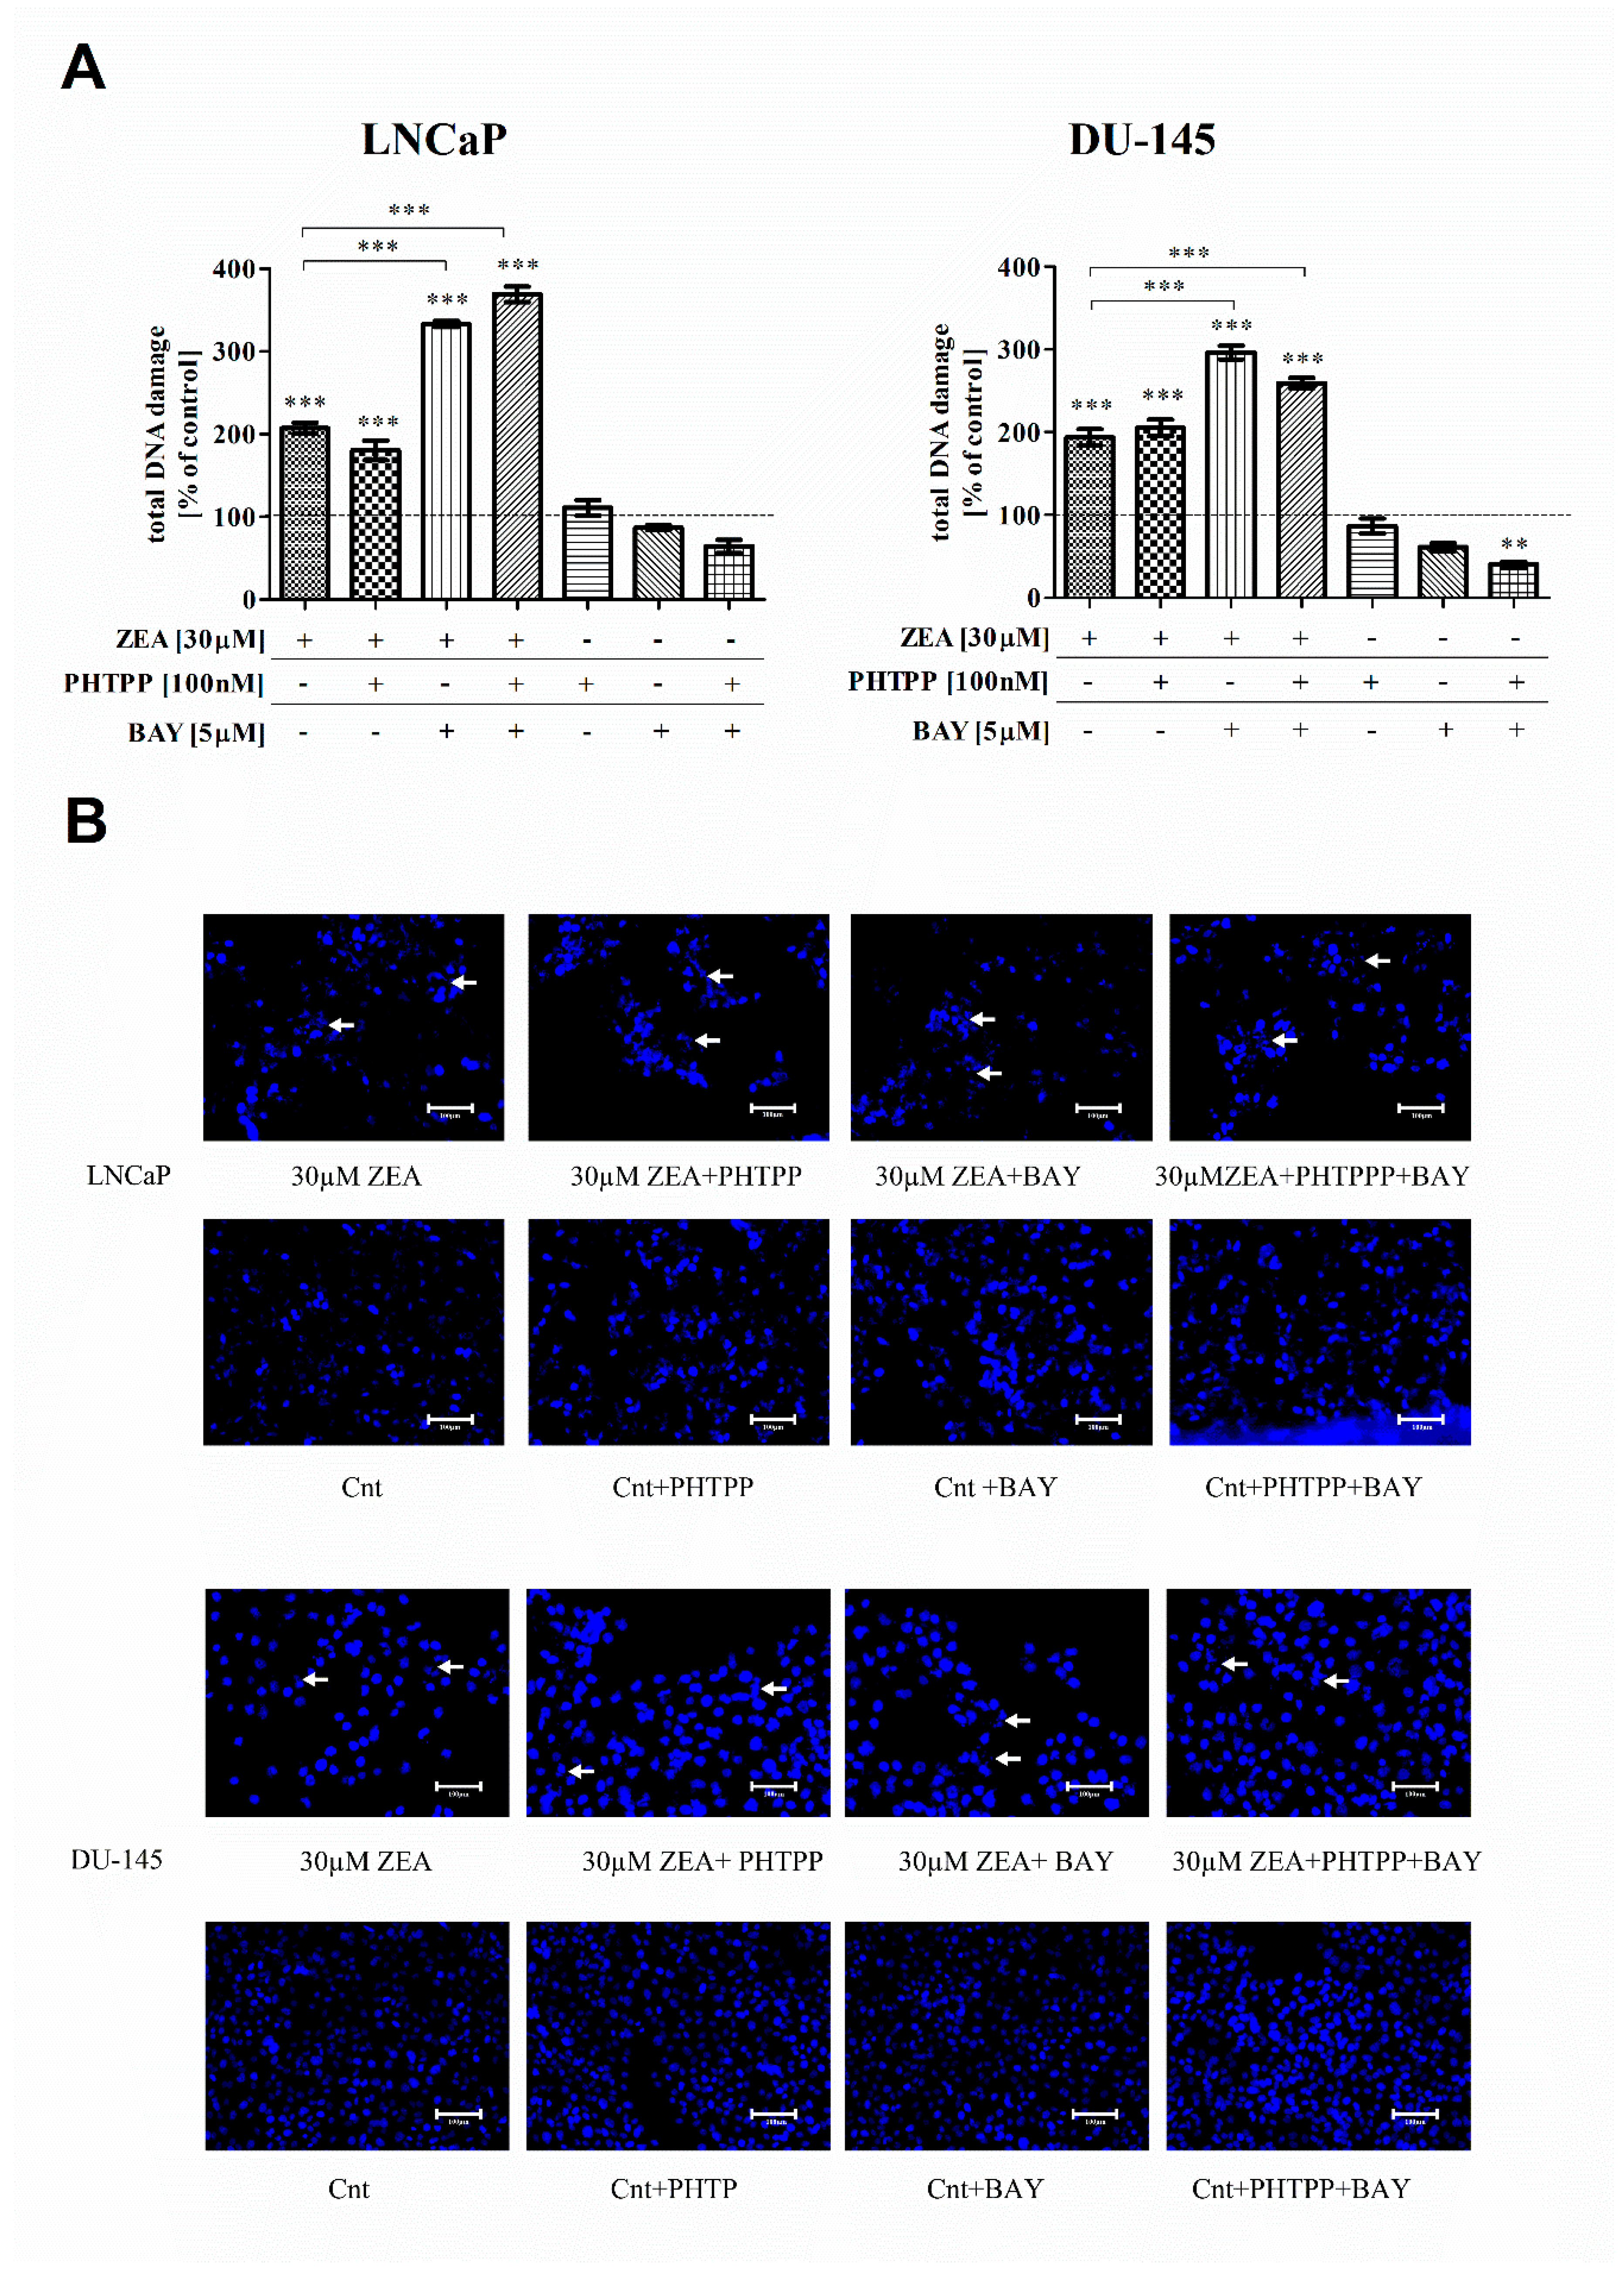
2.2. ZEA-Induced DNA Damage and ROS Production
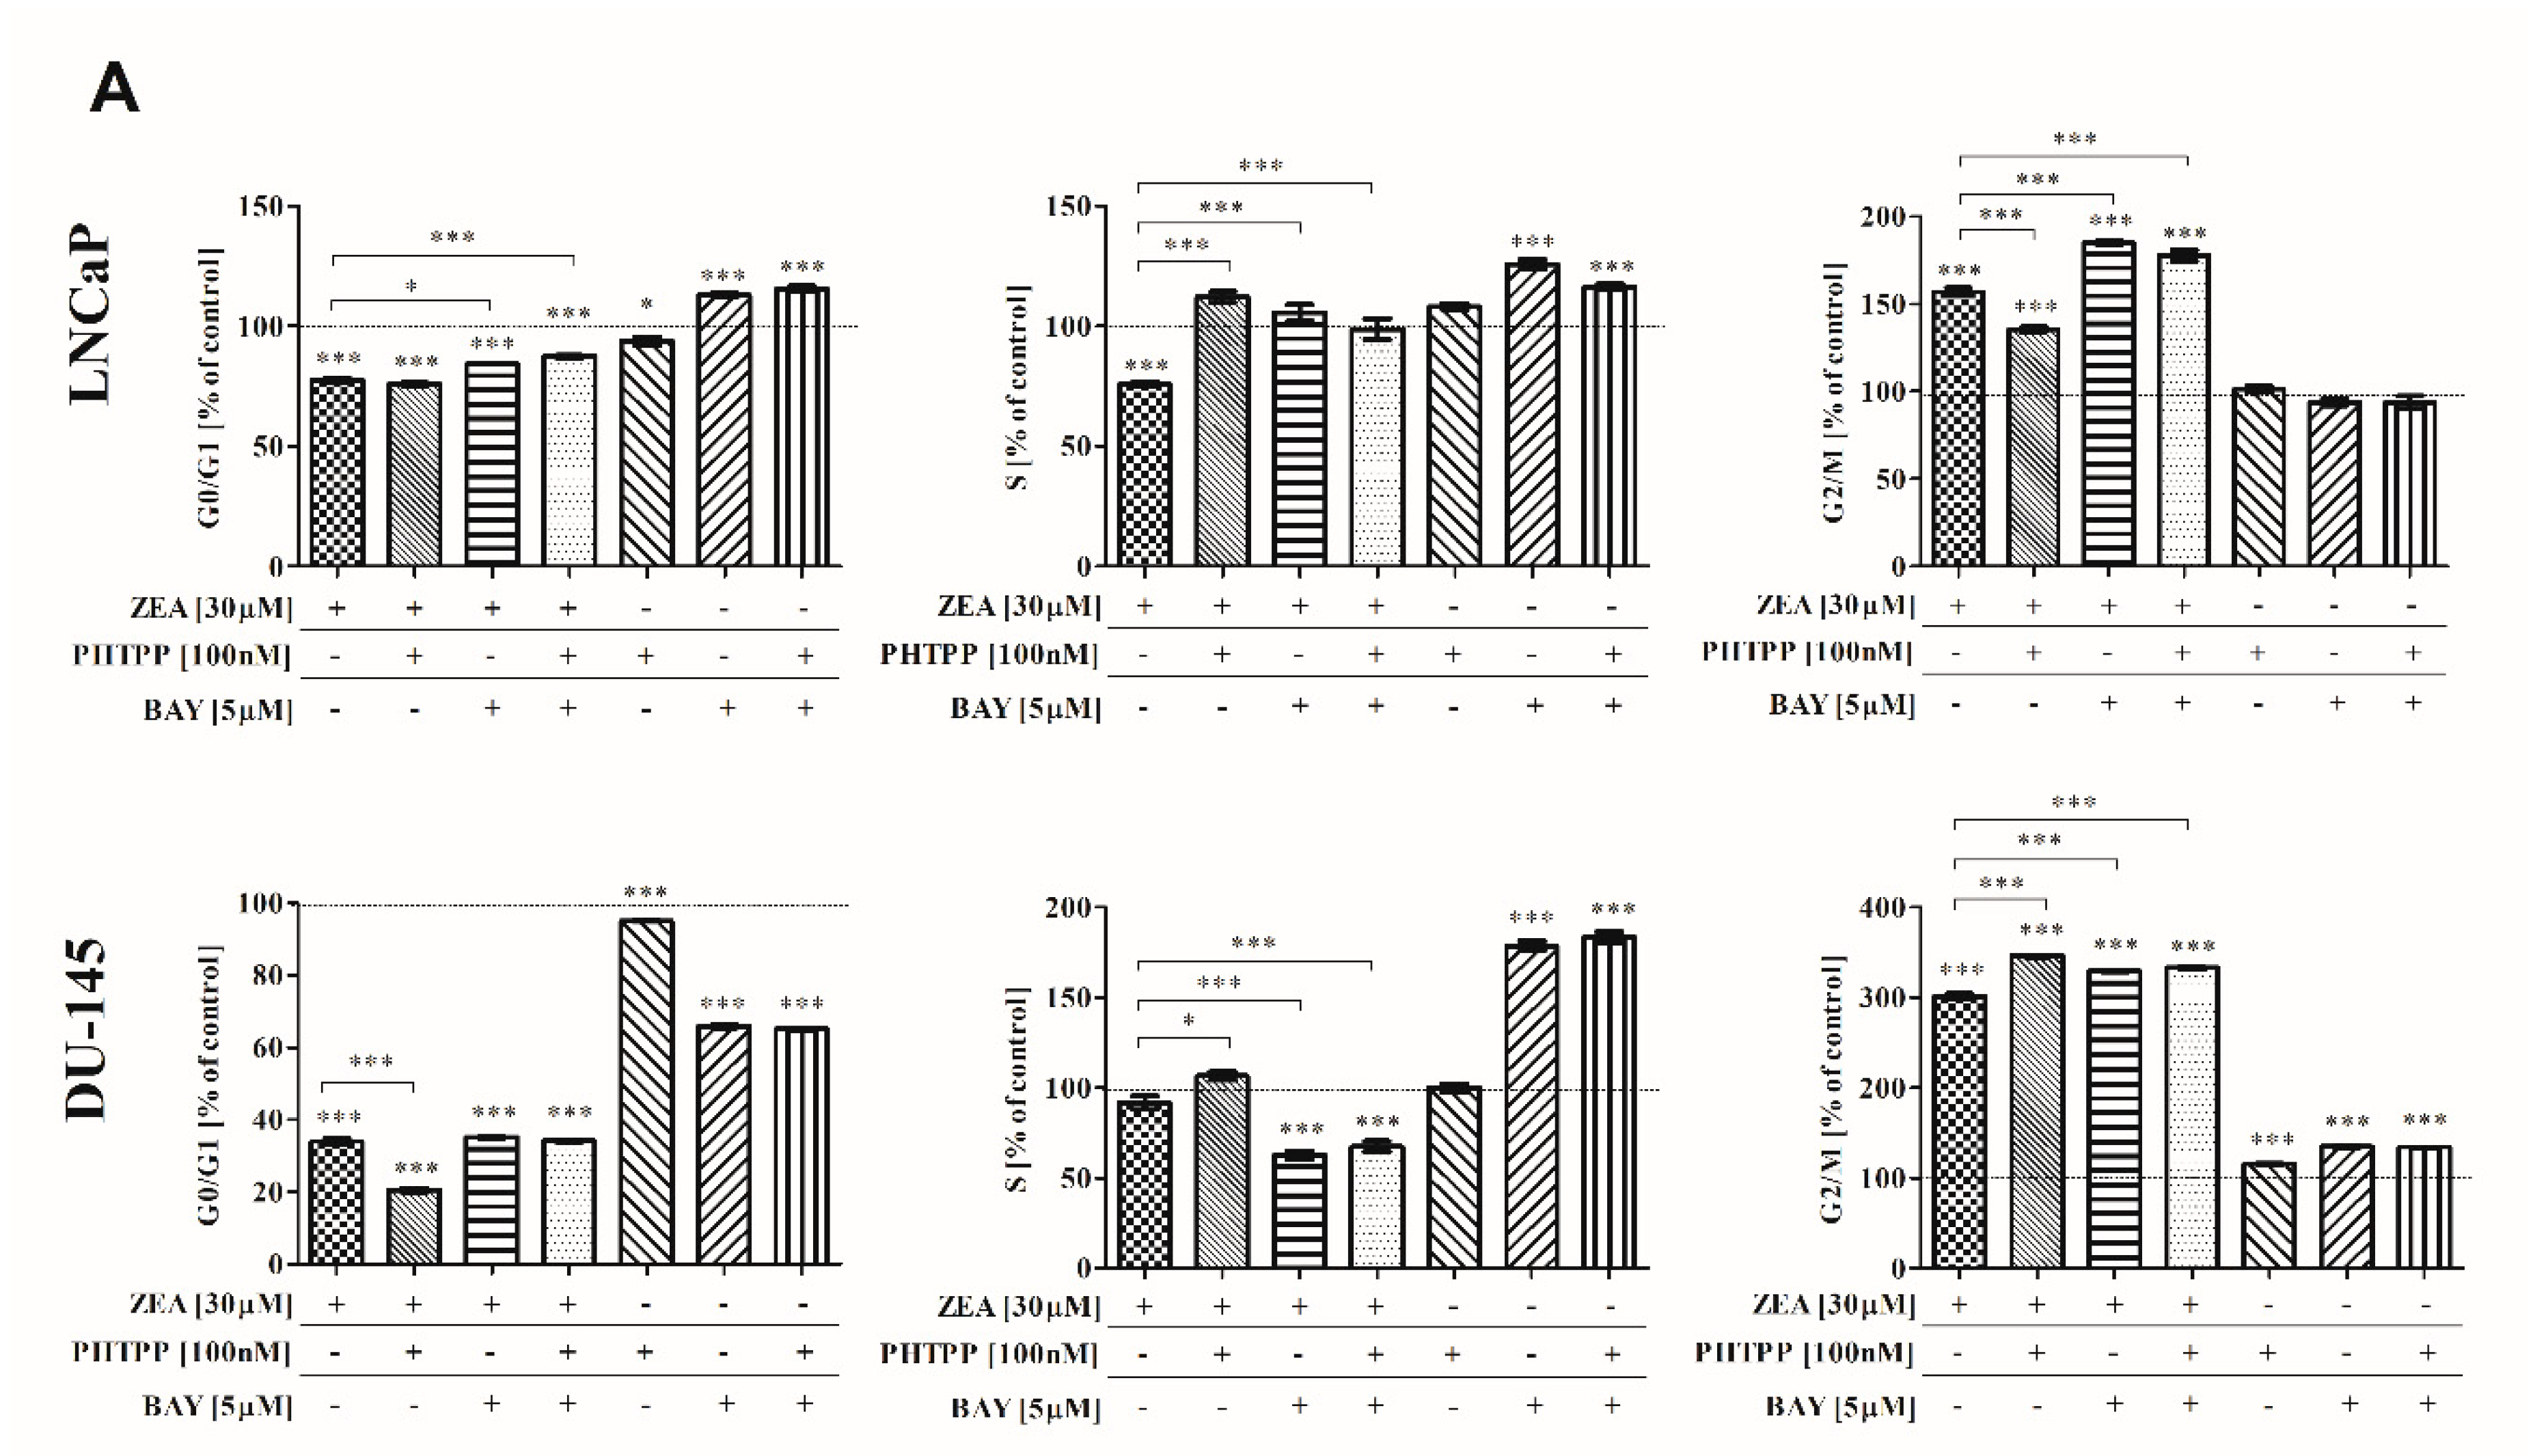
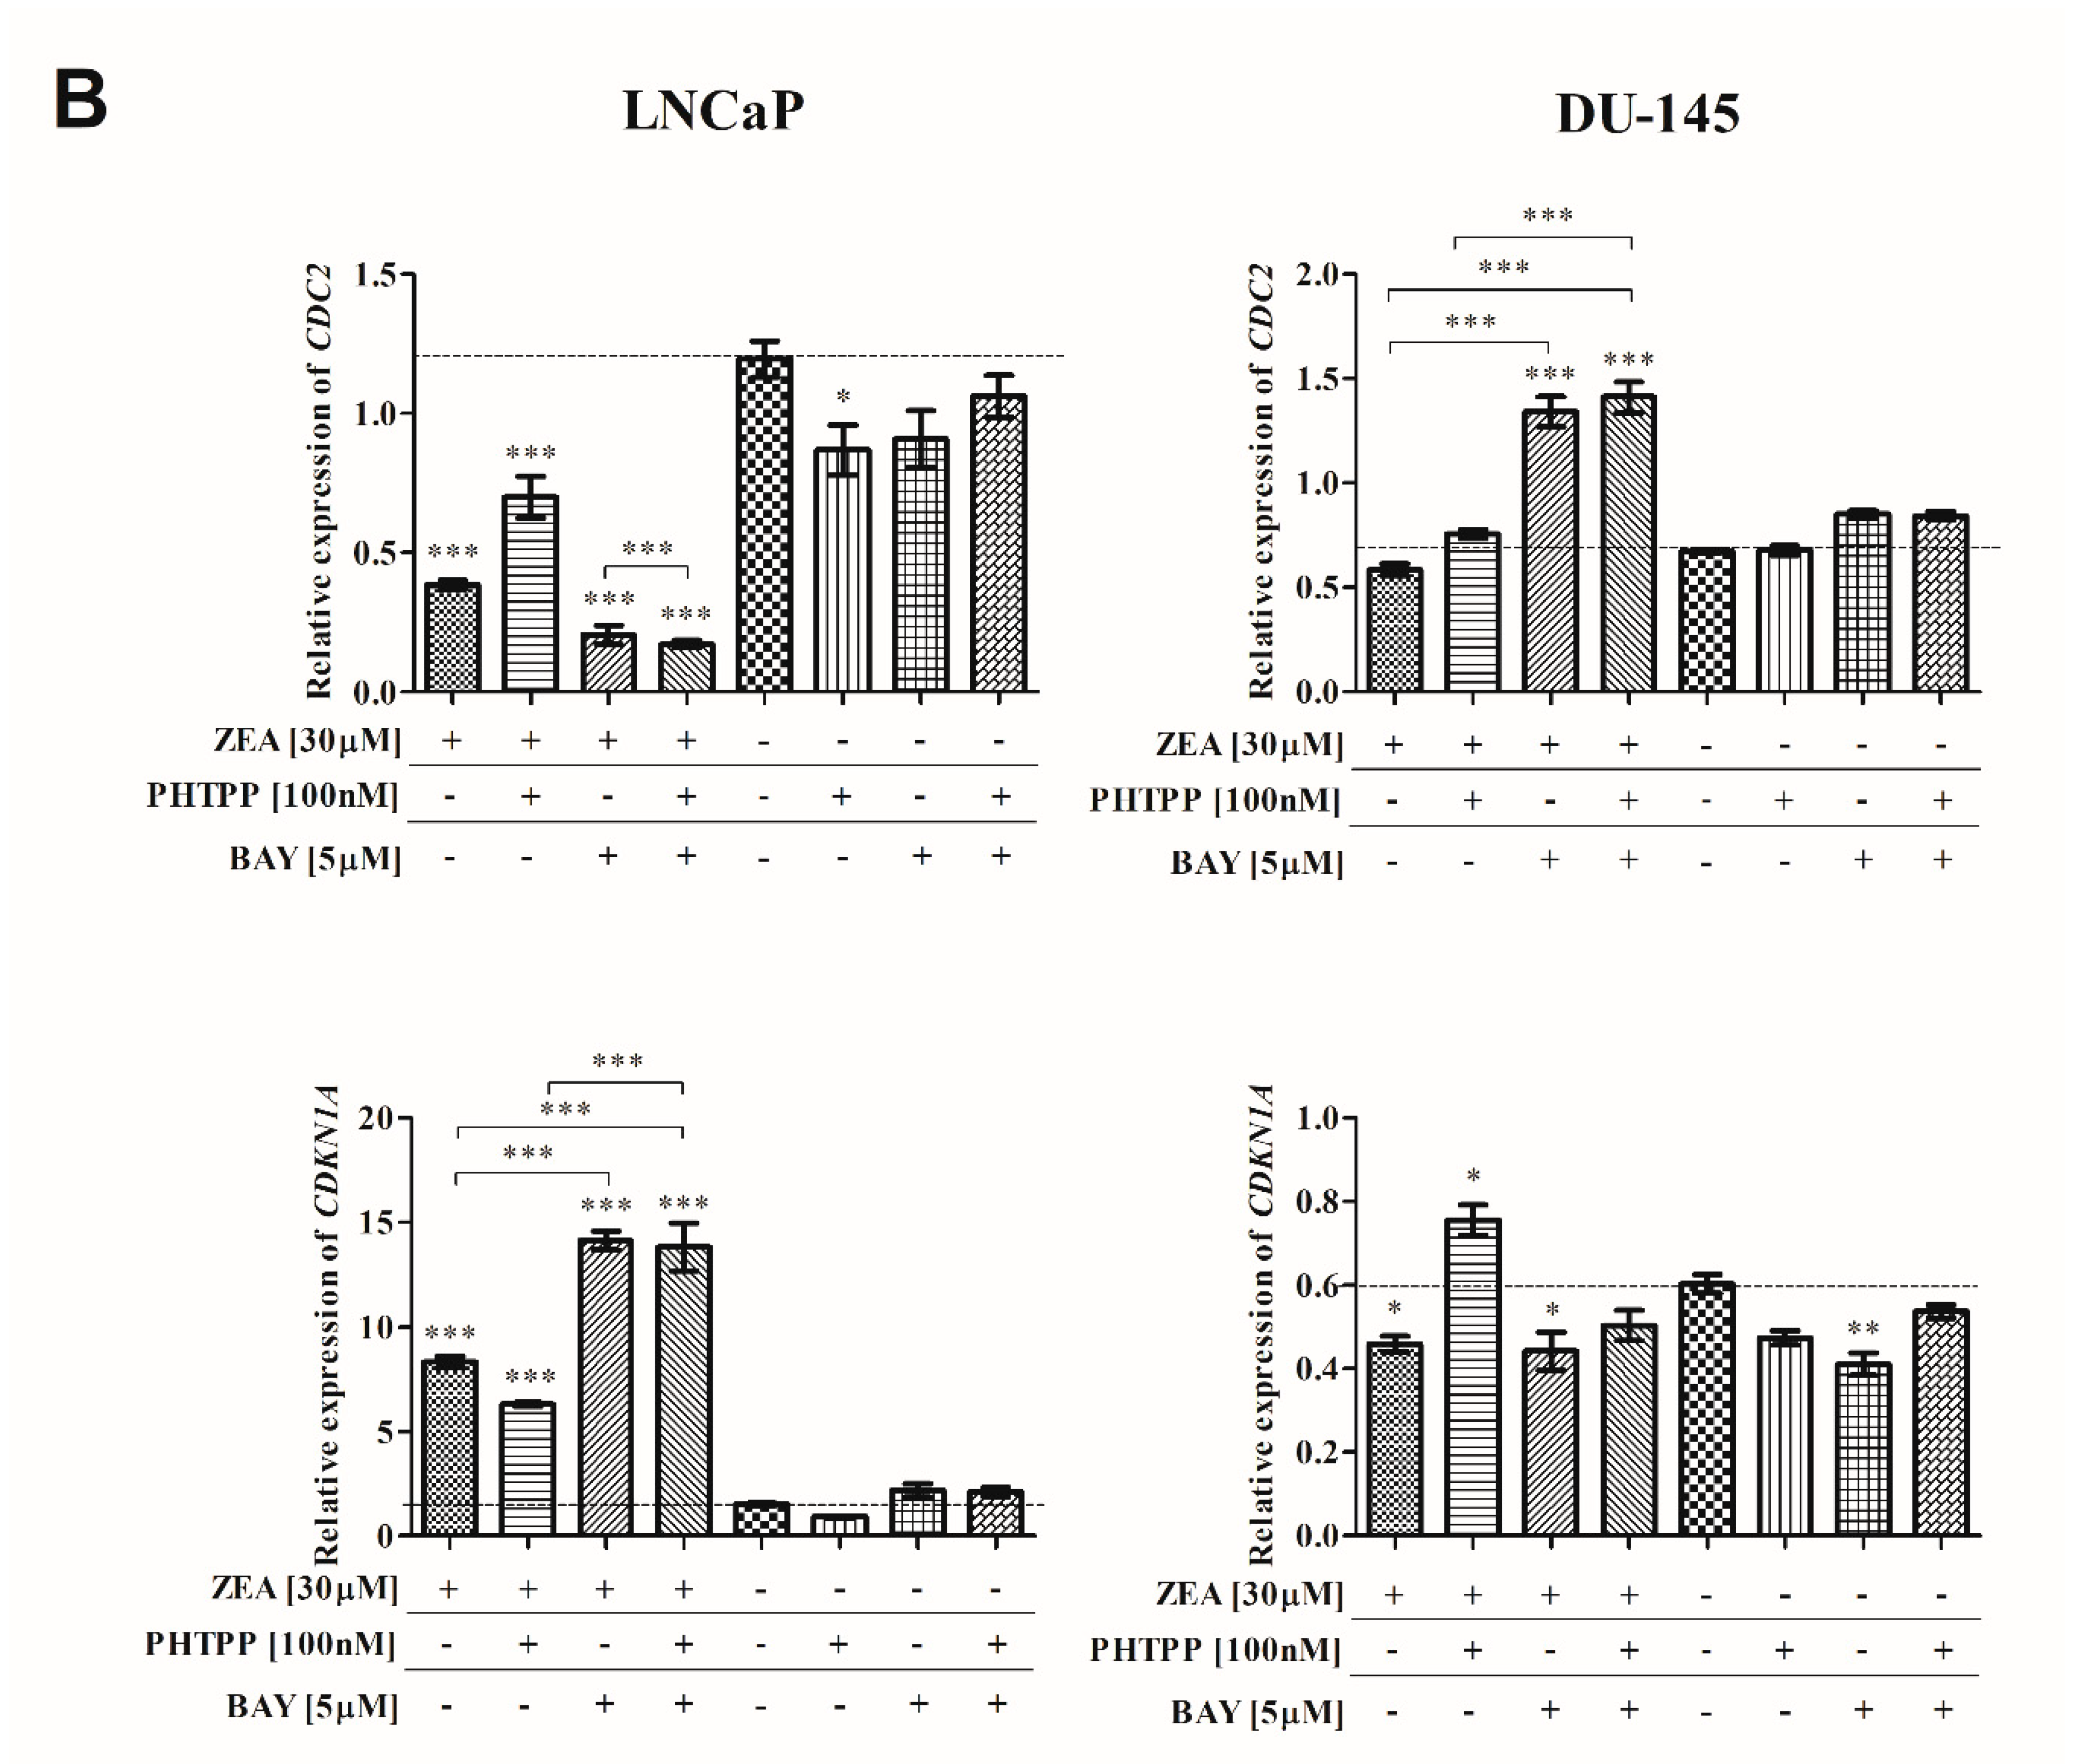
2.3. ZEA-Induced Cell Cycle Arrest in G2/M Cell Cycle Phase
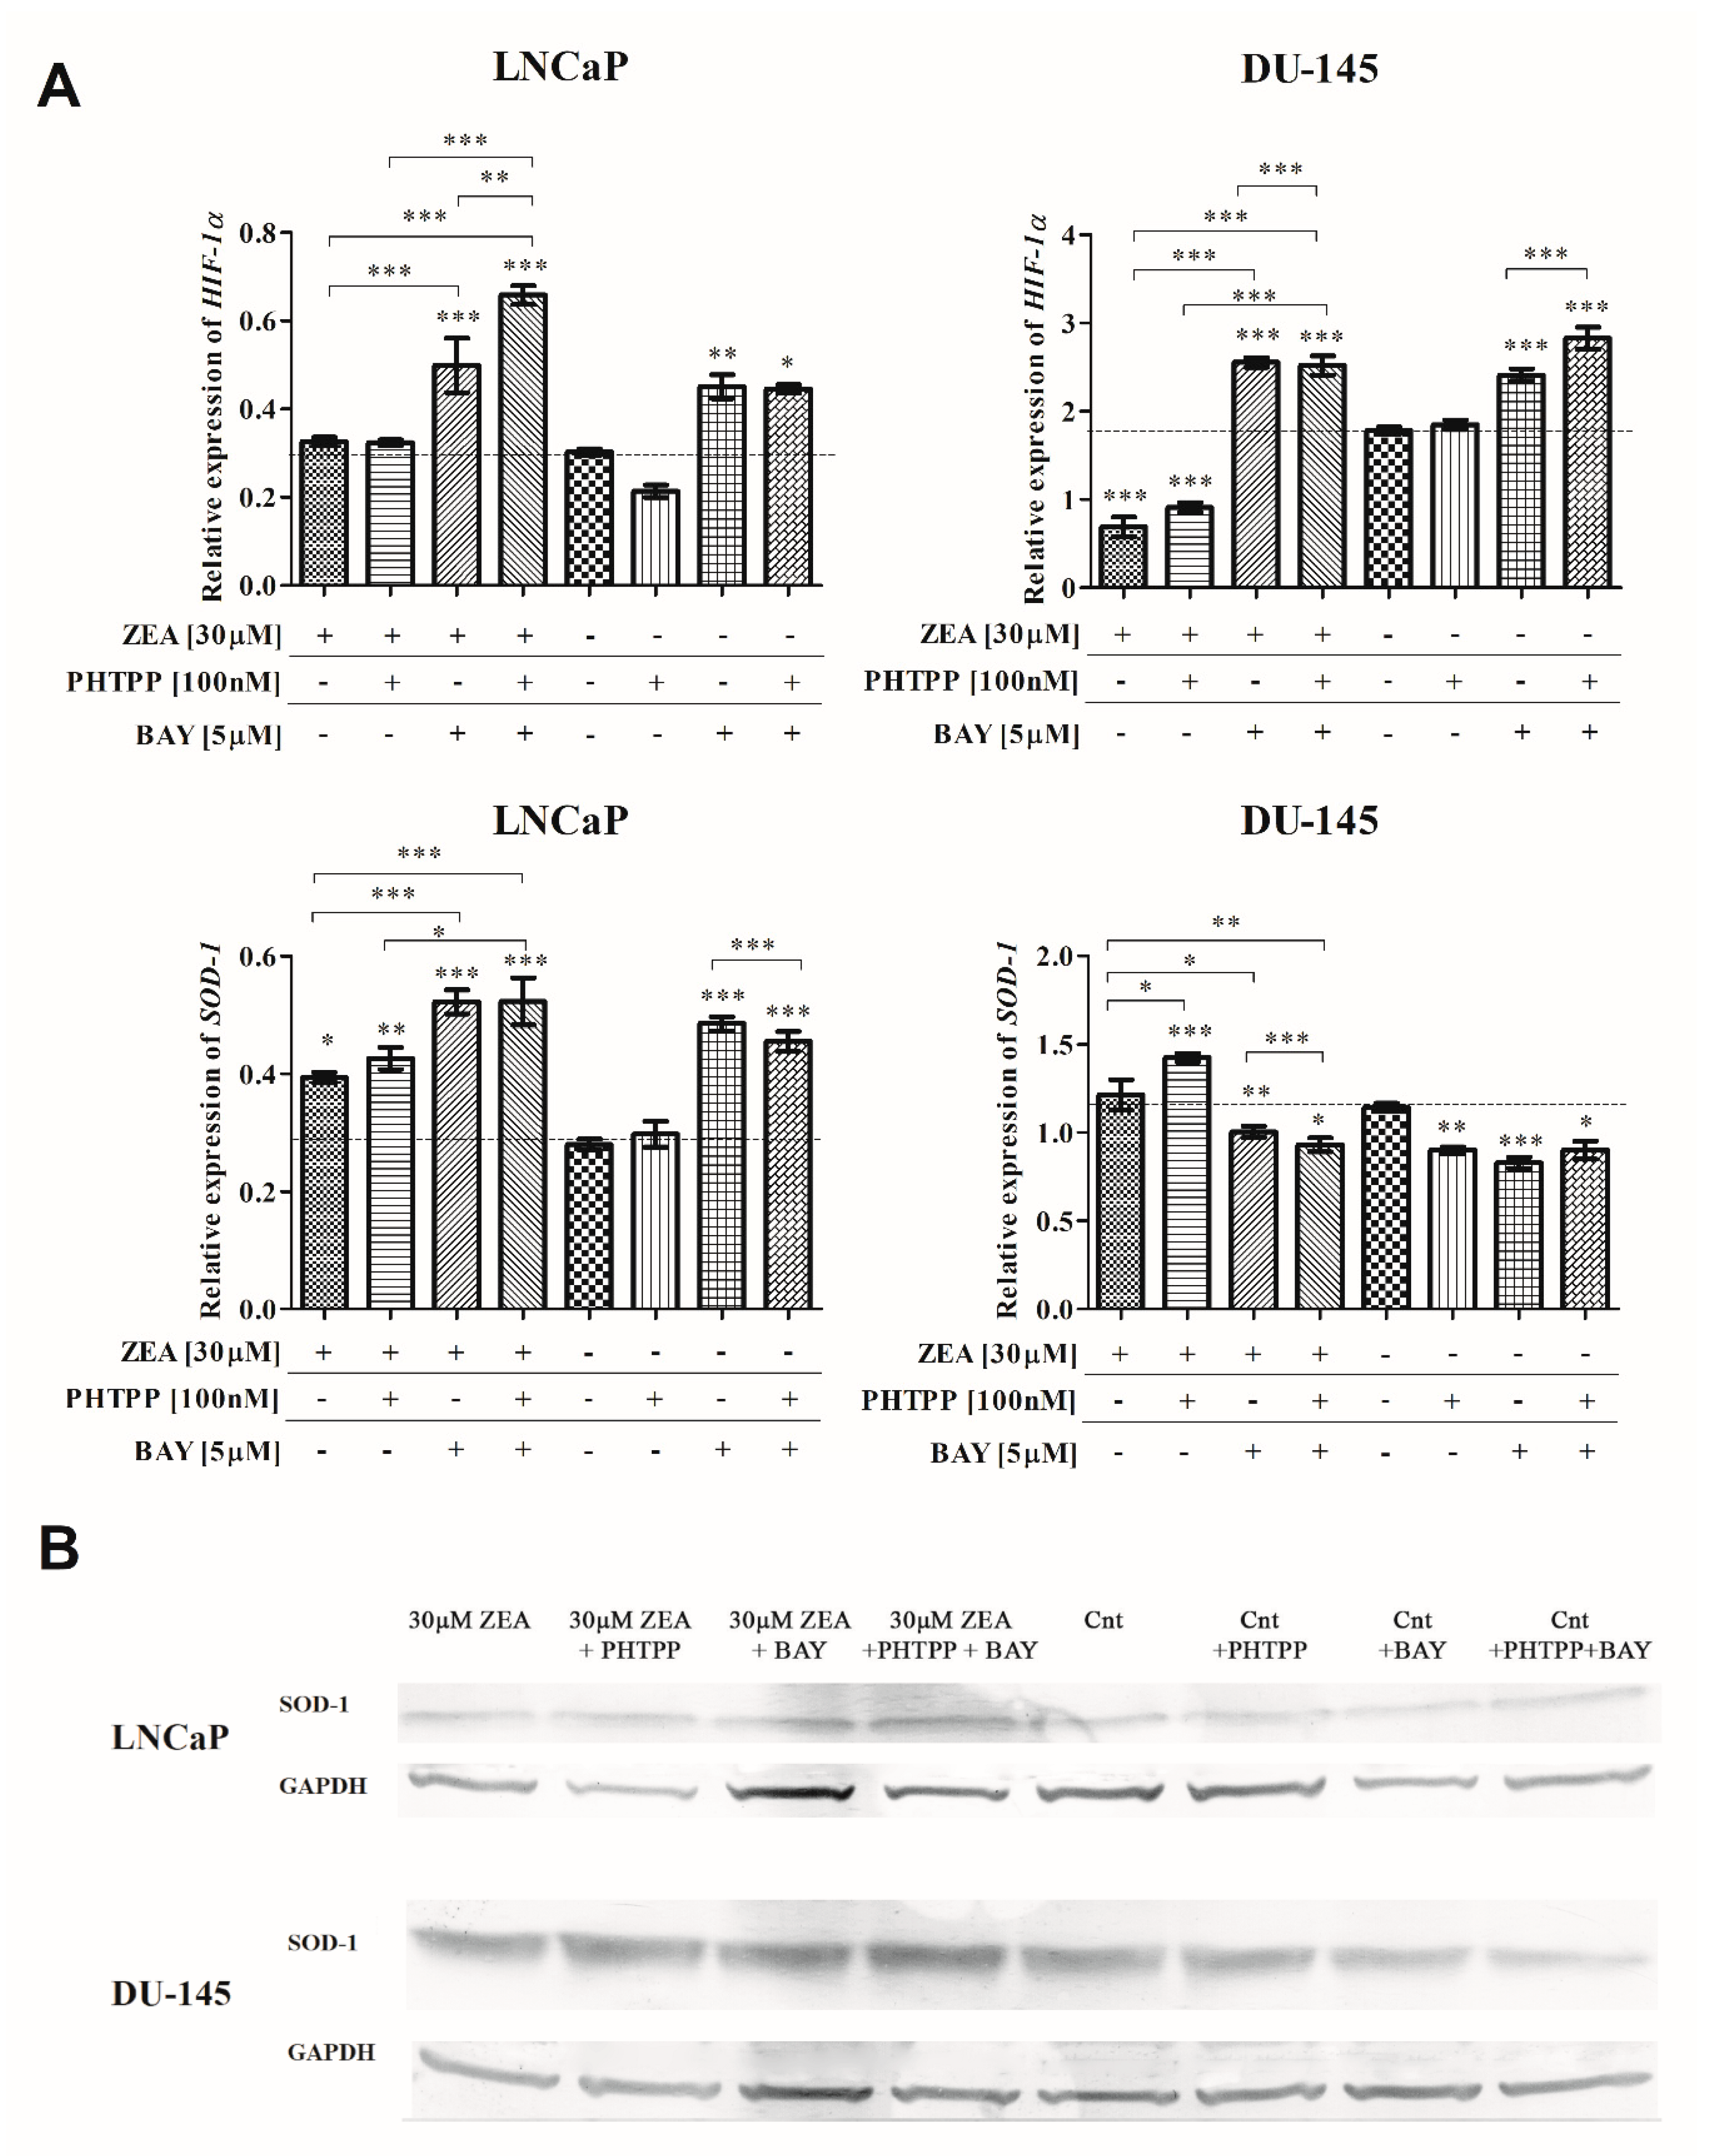
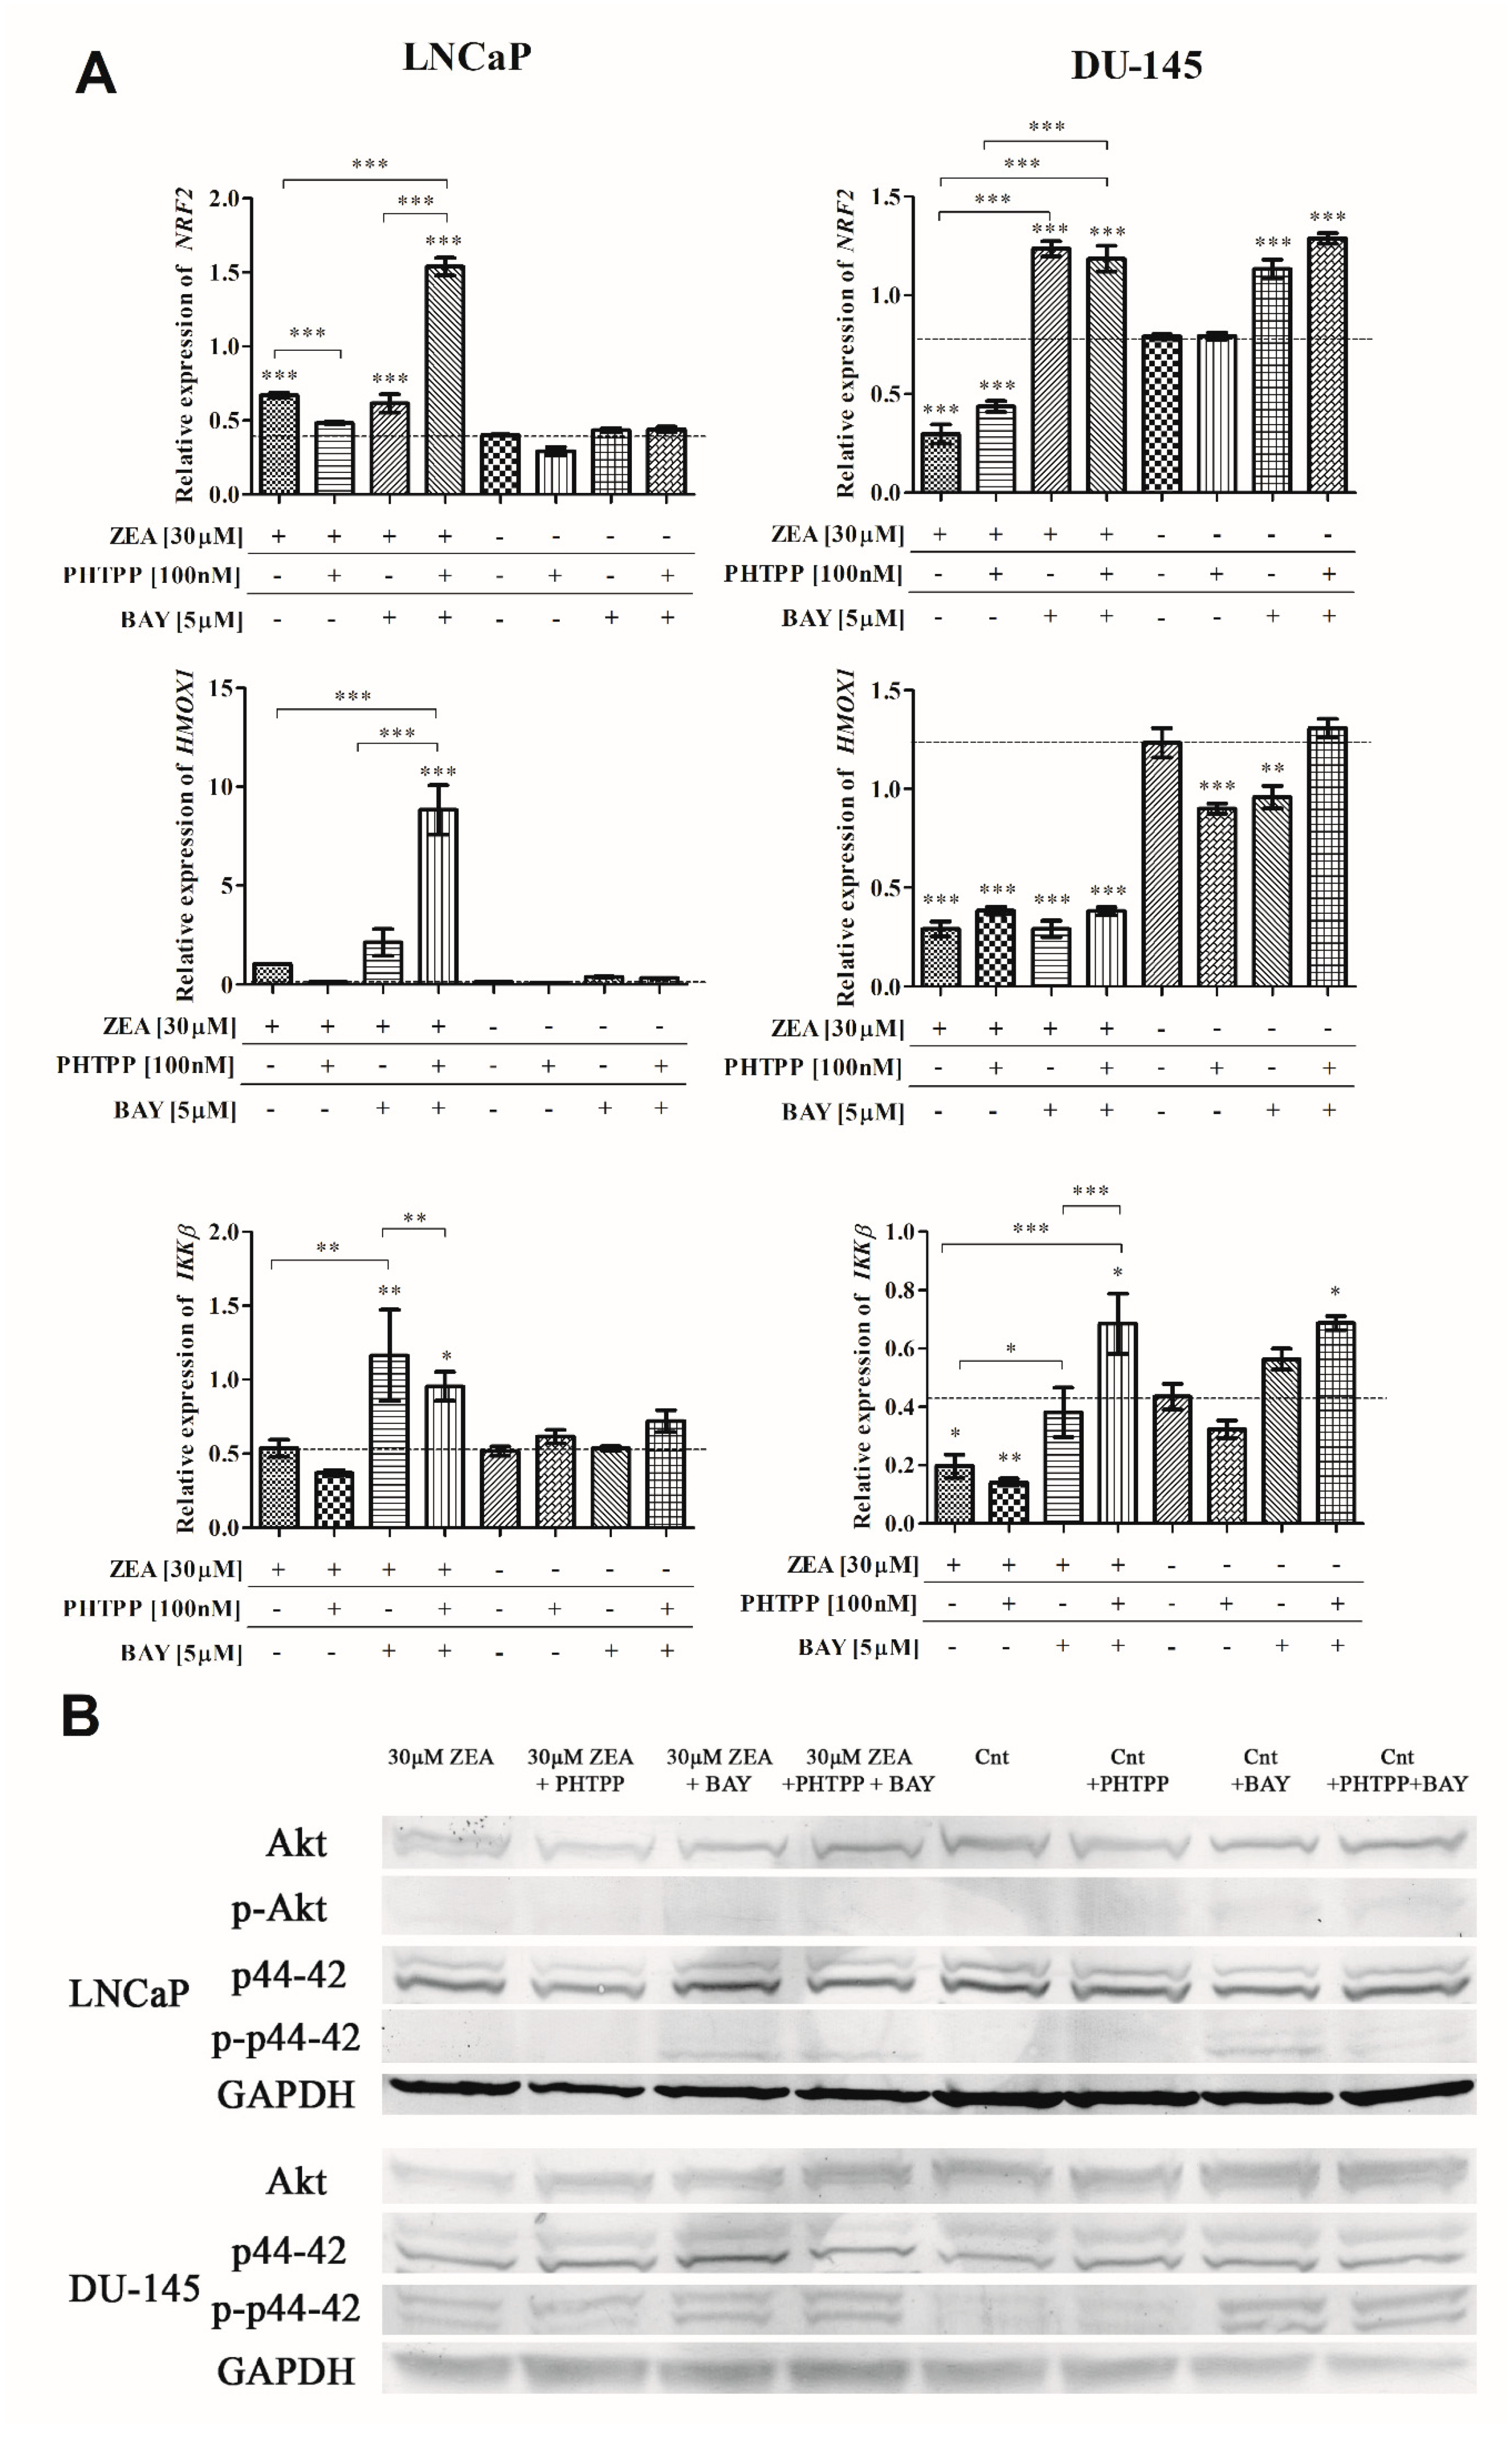
2.4. Nrf2 and NFΚB in ZEA-Induced Oxidative Stress
2.5. Akt and p44-42 Expression after ZEA Treatment
3. Discussion
4. Conclusions
5. Materials and Methods
5.1. Cell Culture
5.2. Cell Viability
5.3. Oxidative Stress
5.4. Cell Cycle
5.5. DNA Damage
5.6. Cell Nuclear Morphology—DAPI Staining
5.7. Real Time qPCR (RTqPCR)
5.8. Western Blot
5.9. Statistical Analysis
Author Contributions
Funding
Acknowledgments
Conflicts of Interest
Abbreviations
| NFΚB | Nuclear factor kappa-light-chain-enhancer of activated B cells |
| PCa | Prostate cancer |
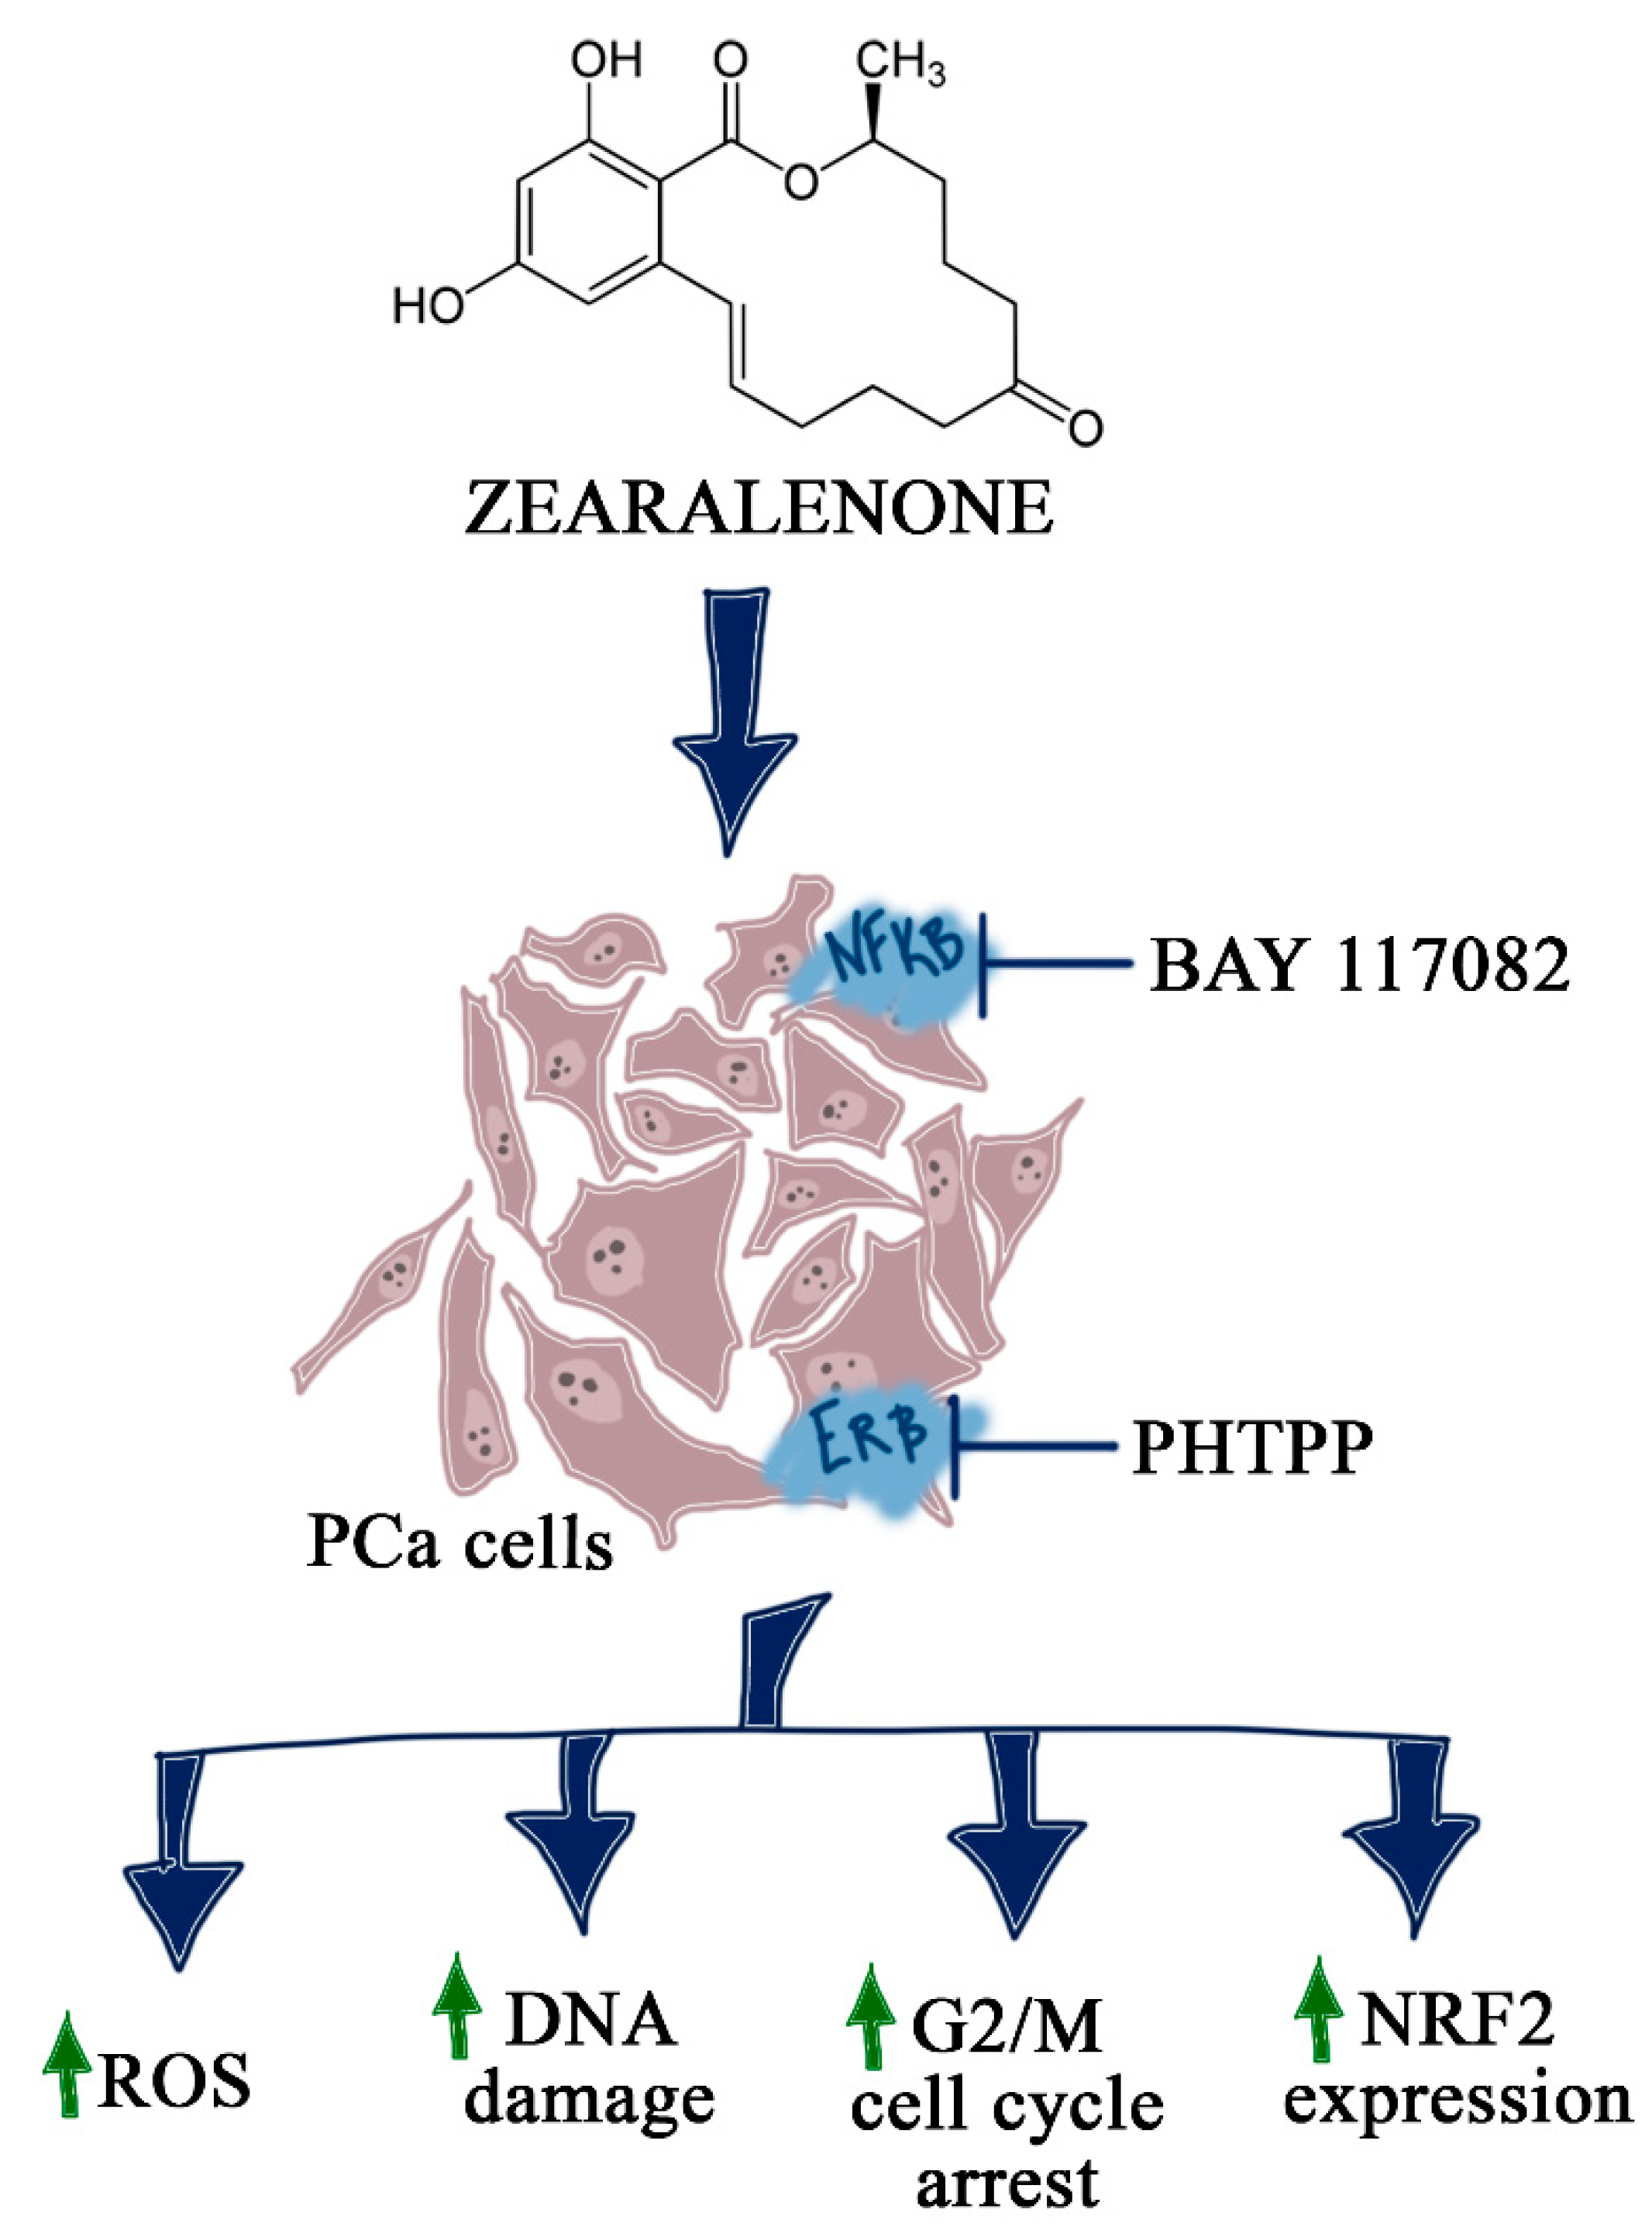
| ZEA | zearalenone |
| ERs | Estrogen receptors |
| ROS | Reactive oxygen species |
| HIF-1α | Hypoxia inducible factor 1 alpha |
| ERβ | Estrogen receptor β |
| AR | Androgen receptor |
| PHTPP | 2-Phenyl-3-(4-hydroxyphenyl)-5,7-bis(trifluoromethyl)-pyrazolo[1,5-a] pyrimidine |
| EACC | European Collection of Authenticated Cell Cultures |
| ATCC | American Type Culture Collection |
| FBS | Fetal Bovine Serum |
| PFA | Paraformaldehyde |
| SOD1 | Superoxide dismutase 1 |
| CDKN1A | Cyclin dependent kinase inhibitor 1A |
| CDC2 | Cyclin-dependent kinase 1 |
| NRF2 | Nuclear factor erythroid 2-related factor 2 |
| HMOX1 | Heme oxygenase 1 |
| IKKβ1 | Inhibitor of nuclear factor kappa B kinase subunit beta |
| RPS17 | Ribosomal protein S17 |
| RPLP0 | Ribosomal protein P0 |
| H3F3A | Histone H3.3A |
References
- Khurana, N.; Sikka, S. Targeting Crosstalk between Nrf-2, NF-κB and Androgen Receptor Signaling in Prostate Cancer. Cancers (Basel) 2018, 10, 352. [Google Scholar] [CrossRef] [Green Version]
- Miyata, Y.; Matsuo, T.; Sagara, Y.; Ohba, K.; Ohyama, K.; Sakai, H. A Mini-Review of Reactive Oxygen Species in Urological Cancer: Correlation with NADPH Oxidases, Angiogenesis, and Apoptosis. Int. J. Mol. Sci. 2017, 18, 2214. [Google Scholar] [CrossRef]
- Xia, Y.; Shen, S.; Verma, I.M. NF- B, an Active Player in Human Cancers. Cancer Immunol. Res. 2014, 2, 823–830. [Google Scholar] [CrossRef] [Green Version]
- Mak, P.; Li, J.; Samanta, S.; Mercurio, A.M. ERβ regulation of NF-kB activation in prostate cancer is mediated by HIF-1. Oncotarget 2015, 6, 40247–40254. [Google Scholar] [CrossRef] [PubMed] [Green Version]
- Sun, H.-Z.; Yang, T.-W.; Zang, W.-J.; Wu, S.-F. Dehydroepiandrosterone-induced proliferation of prostatic epithelial cell is mediated by NFKB via PI3K/AKT signaling pathway. J. Endocrinol. 2010, 204, 311–318. [Google Scholar] [CrossRef] [PubMed]
- Kowalska, K.; Habrowska-Górczyńska, D.E.; Piastowska-Ciesielska, A.W. Zearalenone as an endocrine disruptor in humans. Environ. Toxicol. Pharmacol. 2016, 48, 141–149. [Google Scholar] [CrossRef] [PubMed]
- Yip, K.Y.; Wan, M.L.Y.; Wong, A.S.T.; Korach, K.S.; El-Nezami, H. Combined low-dose zearalenone and aflatoxin B1 on cell growth and cell-cycle progression in breast cancer MCF-7 cells. Toxicol. Lett. 2017, 281, 139–151. [Google Scholar] [CrossRef] [Green Version]
- Zheng, W.; Wang, B.; Li, X.; Wang, T.; Zou, H.; Gu, J.; Yuan, Y.; Liu, X.; Bai, J.; Bian, J.; et al. Zearalenone Promotes Cell Proliferation or Causes Cell Death? Toxins (Basel) 2018, 10, 184. [Google Scholar] [CrossRef] [Green Version]
- Lin, P.; Chen, F.; Sun, J.; Zhou, J.; Wang, X.; Wang, N.; Li, X.; Zhang, Z.; Wang, A.; Jin, Y. Mycotoxin zearalenone induces apoptosis in mouse Leydig cells via an endoplasmic reticulum stress-dependent signalling pathway. Reprod. Toxicol. 2015, 52, 71–77. [Google Scholar] [CrossRef]
- Jakimiuk, E.; Gajecka, M.; Jana, B.; Brzuzan, P.; Zielonka, L.; Skorska-Wyszyńska, E.; Gajecki, M. Factors determining sensitivity of prepubertal gilts to hormonal influence of zearalenone. Pol. J. Vet. Sci. 2009, 12, 149–158. [Google Scholar]
- Wang, X.; Jiang, L.; Shi, L.; Yao, K.; Sun, X.; Yang, G.; Jiang, L.; Zhang, C.; Wang, N.; Zhang, H.; et al. Zearalenone induces NLRP3-dependent pyroptosis via activation of NF-κB modulated by autophagy in INS-1 cells. Toxicology 2019, 152304. [Google Scholar] [CrossRef] [PubMed]
- Kowalska, K.; Habrowska-Górczyńska, D.E.; Urbanek, K.A.; Domińska, K.; Sakowicz, A.; Piastowska-Ciesielska, A.W. Estrogen receptor β plays a protective role in zearalenone-induced oxidative stress in normal prostate epithelial cells. Ecotoxicol. Environ. Saf. 2019, 172, 504–513. [Google Scholar] [CrossRef] [PubMed]
- Mak, P.; Chang, C.; Pursell, B.; Mercurio, A.M. Estrogen receptor β sustains epithelial differentiation by regulating prolyl hydroxylase 2 transcription. Proc. Natl. Acad. Sci. USA 2013, 110, 4708–4713. [Google Scholar] [CrossRef] [PubMed] [Green Version]
- Sang, Y.; Li, W.; Zhang, G. The protective effect of resveratrol against cytotoxicity induced by mycotoxin, zearalenone. Food Funct. 2016, 7, 3703–3715. [Google Scholar] [CrossRef]
- Zheng, W.; Feng, N.; Wang, Y.; Noll, L.; Xu, S.; Liu, X.; Lu, N.; Zou, H.; Gu, J.; Yuan, Y.; et al. Effects of zearalenone and its derivatives on the synthesis and secretion of mammalian sex steroid hormones: A review. Food Chem. Toxicol. 2019, 126, 262–276. [Google Scholar] [CrossRef]
- Kowalska, K.; Habrowska-Górczyńska, D.E.; Domińska, K.; Piastowska-Ciesielska, A.W. The dose-dependent effect of zearalenone on mitochondrial metabolism, plasma membrane permeabilization and cell cycle in human prostate cancer cell lines. Chemosphere 2017, 180, 455–466. [Google Scholar] [CrossRef]
- Kowalska, K.; Habrowska-Górczyńska, D.; Urbanek, K.; Domińska, K.; Piastowska-Ciesielska, A. Estrogen Receptor α Is Crucial in Zearalenone-Induced Invasion and Migration of Prostate Cancer Cells. Toxins (Basel) 2018, 10, 98. [Google Scholar] [CrossRef] [Green Version]
- Wang, Y.-L.; Zhou, X.-Q.; Jiang, W.-D.; Wu, P.; Liu, Y.; Jiang, J.; Wang, S.-W.; Kuang, S.-Y.; Tang, L.; Feng, L. Effects of Dietary Zearalenone on Oxidative Stress, Cell Apoptosis, and Tight Junction in the Intestine of Juvenile Grass Carp (Ctenopharyngodon idella). Toxins (Basel) 2019, 11, 333. [Google Scholar] [CrossRef] [Green Version]
- Shen, T.; Miao, Y.; Ding, C.; Fan, W.; Liu, S.; Lv, Y.; Gao, X.; De Boevre, M.; Yan, L.; Okoth, S.; et al. Activation of the p38/MAPK pathway regulates autophagy in response to the CYPOR-dependent oxidative stress induced by zearalenone in porcine intestinal epithelial cells. Food Chem. Toxicol. 2019, 131, 110527. [Google Scholar] [CrossRef]
- Cao, H.; Zhi, Y.; Xu, H.; Fang, H.; Jia, X. Zearalenone causes embryotoxicity and induces oxidative stress and apoptosis in differentiated human embryonic stem cells. Toxicol. Vitr. 2019, 54, 243–250. [Google Scholar] [CrossRef]
- Wang, N.; Li, P.; Wang, M.; Chen, S.; Huang, S.; Long, M.; Yang, S.; He, J. The Protective Role of Bacillus velezensis A2 on the Biochemical and Hepatic Toxicity of Zearalenone in Mice. Toxins (Basel) 2018, 10, 449. [Google Scholar] [CrossRef] [Green Version]
- Abid-Essefi, S.; Baudrimont, I.; Hassen, W.; Ouanes, Z.; Mobio, T.A.; Anane, R.; Creppy, E.E.; Bacha, H. DNA fragmentation, apoptosis and cell cycle arrest induced by zearalenone in cultured DOK, Vero and Caco-2 cells: Prevention by Vitamin E. Toxicology 2003, 192, 237–248. [Google Scholar] [CrossRef]
- Zheng, W.-L.; Wang, B.-J.; Wang, L.; Shan, Y.-P.; Zou, H.; Song, R.-L.; Wang, T.; Gu, J.-H.; Yuan, Y.; Liu, X.-Z.; et al. ROS-Mediated Cell Cycle Arrest and Apoptosis Induced by Zearalenone in Mouse Sertoli Cells via ER Stress and the ATP/AMPK Pathway. Toxins (Basel) 2018, 10, 24. [Google Scholar] [CrossRef] [PubMed] [Green Version]
- Wang, B.; Zheng, W.; Feng, N.; Wang, T.; Zou, H.; Gu, J.; Yuan, Y.; Liu, X.; Liu, Z.; Bian, J. The Effects of Autophagy and PI3K/AKT/m-TOR Signaling Pathway on the Cell-Cycle Arrest of Rats Primary Sertoli Cells Induced by Zearalenone. Toxins (Basel) 2018, 10, 398. [Google Scholar] [CrossRef] [PubMed]
- Zheng, W.; Wang, B.; Si, M.; Zou, H.; Song, R.; Gu, J.; Yuan, Y.; Liu, X.; Zhu, G.; Bai, J.; et al. Zearalenone altered the cytoskeletal structure via ER stress- autophagy- oxidative stress pathway in mouse TM4 Sertoli cells. Sci. Rep. 2018, 8, 3320. [Google Scholar] [CrossRef] [PubMed]
- Lim, W.; Park, S.; Bazer, F.W.; Song, G. Naringenin-Induced Apoptotic Cell Death in Prostate Cancer Cells Is Mediated via the PI3K/AKT and MAPK Signaling Pathways. J. Cell. Biochem. 2017, 118, 1118–1131. [Google Scholar] [CrossRef]
- Dey, P.; Ström, A.; Gustafsson, J.-Å. Estrogen receptor β upregulates FOXO3a and causes induction of apoptosis through PUMA in prostate cancer. Oncogene 2014, 33, 4213–4225. [Google Scholar] [CrossRef] [Green Version]
- Nelson, A.W.; Tilley, W.D.; Neal, D.E.; Carroll, J.S. Estrogen receptor beta in prostate cancer: Friend or foe? Endocr. Relat. Cancer 2014, 21, T219–T234. [Google Scholar] [CrossRef] [Green Version]
- He, J.; Wei, C.; Li, Y.; Liu, Y.; Wang, Y.; Pan, J.; Liu, J.; Wu, Y.; Cui, S. Zearalenone and alpha-zearalenol inhibit the synthesis and secretion of pig follicle stimulating hormone via the non-classical estrogen membrane receptor GPR30. Mol. Cell. Endocrinol. 2018, 461, 43–54. [Google Scholar] [CrossRef]
- Nakamura, U.; Kadokawa, H. The nonsteroidal mycoestrogen zearalenone and its five metabolites suppress LH secretion from the bovine anterior pituitary cells via the estradiol receptor GPR30 in vitro. Theriogenology 2015, 84, 1342–1349. [Google Scholar] [CrossRef]
- Zhu, L.; Xue, L. Kaempferol Suppresses Proliferation and Induces Cell Cycle Arrest, Apoptosis, and DNA Damage in Breast Cancer Cells. Oncol. Res. Featur. Preclin. Clin. Cancer Ther. 2019, 27, 629–634. [Google Scholar] [CrossRef] [PubMed]
- Wang, M.; Wu, W.; Li, L.; He, J.; Huang, S.; Chen, S.; Chen, J.; Long, M.; Yang, S.; Li, P. Analysis of the miRNA Expression Profiles in the Zearalenone-Exposed TM3 Leydig Cell Line. Int. J. Mol. Sci. Artic. 2019, 20, 635. [Google Scholar] [CrossRef] [PubMed] [Green Version]
- Kong, C.; Hao, M.; Chen, X.; Zhao, X.; Wang, Y.; Li, J.; Gao, Y.; Zhang, H.; Yang, B.; Jiang, J. NF-κB inhibition promotes apoptosis in androgen-independent prostate cancer cells by the photothermal effect via the IκBα/AR signaling pathway. Biomater. Sci. 2019, 7, 2559–2570. [Google Scholar] [CrossRef] [PubMed]
- Nunes, J.J.; Pandey, S.K.; Yadav, A.; Goel, S.; Ateeq, B. Targeting NF-kappa B Signaling by Artesunate Restores Sensitivity of Castrate-Resistant Prostate Cancer Cells to Antiandrogens. Neoplasia 2017, 19, 333–345. [Google Scholar] [CrossRef] [PubMed]
- Van Uden, P.; Kenneth, N.S.; Rocha, S. Regulation of hypoxia-inducible factor-1alpha by NF-kappaB. Biochem. J. 2008, 412, 477–484. [Google Scholar] [CrossRef] [PubMed] [Green Version]
- Ravenna, L.; Principessa, L.; Verdina, A.; Salvatori, L.; Russo, M.A.; Petrangeli, E. Distinct phenotypes of human prostate cancer cells associate with different adaptation to hypoxia and pro-inflammatory gene expression. PLoS ONE 2014, 9, e96250. [Google Scholar] [CrossRef]
- Ismail, A.H.; Lessard, L.; Mes-Masson, A.M.; Saad, F. Expression of NF-κB in Prostate Cancer Lymph Node Metastases. Prostate 2004, 58, 308–313. [Google Scholar] [CrossRef]
- Cheng, Q.; Jiang, S.; Huang, L.; Ge, J.; Wang, Y.; Yang, W. Zearalenone induced oxidative stress in the jejunum in postweaning gilts through modulation of the Keap1–Nrf2 signaling pathway and relevant genes. J. Anim. Sci. 2019, 97, 1722–1733. [Google Scholar] [CrossRef]
- Long, M.; Yang, S.-H.; Shi, W.; Li, P.; Guo, Y.; Guo, J.; He, J.-B.; Zhang, Y. Protective effect of proanthocyanidin on mice Sertoli cell apoptosis induced by zearalenone via the Nrf2/ARE signalling pathway. Environ. Sci. Pollut. Res. 2017, 24, 26724–26733. [Google Scholar] [CrossRef]
- Takahashi, Y.; Perkins, S.N.; Hursting, S.D.; Wang, T.T.Y. 17β-estradiol differentially regulates androgen-responsive genes through estrogen receptor-β- and extracellular-signal regulated kinase-dependent pathways in LNCaP human prostate cancer cells. Mol. Carcinog. 2007, 46, 117–129. [Google Scholar] [CrossRef]


| Treatment | Relative Expression of SOD-1 [Fold Change] |
|---|---|
| LNCaP | |
| 30 µM ZEA | 0.82 |
| 30 µM ZEA + PHTPP | 0.80 |
| 30 µM ZEA + BAY | 0.92 |
| 30 µM ZEA + PHTPP + BAY | 0.99 |
| Cnt | 1.00 |
| Cnt + PHTPP | 0.96 |
| Cnt + BAY | 0.93 |
| Cnt + PHTPP + BAY | 0.80 |
| DU-145 | |
| 30 µM ZEA | 0.75 |
| 30 µM ZEA + PHTPP | 0.91 |
| 30 µM ZEA + BAY | 0.63 |
| 30 µM ZEA + PHTPP + BAY | 1.32 |
| Cnt | 1.00 |
| Cnt + PHTPP | 0.84 |
| Cnt + BAY | 0.59 |
| Cnt + PHTPP + BAY | 0.57 |
| Treatment | Relative Expression of Akt [Fold Change] | Relative Expression of p-Akt [Fold Change] | Relative Expression of p44–42 [Fold Change] | Relative Expression of p-p44–42 [Fold Change] |
|---|---|---|---|---|
| LNCaP | ||||
| 30 µM ZEA | 1.09 | 0.99 | 1.03 | 0.89 |
| 30 µM ZEA + PHTPP | 1.11 | 1.43 | 1.05 | 0.99 |
| 30 µM ZEA + BAY | 1.35 | 1.66 | 1.03 | 0.94 |
| 30 µM ZEA + PHTPP + BAY | 0.94 | 1.21 | 1.00 | 0.94 |
| Cnt | 1.00 | 1.00 | 1.00 | 1.00 |
| Cnt + PHTPP | 1.18 | 1.48 | 1.02 | 1.00 |
| Cnt + BAY | 1.08 | 1.12 | 1.04 | 0.94 |
| Cnt + PHTPP + BAY | 1.19 | 1.10 | 1.00 | 0.65 |
| DU-145 | ||||
| 30 µM ZEA | 0.75 | n.d. | 1.03 | 0.72 |
| 30 µM ZEA + PHTPP | 0.91 | n.d. | 1.03 | 0.65 |
| 30 µM ZEA + BAY | 0.63 | n.d. | 0.91 | 1.26 |
| 30 µM ZEA + PHTPP + BAY | 1.32 | n.d. | 0.91 | 1.07 |
| Cnt | 1.00 | n.d. | 1.00 | 1.00 |
| Cnt + PHTPP | 0.84 | n.d. | 1.04 | 0.94 |
| Cnt +++ BAY | 0.59 | n.d. | 0.95 | 0.97 |
| Cnt + PHTPP + BAY | 0.57 | n.d. | 1.20 | 0.73 |
| Gene | Sequence (5′–3′) | Product Size [bp] |
|---|---|---|
| HIF-1α | TTACTCATCCATGTGACCATGA AGTTCTTCCTCGGCTAGTTAG | 140 |
| SOD-1 | GCGTGGCCTAGCGAGTTAT ACACCTTCACTGGTCCATTACT | 114 |
| CDKN1A | GACAGATTTCTACCACTCCAA CTGAGACTAAGGCAGAAGAGT | 134 |
| CDC2 | TTTTCAGAGCTTTGGGCACT AGGCTTCCTGGTTTCCATTT | 100 |
| NRF2 | GTCACATCGAGAGCCCAGTC ACCATGGTAGTCTCAACCAGC | 193 |
| HMOX1 | CAGCTCCTGCAACTCCTCAAA TTCTTCACCTTCCCCAACATTG | 165 |
| IKKβ | ATCCCCGATAAGCCTGCCA CTTGGGCTCTTGAAGGATACA | 171 |
| RPS17 | AAGCGCGTGTGCGAGGAGATCG TCGCTTCATCAGATGCGTGACATAACCTG | 87 |
| RPLP0 | ACGGATTACACCTTCCCACTTGCTAAAAGGTC AGCCACAAAGGCAGATGGATCAGCCAAG | 69 |
| H3F3A | AGGACTTTAAAAGATCTGCGCTTCCAGAG ACCAGATAGGCCTCACTTGCCTCCTGC | 74 |
© 2020 by the authors. Licensee MDPI, Basel, Switzerland. This article is an open access article distributed under the terms and conditions of the Creative Commons Attribution (CC BY) license (http://creativecommons.org/licenses/by/4.0/).
Share and Cite
Kowalska, K.; Habrowska-Górczyńska, D.E.; Domińska, K.; Urbanek, K.A.; Piastowska-Ciesielska, A.W. ERβ and NFκB—Modulators of Zearalenone-Induced Oxidative Stress in Human Prostate Cancer Cells. Toxins 2020, 12, 199. https://0-doi-org.brum.beds.ac.uk/10.3390/toxins12030199
Kowalska K, Habrowska-Górczyńska DE, Domińska K, Urbanek KA, Piastowska-Ciesielska AW. ERβ and NFκB—Modulators of Zearalenone-Induced Oxidative Stress in Human Prostate Cancer Cells. Toxins. 2020; 12(3):199. https://0-doi-org.brum.beds.ac.uk/10.3390/toxins12030199
Chicago/Turabian StyleKowalska, Karolina, Dominika Ewa Habrowska-Górczyńska, Kamila Domińska, Kinga Anna Urbanek, and Agnieszka Wanda Piastowska-Ciesielska. 2020. "ERβ and NFκB—Modulators of Zearalenone-Induced Oxidative Stress in Human Prostate Cancer Cells" Toxins 12, no. 3: 199. https://0-doi-org.brum.beds.ac.uk/10.3390/toxins12030199