Article

Natural Occurrence of Deoxynivalenol and Its Acetylated Derivatives in Chinese Maize and Wheat Collected in 2017

1
Key Laboratory for Deep Processing of Major Grain and Oil of Ministry of Education, College of Food Science and Engineering, Wuhan Polytechnic University, Wuhan 430023, China
2
Key Laboratory of Food Safety Risk Assessment, Ministry of Health, China National Centre for Food Safety Risk Assessment, Beijing 100021, China
*
Author to whom correspondence should be addressed.
Submission received: 10 February 2020 / Revised: 10 March 2020 / Accepted: 20 March 2020 / Published: 22 March 2020

Abstract

:
Deoxynivalenol (DON), along with 3-acetyl-deoxynivalenol (3-ADON) and 15-acetyl-deoxynivalenol (15-ADON), occur in grains and cereal products and is often hazardous to humans and livestock. In this study, 579 wheat samples and 606 maize samples intended for consumption were collected from China in 2017 and analyzed to determine the co-occurrence of type-B trichothecenes (DON, 3-ADON, and 15-ADON). All the wheat samples tested positive for DON, while 99.83% of the maize samples were DON-positive with mean DON concentrations of 165.87 and 175.30 μg/kg, respectively. Per the Chinese standard limits for DON, 3.63% of wheat and 2.97% of the maize samples were above the maximum limit of 1000 μg/kg. The DON derivatives (3-ADON and 15-ADON) were less frequently found and were present at lower levels than DON in wheat. 3-ADON and 15-ADON had incidences of 13.53% and 76.40%, respectively, in maize. By analyzing the distribution ratio of DON and its derivatives in wheat and maize, DON (95.51%) was the predominant toxin detected in wheat samples, followed by 3.97% for the combination of DON + 3-ADON, while DON + 3-ADON + 15-ADON and DON + 15-ADON were only found in 0.17% and 0.35% of wheat samples, respectively. Additionally, a large amount of the maize samples were contaminated with DON + 15-ADON (64.19%) and DON (22.11%). The samples with a combination of DON + 3-ADON and DON + 3-ADON + 15-ADON accounted for 1.32% and 12.21%, respectively. Only one maize sample did not contain all three mycotoxins. Our study shows the necessity of raising awareness of the co-occurrence of mycotoxin contamination in grains from China to protect consumers from the risk of exposure to DON and its derivatives.
Key Contribution: DON is the predominant toxin detected in wheat and maize samples. DON derivatives (3-ADON, 15-ADON) are far less in wheat. The simultaneous contamination of maize with DON and 15-ADON shows a high occurrence rate.

1. Introduction

Maize and wheat are widely cultured cereal crops and are considered staple foods in many regions around the world [1]. Global maize production in 2014 was 1037.8 million tons, mainly contributed by the United States, China, Brazil, the European Union, Argentina, Ukraine, India, and Mexico [2]. Wheat production in 2016 was 749 million tons worldwide, mainly harvested from China, India, Russia, and the United States [3]. In 2017, maize production in China was reported to reach 259 million tons, compared to wheat (134 million tons) and rice (214 million tons). China is a traditional agricultural country with maize and wheat always accounting for the important ratio of all food materials. However, approximately 25% of food worldwide is estimated to be contaminated by mycotoxins during growth, harvest, transportation, processing, or storage, resulting in yield losses and economic losses exceeding hundreds of billions of dollars [4].
Fusarium head blight (FHB) is a severe fungal disease that affects wheat and maize. The disease is caused by Fusarium graminearum species complexes (FGSC) [5]. FHB-infected grains are often contaminated with a class of trichothecene mycotoxins [6]. These mycotoxins are produced by the genera Fusarium graminearum (F. graminearum), Fusarium asiaticum (F. asiaticum), Fusarium meridionale, and Fusarium boothii [7]. Trichothecenes are low-molecular-weight secondary metabolites and capable of causing disease and death in both humans and animals [8]. Researchers in many countries have surveyed the most important type B trichothecenes such as deoxynivalenol (DON) and its derivatives, especially for 3-acetyl-deoxynivalenol (3-ADON), 15-acetyl-deoxynivalenol (15-ADON), and deoxynivalenol-3-β-D-glucoside (D-3-G), which are considered to result in health issues [9]. Maize has been reported to be mainly contaminated by DON and zearalenone [10]. Similarly, DON and its derivatives have been suggested to have the greatest frequency in wheat [11].
The toxicological properties vary from compound to compound. The DONs (the sum of DON, 3-ADON, and 15-ADON) potentially cause chronic and acute toxicities, such as vomiting, hepatotoxicity, nephrotoxicity, neurotoxicity, and immunotoxicity [12,13]. In addition, severe vomiting resulting from DONs leads to alterations in the nutrient and electrolyte balance, thus threatening the health of humans and animals [14]. DON, 3-ADON and 15-ADON are capable of altering the intestinal barrier function of pigs by regulating the expression of tight junction proteins [15]. DON derivatives have been considered as markers for detecting DON in cereal crops because DON shows a co-occurrence with its derivatives [16]. According to an EU report in 2017, most 3-ADON and 15-ADON are de-acetylated into DON during absorption and distribution by animals [17]. Therefore, 15-ADON and 3-ADON have at least equal toxicity to animals compared to DON [18]. Humans are naturally and frequently exposed to multiple mycotoxins, which may act independently. However, most mycotoxins show synergistic effects with each other, which may have more severe impacts on human health [19].
Therefore, the acetylated forms of DON have attracted increasing attention. Researchers in other countries warned that contamination of DON and its derivatives, especially 3-ADON and 15-ADON, are significantly different compared with the maize grains found in different years [20]. The contamination level of DON derivatives in China is relatively high. With regard to animal studies and epidemiological studies of DON and its acetyl derivatives in humans, the Joint FAO/WHO Expert Committee on Food Additives (JECFA) established that the temporary maximum daily tolerable intake (PMTDI) for the sum of DON and its acetyl derivatives (3-ADON and 15-ADON) is 1 µg/kg BW/d. However, the National Criterion of China has established a maximum concentration (MLS) of DON in cereals and their products of 1000 µg/kg [21]. The maximum allowable legal limits of 3-ADON and 15-ADON have not yet been set [22,23]. The results obtained in this work are of great significance to food safety, especially since the literature on 3-ADON and 15-ADON contamination of food is relatively scarce in China. To our knowledge, no data have been published on the simultaneous presence of DON, 3-ADON, and 15-ADON in wheat and maize in 2017 from China. The contamination of mycotoxins in wheat and maize may pose a serious health threat to the local area. Consequently, the aim of this study is to evaluate the natural occurrence of the above mycotoxins in wheat and maize, as determined by UPLC–MS/MS described by GB 5009.111-2016 [24].

2. Results

2.1. Optimization of the Clean-Up Procedure, Chromatographic Column, and Mass Spectrometry Conditions

Previous studies mainly described the use of immunoaffinity columns (IACs), multifunctional columns (MFCs), and solid phase extractions (SPEs) in the clean-up procedure [25,26,27]. Considering that a large number of samples and 3 types of mycotoxins needed to be analyzed in our research, we were unwilling to employ SPE because this method requires relatively complex procedures and takes a long time. Therefore, we evaluated IAC and MFC (Figure 1). The results showed that the MFC recovery rates of DON, 3-ADON, and 15-ADON in wheat were 92.90%, 97.12%, and 85.82%, respectively (Figure 1B). Additionally, the recovery rates of DON, 3-ADON, and 15-ADON in maize were 92.07%, 104.36%, and 92.44%, respectively (Figure 1B). However, the IAC recovery rates of 15-ADON in wheat and maize were 11.63% and 11.60%, respectively, suggesting that IAC is not suitable for application (Figure 1A).
To efficiently separate the three mycotoxins from samples of wheat and maize, we evaluated four high separation efficiency chromatographic columns (column a, Waters ACQUITY UPLC HSS (2.1 × 100 mm, 1.7 µm); column b, Waters ACQUITY UPLC BEH C18 (2.1 × 100 mm,1.8 µm); column c, Waters ACQUITY UPLC BEH C8 (2.1 × 100 mm, 1.8 µm); and column d, Waters ACQUITY UPLC BEH HILIC (2.1 × 100 mm, 1.8 µm; see Figure S1). The results show that the HSS column failed to separate DON from 3-ADON and 15-ADON effectively. With column b, clutter peaks appeared at 1 minute while column c had no retention for DONs. However, when applying column d, the peak shape was good, and almost no interfering peaks were observed, showing that DON, 3-ADON, and 15-ADON were effectively separated at 3.5 and 4.2 minutes, suggesting that column d is suitable for separating DON from 3-ADON and 15-ADON. Unfortunately, 3-ADON and 15-ADON were still unable to be effectively separated using ultra-high separation efficiency chromatographic columns because they are position isomers and differ from each other at the position of the acetyl groups on the carbon ring.
Therefore, to separate 3-ADON and 15-ADON from our grain samples, the specific selectivity of secondary mass spectrometry was applied to determine their masses based on their characteristic ion of different mass numbers in MRM mode (their mass numbers are 337.1 > 307 and 337.1 > 150, respectively). Specifically, the negative samples were labeled with 3-ADON and 15-ADON separately. When 3-ADON was added to the sample matrix, the 15-ADON ion channel did not show any interference. In contrast, the ion channels of 3-ADON had no interference with the addition of 15-ADON to the sample matrix, indicating that the specific selectivity of secondary mass spectrometry was suitable. The UPLC–MS/MS method was satisfactory and suitable for the simultaneous determination of DONs in wheat and maize (Figure S2).

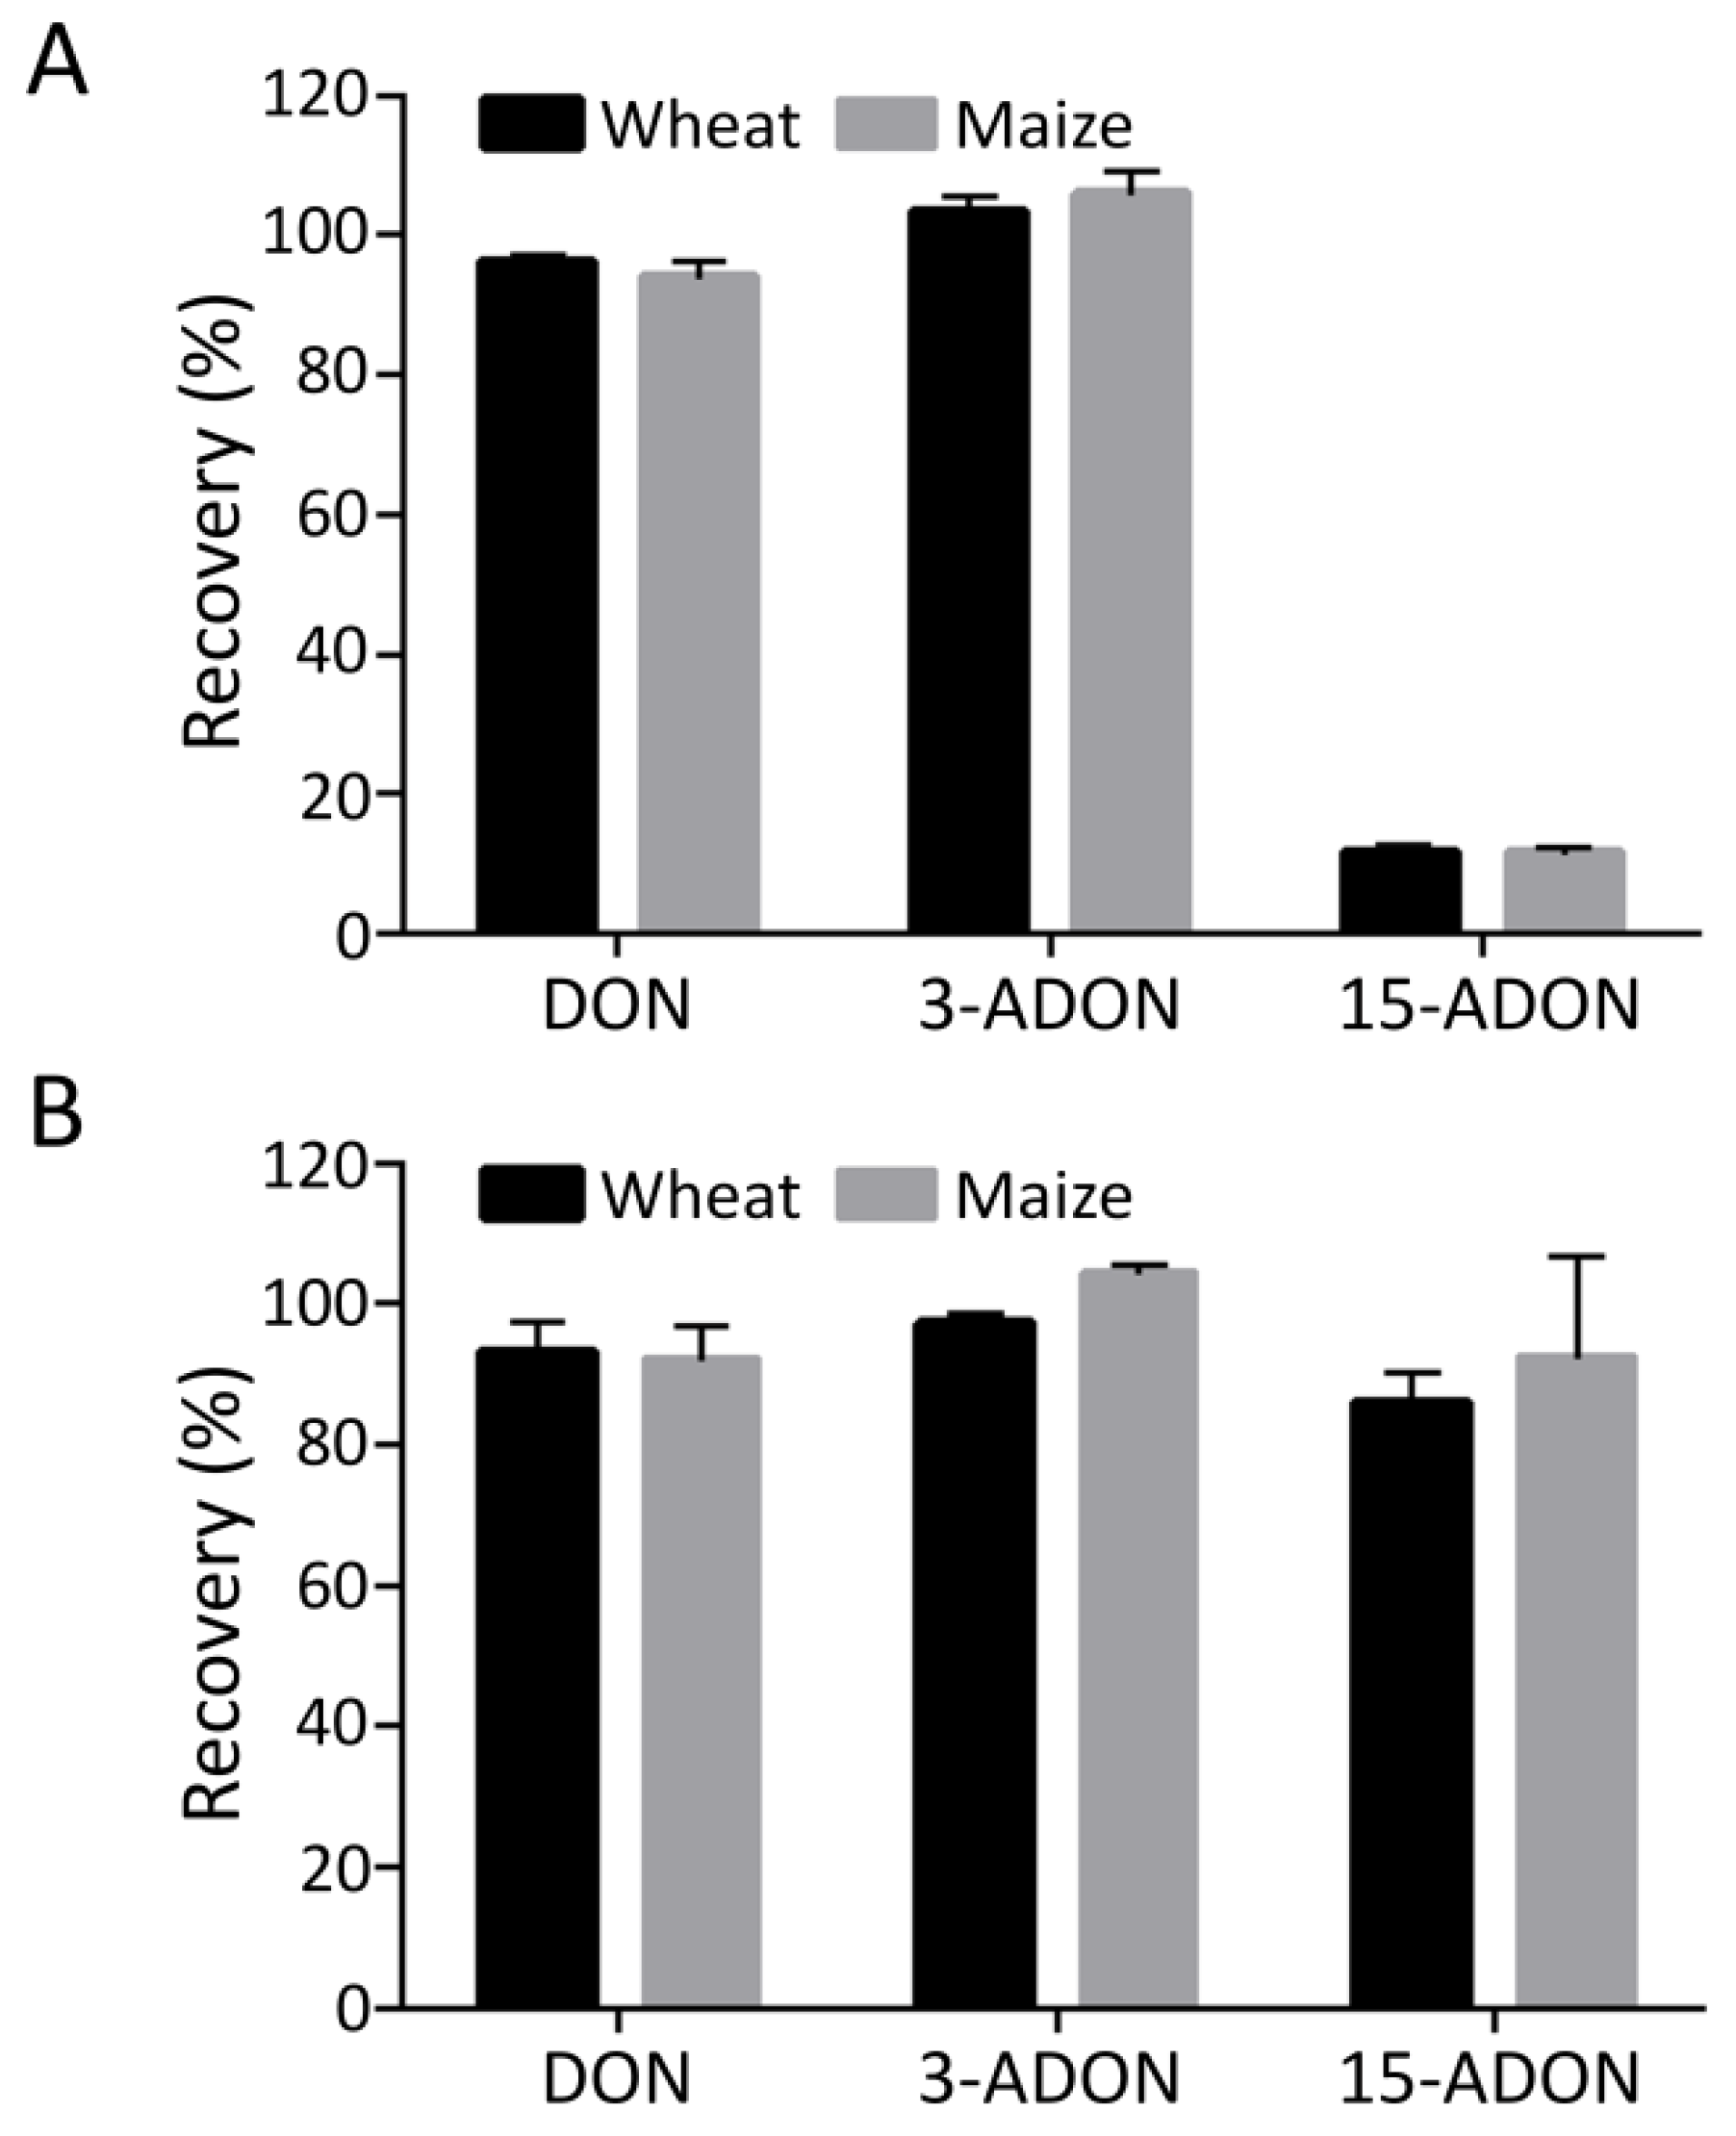
2.2. Method Validation

Using our optimized procedure, we assessed the reproducibility and recovery according to the No. 401/2006 EU Regulation and the linearity, precision, detection limit, and quantitative limit based on the GB 5009.111-2016 [24,28]. The dilution ranges of DON, 3-ADON, and 15-ADON were from 5 to 500 µg/mL. The calibration curves were established by plotting the peak area (y) versus concentration (x) of each from UHPLC analysis (DON: y = 0.73x − 0.08; 15-ADON: y = 0.20x − 0.008; 3-ADON: y = 0.69x − 0.04). The obtained calibration curves of DON, 3-ADON, and 15-ADON were linear from 9.91–501.20, 6.97–500.50, and 4.93–500.05 µg/mL, respectively, which showed a correlation R2 of DON of 0.9996, while the correlation R2 values of both 3-ADON and 15-ADON were 0.9999. The estimation of the limits of detection (LODs) and limits of quantification (LOQs) was made by diluting the standard solution to their respective signal-to-noise ratio (S/N) of approximately 3 for the LOD and 10 for the LOQ. The LOD of DON, 3-ADON, and 15-ADON was 0.65, 0.20, and 0.20 µg/kg, respectively. In addition, LOQ was 2.18, 0.49, and 0.67 µg/kg, respectively. The recovery (R) and repeatability (relative standard deviation, RSD) of the method were checked for three fortification levels: 50, 100, and 200 µg/kg. According to the level of analyte, the obtained R-values ranged from 71.72% to 112.81% (Table 1), while the RSD values ranged from 2.26% to 13.98%. A DON-positive wheat and maize reference sample were extracted and analyzed 3 times within 1 day for inter-laboratory RSD calculation (Table S1). These results indicate that the analytical method displayed high accuracy and precision for the detection of DON, 3-ADON, and 15-ADON in wheat and maize samples.

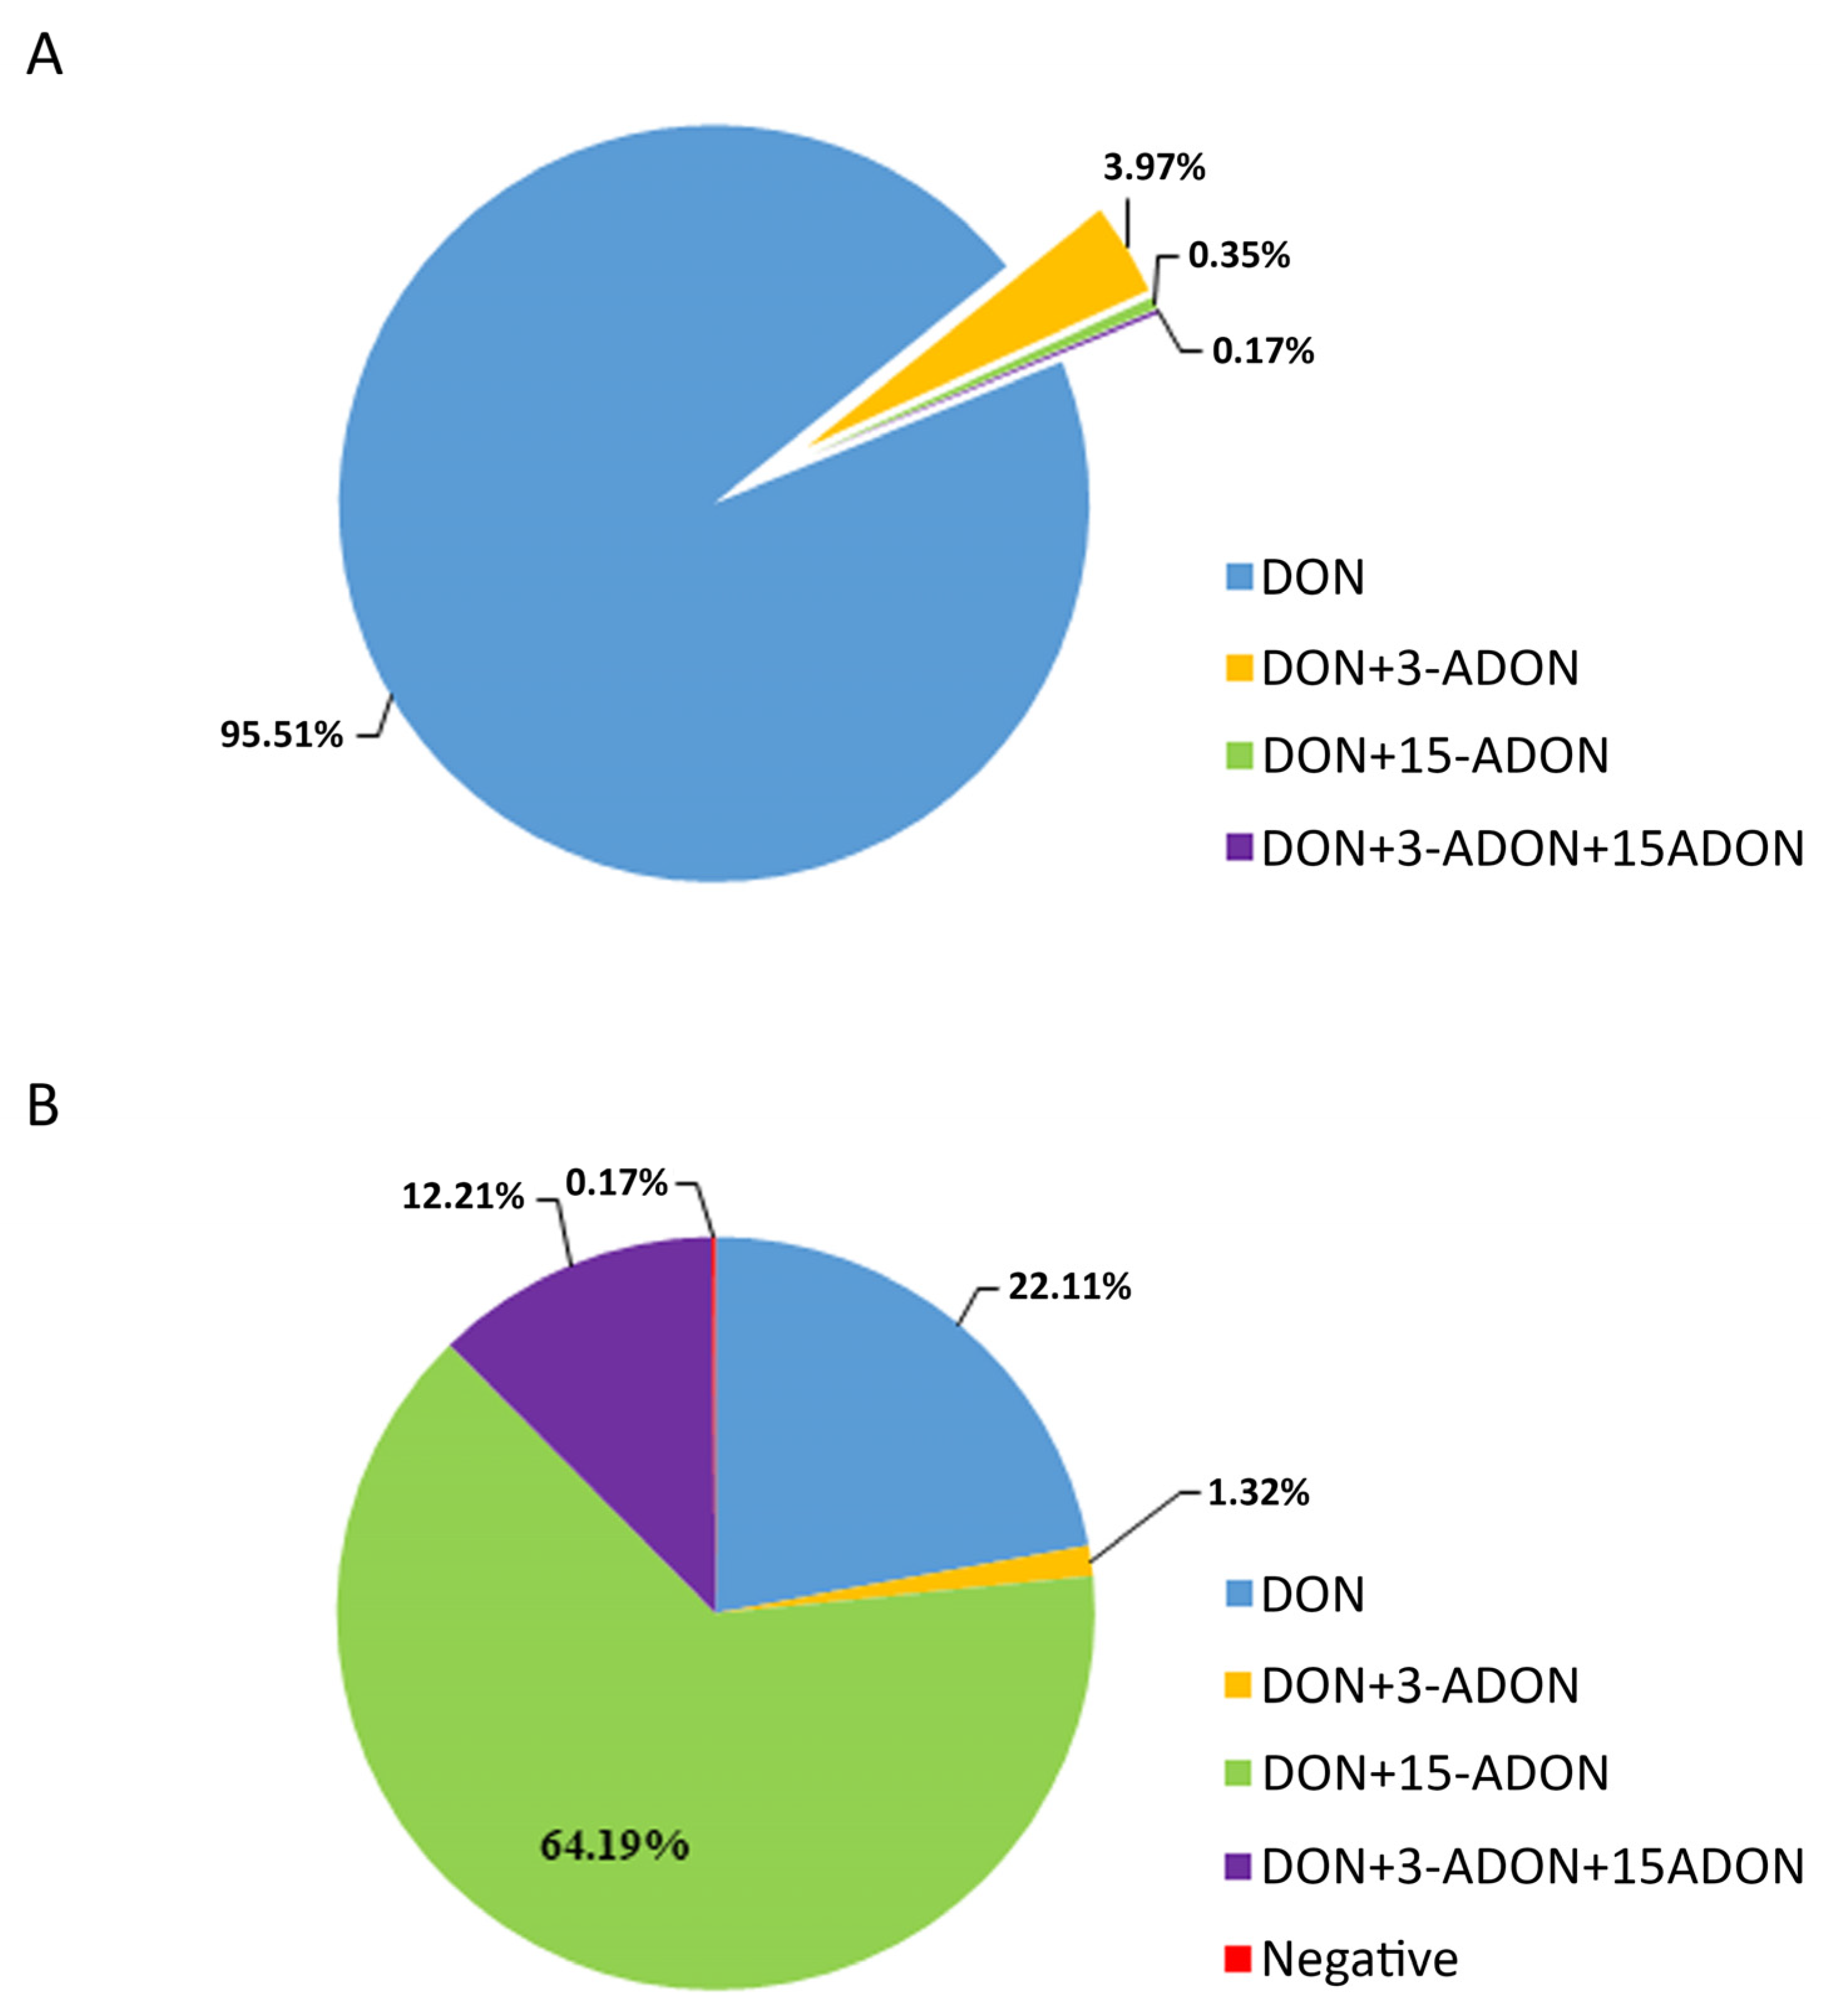
2.3. Analysis of Samples

The results for the determination of DON and its derivatives in harvested wheat and maize kernel samples are presented in Table 2. DON showed frequencies of 100% and 99.83%, with mean concentrations of 165.87 and 175.30 μg/kg, ranging from 12.16 to 6436.11 μg/kg and not detected(ND) to 4300.7 μg/kg in wheat and maize, respectively. However, 3-ADON had a low incidence of 4.15% and 13.53%, with mean concentrations of 1.22 and 4.97 μg/kg, ranging from ND to 149.49 μg/kg and ND to 385.33 μg/kg in wheat and maize, respectively. The results of very low levels of 3-ADON in cereals, especially for wheat, are in line with previous studies [29]. Interestingly, 15-ADON presented a dramatically low incidence (0.52%) with a mean concentration of 0.20 μg/kg (ranging from ND to 24.46 μg/kg) in wheat, while it showed a high frequency of 76.40% with a mean concentration of 115.06 μg/kg (ranging from ND to 4811.06 μg/kg) in maize. Only one maize sample was free from the three mycotoxins. Based on the distribution pattern of DONs, most wheat and maize samples were contaminated by DONs, but 89.25% and 62.06% of maize and wheat samples were contaminated by DONs (<200 µg/kg), respectively (Figure 2). When compared to the maximum acceptable level (1000 μg/kg) in GB 2761, DON levels exceeding 1000 μg/kg in wheat and maize were 3.63% and 2.97%, respectively. However, 3-ADON was acceptable in both wheat and maize samples, while 15-ADON exceeded 1000 μg/kg at a rate of 0.50% of maize samples.
The regions with the main wheat-producing areas (Hebei, Henan, Jiangsu, Hubei, Anhui, and Xinjiang) and maize-producing areas (Jilin, Liaoning, Heilongjiang, Shandong, and Inner Mongolia) were selected for sampling. In the main wheat production areas, the frequency of DON contamination in Hebei, Henan, Jiangsu, Hubei, Anhui, and Xinjiang was 100% (Table 3). Among that, Xinjiang, Henan, Hubei, and Jiangsu provinces had 7, 2, 8, and 3 samples exceeding the national limit standard, respectively. The highest level of DON in Xinjiang exceeded the China national standard GB 2761 by more than 6.4-fold. The frequency of 3-ADON contamination in Hebei, Henan, Hubei, Anhui, and Jiangsu were 1.75%, 4.88%, 9.09%, 3.45%, 2.63%, respectively, which Xinjiang was in good condition. Liu et al. [30] reported that 3-ADON contamination in Hebei was 3.16% (mean concentration: 2.05 μg/kg), which was in accordance with this study. Samples from five provinces did not test positive for 15-ADON contamination, yet the frequency of 15-ADON contamination in Hebei was 27.27%.
In the main maize production areas, the frequency of DON contamination in Jilin, Liaoning, Inner Mongolia, and Shandong were all 100%, except for Heilongjiang, which showed 99.46% (Table 4). The frequency of 3-ADON contamination in Jilin, Liaoning, Heilongjiang, Inner Mongolia, and were 8.89%, 12.77%, 22.58%, 9.45%, respectively, while no sample was detected to exceed 1000 μg/kg. Additionally, a high fraction of the samples from all the provinces studied were 15-ADON-positive, with samples from Jilin, Liaoning, Heilongjiang, Inner Mongolia, and Shandong showing incidence rates of 72.22%, 71.28%, 77.96%, 80.31%, 100%, respectively. Li and Luo et al. [31,32] reported that maize was more severely contaminated with DON, 3-ADON, and 15-ADON compared to wheat.

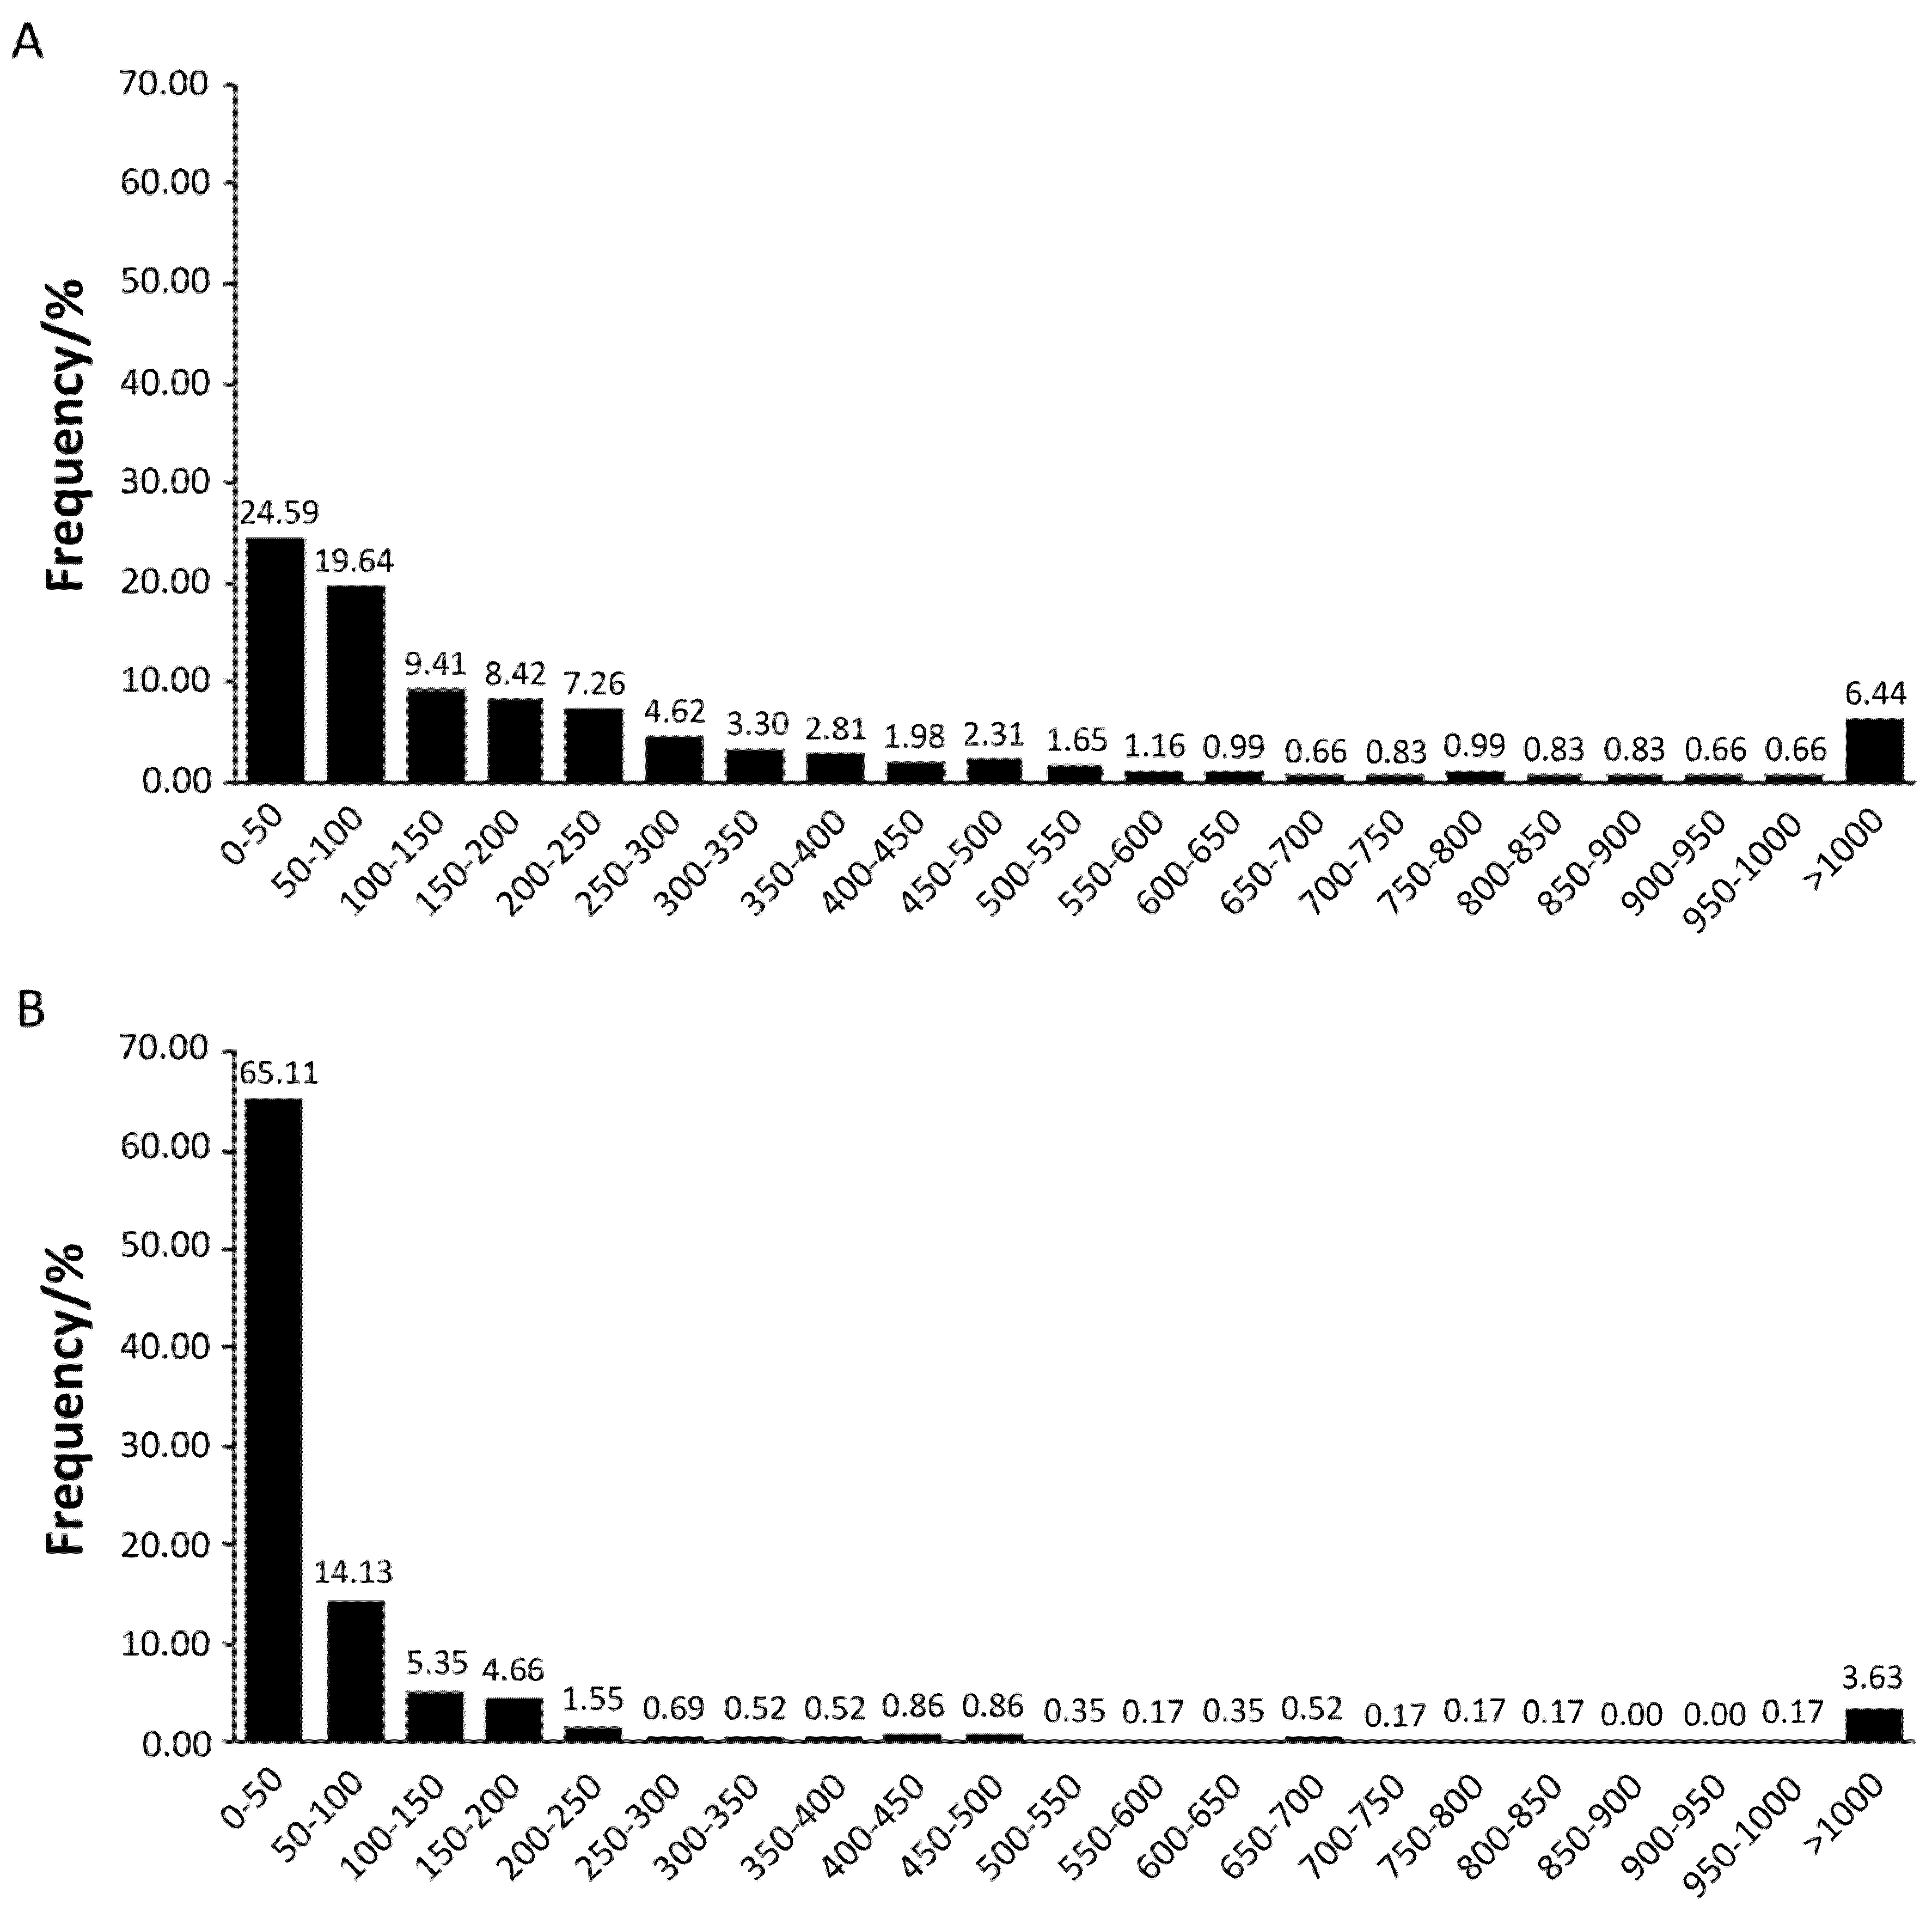
2.4. Distribution of DON and Its Derivatives in Wheat and Maize from China

Concerning the contamination of DON, 3-ADON, and 15-ADON in the 2017 wheat samples examined, DON was the predominant toxin detected in wheat samples, followed by 15-ADON. DON showed a higher incidence of 95.51% and 3.97% with a combination of DON + 3-ADON, while DON + 3-ADON + 15-ADON and DON + 15-ADON were only found in 0.17% and 0.35% in the tested wheat samples, respectively. In addition, 4.49% of the samples were contaminated by at least two mycotoxins. However, we did not find any wheat samples containing 3-ADON and 15-ADON alone. Among 579 wheat samples, only one wheat sample contained the three toxins. It is noteworthy that the co-occurrence of the mycotoxins is quite common, especially in highly contaminated grains [33]. The largest 3-ADON (98.12 µg/kg) and 15-ADON (19.13 µg/kg) concentrations were quantified in the sample with a DON concentration of 5521.20 µg/kg. The concentration of DON exceeded the limit of the China national standard GB 2761 by more than 5-fold. Compared to the wheat samples, maize samples not only differed in the contamination levels but also in composition. A large amount of the maize samples were contaminated with DON + 15-ADON (64.19%) and DON (22.11%). The samples with a combination of DON + 3-ADON and DON + 3-ADON + 15-ADON accounted for 1.32% and 12.21%, respectively. Only one maize sample did not contain all the three mycotoxins. In addition, 77.72% of the maize samples contained two or more mycotoxins. Generally, whenever 3-ADON and/or 15-ADON were detected, DON was always present. However, we did not find any samples containing only a combination of 3-ADON and 15-ADON. Among the 39 (6.44%) maize samples that contained high levels of DON (exceeding the limits of the China national standard), 21 samples contained all the three mycotoxins. Considering that both 3-ADON and 15-ADON have similar toxicity as DON and are not included in the Chinese national standard regulations, it is extremely important to evaluate not only DON but all its derivatives [14,34].

3. Discussion

DON, 3-ADON, and 15-ADON belong to the type-B trichothecenes produced by Fusarium graminearum and Fusarium asiaticum, which can cause hepatotoxicity, nephrotoxicity, neurotoxicity, and immunotoxicity in mammals [12,13]. DON, 3-ADON, and 15-ADON can contaminate agro-products such as wheat, maize, and even occur in agricultural commodities across the food chain. This is what has attracted public health attention.
The contamination trends of DON and its acetylated derivatives in wheat and maize analyzed in our study is consistent with a previous study which reported that DON was more frequently present in grains than 15-ADON and 3-ADON [23]. When compared with the data from 2011 maize kernels from 24 Chinese provinces, the prevalence of DON, 3-ADON, and 15-ADON in 2017 maize samples were significantly lower than that in 2011 maize samples (100%, 33%, 67%, respectively) [20]. Also, the average levels of DON, 3-ADON, and 15-ADON in 2017 maize samples were 175.3, 5.0, and 115.1 µg/kg, respectively, compared to 119, 1, 28 µg/kg, respectively, in the 2011 maize samples. Additionally, an earlier study in 2010 showed that the prevalence of DON, 3-ADON, and 15-ADON in wheat samples were 96.8%, 64.0%, 95.2%, respectively, implying that the incidence of 3-ADON and 15-ADON in the 2017 wheat samples had reduced significantly [35]. These differences in prevalence could be due to climatic conditions and geographical locations where the samples were collected [36]. The DON derivatives (3-ADON, 15-ADON) were far less frequently found and were present at low levels in wheat. However, 3-ADON and 15-ADON had incidences of 13.53% and 76.40% in maize, respectively. This is similar to the results reported that high incidence and concentrations of 15-ADON in maize samples than in wheat samples around the same period [37].
The contamination of DON, 3-ADON, and 15-ADON showed regional differences (Table 3 and Table 4). The mean concentrations of DON in maize samples collected in Jilin, Liaoning, and Heilongjiang provinces were above 180 µg/kg and had 5, 4, and 9 samples exceeding the national limit standard, respectively. There may be other factors such as insect infestation and agricultural practices affecting Fusarium infection. We found that wheat samples from five provinces did not contain 15-ADON except for Hubei Province (27.27%). Additionally, the mean content and standard-exceeded rate of DON was highest (72.73%) in wheat samples from Hubei. Our results agree with Zhang et al. [38], who reported that all wheat samples in Hubei contained high levels of DON, with 85.71% of the positive samples containing higher toxin levels than the Chinese national standard GB 2761 (1000 μg/kg). The incidence of 3-ADON was 21.43%. According to Waalwijk et al. [39], the DON and 3-ADON-producing fungus F. asiaticum was exclusively present in fields in the southern Hubei Provinces. The region has high temperature and humidity, and hence the fungal growth is favored during the period of flowering, sprouting, and heading stages. This may account for the high Fusarium infection and DON prevalence along the middle and lower regions of the Yangtze River [19,35,40,41].
According to Speijers [42], most mycotoxins do not only act alone but also act synergistically with other mycotoxins, which may be more harmful to human health. Mycotoxin compositions differed between the cereals (Figure 3). Our results in this study indicate a low incidence of 15-ADON (3.97%) and 3-ADON (0.35%) co-occurrence in the wheat samples. Similarly, Li et al. [31] did not detect DON + 3-ADON in their wheat samples. Janaviciene et al. [33] reported that the prevalence of deoxynivalenol and its derivatives in spring wheat grains from different agricultural production systems were different. A similar reason may account for why different levels of mycotoxins were detected in the cereals we collected from the different provinces in this study. It is known that the composition of mycotoxin chemotypes is related to pathogen species [43]. F. graminearum is mainly found in the cool northern areas of China with an annual average temperature below 15 °C, while F. asiaticum is present in warm southern areas with an annual average temperature above 15 °C [43,44,45]. Most F. asiaticum are 3-ADON producers, while F. graminearum produces 15-ADON chemotypes. In this study, all the maize samples were collected from the cool north of China, and that may account for why the incidence of DON + 15-ADON contamination was high (64.19%).
Taken together, the study demonstrates a natural occurrence of DON and its acetylated derivatives and the co-occurrence of three type-B trichothecenes from various regions of China in 2017. The results of the present study suggest different levels of DON, 3-ADON, and 15-ADON contamination in maize and wheat. Diversities in DON, its derivatives, and their compositions were found in wheat and maize samples in which 5 combinations of B-type trichothecenes were detected. The co-occurrence of DON + 15-ADON in maize kernels in China should be considered significant because of their high incidence in the grains. Further, in view of the cumulative health risks of the DON derivatives, it is indeed essential to appeal for a thorough reform of legislation, focusing not only on the original forms of mycotoxins but also on their derivatives.

4. Materials and Methods

4.1. Chemicals, Reagent, Standards, and Instruments

All organic solvents, including acetonitrile and methanol used for sample extraction and ultra-performance liquid chromatography–tandem mass spectrometry (UPLC–MS/MS) analysis, were LC/MS grade and purchased from Fisher Scientific. Stock standard solutions of DON, 3-ADON, and 15-ADON, in acetonitrile with concentrations of 100.0, 100.0, and 100.0 mg/L, respectively, were purchased from Romer-labs (Tulln, Austria) and stored at −20 °C. 13C-DON (stable isotope-labelled internal standard, 50.0 µg/ml) and 13C-3-ADON (stable isotope-labelled internal standard, 25.0 µg/ml) stock solutions in acetonitrile were purchased from Romer-labs (Tulln, Austria). The working standard solutions were prepared in the mobile phase and kept at 4 °C. Wheat and maize reference materials for DON were purchased from Biopure (Tulln, Austria). Purified water was obtained from a Milli-Q system (Millipore, Bedford, MA, USA). Separation of the analytes was achieved on a Waters ACQUITY UPLC BEH HILIC (2.1 × 100 mm, 1.8 µm) column. The identification of mycotoxins was performed on a 6460–1290 ultra high performance liquid chromatography mass spectrometer. The 0.22-µm pore organic phase filter membrane was purchased from Jinteng (Tianjin, China). A Mycosep 226 multi-functional purification column was purchased from Romer-labs (Tulln, Austria).

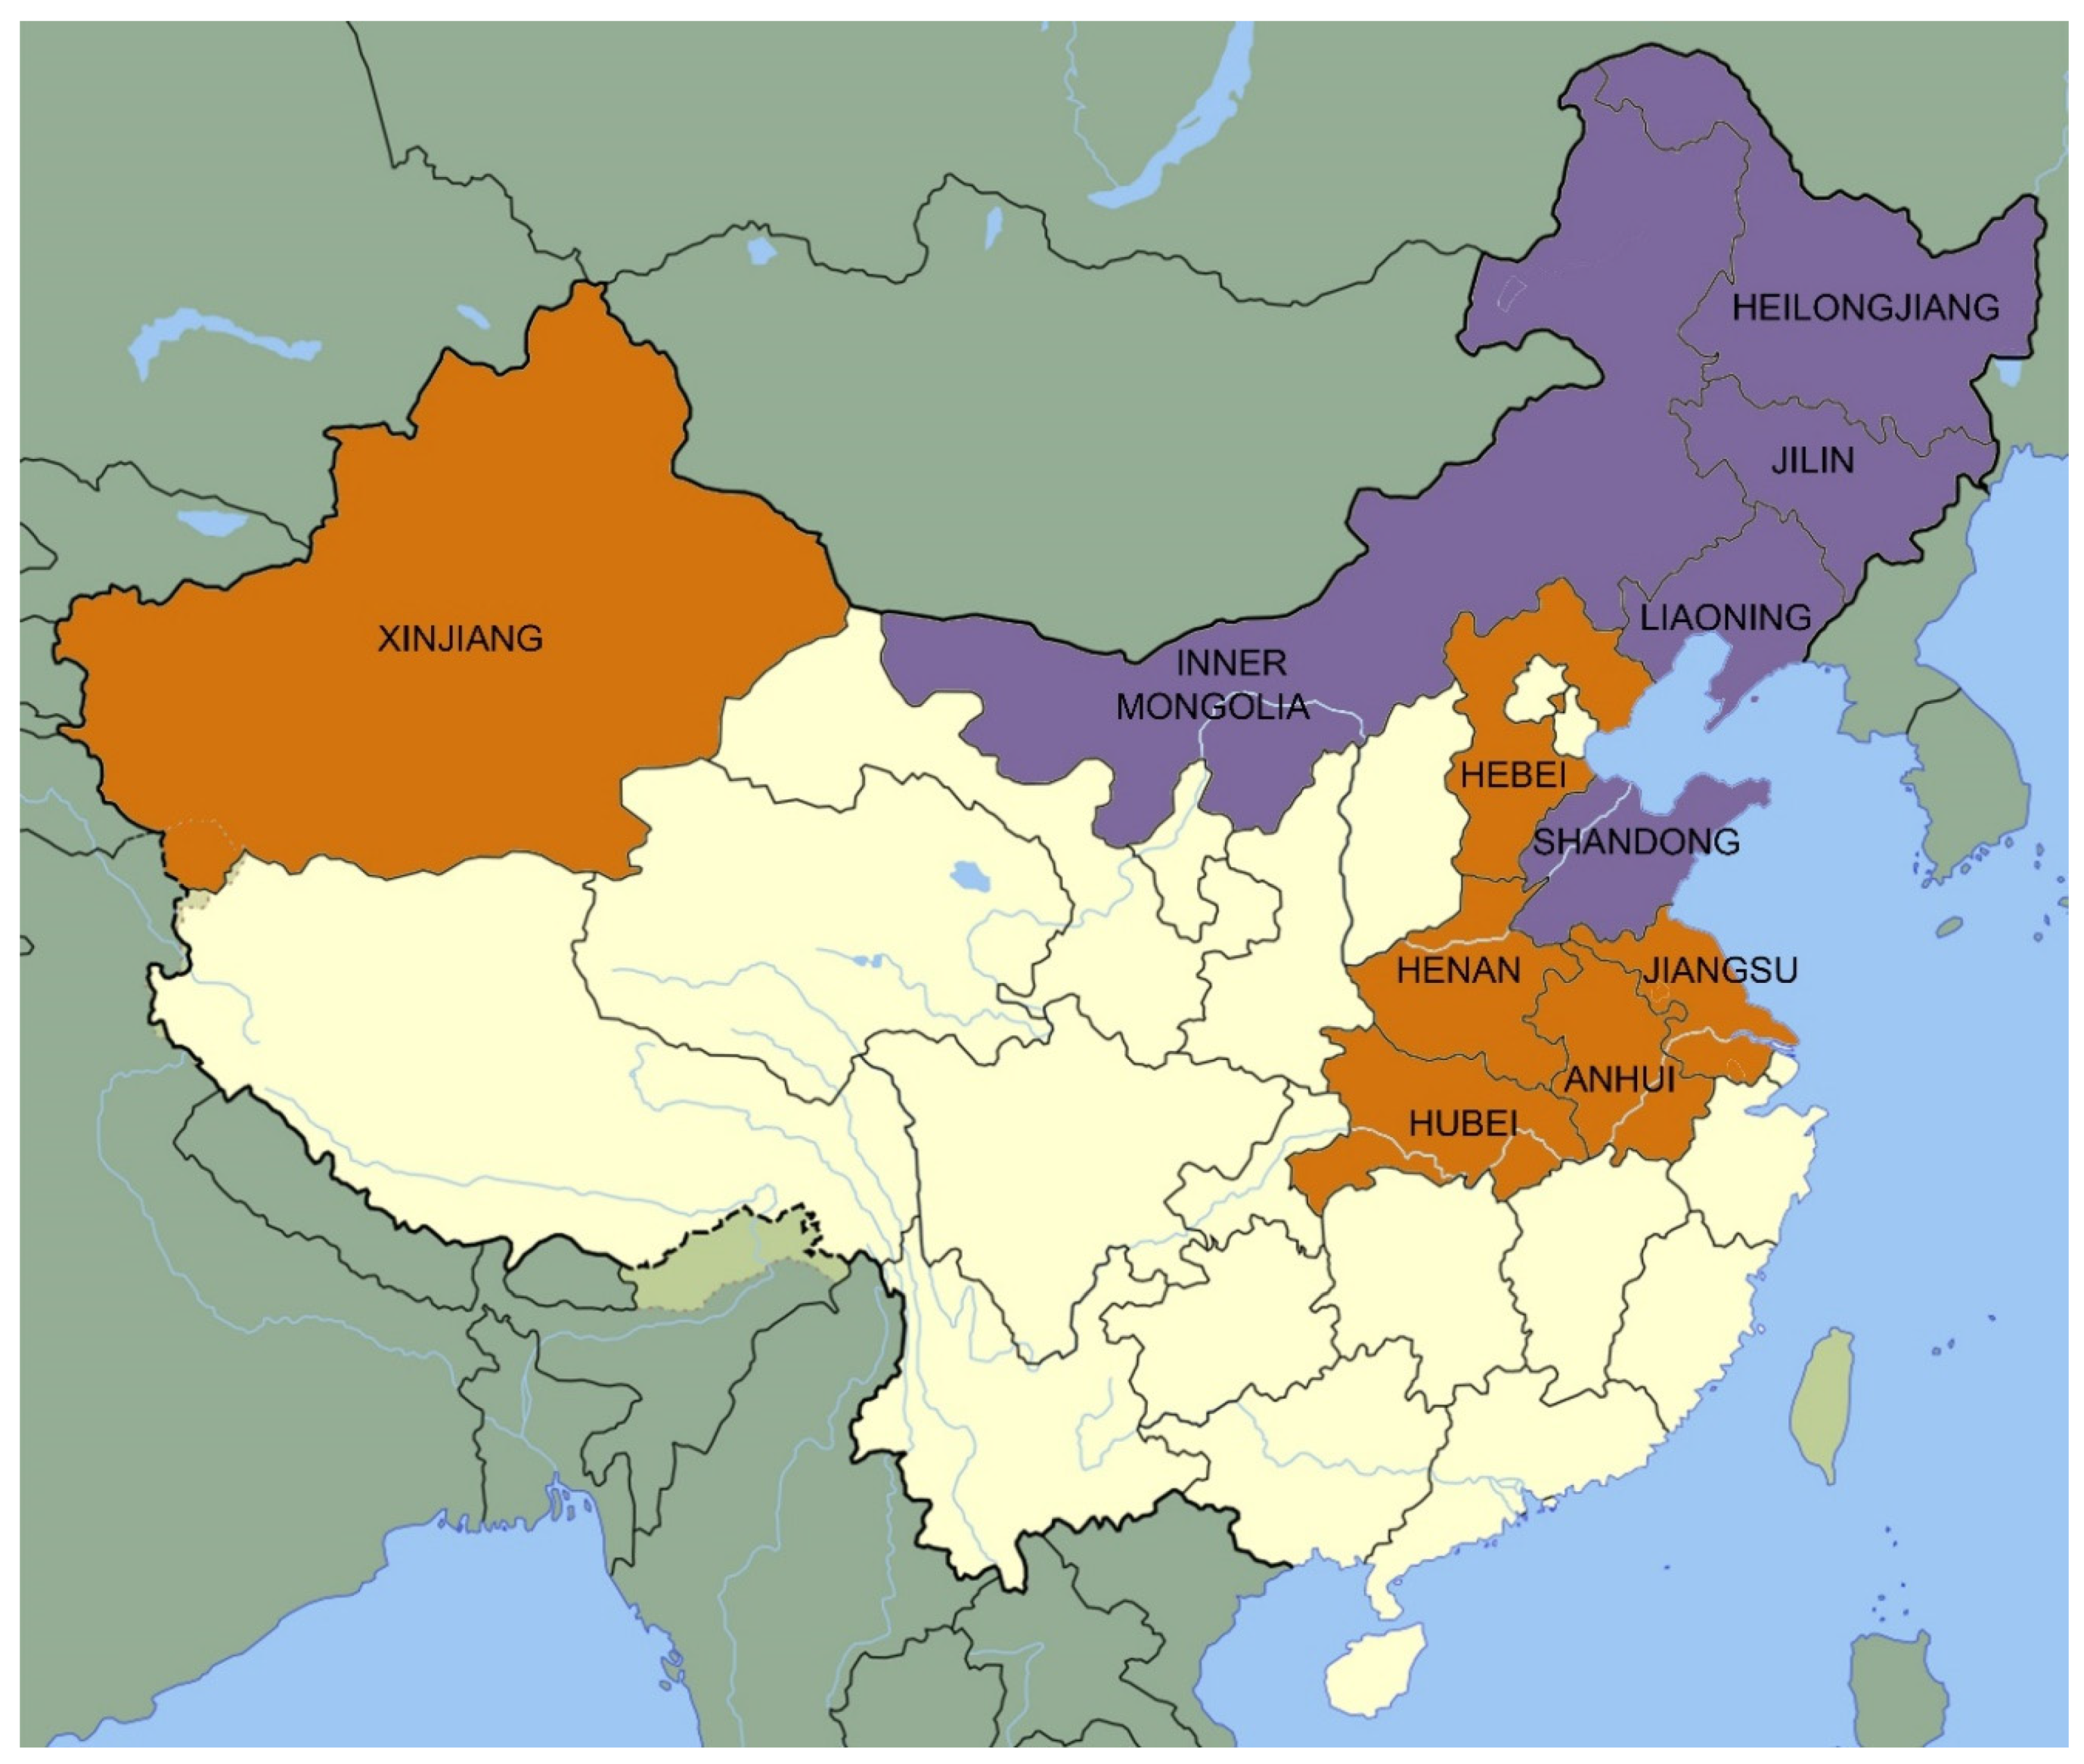
4.2. Sample Collection

A total of 579 wheat kernel samples were collected from the main wheat-producing provinces (Hebei, Henan, Jiangsu, Hubei, Anhui, and Xinjiang) and a total of 606 kernel maize samples were collected from the main maize-producing provinces (Jilin, Liaoning, Heilongjiang, Shandong, and Inner Mongolia), shown in Figure 4. All wheat and maize kernel samples in 2017 intended for people consumption were collected from local farmers, one portion per household. The weight of each sample is 1 kg. The samples were stored at 4 °C until analysis.

4.3. UHPLC–MS/MS Conditions

UHPLC–MS/MS was implemented on an Agilent 1290-6460 system (CA, USA) equipped with a Z-spray ESI interface. UHPLC separation was conducted with a Waters Acquity UPLC BEH HILIC column (2.1 × 100 mm, 1.8 µm) using a mobile phase consisting of acetonitrile (A) and 0.2% ammonium hydroxide in water (B) at a flow rate of 0.3 mL/min. The gradient elution was applied as follows: 5%−20% B (0–1.5 min), 20%–40% B (1.5–3.0 min), 40%–90% B (3.0–5.0 min), 90%–20% B (5.0–7.0 min), 20%–5% B (7.0–8.0 min), and then returned to the initial composition within 1 min and equilibrated for 2 min before successive sample injection. The column was kept at 35 °C, and the injection volume was 5 µL. The ESI interface was operated in a negative-ionization mode. Nitrogen was used for desolvation, and its flow rate was 900 L/h. The desolvation temperature was 350 °C. The specific MS parameters of the compound, together with the product ions and precursors used for quantification and qualification, are shown in Table 5.

4.4. Sample Preparation and Clean-Up

Both wheat and maize samples were screened for dust and some minor impurities through a circular sieve with a diameter of 1.0 mm. The three mycotoxins DON, 3-ADON, and 15-ADON were extracted and cleaned up by the method described (GB 5009.111-2016). After milling, cereal samples (2 g) were extracted with 20 mL of acetonitrile/water (84:16, v/v) for 20 min on an orbital shaker and centrifuged at 10,000 rpm for 5 min. A 9-mL portion was passed through a MycoSep 226 column, and then 5 mL of purified extract was evaporated to dryness at 40 °C under a nitrogen flow. The residue was completely dissolved in 1 mL of methanol-water (95/5, v/v) with vortexing for 1 min. The mixture was homogeneous for 10 seconds with a scroll mixer and filtered into a 1.5-ml centrifugal tube with a 0.22 µm microporous filter membrane. A 180-µL sample and 20 µL of mixed isotope internal standard solution were absorbed into the injection bottle and analyzed by UHPLC–MS/MS for DON, 3-ADON, and 15-ADON. All maize and wheat samples were tested in Hubei Provincial Center for Disease and Prevention during the period February to July 2018.

4.5. Quantitation and Calculation

Quantitation of DON and its derivatives in the solution should be performed by measuring the peak area of the target compound and comparing it with the corresponding standard chromatographic peak in a change range of 2.5%. DON is analyzed with 13C-DON as an internal standard, and 3-ADON and 15-ADON are corrected with 13C-3-ADON as an internal standard. Analysis of naturally contaminated samples and wheat and maize reference materials were performed using 13C-labelled mycotoxins as internal standards added to the final samples according to the above-described procedure. The DON (3-ADON, 15-ADON) peak area was compared with the peak area of the relevant 13C-labelled internal standard. The formula for the mycotoxin content should be used to calculate the concentration of mycotoxins in the test sample:
x = ρ × V 1 × V 3 / V 2 × m
where ρ is the concentration of DON (3-ADON, 15-ADON) derived from the calibration curve (in micrograms/milliliter), V1 is the extraction volume of maize and wheat sample (in milliliters), and V3 is the final volume (in milliliters) of the injected test solution. V2 is the volume (in milliliters) of the extract used for clean up, and m is the mass of the sample substance used for analysis in maize or wheat (in grams).

4.6. Statistical Analysis

All the data were analyzed by EXCEL 2007 and SPSS21.0. The average number of samples, mean ± relative standard deviation (RSD) + standard deviation (SD) and quartile (P25–P75) were calculated. When calculating the average value of data, the content value of an analysis result lower than LOD was replaced by LOD/2 [46].

Supplementary Materials

The following are available online at https://0-www-mdpi-com.brum.beds.ac.uk/2072-6651/12/3/200/s1, Figure S1: Chromatographic charts of three toxins separated by four chromatographic columns (column a, column b, column c, column d), Figure S2: 3-ADON (A) and 15-ADON (B) chromatograms for negative samples, Table S1: Concentration and precision of material references.

Author Contributions

Data curation, S.L.; Software, L.Y. (Liyun Yao); Validation, Z.L.; Writing—original draft, P.Y.; Writing—review and editing, Z.G., Y.L. (Yan Liu), and Y.W. All authors have read and agreed to the published version of the manuscript.

Funding

This research was funded by the National Key Research and Development Programme of China (2017YF1600500).

Acknowledgments

We would like to acknowledge all the support received from teachers Yonggang Li and Fang Kong from the Hubei Provincial Center for Disease and Prevention for experiment guidance.

Conflicts of Interest

The authors declare no conflict of interest.

References

  1. Ortiz-Monasterio, J.I.; Palacios-Rojas, N.; Meng, E.; Pixley, K.; Trethowan, R.; Pena, R. Enhancing the mineral and vitamin content of wheat and maize through plant breeding. J. Cereal Sci. 2007, 46, 293–307. [Google Scholar] [CrossRef]
  2. Ranum, P.; Peña-Rosas, J.P.; Garcia-Casal, M.N. Global maize production, utilization, and consumption. Ann. N. Y. Acad. Sci. 2014, 1312, 105–112. [Google Scholar] [CrossRef] [PubMed]
  3. Masuda, K. Measuring eco-efficiency of wheat production in Japan: A combined application of life cycle assessment and data envelopment analysis. J. Clean. Prod. 2016, 126, 373–381. [Google Scholar] [CrossRef]
  4. Moretti, A.; Logrieco, A.F.; Susca, A. Mycotoxins: An underhand food problem. Methods Mol. Biol. 2017, 1542, 3–12. [Google Scholar] [PubMed]
  5. Van der Lee, T.; Zhang, H.; van Diepeningen, A.; Waalwijk, C. Biogeography of Fusarium graminearum species complex and chemotypes: A review. Food Addit. Contam. Part A 2015, 32, 453–460. [Google Scholar] [CrossRef] [PubMed] [Green Version]
  6. Starkey, D.E.; Ward, T.J.; Aoki, T.; Gale, L.R.; Kistler, H.C.; Geiser, D.M.; Suga, H.; Toth, B.; Varga, J.; O’Donnell, K. Global molecular surveillance reveals novel Fusarium head blight species and trichothecene toxin diversity. Fungal Genet. Biol. 2007, 44, 1191–1204. [Google Scholar] [CrossRef]
  7. Lee, J.; Kim, H.; Jeon, J.-J.; Kim, H.-S.; Zeller, K.A.; Carter, L.L.; Leslie, J.F.; Lee, Y.-W. Population structure of and mycotoxin production by Fusarium graminearum from maize in South Korea. J. Appl. Environ. Microbiol. 2012, 78, 2161–2167. [Google Scholar] [CrossRef] [Green Version]
  8. Santini, A.; Tenore, G.; Ritieni, A. Mycotoxins and Food: Fusaproliferin Occurrence and Risk. J. Nutr. Ecol. Food Res. 2013, 1, 226–232. [Google Scholar] [CrossRef] [Green Version]
  9. Tucker, J.R.; Badea, A.; Blagden, R.; Pleskach, K.; Tittlemier, S.A.; Fernando, W.G. Deoxynivalenol-3-glucoside content is highly associated with deoxynivalenol levels in two-row barley genotypes of importance to Canadian barley breeding programs. Toxins 2019, 11, 319. [Google Scholar] [CrossRef] [Green Version]
  10. Pitt, J.I.; Miller, J.D. A concise history of mycotoxin research. J. Agric. Food Chem. 2017, 65, 7021–7033. [Google Scholar] [CrossRef]
  11. Stanciu, O.; Juan, C.; Miere, D.; Loghin, F.; Mañes, J. Occurrence and co-occurrence of Fusarium mycotoxins in wheat grains and wheat flour from Romania. Food Control 2017, 73, 147–155. [Google Scholar] [CrossRef]
  12. Juan, C.; Ritieni, A.; Mañes, J. Occurrence of Fusarium mycotoxins in Italian cereal and cereal products from organic farming. Food Chem. 2013, 141, 1747–1755. [Google Scholar] [CrossRef] [PubMed]
  13. Tiemann, U.; Dänicke, S. In vivo and in vitro effects of the mycotoxins zearalenone and deoxynivalenol on different non-reproductive and reproductive organs in female pigs: A review. Food Addit. Contam. 2007, 24, 306–314. [Google Scholar] [CrossRef] [PubMed] [Green Version]
  14. Wu, W.; Bates, M.A.; Bursian, S.J.; Link, J.E.; Flannery, B.M.; Sugita-Konishi, Y.; Watanabe, M.; Zhang, H.; Pestka, J.J. Comparison of emetic potencies of the 8-ketotrichothecenes deoxynivalenol, 15-acetyldeoxynivalenol, 3-acetyldeoxynivalenol, fusarenon X., and nivalenol. Toxicol. Sci. 2013, 131, 279–291. [Google Scholar] [CrossRef]
  15. Lucioli, J.; Pinton, P.; Callu, P.; Laffitte, J.; Grosjean, F.; Kolf-Clauw, M.; Oswald, I.P.; Bracarense, A.P.F. The food contaminant deoxynivalenol activates the mitogen activated protein kinases in the intestine: Interest of ex vivo models as an alternative to in vivo experiments. Toxicon 2013, 66, 31–36. [Google Scholar] [CrossRef] [Green Version]
  16. Ran, R.; Wang, C.H.; Han, Z.; Wu, A.B.; Zhang, D.B.; Shi, J.X. Determination of deoxynivalenol (DON) and its derivatives: Current status of analytical methods. Food Control 2013, 34, 138–148. [Google Scholar] [CrossRef]
  17. EFSA Panel on Contaminants in the Food Chain; Knutsen, H.K.; Alexander, J.; Barregård, L.; Bignami, M.; Brüschweiler, B.; Ceccatelli, S.; Cottrill, B.; Dinovi, M.; Grasl-Kraupp, B.; et al. Risks to human and animal health related to the presence of deoxynivalenol and its acetylated and modified forms in food and feed. EFSA. J. 2017, 15, e04718. [Google Scholar]
  18. Pinton, P.; Tsybulskyy, D.; Lucioli, J.; Laffitte, J.; Callu, P.; Lyazhri, F.; Grosjean, F.; Bracarense, A.P.; Kolf-Clauw, M.; Oswald, I.P. Toxicity of deoxynivalenol and its acetylated derivatives on the intestine: Differential effects on morphology, barrier function, tight junction proteins, and mitogen-activated protein kinases. Toxicol. Sci. 2012, 130, 180–190. [Google Scholar] [CrossRef]
  19. Alassane-Kpembi, I.; Puel, O.; Oswald, I.P. Toxicological interactions between the mycotoxins deoxynivalenol, nivalenol and their acetylated derivatives in intestinal epithelial cells. Arch. Toxicol. 2015, 89, 1337–1346. [Google Scholar] [CrossRef]
  20. Wang, W.; Ma, J.J.; Yu, C.C.; Lin, X.H.; Jiang, H.R.; Shao, B.; Li, F.Q. Simultaneous determination of masked deoxynivalenol and some important type B trichothecenes in Chinese corn kernels and corn-based products by ultra-performance liquid chromatography-tandem mass spectrometry. J. Agric. Food Chem. 2012, 60, 11638–11646. [Google Scholar]
  21. National Health and Family Planning Commission; China Food and Drug Administration. Maximum levels of mycotoxins in foods. In National Criterion of China; Beijing, China, 2017; GB/T 2761-2017. [Google Scholar]
  22. Sun, J.F.; Wu, Y.N. Evaluation of dietary exposure to deoxynivalenol (DON) and its derivatives from cereals in China. Food Control 2016, 69, 90–99. [Google Scholar] [CrossRef]
  23. Han, Z.; Nie, D.X.; Ediage, E.N.; Yang, X.; Wang, J.H.; Chen, B.; Li, S.G.; On, S.L.W.; De Saeger, S.; Wu, A.B. Cumulative health risk assessment of co-occurring mycotoxins of deoxynivalenol and its acetyl derivatives in wheat and maize: Case study, Shanghai, China. Food Chem. Toxicol. 2014, 74, 334–342. [Google Scholar] [CrossRef] [PubMed]
  24. National Health and Family Planning Commission; China Food and Drug Administration. Determination of deoxynivalenol and its acetylated derivatives in foods. In National Criterion of China; Beijing, China, 2016; GB 5009.111-2016. [Google Scholar]
  25. Cao, J.L.; Zhou, S.J.; Kong, W.J.; Yang, M.H.; Wan, L.; Yang, S.H. Molecularly imprinted polymer-based solid phase clean-up for analysis of ochratoxin A in ginger and LC-MS/MS confirmation. Food Control 2013, 33, 337–343. [Google Scholar] [CrossRef]
  26. Zuo, H.G.; Zhu, J.X.; Shi, L.; Zhan, C.R.; Guo, P.; Wang, Y.; Zhang, Y.M.; Liu, J.P. Development of a novel immunoaffinity column for the determination of deoxynivalenol and its acetylated derivatives in cereals. Food Anal. Methods 2018, 11, 2252–2260. [Google Scholar] [CrossRef]
  27. Xu, J.J.; Zhou, J.; Huang, B.F.; Cai, Z.X.; Xu, X.M.; Ren, Y.P. Simultaneous and rapid determination of deoxynivalenol and its acetylate derivatives in wheat flour and rice by ultra high performance liquid chromatography with photo diode array detection. J. Sep. Sci. 2016, 39, 2028–2035. [Google Scholar] [CrossRef] [PubMed]
  28. The Commission of the European Communities. Laying down the methods of sampling and analysis for the official control of the levels of mycotoxins in foodstuffs. Commission Regulation (EC). 2006. No 401/2006. Available online: https://eur-lex.europa.eu/legal-content/EN/ALL/?uri=CELEX%3A32006R0401 (accessed on 9 March 2006).
  29. Kim, D.-H.; Hong, S.-Y.; Jeon, M.-H.; An, J.-M.; Kim, S.-Y.; Kim, H.-Y.; Yoon, B.R.; Chung, S.H. Simultaneous determination of the levels of deoxynivalenol, 3-acetyldeoxynivalenol, and nivalenol in grain and feed samples from South Korea using a high-performance liquid chromatography–photodiode array detector. Appl. Biol. Chem. 2016, 59, 881–887. [Google Scholar] [CrossRef]
  30. Liu, Y.P.; Lu, Y.; Wang, L.Y.; Chang, F.Q.; Yang, L.X. Survey of 11 mycotoxins in wheat flour in Hebei province, China. Food Addit. Contam. Part B Surveill. 2015, 8, 250–254. [Google Scholar] [CrossRef]
  31. Li, F.Q.; Yu, C.C.; Shao, B.; Wang, W.; Yu, H.X. Natural occurrence of masked deoxynivalenol and multi-mycotoxins in cereals from China harvested in 2007 and 2008. Zhonghua Yu Fang Yi Xue Za Zhi [Chin. J. Prev. MED.] 2011, 45, 57–63. [Google Scholar]
  32. Luo, Y.; Yoshizawa, T.; Katayama, T. Comparative study on the natural occurrence of Fusarium mycotoxins (trichothecenes and zearalenone) in corn and wheat from high-and low-risk areas for human esophageal cancer in China. Appl. Environ. Microbiol. 1990, 56, 3723–3726. [Google Scholar] [CrossRef] [Green Version]
  33. Janaviciene, S.; Mankeviciene, A.; Suproniene, S.; Kochiieru, Y.; Keriene, I. The prevalence of deoxynivalenol and its derivatives in the spring wheat grain from different agricultural production systems in Lithuania. Food Addit. Contam. Part A 2018, 35, 1179–1188. [Google Scholar] [CrossRef]
  34. Juan-García, A.; Juan, C.; König, S.; Ruiz, M.-J. Cytotoxic effects and degradation products of three mycotoxins: Alternariol, 3-acetyl-deoxynivalenol and 15-acetyl-deoxynivalenol in liver hepatocellular carcinoma cells. Toxicol. Lett. 2015, 235, 8–16. [Google Scholar] [CrossRef] [PubMed]
  35. Jiaojie, M.; Bing, S.; Xiaohui, L.; Hongxia, Y.; Fengqin, L. Study on the natural occurrence of multi-mycotoxin in cereal and cereal-based product samples collected from parts of China in 2010. Chin. J. Food Hyg. 2011, 23, 481–488. [Google Scholar]
  36. Liu, Y.P.; Lu, Y.; Wang, L.Y.; Chang, F.Q.; Yang, L.X. Occurrence of deoxynivalenol in wheat, Hebei Province, China. Food Chem. 2016, 197, 1271–1274. [Google Scholar] [CrossRef] [PubMed]
  37. Schollenberger, M.; Müller, H.-M.; Rüfle, M.; Suchy, S.; Plank, S.; Drochner, W. Natural occurrence of 16 Fusarium toxins in grains and feedstuffs of plant origin from Germany. Mycopathologia 2006, 161, 43–52. [Google Scholar] [CrossRef] [PubMed]
  38. Zhang, J.B.; Wang, J.H.; Gong, A.D.; Chen, F.F.; Song, B.; Li, X.; Li, H.P.; Peng, C.H.; Liao, Y.C. Natural occurrence of fusarium head blight, mycotoxins and mycotoxin-producing isolates of Fusarium in commercial fields of wheat in Hubei. Plant Pathol. 2013, 62, 92–102. [Google Scholar] [CrossRef]
  39. Waalwijk, C.; de Vries, I.M.; Köhl, J.; Xu, X.D.; van der Lee, T.A.; Kema, G.H. Development of quantitative detection methods for Fusarium in cereals and their application. Mycotoxins: Detection methods, management, public health and agricultural trade. CAB Int. 2008, 195–205. [Google Scholar]
  40. Abdallah, M.F.; Girgin, G.; Baydar, T.; Krska, R.; Sulyok, M. Occurrence of multiple mycotoxins and other fungal metabolites in animal feed and maize samples from Egypt using LC-MS/MS. J. Sci. Food Agric. 2017, 97, 4419–4428. [Google Scholar] [CrossRef]
  41. Monbaliu, S.; Van Poucke, C.; Detavernier, C.l.; Dumoulin, F.; Van De Velde, M.; Schoeters, E.; Van Dyck, S.; Averkieva, O.; Van Peteghem, C.; De Saeger, S. Occurrence of mycotoxins in feed as analyzed by a multi-mycotoxin LC-MS/MS method. J. Agric. Food Chem. 2010, 58, 66–71. [Google Scholar] [CrossRef]
  42. Speijers, G.J.A.; Speijers, M.H.M. Combined toxic effects of mycotoxins. Toxicol. Lett. 2004, 153, 91–98. [Google Scholar] [CrossRef]
  43. Zhang, J.-B.; Li, H.-P.; Dang, F.-J.; Qu, B.; Xu, Y.-B.; Zhao, C.-S.; Liao, Y.-C. Determination of the trichothecene mycotoxin chemotypes and associated geographical distribution and phylogenetic species of the Fusarium graminearum clade from China. Mycol. Res. 2007, 111, 967–975. [Google Scholar] [CrossRef]
  44. Liu, X.X.; Wang, Y.; Qiu, J.F.; Meng, F.L.; Wei, C.Y. Analysis of toxin contamination in spring wheat, species and mycotoxin chemotypes of Fusarium spp. in northern China. Jiangsu Agric. Sci. 2018, 46, 199–202. [Google Scholar]
  45. Qu, B.; Li, H.P.; Zhang, J.B.; Xu, Y.B.; Huang, T.; Wu, A.B.; Zhao, C.S.; Carter, J.; Nicholson, P.; Liao, Y.C. Geographic distribution and genetic diversity of Fusarium graminearum and F. asiaticum on wheat spikes throughout China. Plant Pathol. 2008, 57, 15–24. [Google Scholar] [CrossRef]
  46. Hornung, R.W.; Reed, L.D. Estimation of average concentration in the presence of nondetectable values. Appl. Occup. Environ. Hyg. 1990, 5, 46–51. [Google Scholar] [CrossRef]
Figure 1. Recovery of maize and wheat spiked with deoxynivalenol (DON), 3-acetyl-deoxynivalenol (3-ADON), and 15-acetyl-deoxynivalenol (15-ADON) of immunoaffinity columns (IACs) (A) and multifunctional columns (MFCs) (B). The data are expressed as the mean + SD of three independent experiments.
Toxins 12 00200 g001
Figure 2. Distribution of DONs in wheat samples (A) and maize samples (B).
Toxins 12 00200 g002
Figure 3. The distribution of wheat samples (A) and maize samples (B) according to the composition of mycotoxins.
Toxins 12 00200 g003
Figure 4. Distribution map of sampling areas (orange color: wheat samples; purple color: maize samples).
Toxins 12 00200 g004
Table 1. Method validation parameters for the quantification of DONs in wheat and maize by the proposed UHPLC–MS/MS method.
TypeCompoundNatural
Contamination
Spike LevelAccuracy RecoveryPrecision (RSD)
(n = 6, µg/kg)(µg/kg)(%)Interday
(n = 6, %)
Intraday
(n = 3, %)
DON14.1350.00100.9610.379.23
100.0081.085.734.92
200.0082.346.6110.44
wheat3-ADONND150.00104.443.763.98
100.00101.316.257.81
200.0082.502.957.97
15-ADONND50.00103.154.1010.47
100.0083.8312.2710.01
200.0071.725.366.07
DON16.4550.0093.5010.527.94
100.0090.765.537.68
200.0092.255.717.89
maize3-ADONND50.00103.937.806.87
100.00101.6513.9810.3
200.0091.722.834.12
15-ADONND50.00112.812.268.62
100.0079.264.634.63
200.0074.558.626.43
1 ND-Not detected (<LOD).
Table 2. Total content of DON and its derivatives in wheat and maize in China in 2017 in this study.
CropsCompound Concentration (µg/kg) ≥1000 µg/kg/%
nRangeMeanP25–P75MedianIncidence/%
WheatDON57912.16–6436.11165.8720.68–72.8332.371003.63
3-ADON579ND1-149.491.22NDND4.15-
15-ADON579ND−24.460.20NDND0.52-
DONs57912.16–6436.11167.3021.05–75.2032.741003.63
MaizeDON606ND−4300.7175.3018.80–161.2037.799.832.97
3-ADON606ND−385.334.97NDND13.53-
15-ADON606ND−4811.06115.0615.80–152.2058.3076.400.50
DONs606ND−5036.87295.3350.45–323.24131.7499.836.44
1 ND-Not detected(<LOD).
Table 3. Frequency and levels of DON and its derivatives of wheat collected in China in 2017 in this study.
RegionCompound Concentration (µg/kg) ≥1000 µg/kg/%
nRangeMeanP25–P75MedianIncidence/%
HebeiDON11412.16–230.0245.8020.42–49.3128.61000
3-ADONND1 −11.230.28NDND1.750
15-ADONND0.10NDND00
DONs12.16–230.0246.1820.42–49.3128.601000
XinjiangDON5914.54–6436.11455.4426.91–388.9987.3810011.86
3-ADONND0.10NDND00
15-ADONND0.10NDND00
DONs14.54–6436.11455.6426.91–388.9987.3810011.86
HenanDON32812.37–1342.5160.3319.71–50.1327.071000.61
3-ADONND −149.501.41NDND4.880
15-ADONND0.1NDND00
DONs12.37–1342.5161.8419.86–52.2029.001000.61
HubeiDON11413.15–5521.202670.58674.72–4637.082848.9010072.73
3-ADONND−98.129.01NDND9.090
15-ADONND−24.465.29ND−13.77ND27.270
DONs413.15–5638.452684.87674.72–4637.082848.9010072.73
AnhuiDON2915.36–2503.08149.7321.95–77.5137.261003.45
3-ADONND−12.280.52NDND3.450
15-ADONND0.10NDND00
DONs15.36–2503.08150.3421.95–80.6437.261003.45
JiangsuDON3817.53–1817.96270.7942.96–287.1799.411007.89
3-ADONND−42.832.41NDND2.630
15-ADONND0.10NDND00
DONs17.53–1817.96273.3042.96–287.17102.211007.89
1 ND-Not detected(<LOD).
Table 4. Frequency and levels of DON and its derivatives of maize collected in China in 2017 in this study.
RegionCompound Concentration (µg/kg) ≥1000 µg/kg/%
nRangeMeanP25–P75MedianIncidence/%
JilinDON18013.78–4300.69224.1727.00–232.5675.281002.78
3-ADONND1−385.335.15NDND8.890
15-ADONND−4811.06182.20ND−234.01109.7772.221.11
DONs16.53–5036.87411.53106.50–474.66210.4710010
LiaoningDON9414.47–4258.12210.9722.33–163.9646.531004.26
3-ADONND−41.592.99NDND12.770
15-ADONND−775.6476.19ND−97.7537.3671.280
DONs17.67–4258.12290.1540.29–262.3082.471006.38
HeilongjiangDON186ND−2460.31197.1418.98–191.8043.1099.464.84
3-ADONND−258.948.41NDND22.580
15-ADONND −1032.9486.4516.63–102.1343.4977.960.54
DONsND −3752.19292.0139.03–311.88102.8799.468.06
Inner MongoliaDON12714.53–747.2361.4316.73–34.5218.611000
3-ADONND−27.561.87NDND9.450
15-ADONND−596.7699.7324.39–176.5946.6380.310
DONs14.59–984.49163.0349.67–241.7184.141000
ShandongDON1916.30–659.3883.2221.61–77.0577.051000
3-ADONND0.10NDND00
15-ADON13.71–244.8653.6929.38–52.5852.581000
DONs30.01–904.23137.0159.35–138.59138.591000
1 ND-Not detected(<LOD).
Table 5. Optimised ESI–MS/MS parameters.
Compound NamePrecursor Ion
(m/z)
Product Ion
(m/z)
Fragmentor
eV
Collision Energy
eV
Retention
Time (min)
LOD
(µg/kg)
LOQ
(µg/kg)
DON295.1265.118683.50.652.18
13886163.5
3-ADON337.130718684.20.200.49
1738684.2
15-ADON337150181214.20.200.67
2198194.2
13C-DON310.2279.119183.5
13C-3-ADON354323.118684.2
1 Quantifier ion.

