Verotoxin-1-Induced ER Stress Triggers Apoptotic or Survival Pathways in Burkitt Lymphoma Cells

 , and
, and 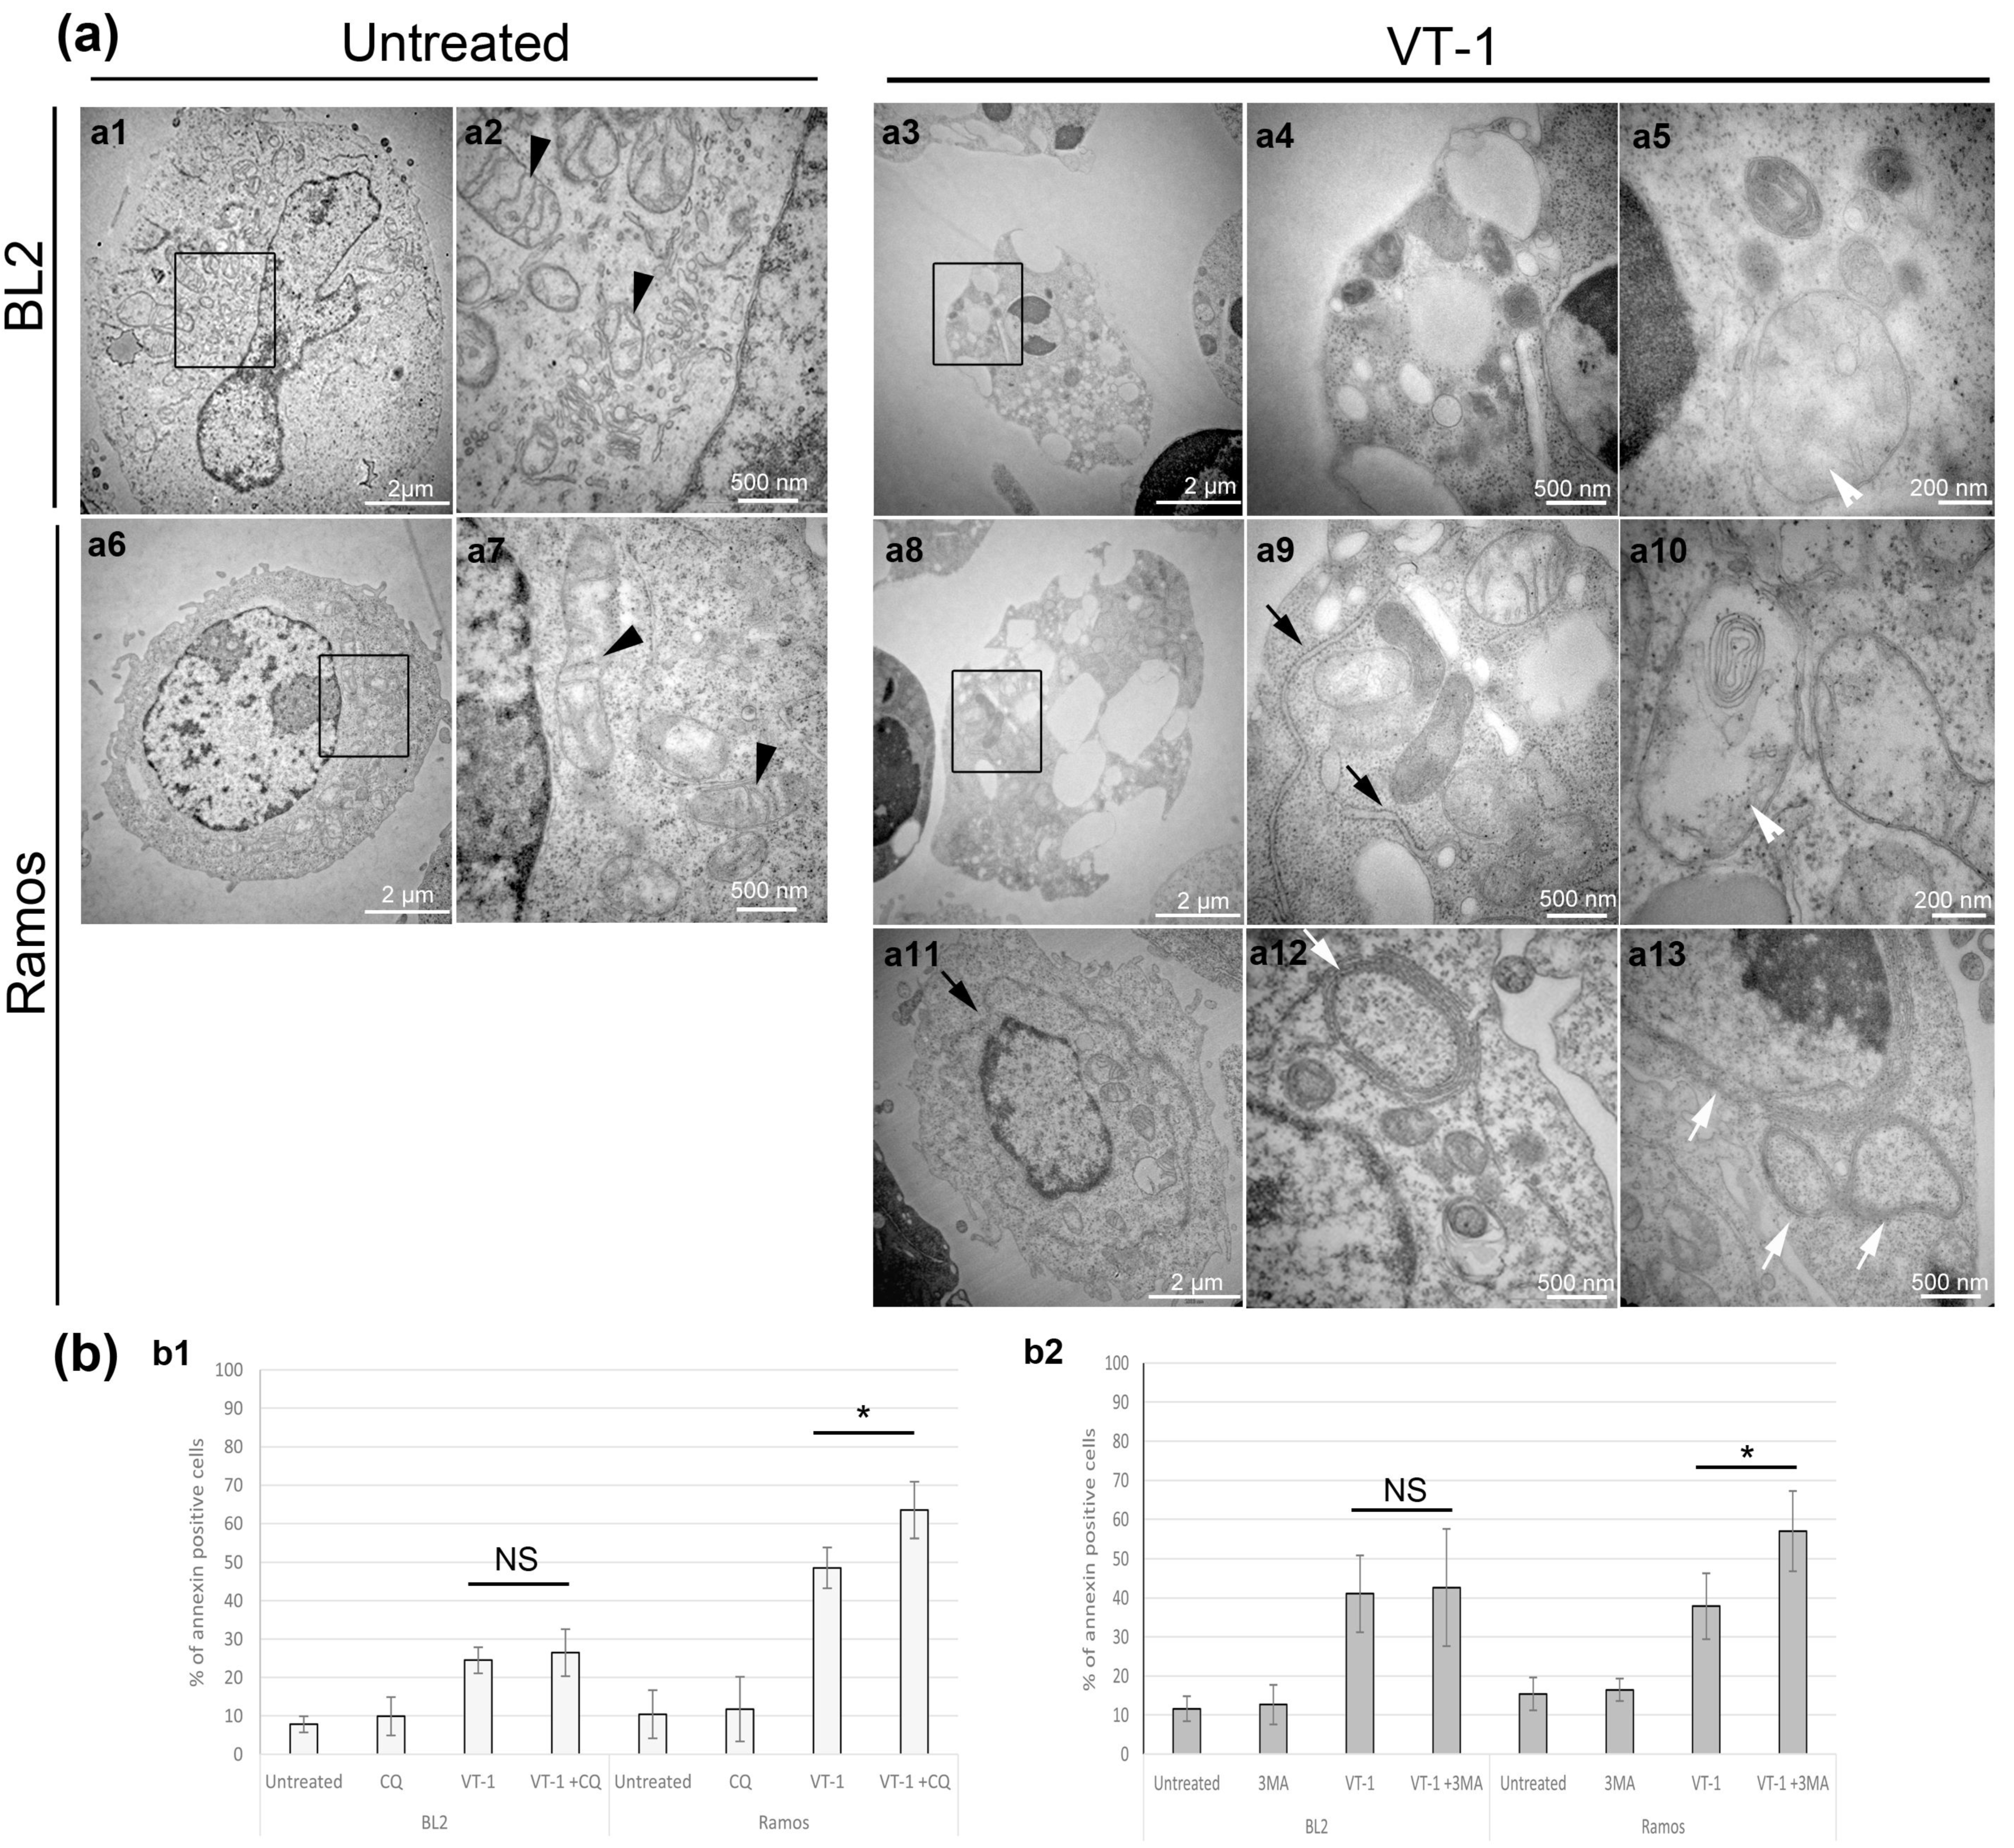
Abstract
:1. Introduction
2. Results
2.1. ER-Phagy Can Alter VT-1-Induced Apoptosis
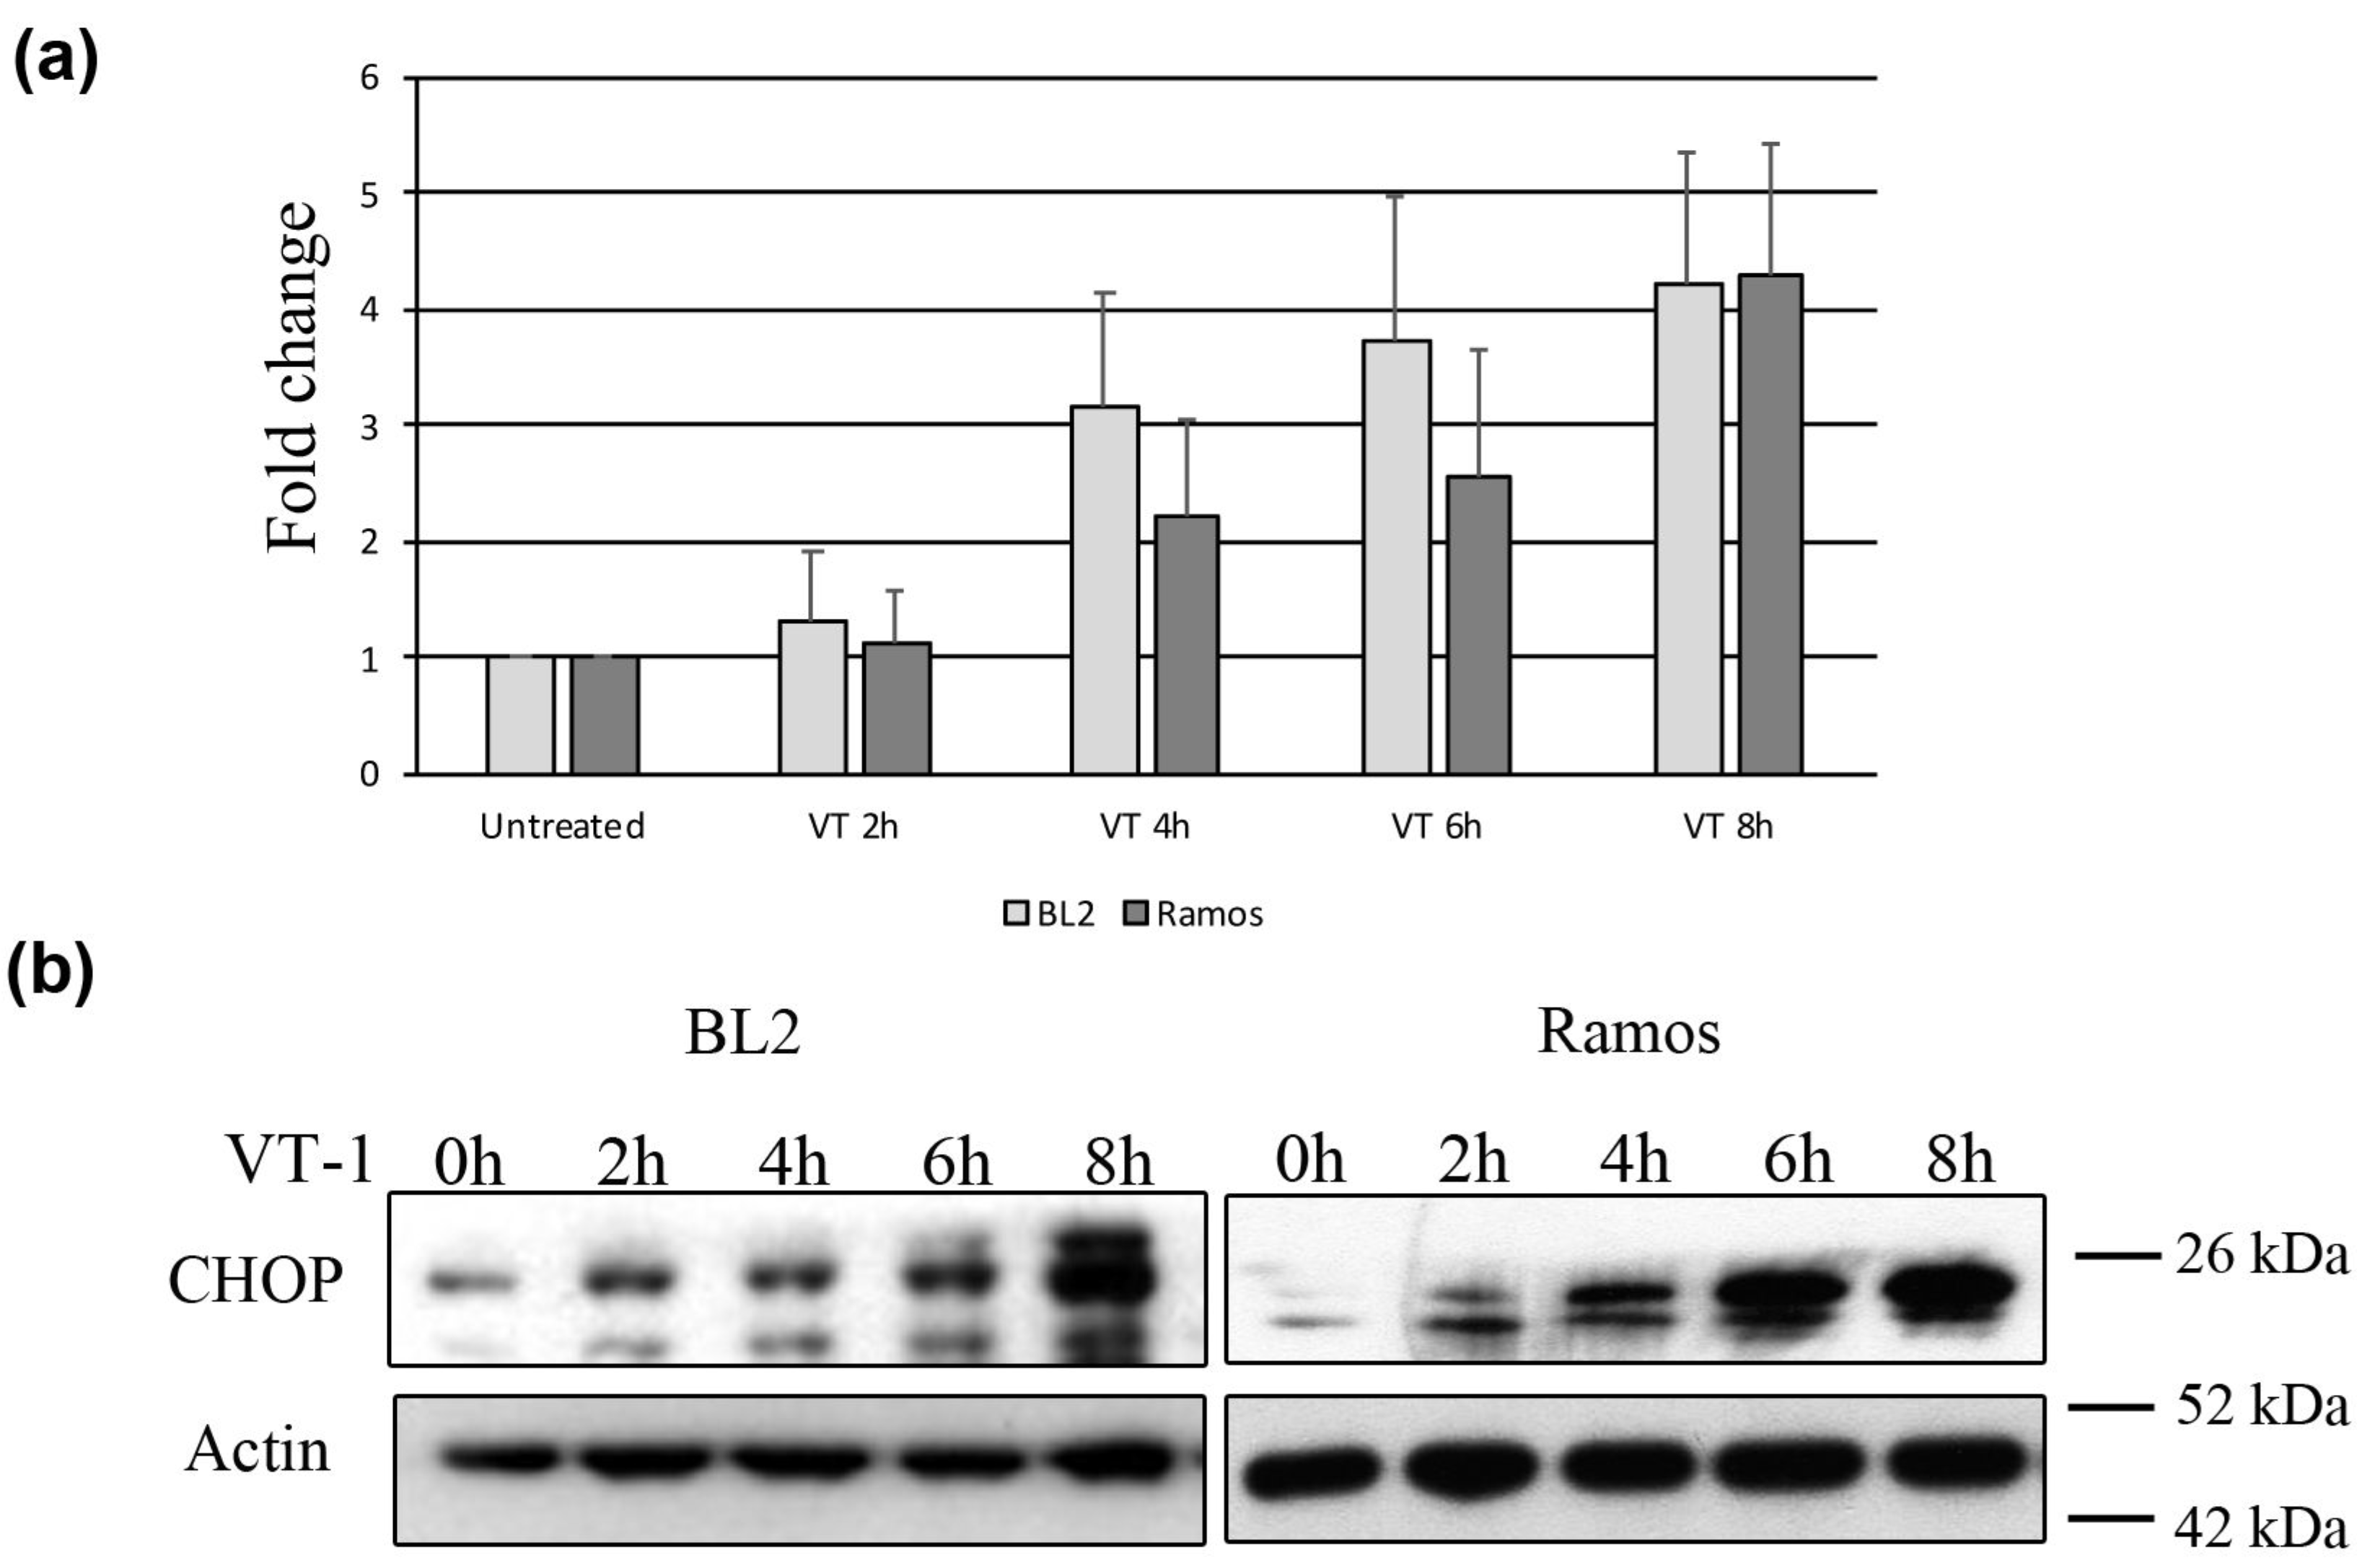
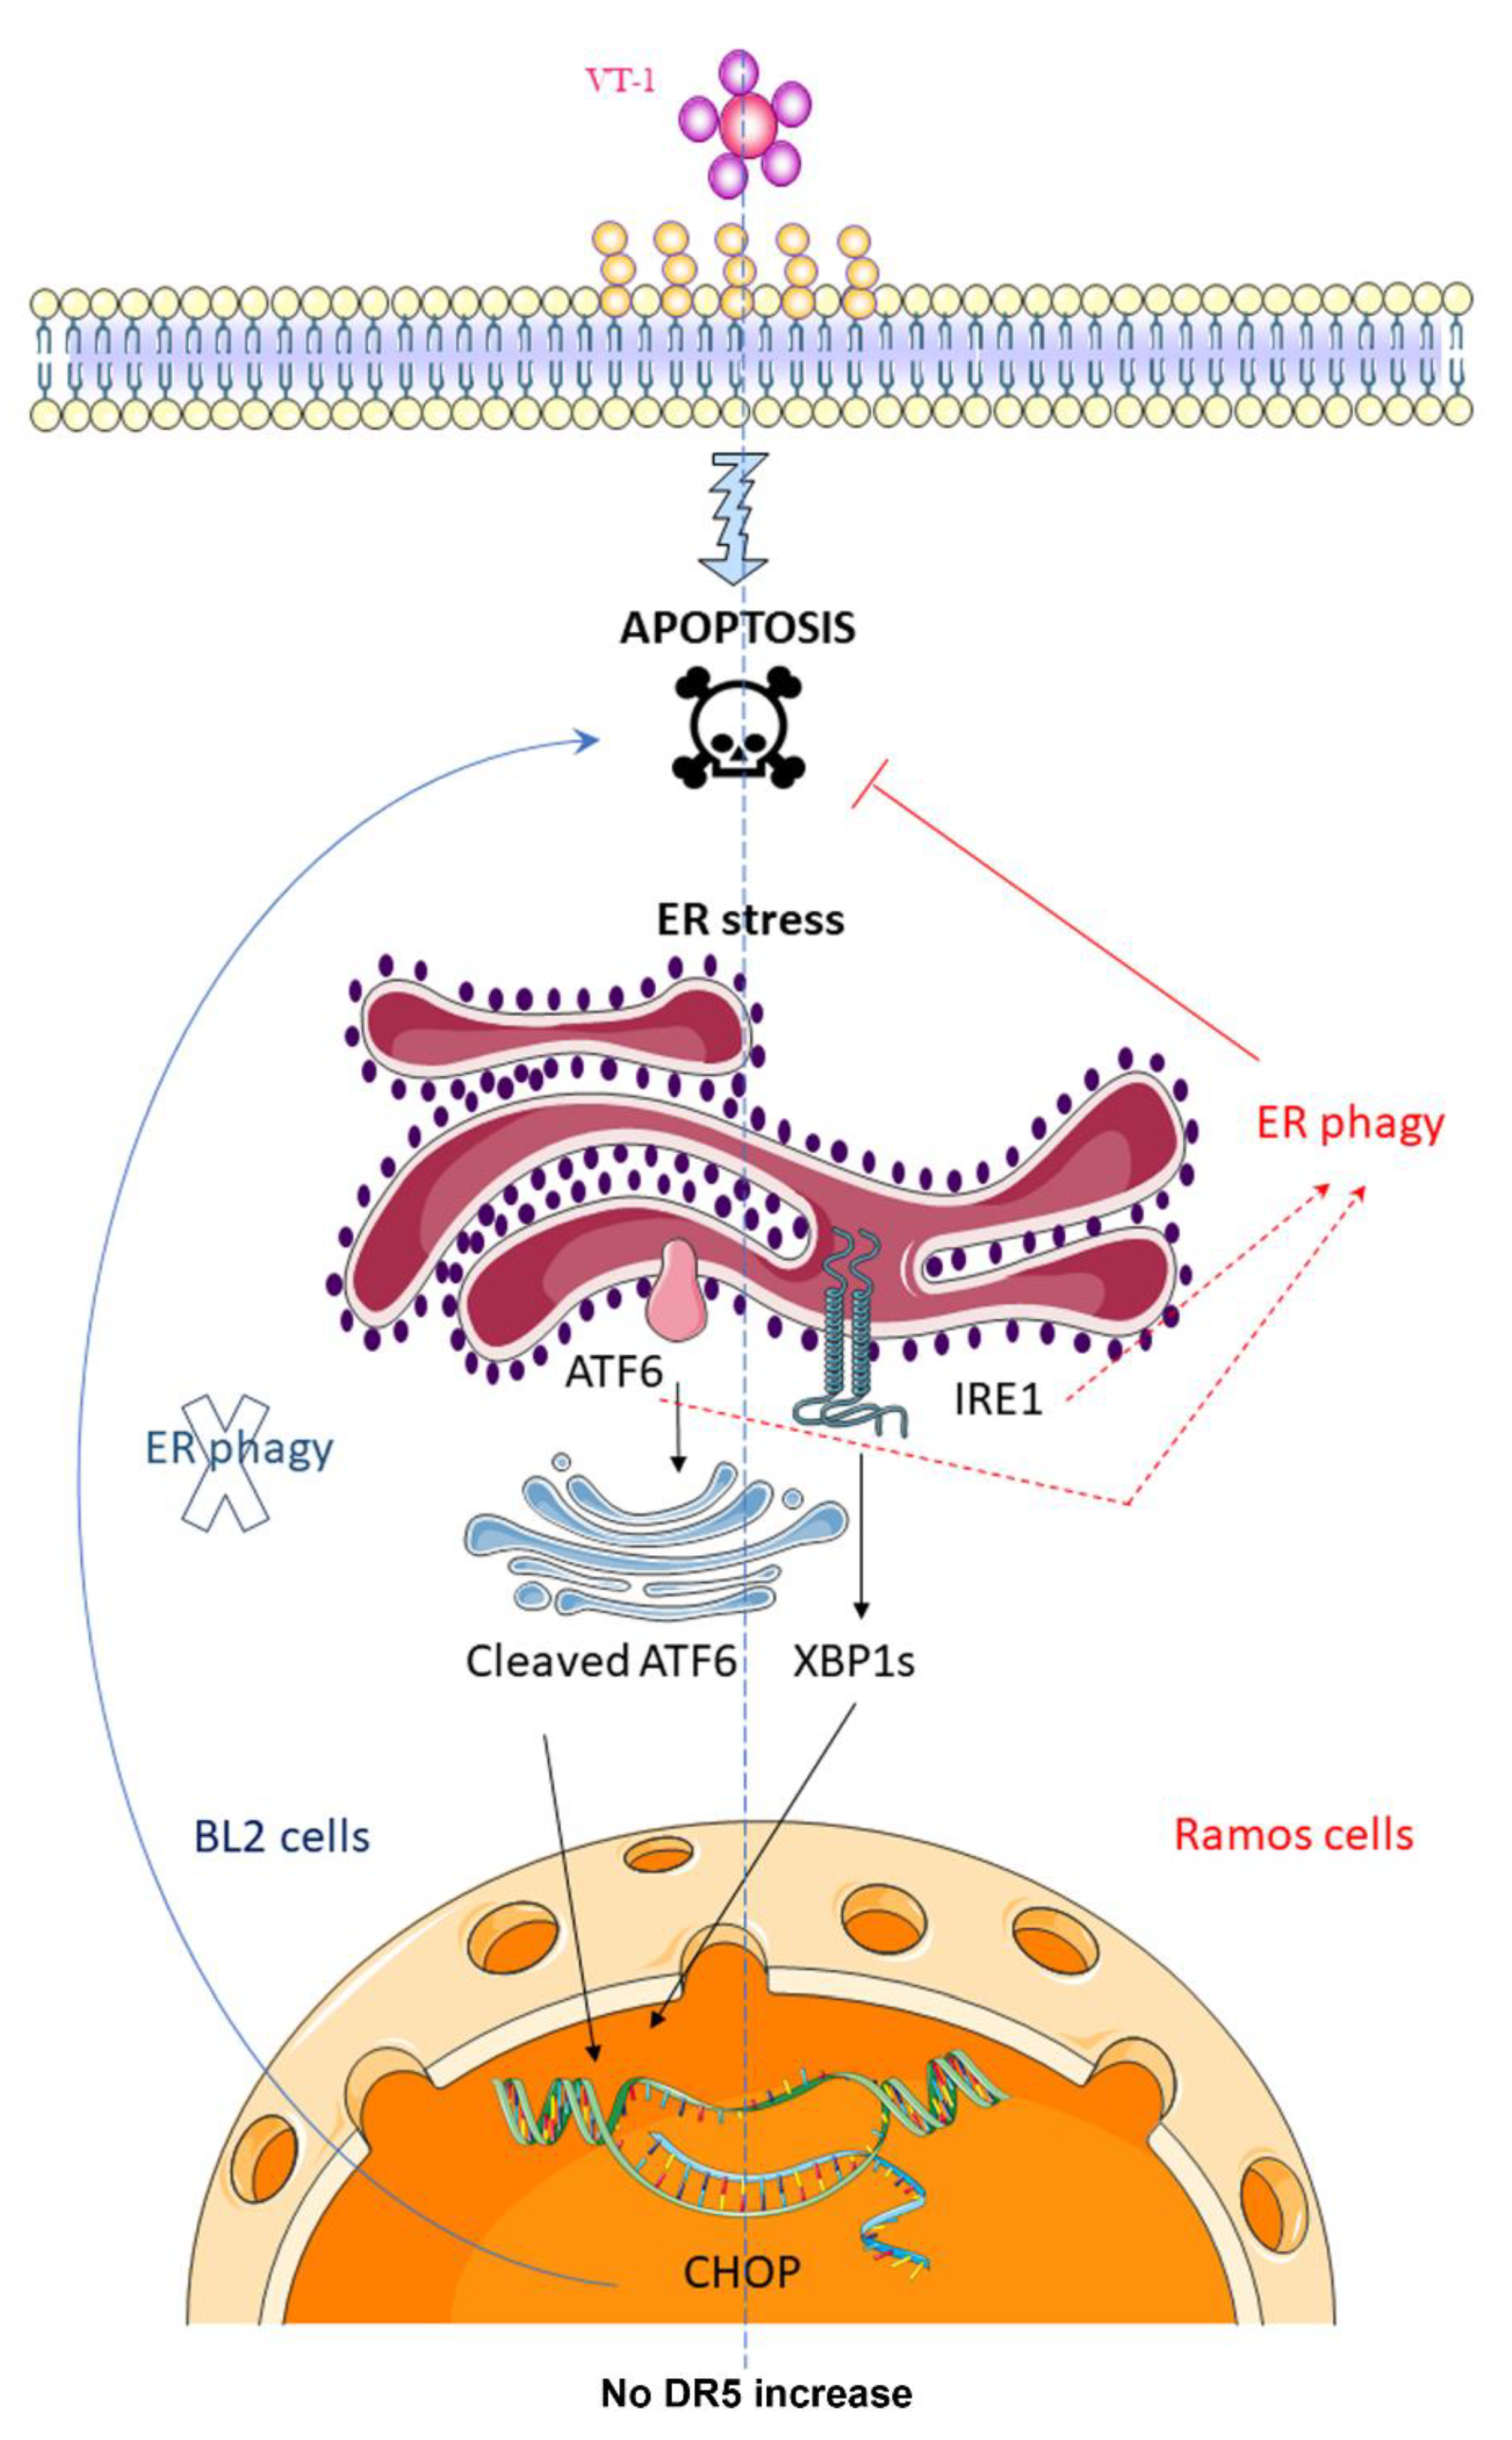
2.2. VT-1 Induces the ER Stress Response in Burkitt lymphoma Cells Though Activation of the Sensors ATF6 and IRE1
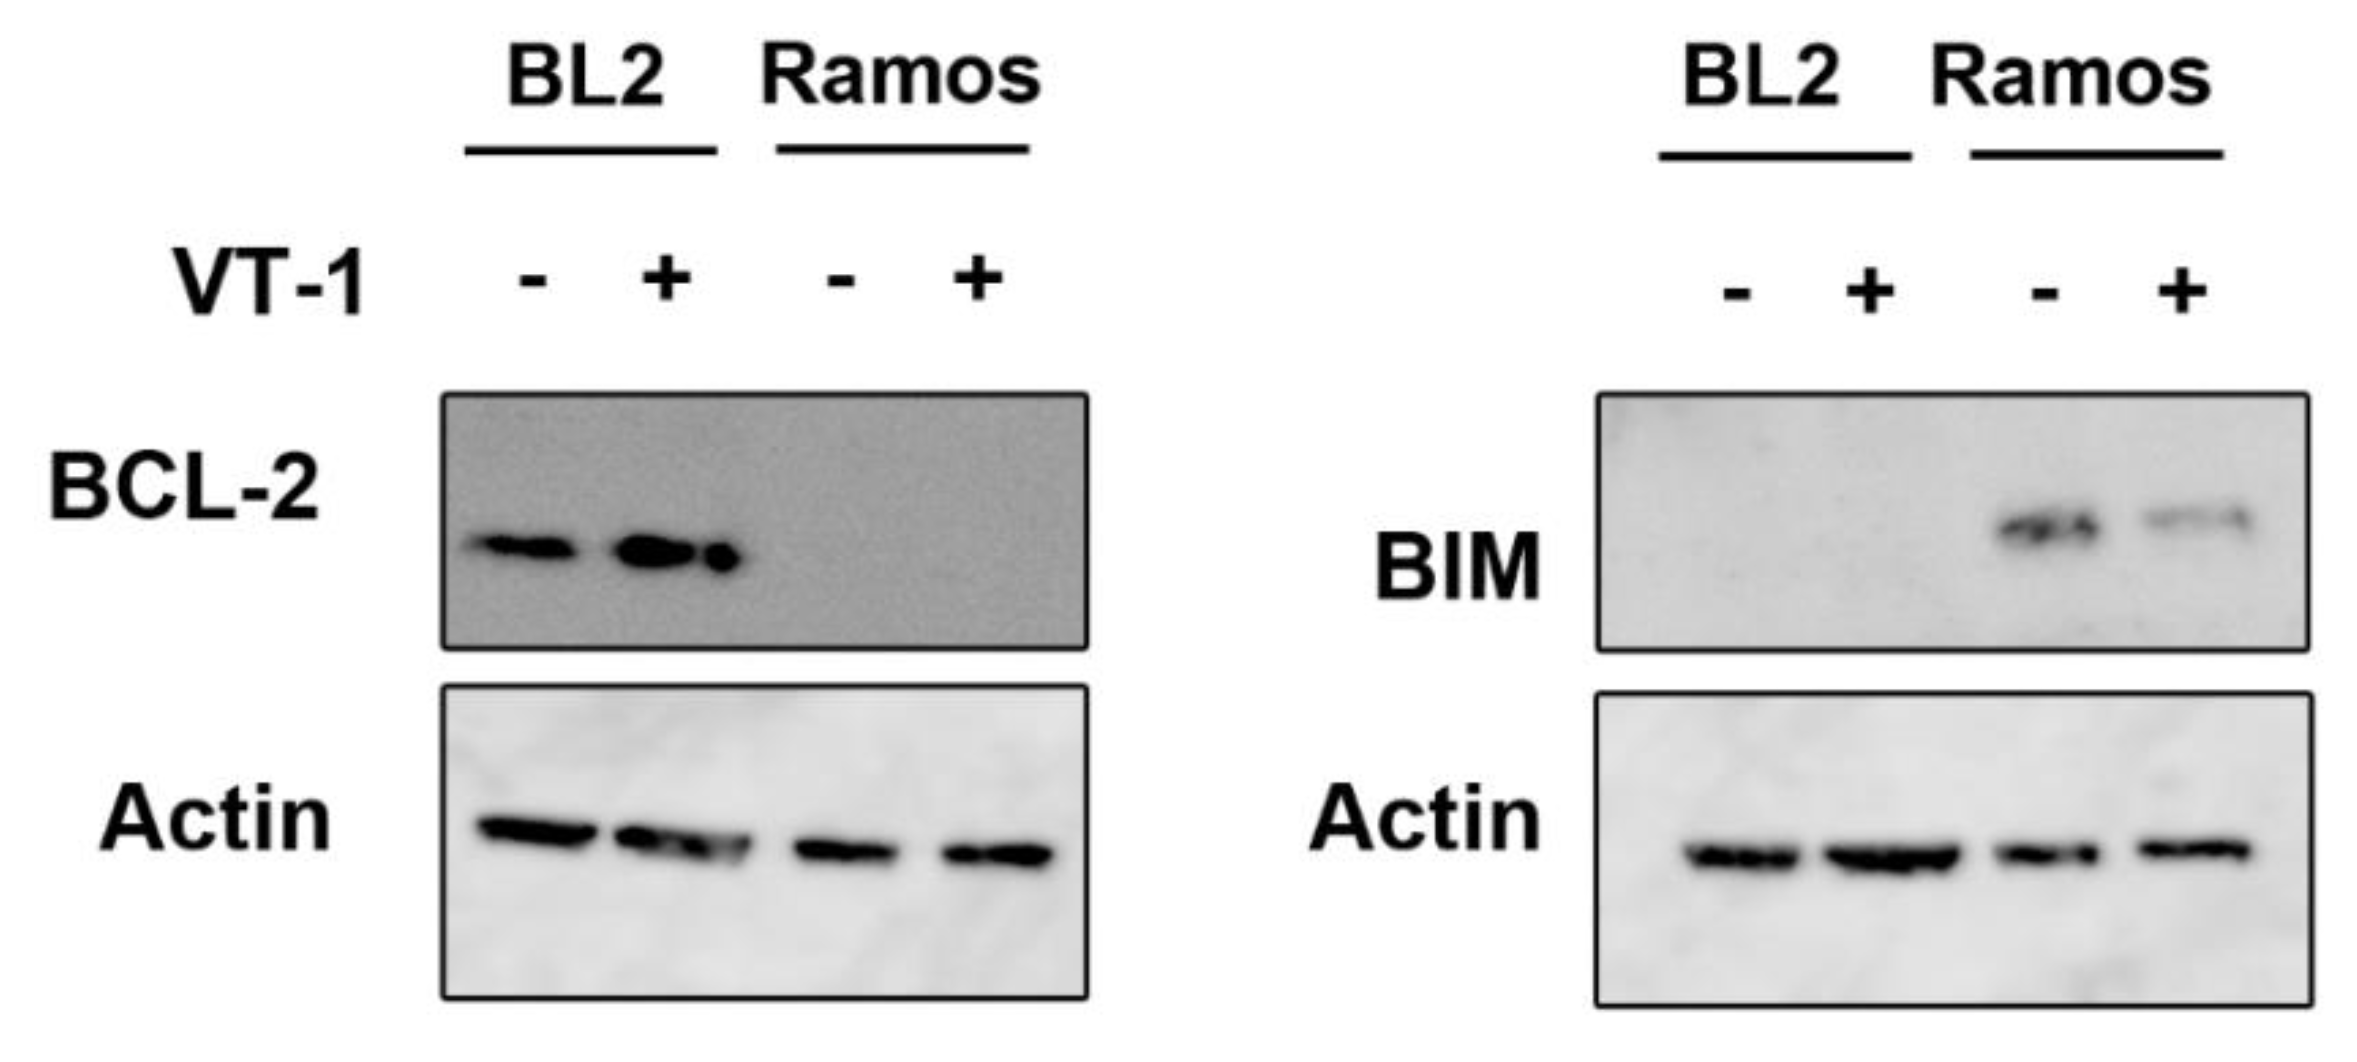
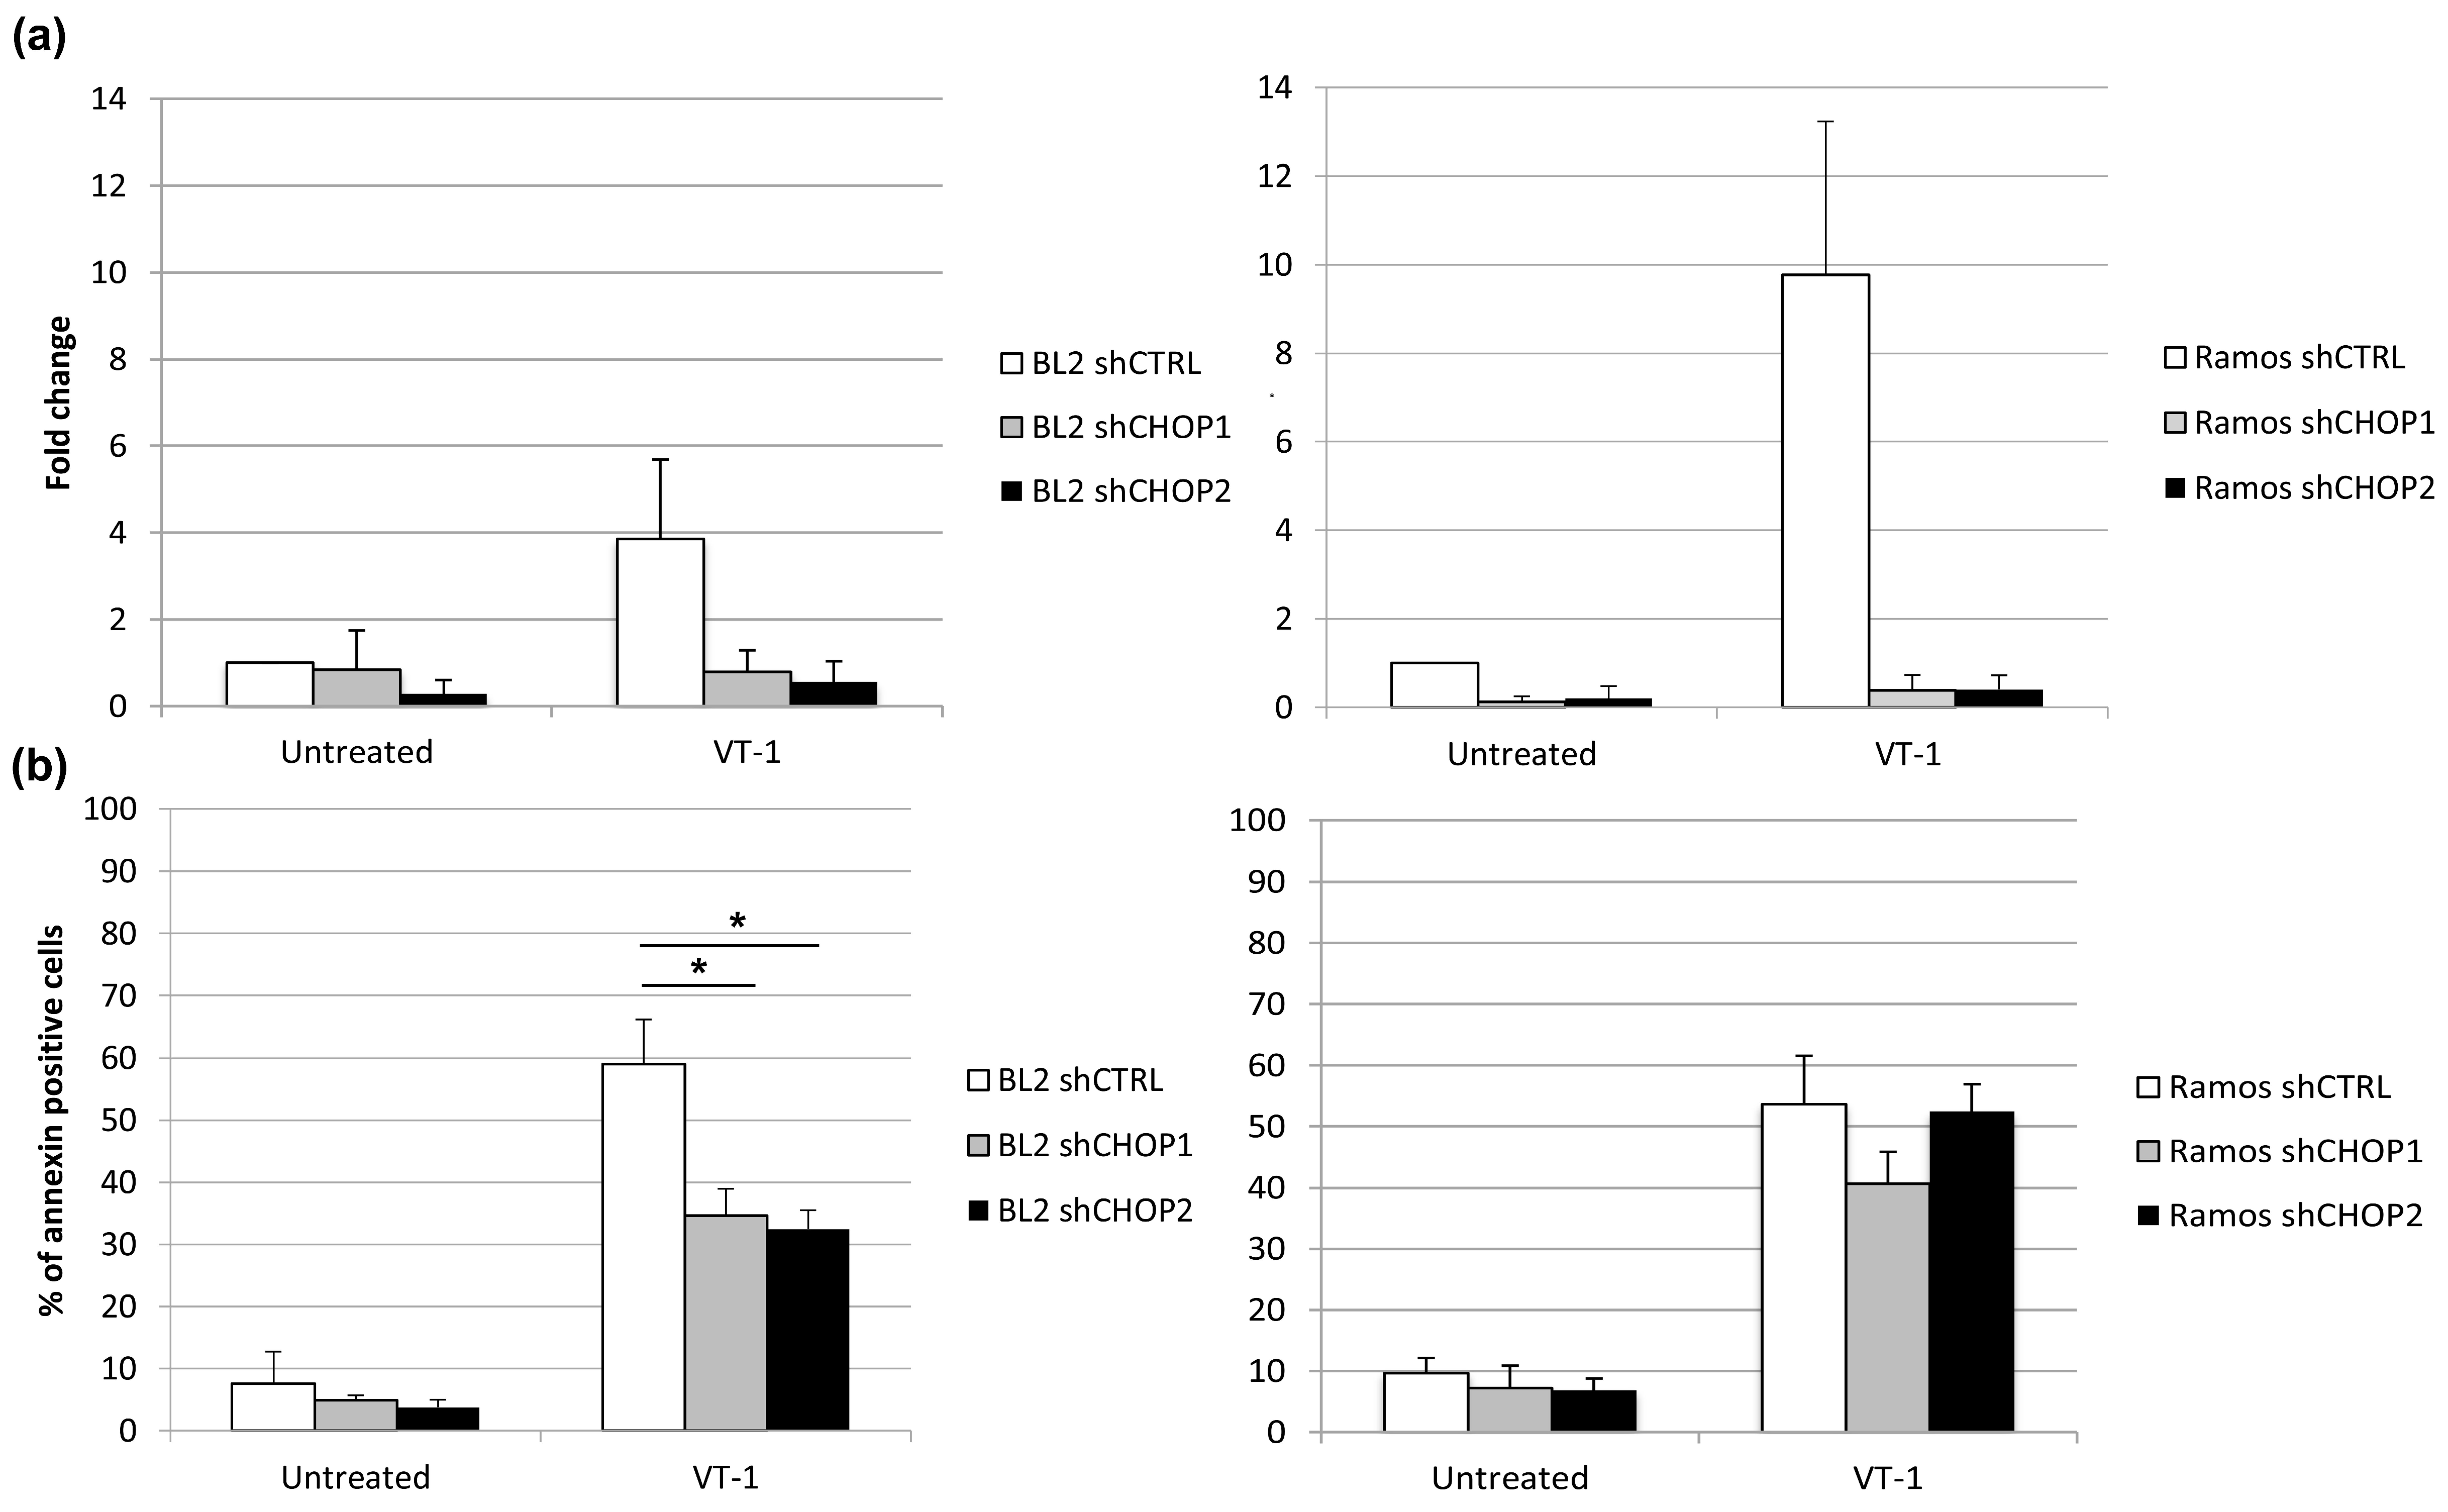
2.3. Silencing CHOP Protects BL2 but Not Ramos Cells from VT-1 Induced Apoptosis
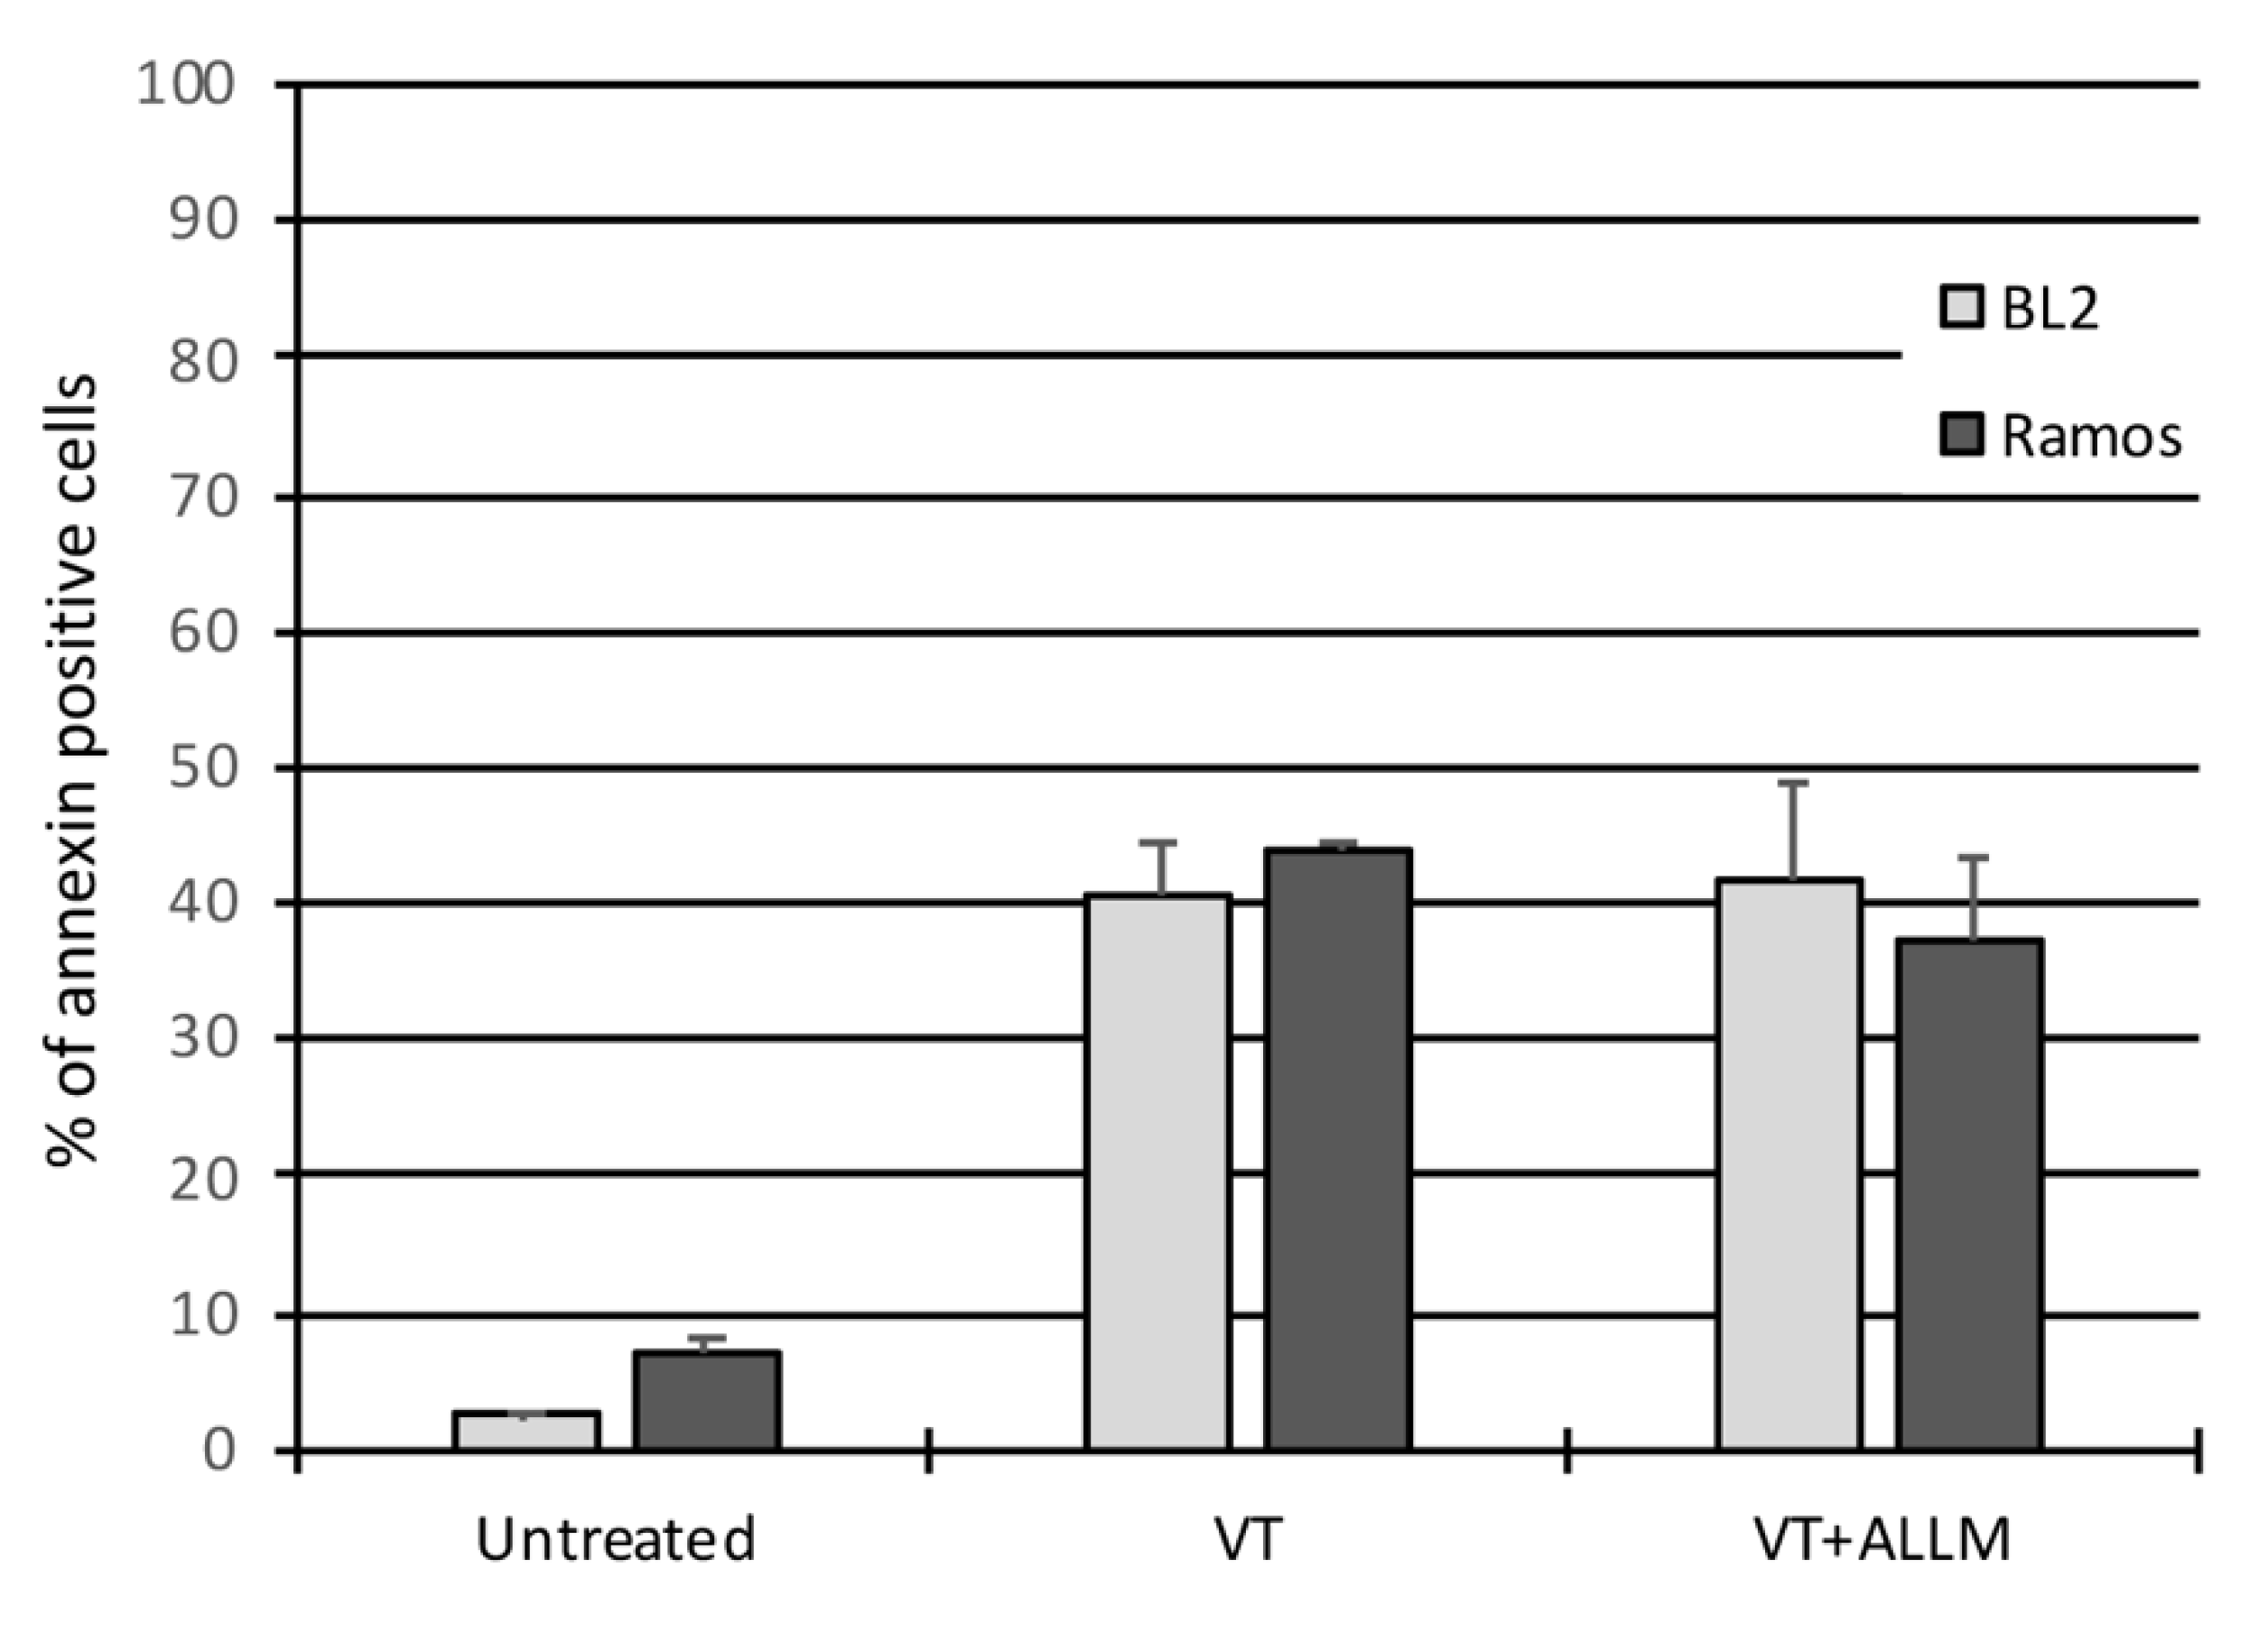
2.4. Calpain Activation Is Not Involved in VT-1-Induced Apoptosis
3. Discussion
4. Materials and Methods
4.1. Cell Lines
4.2. Total Extract Preparation
4.3. Western-Blot Analysis
4.4. Detection of XBP-1 mRNA Splicing
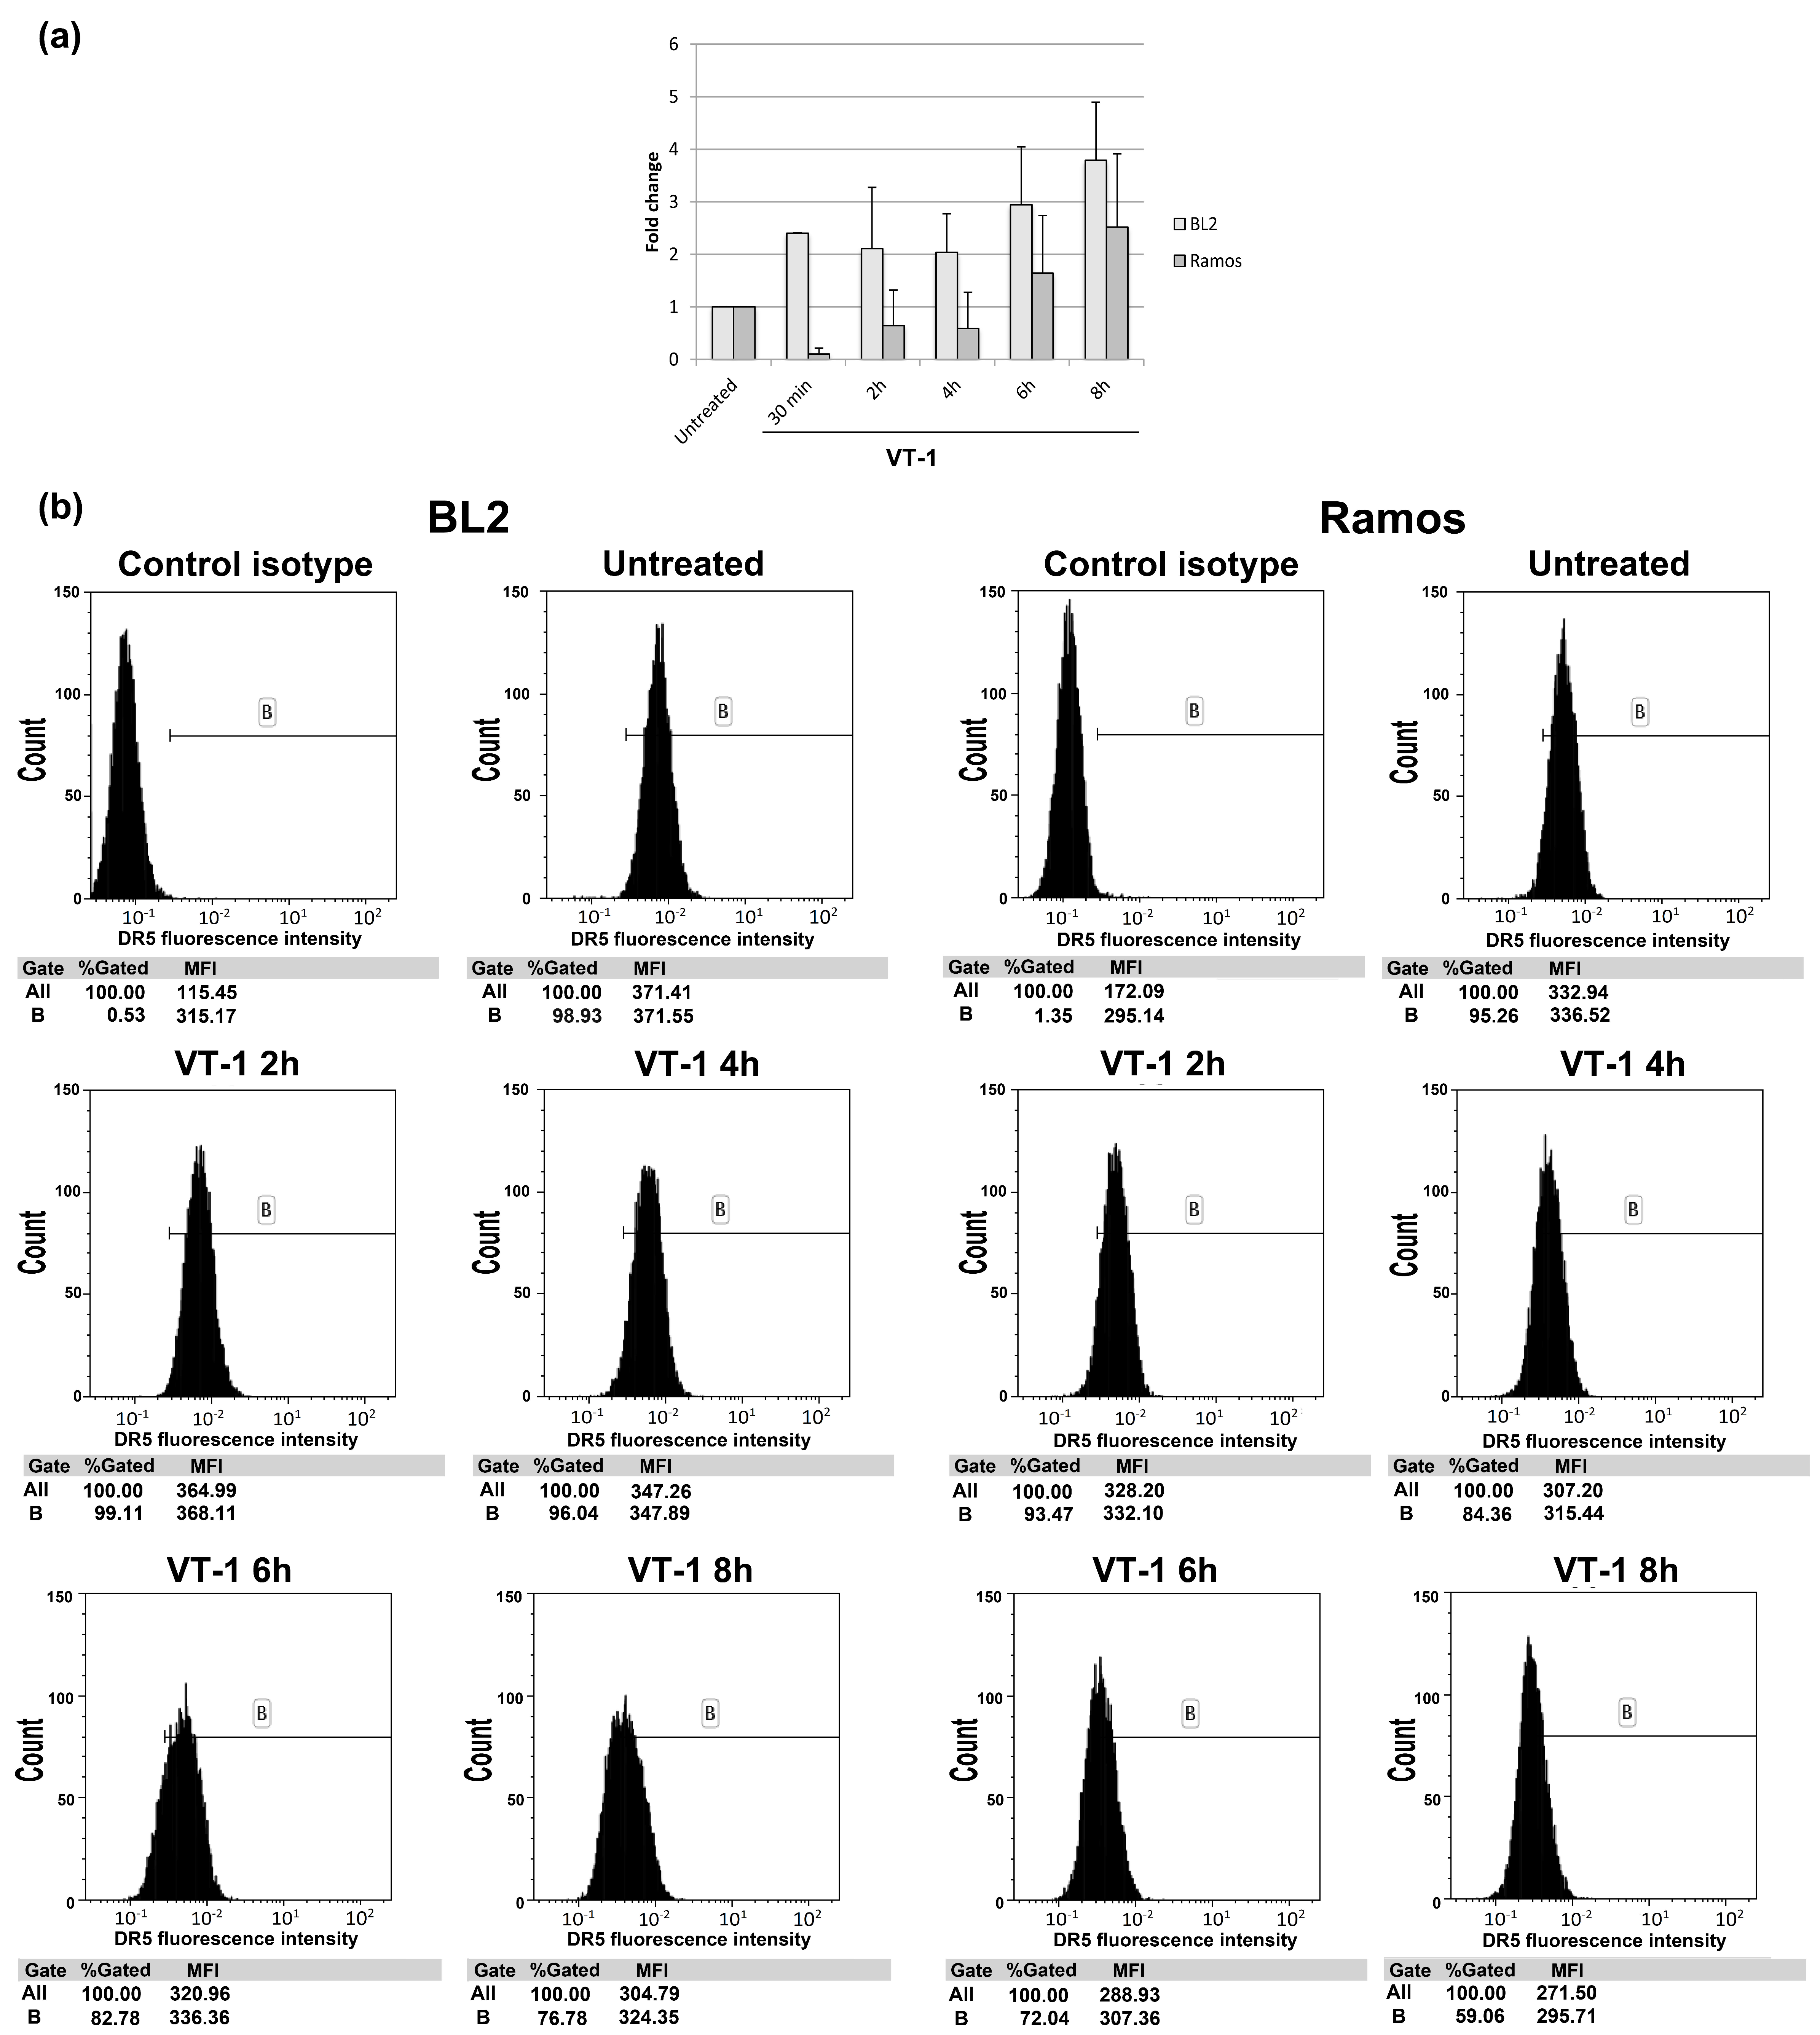
4.5. Analysis of DR5 Cell-Surface Expression
4.6. Cell Death Measurement
4.7. Electron Microscopy
4.8. Data Analysis and Statistics
Author Contributions
Funding
Acknowledgments
Conflicts of Interest
References
- Boyer, O.; Niaudet, P. Hemolytic uremic syndrome: New developments in pathogenesis and treatment. Int. J. Nephrol. 2011, 2011, 908407. [Google Scholar] [CrossRef] [Green Version]
- Joseph, A.; Cointe, A.; Mariani Kurkdjian, P.; Rafat, C.; Hertig, A. Shiga Toxin-Associated Hemolytic Uremic Syndrome: A Narrative Review. Toxins 2020, 12, 67. [Google Scholar] [CrossRef] [Green Version]
- Jacewicz, M.; Clausen, H.; Nudelman, E.; Donohue-Rolfe, A.; Keusch, G.T. Pathogenesis of shigella diarrhea. XI. Isolation of a shigella toxin-binding glycolipid from rabbit jejunum and HeLa cells and its identification as globotriaosylceramide. J. Exp. Med. 1986, 163, 1391–1404. [Google Scholar] [CrossRef] [PubMed]
- DeGrandis, S.; Law, H.; Brunton, J.; Gyles, C.; Lingwood, C.A. Globotetraosylceramide is recognized by the pig edema disease toxin. J. Biol. Chem. 1989, 264, 12520–12525. [Google Scholar] [PubMed]
- Johannes, L. Shiga Toxin-A Model for Glycolipid-Dependent and Lectin-Driven Endocytosis. Toxins 2017, 9, 340. [Google Scholar] [CrossRef] [PubMed]
- Bergan, J.; Dyve Lingelem, A.B.; Simm, R.; Skotland, T.; Sandvig, K. Shiga toxins. Toxicon 2012, 60, 1085–1107. [Google Scholar] [CrossRef]
- Nudelman, E.; Kannagi, R.; Hakomori, S.; Parsons, M.; Lipinski, M.; Wiels, J.; Fellous, M.; Tursz, T. A glycolipid antigen associated with Burkitt lymphoma defined by a monoclonal antibody. Science 1983, 220, 509–511. [Google Scholar] [CrossRef]
- Arab, S.; Russel, E.; Chapman, W.B.; Rosen, B.; Lingwood, C.A. Expression of the verotoxin receptor glycolipid, globotriaosylceramide, in ovarian hyperplasias. Oncol Res. 1997, 9, 553–563. [Google Scholar]
- Gupta, V.; Bhinge, K.N.; Hosain, S.B.; Xiong, K.; Gu, X.; Shi, R.; Ho, M.Y.; Khoo, K.H.; Li, S.C.; Li, Y.T.; et al. Ceramide glycosylation by glucosylceramide synthase selectively maintains the properties of breast cancer stem cells. J. Biol. Chem. 2012, 287, 37195–37205. [Google Scholar] [CrossRef] [Green Version]
- Ohyama, C.; Fukushi, Y.; Satoh, M.; Saitoh, S.; Orikasa, S.; Nudelman, E.; Straud, M.; Hakomori, S. Changes in glycolipid expression in human testicular tumor. Int. J. Cancer 1990, 45, 1040–1044. [Google Scholar] [CrossRef]
- Bien, T.; Perl, M.; Machmüller, A.C.; Nitsche, U.; Conrad, A.; Johannes, L.; Müthing, J.; Soltwisch, J.; Janßen, K.P.; Dreisewerd, K. MALDI-2 Mass Spectrometry and Immunohistochemistry Imaging of Gb3Cer, Gb4Cer, and Further Glycosphingolipids in Human Colorectal Cancer Tissue. Anal. Chem. 2020. [Google Scholar] [CrossRef] [PubMed]
- Engedal, N.; Skotland, T.; Torgersen, M.L.; Sandvig, K. Shiga toxin and its use in targeted cancer therapy and imaging. Microb. Biotechnol. 2011, 4, 32–46. [Google Scholar] [CrossRef]
- Lee, S.Y.; Cherla, R.P.; Caliskan, I.; Tesh, V.L. Shiga toxin 1 induces apoptosis in the human myelogenous leukemia cell line THP-1 by a caspase-8-dependent, tumor necrosis factor receptor-independent mechanism. Infect. Immun. 2005, 73, 5115–5126. [Google Scholar] [CrossRef] [PubMed] [Green Version]
- Ching, J.C.; Jones, N.L.; Ceponis, P.J.; Karmali, M.A.; Sherman, P.M. Escherichia coli shiga-like toxins induce apoptosis and cleavage of poly(ADP-ribose) polymerase via in vitro activation of caspases. Infect. Immun. 2002, 70, 4669–4677. [Google Scholar] [CrossRef] [PubMed] [Green Version]
- Mangeney, M.; Lingwood, C.A.; Taga, S.; Caillou, B.; Tursz, T.; Wiels, J. Apoptosis induced in Burkitt’s lymphoma cells via Gb3/CD77, a glycolipid antigen. Cancer Res. 1993, 53, 5314–5319. [Google Scholar] [PubMed]
- Fujii, J.; Matsui, T.; Heatherly, D.P.; Schlegel, K.H.; Lobo, P.I.; Yutsudo, T.; Ciraolo, G.M.; Morris, R.E.; Obrig, T. Rapid apoptosis induced by Shiga toxin in HeLa cells. Infect. Immun. 2003, 71, 2724–2735. [Google Scholar] [CrossRef] [PubMed] [Green Version]
- Garibal, J.; Hollville, E.; Renouf, B.; Tetaud, C.; Wiels, J. Caspase-8-mediated cleavage of Bid and protein phosphatase 2A-mediated activation of Bax are necessary for Verotoxin-1-induced apoptosis in Burkitt’s lymphoma cells. Cell Signal. 2010, 22, 467–475. [Google Scholar] [CrossRef]
- Tetaud, C.; Falguieres, T.; Carlier, K.; Lecluse, Y.; Garibal, J.; Coulaud, D.; Busson, P.; Steffensen, R.; Clausen, H.; Johannes, L.; et al. Two distinct Gb3/CD77 signaling pathways leading to apoptosis are triggered by anti-Gb3/CD77 mAb and verotoxin-1. J. Biol. Chem. 2003, 278, 45200–45208. [Google Scholar] [CrossRef] [Green Version]
- Debernardi, J.; Hollville, E.; Lipinski, M.; Wiels, J.; Robert, A. Differential role of FL-BID and t-BID during verotoxin-1-induced apoptosis in Burkitt’s lymphoma cells. Oncogene 2018, 37, 2410–2421. [Google Scholar] [CrossRef] [Green Version]
- Bertolotti, A.; Zhang, Y.; Hendershot, L.M.; Harding, H.P.; Ron, D. Dynamic interaction of BiP and ER stress transducers in the unfolded-protein response. Nat. Cell Biol. 2000, 2, 326–332. [Google Scholar] [CrossRef]
- Lee, S.Y.; Lee, M.S.; Cherla, R.P.; Tesh, V.L. Shiga toxin 1 induces apoptosis through the endoplasmic reticulum stress response in human monocytic cells. Cell Microbiol. 2008, 10, 770–780. [Google Scholar] [CrossRef]
- Lee, M.S.; Cherla, R.P.; Lentz, E.K.; Leyva-Illades, D.; Tesh, V.L. Signaling through C/EBP homologous protein and death receptor 5 and calpain activation differentially regulate THP-1 cell maturation-dependent apoptosis induced by Shiga toxin type 1. Infect. Immun. 2010, 78, 3378–3391. [Google Scholar] [CrossRef] [Green Version]
- Fujii, J.; Wood, K.; Matsuda, F.; Carneiro-Filho, B.A.; Schlegel, K.H.; Yutsudo, T.; Binnington-Boyd, B.; Lingwood, C.A.; Obata, F.; Kim, K.S.; et al. Shiga toxin 2 causes apoptosis in human brain microvascular endothelial cells via C/EBP homologous protein. Infect. Immun. 2008, 76, 3679–3689. [Google Scholar] [CrossRef] [Green Version]
- Hetz, C. The unfolded protein response: controlling cell fate decisions under ER stress and beyond. Nat. Rev. Mol. Cell Biol. 2012, 13, 89–102. [Google Scholar] [CrossRef]
- Haze, K.; Yoshida, H.; Yanagi, H.; Yura, T.; Mori, K. Mammalian transcription factor ATF6 is synthesized as a transmembrane protein and activated by proteolysis in response to endoplasmic reticulum stress. Mol. Biol. Cell 1999, 10, 3787–3799. [Google Scholar] [CrossRef] [Green Version]
- Harding, H.P.; Zhang, Y.; Bertolotti, A.; Zeng, H.; Ron, D. Perk is essential for translational regulation and cell survival during the unfolded protein response. Mol. Cell 2000, 5, 897–904. [Google Scholar] [CrossRef]
- Yoshida, H.; Matsui, T.; Yamamoto, A.; Okada, T.; Mori, K. XBP1 mRNA is induced by ATF6 and spliced by IRE1 in response to ER stress to produce a highly active transcription factor. Cell 2001, 107, 881–891. [Google Scholar] [CrossRef] [Green Version]
- McCullough, K.D.; Martindale, J.L.; Klotz, L.O.; Aw, T.Y.; Holbrook, N.J. Gadd153 sensitizes cells to endoplasmic reticulum stress by down-regulating Bcl2 and perturbing the cellular redox state. Mol. Cell Biol. 2001, 21, 1249–1259. [Google Scholar] [CrossRef] [Green Version]
- Puthalakath, H.; O’Reilly, L.A.; Gunn, P.; Lee, L.; Kelly, P.N.; Huntington, N.D.; Hughes, P.D.; Michalak, E.M.; McKimm-Breschkin, J.; Motoyama, N.; et al. ER stress triggers apoptosis by activating BH3-only protein Bim. Cell 2007, 129, 1337–1349. [Google Scholar] [CrossRef] [Green Version]
- Yamaguchi, H.; Wang, H.G. CHOP is involved in endoplasmic reticulum stress-induced apoptosis by enhancing DR5 expression in human carcinoma cells. J. Biol. Chem. 2004, 279, 45495–45502. [Google Scholar] [CrossRef] [Green Version]
- Carreras-Sureda, A.; Pihán, P.; Hetz, C. Calcium signaling at the endoplasmic reticulum: fine-tuning stress responses. Cell Calcium 2018, 70, 24–31. [Google Scholar] [CrossRef]
- Orrenius, S.; Zhivotovsky, B.; Nicotera, P. Regulation of cell death: the calcium-apoptosis link. Nat. Rev. Mol. Cell Biol. 2003, 4, 552–565. [Google Scholar] [CrossRef]
- Song, S.; Tan, J.; Miao, Y.; Zhang, Q. Crosstalk of ER stress-mediated autophagy and ER-phagy: Involvement of UPR and the core autophagy machinery. J. Cell Physiol. 2018, 233, 3867–3874. [Google Scholar] [CrossRef]
- Lee, M.S.; Cherla, R.P.; Jenson, M.H.; Leyva-Illades, D.; Martinez-Moczygemba, M.; Tesh, V.L. Shiga toxins induce autophagy leading to differential signalling pathways in toxin-sensitive and toxin-resistant human cells. Cell Microbiol. 2011, 13, 1479–1496. [Google Scholar] [CrossRef] [Green Version]
- Sandvig, K.; Garred, O.; Prydz, K.; Kozlov, J.V.; Hansen, S.H.; van Deurs, B. Retrograde transport of endocytosed Shiga toxin to the endoplasmic reticulum. Nature 1992, 358, 510–512. [Google Scholar] [CrossRef]
- Tang, B.; Li, Q.; Zhao, X.H.; Wang, H.G.; Li, N.; Fang, Y.; Wang, K.; Jia, Y.P.; Zhu, P.; Gu, J.; et al. Shiga toxins induce autophagic cell death in intestinal epithelial cells via the endoplasmic reticulum stress pathway. Autophagy 2015, 11, 344–354. [Google Scholar] [CrossRef] [Green Version]
- Ogata, M.; Hino, S.; Saito, A.; Morikawa, K.; Kondo, S.; Kanemoto, S.; Murakami, T.; Taniguchi, M.; Tanii, I.; Yoshinaga, K.; et al. Autophagy is activated for cell survival after endoplasmic reticulum stress. Mol. Cell Biol. 2006, 26, 9220–9231. [Google Scholar] [CrossRef] [Green Version]
- Wei, Y.; Pattingre, S.; Sinha, S.; Bassik, M.; Levine, B. JNK1-mediated phosphorylation of Bcl-2 regulates starvation-induced autophagy. Mol. Cell 2008, 30, 678–688. [Google Scholar] [CrossRef] [Green Version]
- Wei, Y.; Sinha, S.; Levine, B. Dual role of JNK1-mediated phosphorylation of Bcl-2 in autophagy and apoptosis regulation. Autophagy 2008, 4, 949–951. [Google Scholar] [CrossRef] [Green Version]
- Margariti, A.; Li, H.; Chen, T.; Martin, D.; Vizcay-Barrena, G.; Alam, S.; Karamariti, E.; Xiao, Q.; Zampetaki, A.; Zhang, Z.; et al. XBP1 mRNA splicing triggers an autophagic response in endothelial cells through BECLIN-1 transcriptional activation. J. Biol. Chem. 2013, 288, 859–872. [Google Scholar] [CrossRef] [Green Version]
- Bommiasamy, H.; Back, S.H.; Fagone, P.; Lee, K.; Meshinchi, S.; Vink, E.; Sriburi, R.; Frank, M.; Jackowski, S.; Kaufman, R.J.; et al. ATF6alpha induces XBP1-independent expansion of the endoplasmic reticulum. J. Cell Sci. 2009, 122, 1626–1636. [Google Scholar] [CrossRef] [PubMed] [Green Version]
- Gade, P.; Ramachandran, G.; Maachani, U.B.; Rizzo, M.A.; Okada, T.; Prywes, R.; Cross, A.S.; Mori, K.; Kalvakolanu, D.V. An IFN-gamma-stimulated ATF6-C/EBP-beta-signaling pathway critical for the expression of Death Associated Protein Kinase 1 and induction of autophagy. Proc. Natl. Acad. Sci. USA 2012, 109, 10316–10321. [Google Scholar] [CrossRef] [PubMed] [Green Version]
- Zalckvar, E.; Berissi, H.; Mizrachy, L.; Idelchuk, Y.; Koren, I.; Eisenstein, M.; Sabanay, H.; Pinkas-Kramarski, R.; Kimchi, A. DAP-kinase-mediated phosphorylation on the BH3 domain of beclin 1 promotes dissociation of beclin 1 from Bcl-XL and induction of autophagy. EMBO Rep. 2009, 10, 285–292. [Google Scholar] [CrossRef] [Green Version]
- Yoshida, H.; Haze, K.; Yanagi, H.; Yura, T.; Mori, K. Identification of the cis-acting endoplasmic reticulum stress response element responsible for transcriptional induction of mammalian glucose-regulated proteins. Involvement of basic leucine zipper transcription factors. J. Biol. Chem. 1998, 273, 33741–33749. [Google Scholar] [CrossRef] [Green Version]
- Yung, H.W.; Charnock-Jones, D.S.; Burton, G.J. Regulation of AKT phosphorylation at Ser473 and Thr308 by endoplasmic reticulum stress modulates substrate specificity in a severity dependent manner. PLoS ONE 2011, 6, e17894. [Google Scholar] [CrossRef]
- Lei, Y.; Wang, S.; Ren, B.; Wang, J.; Chen, J.; Lu, J.; Zhan, S.; Fu, Y.; Huang, L.; Tan, J. CHOP favors endoplasmic reticulum stress-induced apoptosis in hepatocellular carcinoma cells via inhibition of autophagy. PLoS ONE 2017, 12, e0183680. [Google Scholar] [CrossRef] [Green Version]
- Lee, Y.S.; Lee, D.H.; Choudry, H.A.; Bartlett, D.L.; Lee, Y.J. Ferroptosis-Induced Endoplasmic Reticulum Stress: Cross-talk between Ferroptosis and Apoptosis. Mol. Cancer Res. 2018, 16, 1073–1076. [Google Scholar] [CrossRef] [Green Version]
- Iurlaro, R.; Muñoz-Pinedo, C. Cell death induced by endoplasmic reticulum stress. FEBS J. 2016, 283, 2640–2652. [Google Scholar] [CrossRef] [Green Version]
- Betz, J.; Dorn, I.; Kouzel, I.U.; Bauwens, A.; Meisen, I.; Kemper, B.; Bielaszewska, M.; Mormann, M.; Weymann, L.; Sibrowski, W.; et al. Shiga toxin of enterohaemorrhagic Escherichia coli directly injures developing human erythrocytes. Cell Microbiol. 2016, 18, 1339–1348. [Google Scholar] [CrossRef] [Green Version]


© 2020 by the authors. Licensee MDPI, Basel, Switzerland. This article is an open access article distributed under the terms and conditions of the Creative Commons Attribution (CC BY) license (http://creativecommons.org/licenses/by/4.0/).
Share and Cite
Debernardi, J.; Pioche-Durieu, C.; Le Cam, E.; Wiels, J.; Robert, A. Verotoxin-1-Induced ER Stress Triggers Apoptotic or Survival Pathways in Burkitt Lymphoma Cells. Toxins 2020, 12, 316. https://0-doi-org.brum.beds.ac.uk/10.3390/toxins12050316
Debernardi J, Pioche-Durieu C, Le Cam E, Wiels J, Robert A. Verotoxin-1-Induced ER Stress Triggers Apoptotic or Survival Pathways in Burkitt Lymphoma Cells. Toxins. 2020; 12(5):316. https://0-doi-org.brum.beds.ac.uk/10.3390/toxins12050316
Chicago/Turabian StyleDebernardi, Justine, Catherine Pioche-Durieu, Eric Le Cam, Joëlle Wiels, and Aude Robert. 2020. "Verotoxin-1-Induced ER Stress Triggers Apoptotic or Survival Pathways in Burkitt Lymphoma Cells" Toxins 12, no. 5: 316. https://0-doi-org.brum.beds.ac.uk/10.3390/toxins12050316