Reducing Ochratoxin A Content in Grape Pomace by Different Methods

Department of Family and Consumer Sciences, North Carolina Agricultural and Technical State University, Greensboro, NC 27411, USA
*
Author to whom correspondence should be addressed.
Toxins 2020, 12(7), 424; https://0-doi-org.brum.beds.ac.uk/10.3390/toxins12070424
Submission received: 25 May 2020
/
Revised: 24 June 2020
/
Accepted: 25 June 2020
/
Published: 27 June 2020
(This article belongs to the Collection Strategies to Minimising Mycotoxin Contamination in Foods and Feeds)
Abstract
:Grape pomace (GP) is the residue of grapes after wine making and is a valuable source of dietary polyphenol and fiber for health promotion. However, studies found the presence of ochratoxin A (OTA) in GP at very high concentrations, which raises a safety issue in the value-added utilization of GP. This study evaluated the effects of thermal pressure, baking, acid and enzymatic treatments on OTA content in GP. Thermal pressure treatment was conducted with wet GP at 121 °C for 10–30 min in an autoclave; acid treatments were conducted with hydrochloric acid, acetic acid, citric acid, and lactic acid, respectively, at 50 °C for 24 h. Baking was conducted using a cookie model. For enzymatic treatment, purified OTA solution was treated with carboxypeptidase A, alcalase, flavourzyme, pepsin, and lipase, respectively, and the effective enzymes were selected to treat GP. Results show that autoclaving for 10–30 min reduced 19–80% of OTA, varying with treatment time and GP variety. The effectiveness of acid treatment was similar to that of autoclaving and varied with acid type and GP variety. Baking increased the detectable OTA. Among all tested enzymes, carboxypeptidase A was the most effective in reducing OTA, followed by lipase and flavourzyme, but their effects were significantly lower in GP samples.
Keywords:
ochratoxin A; OTA reduction; thermal pressure treatment; acid treatment; enzymatic treatmentKey Contribution: This study demonstrates that the OTA content in wet GP can be reduced to a safe level by thermal pressure processing; such as pressure cooking/steaming; or acid treatment. This is important to ensure food and feed safety if grape pomace is to be used as an ingredient.
1. Introduction
Grapes are subject to mold contamination during cultivation, harvest, transport and/or storage. Molded grapes present a safety issue to products derived from grapes because of the presence of mycotoxins. The major mycotoxin in molded grapes is ochratoxin A (OTA) [1,2]. The most relevant OTA-producing species are Penicillium verrucosum (P. verrucosum), Aspergillus ochraceus (A. ochraceus), A. niger and A. carbonarius due to their prevalence in foodstuffs (cereals, grapes, coffee, etc.) [3]. Grape pomace is the residue of grapes after wine making and is a valuable source of phenolic antioxidants, dietary fiber and polyunsaturated lipids. Some of our studies show that GP has great potential to serve as an ingredient in food products such as bread, extruded breakfast and cookies at concentrations up to 5% (dry base) [4,5,6]. There is also increasing interest in using GP as a feed ingredient [7,8,9]. However, previous studies also found the presence of OTA-producing fungi (including Aspergilus niger, A. carbonarius, and A. fumigatus) and a high level of OTA in both wet and dry GP, which makes GP unsafe for human and animal consumption [10,11].
Dietary exposure to OTA represents a serious health issue and has been associated with several human and animal diseases, including poultry ochratoxicosis, porcine nephropathy, human endemic nephropathies and urinary tract tumors in humans [12]. Livestock consuming OTA-contaminated feed showed pale and grossly enlarged kidney, fatty liver in poultry, altered performance including decreased feed consumption, reduced weight gain, and decreased egg production; the intake of feeds contaminated by OTA was the probable cause of a disease named Denmark nephropathy in pigs. The sensitivities of livestock animals to OTA are in the order of pigs and dogs > poultry > calves > mature cattle [13,14]. In humans, various studies have linked OTA exposure with the human diseases Balkan endemic nephropathy (BEN) and chronic interstitial nephropathy (CIN), as well as other renal diseases [15]. New data available since the last risk assessment conducted by the European Food Safety Authority (EFSA) in 2006 suggest that OTA can be genotoxic by directly damaging DNA, and experts have also confirmed that OTA can be carcinogenic to the kidney [16].
Many countries have set limits for OTA, and concentrations need to be reduced to as low as technologically possible in food and feed. For example, in the European Union, a general maximum OTA limit is 5 µg/kg in cereals, 3 µg/kg in processed cereal products, and 10 µg/kg in dry vine fruits [17]. China’s OTA standard for cereal grains and legumes is 5 µg/kg [18]. The proposed Canadian OTA regulatory guide is the same as that established in Europe [19]. Likewise, Israel has applied a 50 µg/kg OTA standard to all cereals and pulses. Switzerland’s OTA standard is 2 µg/kg for all cereal products. Currently, the United States Food and Drug Administration (FDA) has not set regulatory guidelines for OTA in food or feed.
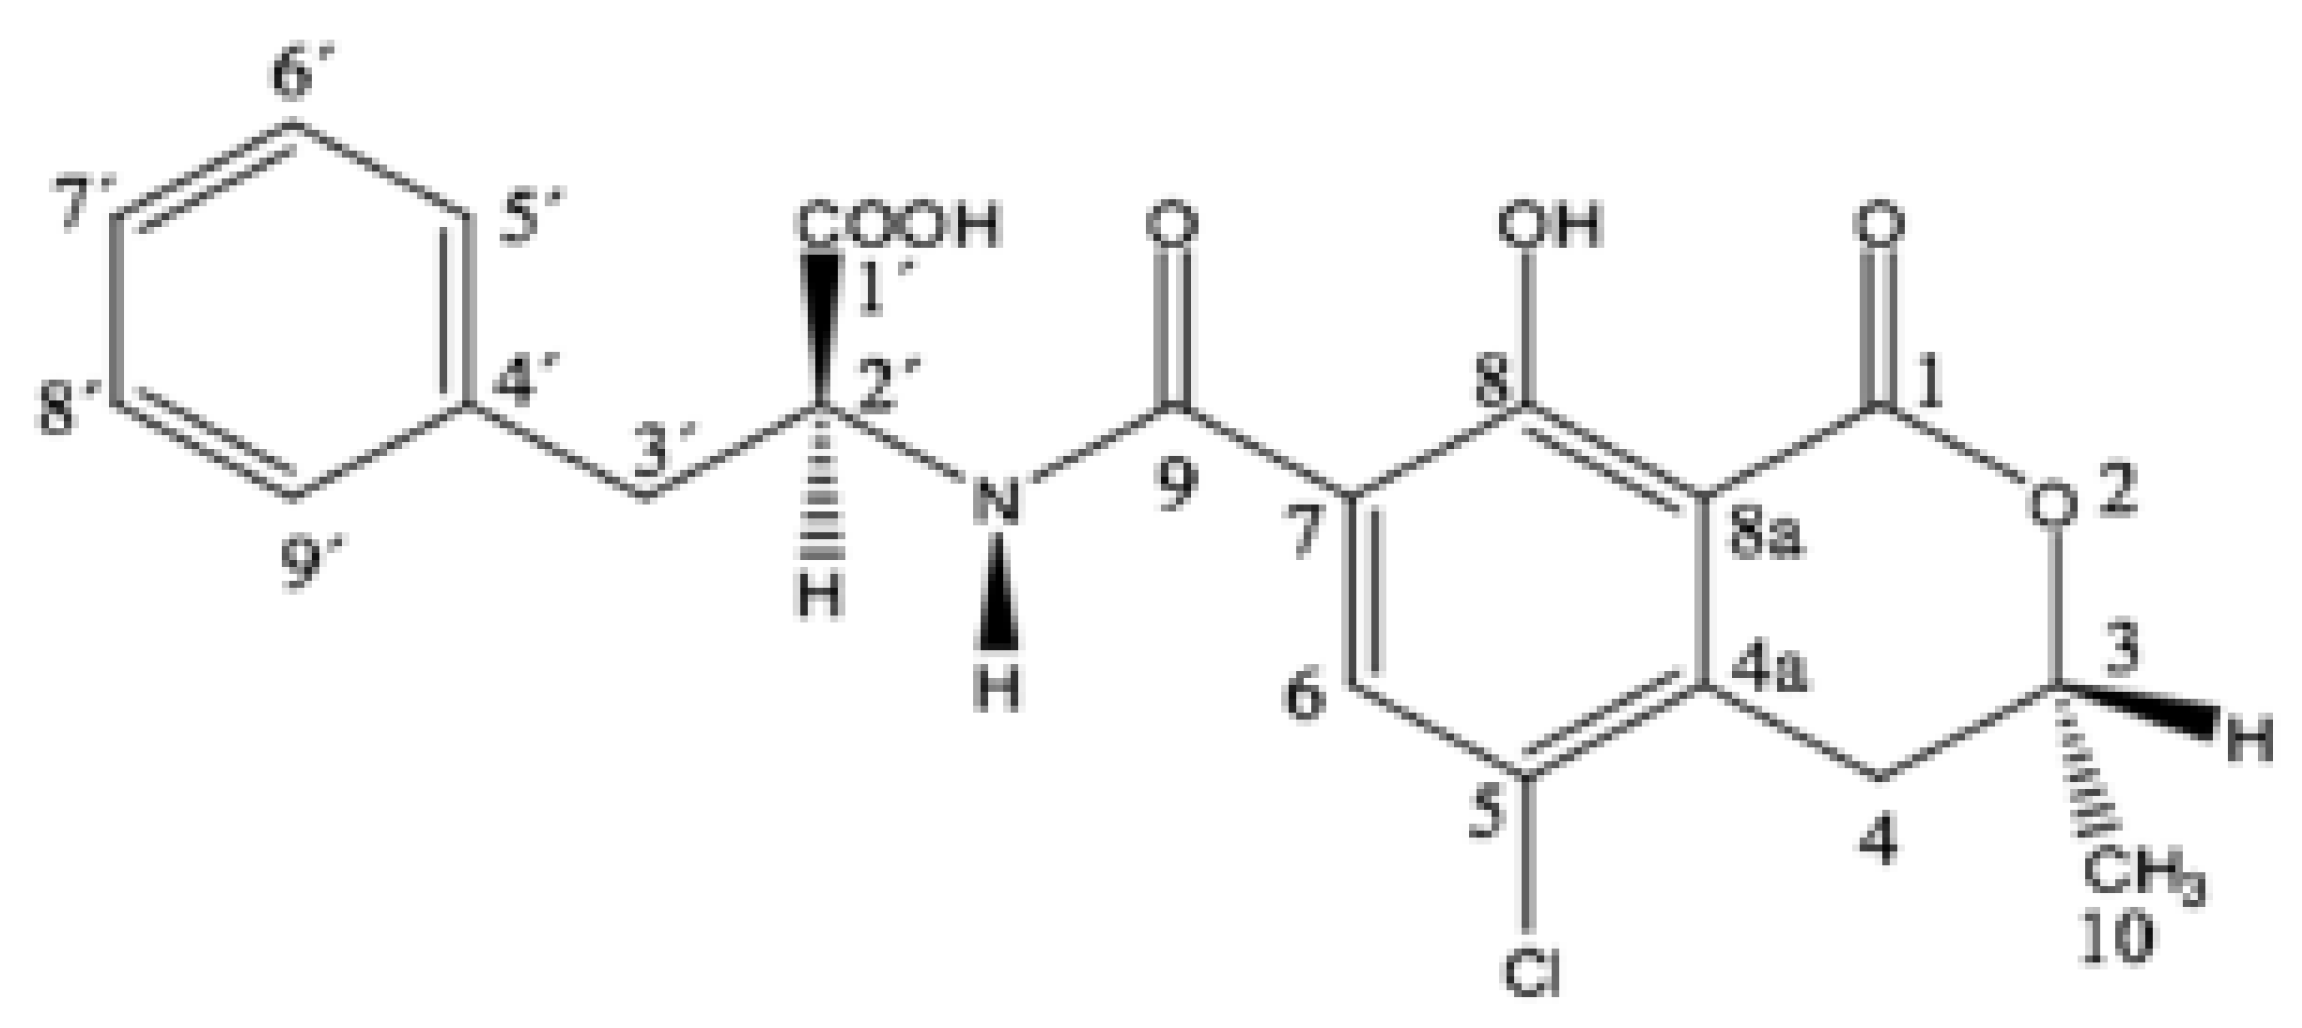
Structurally, OTA consists of a para-chlorophenolic group containing a dihydroisocoumarin moiety that is amide-linked to L-phenylalanine. Its chemical name is L-phenylalanine-N-[(5-chloro-3, 4-dihydro-8-hydroxy-3-methyl-1-oxo-1H-2-benzopyrane-7-yl) carbonyl]-(R)-isocoumarin, and its chemical structure is shown below (Figure 1) [20,21].
Although the most important strategy to control OTA level in food and feed is to prevent fungal growth and OTA production, detoxification becomes necessary if the food and feed materials are contaminated, in order to protect human and animal health, reduce food/feed waste, and even for safe disposal. For cereal grains and legumes, each physical processing step, such as sorting, sieving, floatation, washing, dehulling, milling, and heat treatment (such as cooking and roasting) can remove a certain amount of OTA [22,23]. The reported thermal transformation/degradation products of OTA are 2R’-OTA (called 14-(R)-ochratoxin A in the past), 14-decarboxy-ochratoxin A (DC-OTA) and ochratoxin alpha amide [24]. It was reported that gamma irradiation from 2 to 5 kGy effectively prevented the production of OTA or destroyed it when already produced, and carboxypeptidase at 5 units/50 mL in a liquid medium is very efficient for cleaving the OTA already produced [25]. Researchers have also discovered a good many microorganisms that could degrade and/or adsorb OTA, including actinobacteria, bacteria, filamentous fungi, and yeast; the degradation of OTA to non-toxic or less toxic OTα via the hydrolysis of the amide bond is the most important OTA biodegradation mechanism [26]. However, detoxification by microorganisms will cause unavoidable biochemical changes in food and feed stuff due to fermentation.
As a byproduct of grape processing, GP would theoretically have a higher mycotoxin level than the processed products, as in the case of brans of cereal grains [27,28]. Although our previous study demonstrated that vacuum drying not only inactivated molds, but also significantly reduced OTA content in GP [11], research on how to reduce OTA in GP is limited. Therefore, it is important to develop effective methods to destroy molds and transform OTA into less toxic or non-toxic compounds before the GP is added into food formulas to ensure food safety. This study investigated the effectiveness of some common food processing methods, including thermal pressure treatment, acid treatment, baking under slight alkaline conditions and enzymatic treatment on the OTA content of GP.
2. Results and Discussion
2.1. Effects of Thermal Pressure Treatment on the OTA Contents of Grape Pomace
OTA was detected in all the tested grape pomace samples. The levels of OTA were 13–28 μg/kg in the wet pomaces, corresponding to 26–100 μg/kg in dry pomace. This is higher than the maximal allowance in raisin products (10 μg/kg) in Europe [17]. Thermal pressure treatment, which was conducted in an autoclave at 15 psi and 121 °C, significantly reduced total OTA content in grape pomace samples and the degree of OTA reduction was dependent on autoclaving time; the highest OTA reduction for most of the GP samples was achieved at 20 min (Figure 2). Among seven GP samples, the OTA contents of six samples were lower than 10µg/kg GP, which is lower than the maximum allowance in raisin. The efficiency of autoclave on OTA reduction varied with the type of GP (Table 1). The OTA reductions at treatment times of 10, 20 and 30 min were 19.21–67.87%, 37.64–79.88% and 43.77–78.01%, respectively.
The presence of amide bonds in the chemical structure of OTA makes it possible to breakdown this bond to form L-phenylalanine and the less-toxic ochratoxin α by different methods, although OTA has been reported to be stable to heat and acidic conditions [29]. It is known that the thermal degradation products of OTA are 14-(R)-ochratoxin A (now called 2′R-OTA), 14-decarboxy-ochratoxin A (DC-OTA) and ochratoxin alpha amide (OTα-amide), all of which have reduced toxicity [30,31]. Sufficiently high temperature and heating time are necessary to cause OTA degradation. A study by Park et al. found that washing polished rice with water had little effect on OTA levels, but cooking significantly reduced OTA concentration in the rice, and the OTA levels remaining in ordinarily cooked rice and pressure-cooked rice were 69–75% and 59–60%, respectively [32]. A study by Boudra and colleagues found that dry heating of OTA-contaminated wheat at 100 °C for 40–160 min did not change OTA content, whereas, upon wet heating at the same temperature, over 50% of the OTA was destroyed after 120 min [33]. In our study, wet GP samples were heated in an autoclave to 121 °C and maintained for 10–30 min under high pressure (15 psi), and results are in good agreement with those reported in the literature [32,33]. In addition to reducing OTA, thermal pressure processing will also eliminate all microorganisms in the GP. Therefore, thermal pressure processing such as pressure cooking and pressure steaming could be an effective method to improve the safety of GP, and thus the safety of food/feed containing GP. However, it can be seen from Figure 2 and Table 1 that that OTA contents in some GP samples autoclaved for 30 min were higher than those autoclaved for 20 min. This might be caused by the interference of other compounds formed during heating on the determination of OTA. For instance, it was reported that isomerization of OTA occurred during coffee roasting and formed 2R’-OTA, which was detected by LC-MS/MS [24]. Considering the structural similarity between OTA and 2R’-OTA, they might not be differentiated by ELISA. Hence, the OTA content determined by ELISA in the thermal-pressure-treated GP sample could be the sum of OTA and 2R’-OTA, and longer treatment time could contribute to higher 2R’-OTA content. Thus, the higher OTA in the GP samples autoclaved for 30 min might be overestimated.
2.2. Effects of Thermal Pressure Treatment on Polyphenol Contents of Grape Pomace
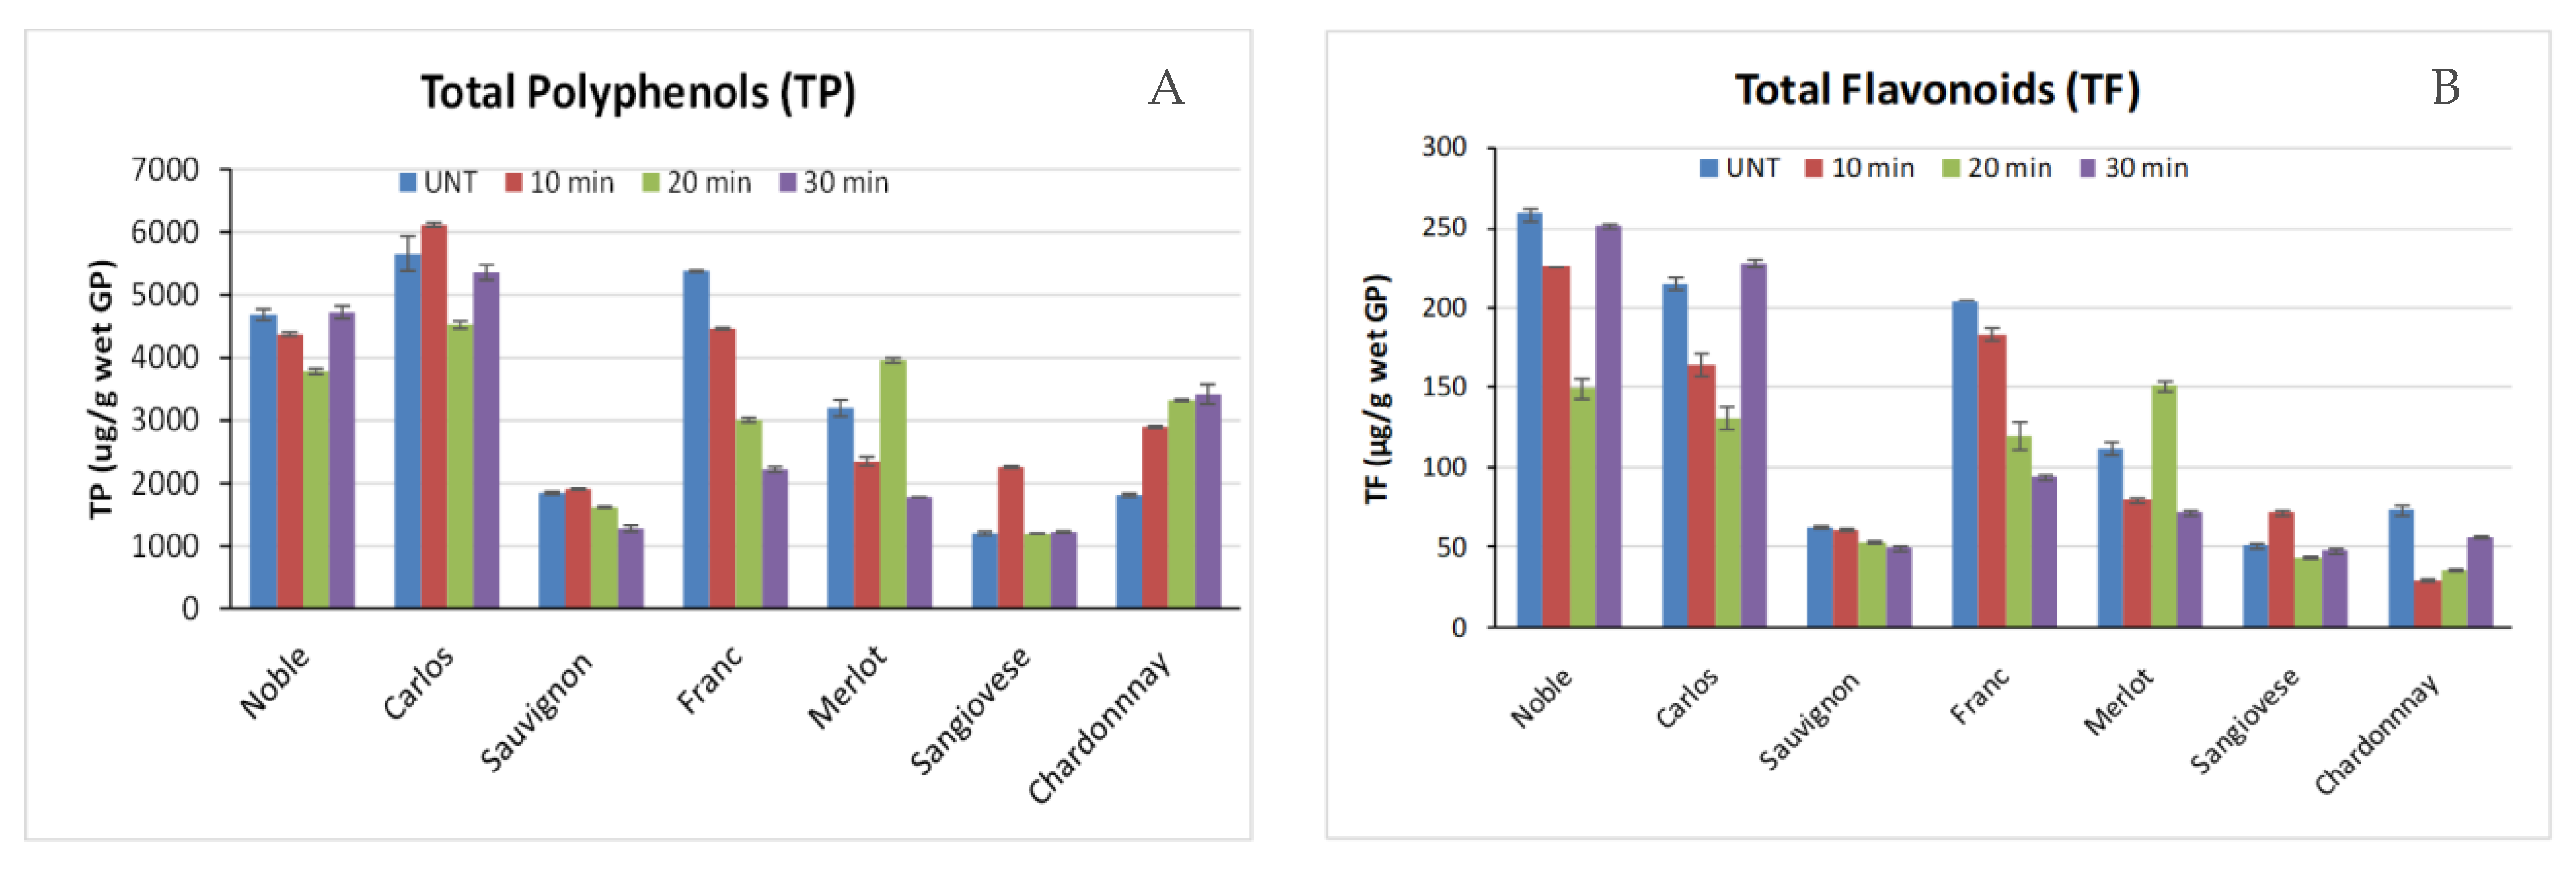
The effect of high-pressure thermal treatment on polyphenols of grape pomace was tested. Overall, autoclaving resulted in decreases in total polyphenol (TP) and total flavonoids (TF) in some GP samples (Muscadine Noble and Carlos, Cabernet Sauvignon and Franc, as well as Merlot), did not change TP and TF in Sangiovese GP, and increased TP in Chardonnay GP (Figure 3). However, the loss of polyphenols due to autoclaving is acceptable given their high contents in GP. This may be attributed to the relative stability of polyphenols at acidic pH [34,35,36] because the pH of GP slurry is about 4.5. In addition, autoclaving was conducted in a well-sealed container, and a large quantity of vapor was generated from water within the sample as the temperature increased, which exiled the oxygen trapped in the sample and reduced the oxidation degradation of polyphenols, the main degradation pathway.
2.3. Effects of Acid Treatments on OTA Content in GP
In this study, all GP samples were treated at same pH and temperature for the same period of time (24 h). Data in Table 2 show the effectiveness of different acids on OTA reduction in GP. Overall, organic acids including acetic acid (AA), citric acid (CA) and lactic acid (LA) were more effective in reducing OTA in all grape pomaces than hydrochloric acid (HCl), which was only effective in reducing OTA in Cabernet Sauvignon. Among the three organic acids, it is hard to tell which one is more effective. Treatment of GP under highly acidic conditions for sufficient time will also completely inactivate bacteria and fungi in the GP and prevent further production of any toxin. Table 2 also shows that the OTA-reducing efficiency of same acid varied with GP variety, which might be related to the interference of the polyphenol composition of the GP with OTA quantification, although no such study has been reported.
An early study found that, when heated under moist and watery conditions, a small change in OTA molecule was found, but cytotoxicity was not reduced. Under acidic conditions (0.1 HCl), the decomposition of ochratoxin A was detected by TLC; however, a change in cytotoxicity was not observed. On the other hand, heating with NaOH (0.1 N) resulted in the decomposition and detoxification of ochratoxin A [37]. A recent study conducted in buffer solutions of different pHs (pH 4, 7 and 10) found that the rate and the extent of OTA reduction were dependent on pH, processing time, and temperature: an OTA reduction greater than 90% was achieved at 200 °C for all treatments except pH 4; about 50% of the OTA was lost after treatment at pH 10 and 100 °C for 60 min, while a significant OTA reduction was not observed after 60 min under neutral and acidic conditions at 100 °C [38]. However, the reduction of OTA under alkaline conditions might be due to the reversible conversion of OTA to the open lactone of ochratoxin A (OP-OTA), which was found to be more toxic than OTA in rats and mice [13,39]. The autoclaving treatment used in the present study was conducted at the pH of GP (near pH 4.0), and the highest OTA reduction achieved was 67%. More study is needed to test if a longer acidic treatment time at room temperature or a shorter treatment time at a higher temperature can achieve a higher OTA reduction in GP.
2.4. Effects of Baking on OTA Contents
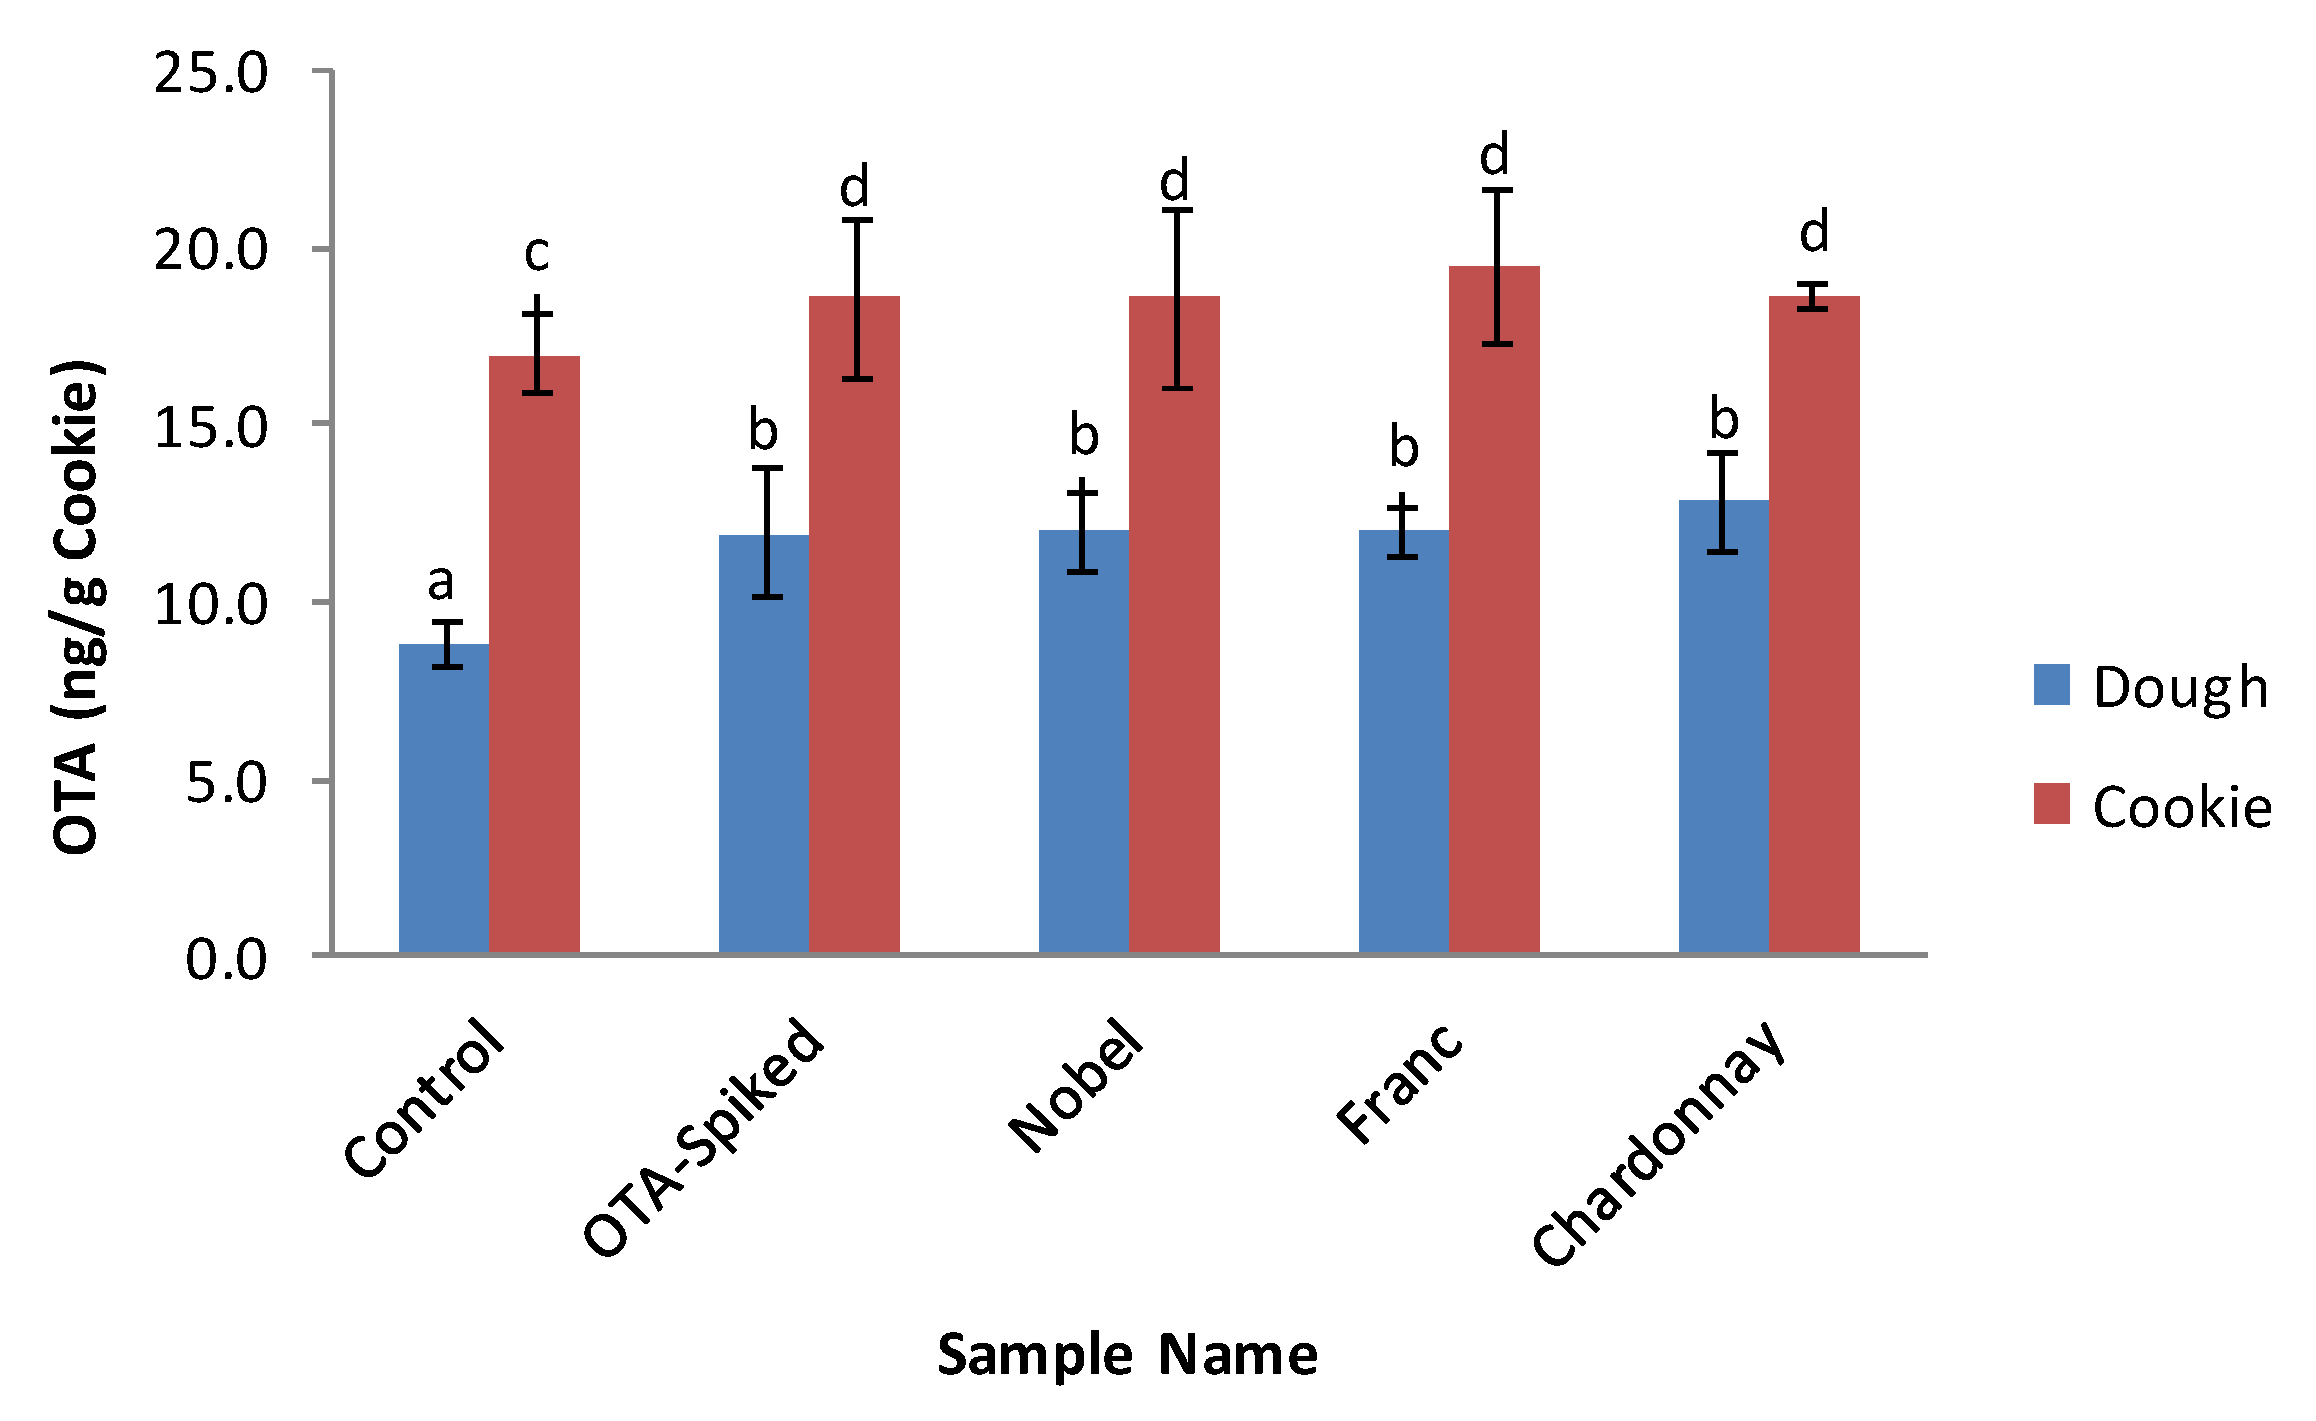
Because OTA is commonly present in cereal grains and the products made from cereal grains, the OTA contents of cookie dough and cookies without added GP or OTA spiking solution were determined and used as controls. The OTA content of the all-purpose flour used for cookie making was detected to be 9.44 ng/g flour. Figure 4 shows that the dough without OTA spiking or GP (control 1) contained 8.82 ng/g of OTA (dry base). Regardless of GP addition, all cookies showed higher OTA contents than their corresponding dough, and there were no significant differences in OTA content among dough and cookies spiked with OTA. Compared with dough, baking resulted in a 45.4–69.8% increase in OTA. The data indicate that the wheat flour used for cookie making in this study was contaminated with OTA, the contribution of GP addition (5%) to the OTA content of dough and cookies was negligible, and cookie baking increased the detectable OTA content in the cookies.
The results of this study disagree with most of the data reported in the literature, but agree with the results of Vidal and colleagues who reported a 40% increase in OTA from dough to bread [40]. It is well known that ochratoxin is stable during bread baking, but baking of biscuits was reported to result in about two thirds of the toxin being destroyed or immobilized [22]. The pH of bread dough is usually in the range of 4.5–6.0, while the pH of biscuit or cookie dough is 7.0–7.2. OTA should be stable at both pH ranges as demonstrated by [38]. Therefore, it is no surprise that the cookie baking process did not reduce OTA in this study. The increase in OTA after baking may be explained by the increase in OTA extractability or the formation of other compounds which could bind to the antibody in the ELISA kit, thus resulting in overestimation of OTA. Analyzing OTA content by different methods, such as HPLC, may produce different results.
2.5. Effects of Enzymatic Treatment on OTA Content in Grape Pomace
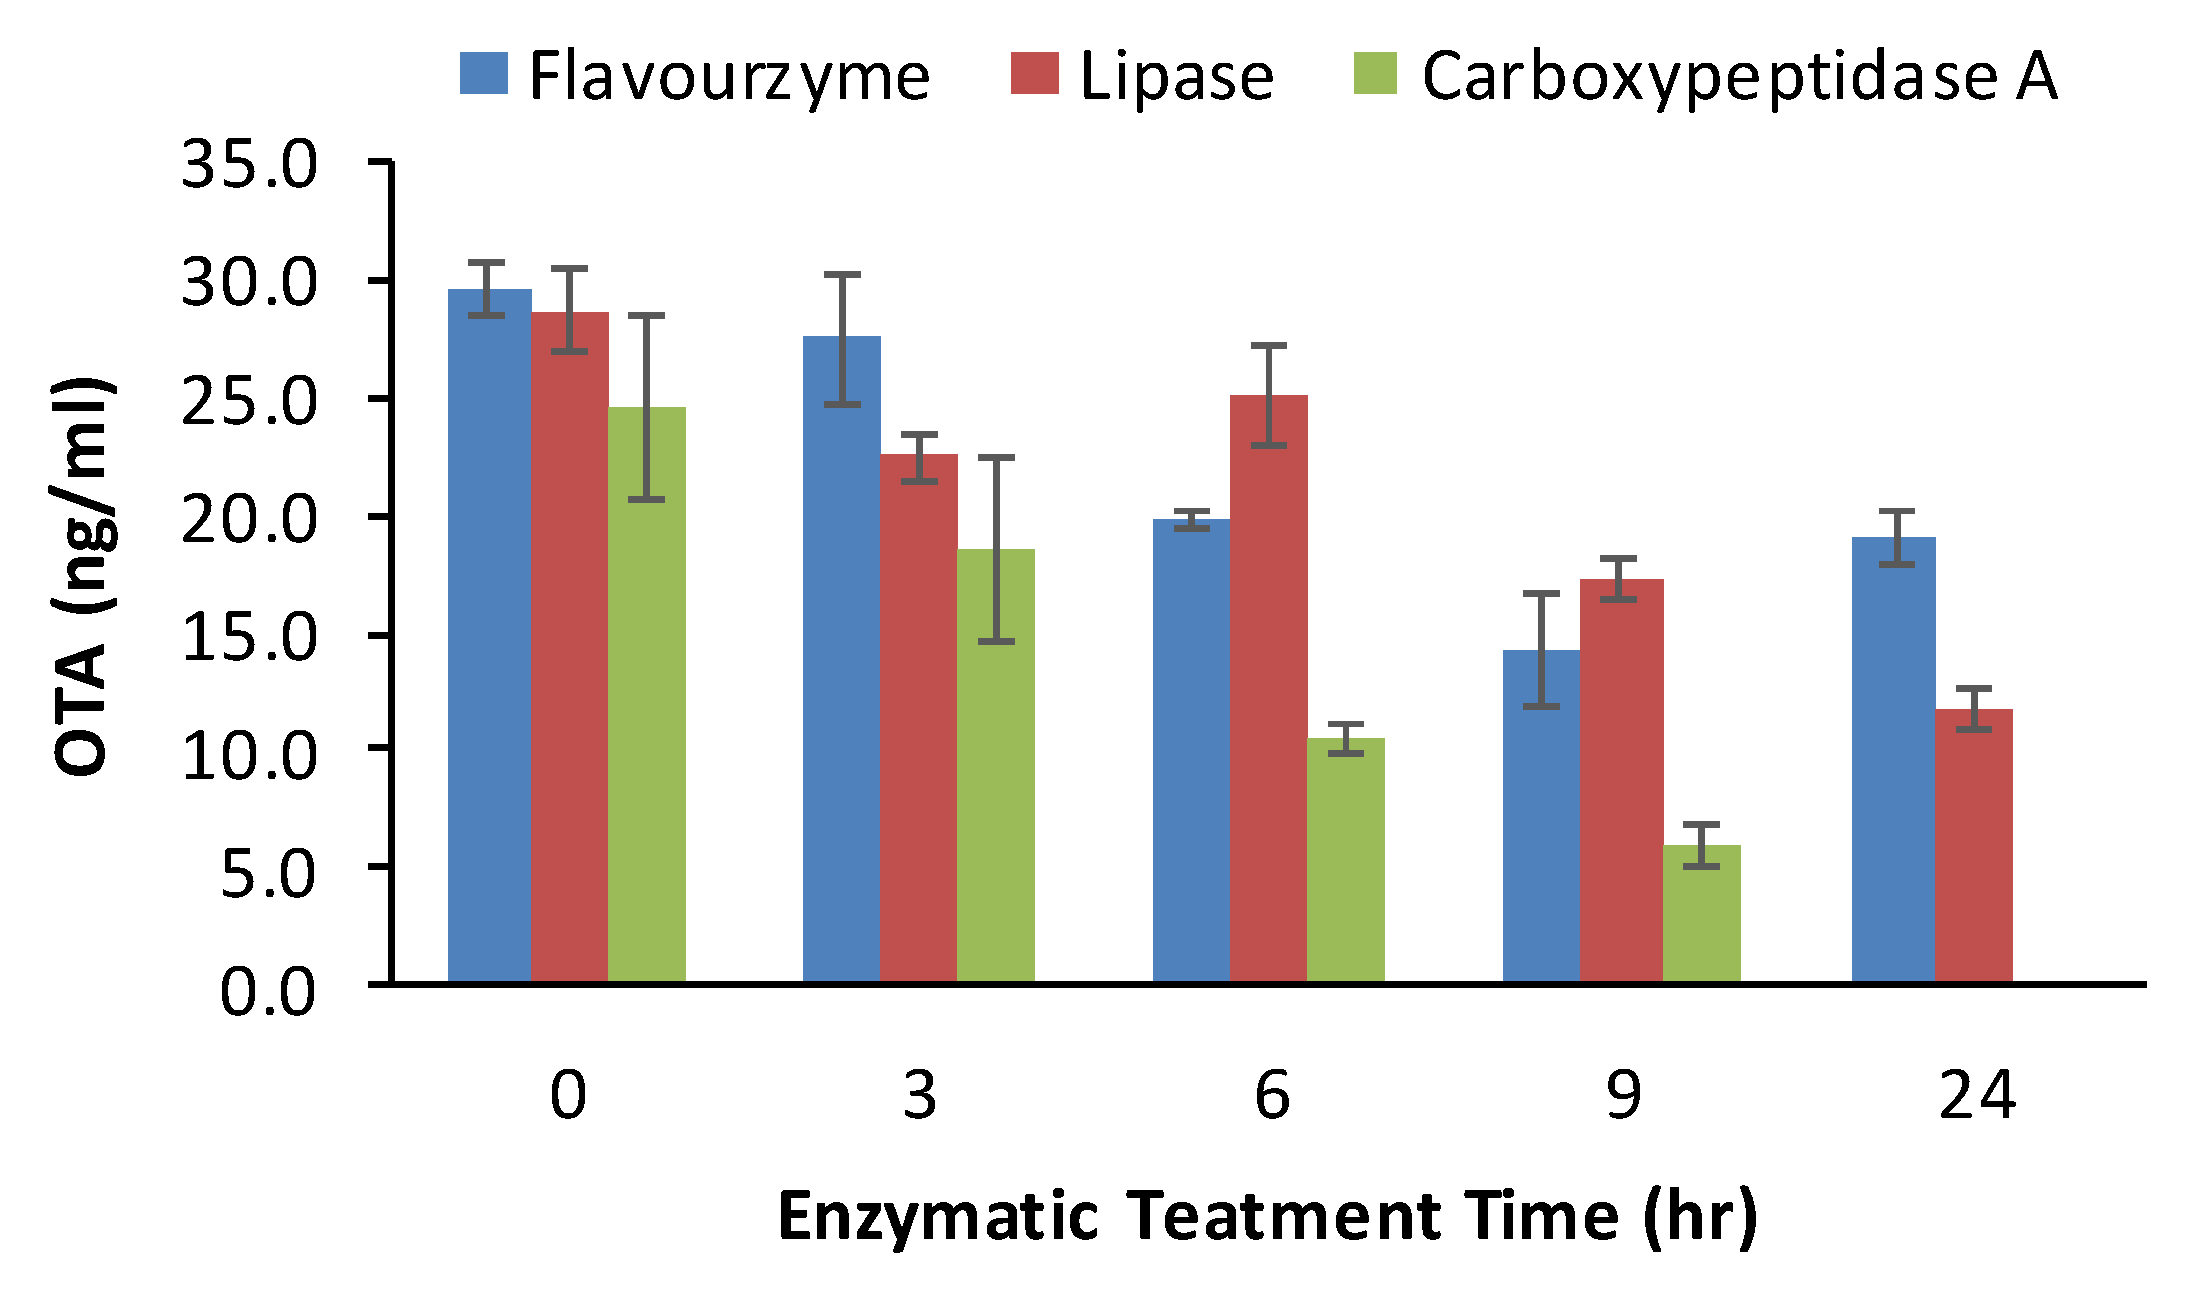
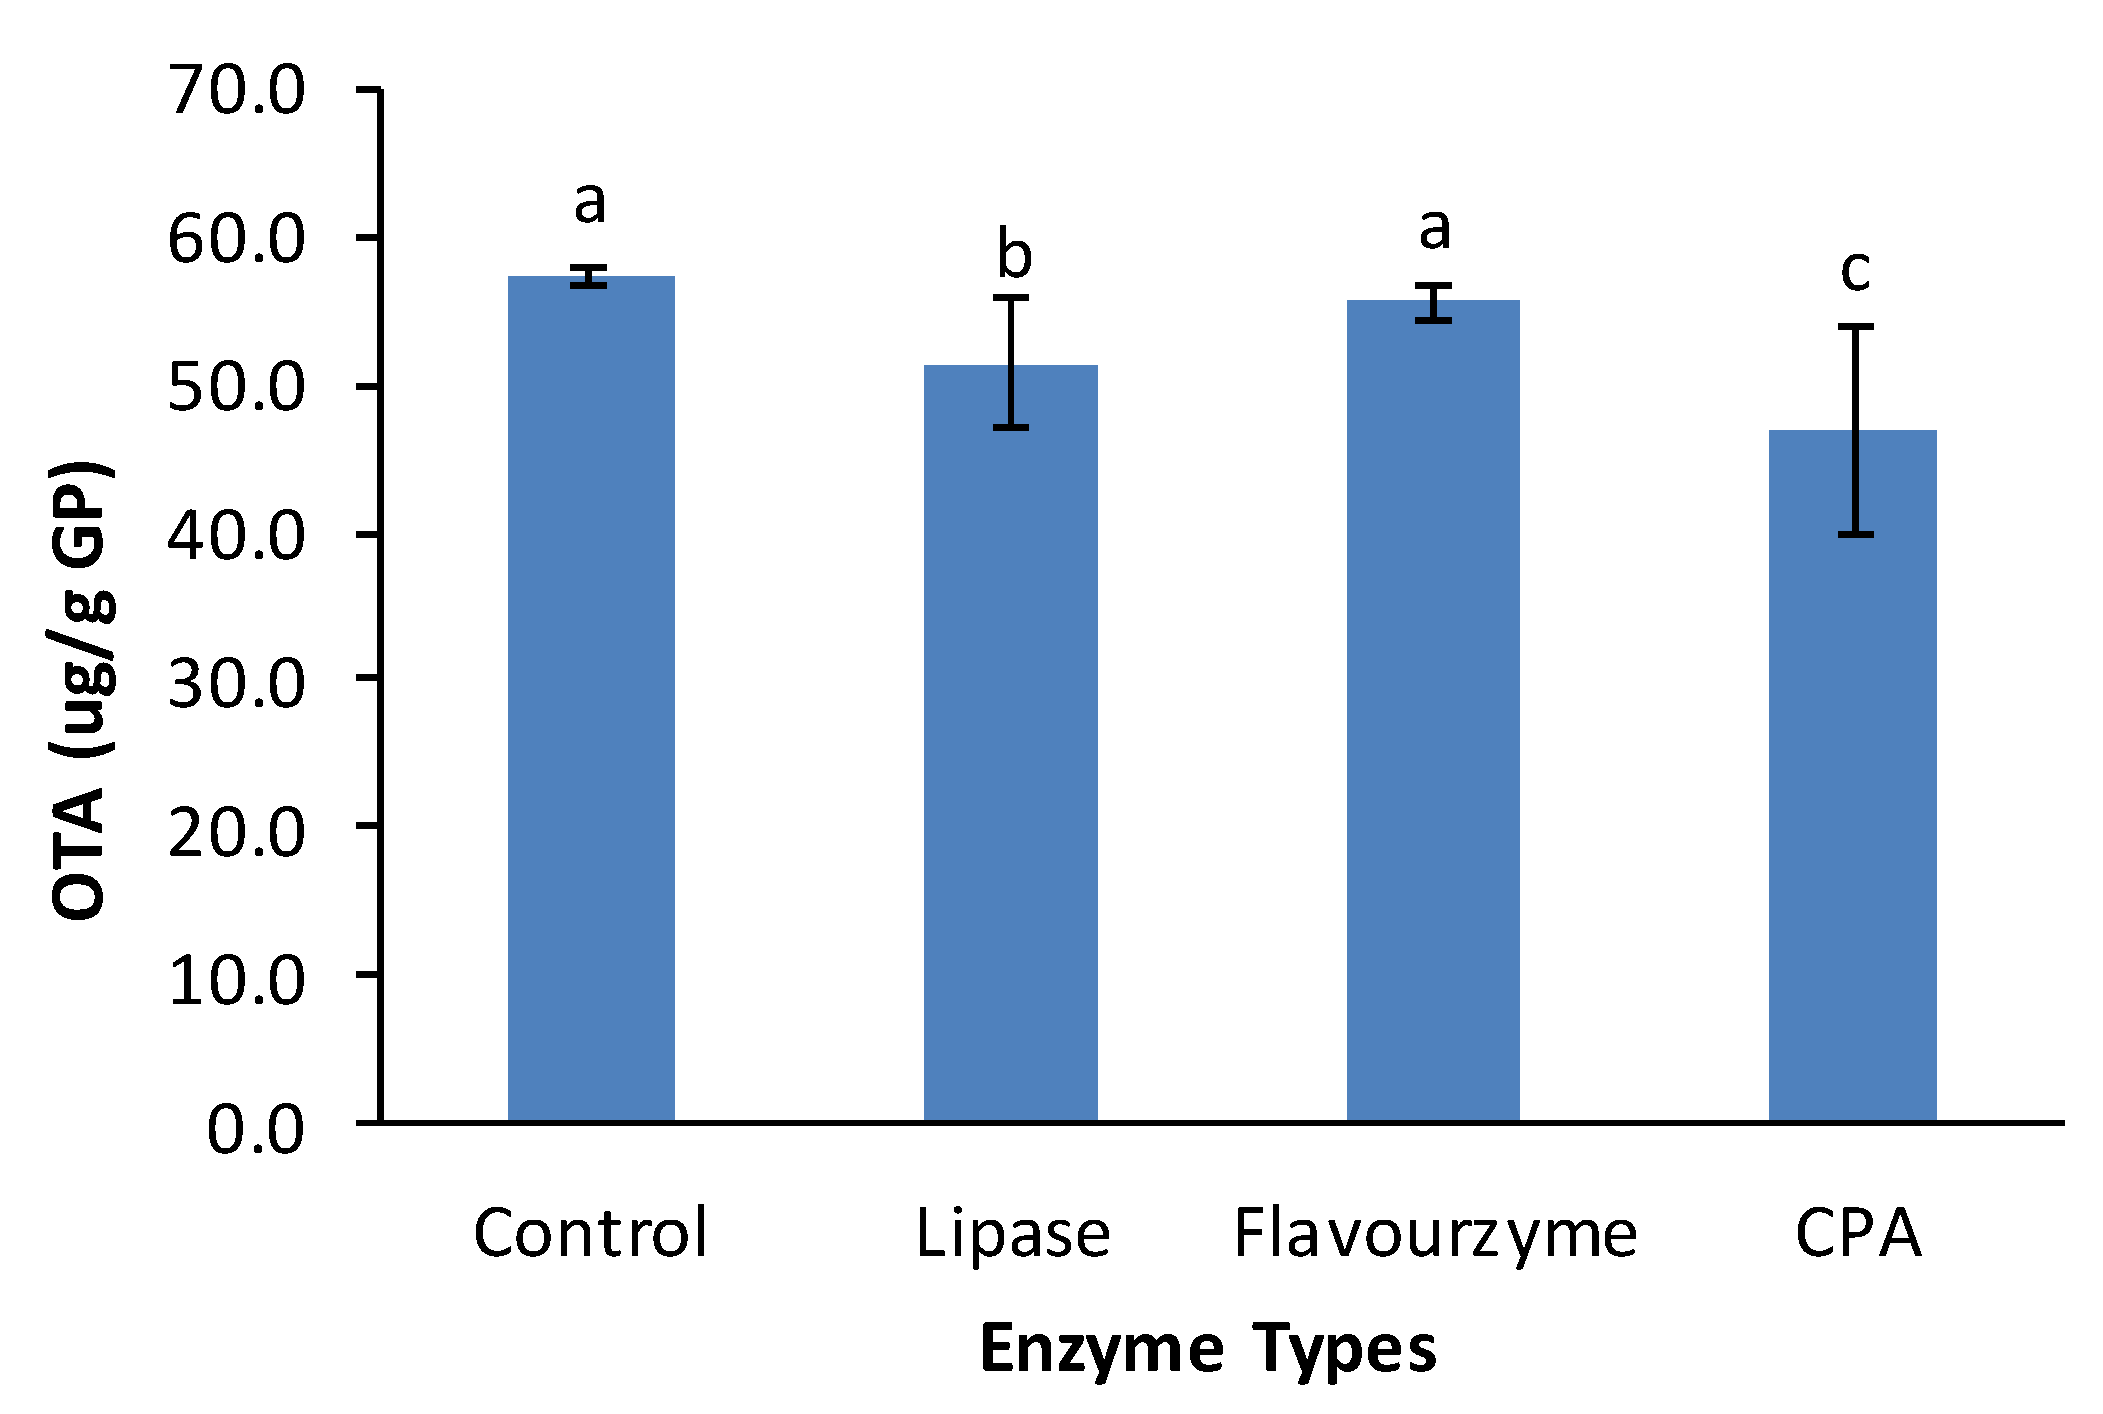
In this study, the potential of carboxypeptidase A (CPA), alcalase, flavourzyme (protease from Aspegillus niger), lipase, and pepsin to reduce OTA content was first screened using pure OTA solution. Among all tested enzymes, only CPA, flavourzyme and lipase significantly reduced OTA concentration in the buffer solutions, and the reductions of pure OTA due to treatment with flavourzyme, lipase and CPA at 37 °C for 24 h were 36, 60 and 100%, respectively (Figure 5). Therefore, these three enzymes were used to treat GP samples containing known amounts of OTA. Figure 6 shows that lipase and carboxypeptidase A treatment significantly reduced OTA contents in the GP samples (p < 0.05), but the reductions were only 10.22% and 18.33%, respectively, whereas flavourzyme treatment did reduce OTA.
Some commercial enzymes, including lipases and proteases from Aspegillus niger, were reported to effectively hydrolyze OTA into less toxic OTα and β-phenylalanine [32,41]. However, the results of this study showed that CPA was highly effective and can completely hydrolyze OTA in pH 5.4 buffer, but the efficacy of this enzyme was limited in reducing OTA in grape pomace. The effects of lipase and protease from A. niger on OTA in GP were also limited, although statistically significant. This might be caused by the interference of GP polyphenols, because grape pomace/seed polyphenols also function as inhibitors that inhibit the activities of different hydrolytic enzymes, such as protease, lipase and carbohydrase [42]. Longer treatment time may increase OTA reduction but it may also increase OTA content if the GP is not sterilized before enzyme treatment because of the presence of viable OTA-producing molds in GP [10].
3. Conclusion and Implication
This study demonstrated that thermal pressure processing, such as autoclave and pressure cooking, could effectively destroy OTA in grape pomace without causing too much damage to polyphenols, but the time of treatment has to be controlled to avoid excess destruction of polyphenols. Treatment using organic acids, such as acetic and citric acid, at concentrations of 0.01 M (pH 2.0) also reduced OTA in GP significantly. Similar to breadmaking, cookie baking could not reduce OTA. Although hydrolytic enzymes such as carboxypeptidase, lipase and protease from Aspegillus niger showed great potential to reduce OTA in the buffer solutions, their efficacies in OTA reduction in GP were very limited, even when the treatment time was 24 h. Therefore, enzyme treatment alone may not be an effective approach for reducing OTA in GP; the combination of thermal pressure treatment and acid/enzyme treatment may reduce OTA further, and may be worth further study. Because most of the degradation products of OTA are reported as being less toxic, it is reasonable to assume that GP treated by thermal processing, acid and enzymes should be safer than untreated GP. However, this assumption needs to be tested by in-vitro and in-vivo toxicity studies using cell cultures and animal model. The limitation of this study is that OTA was quantified by ELISA, which displays high variation and cannot provide information about the degradation products of OTA. More consistent and accurate methods, such as high-performance liquid chromatography (HPLC) or LC-MS/MS, are needed in future studies related to the degradation or transformation of OTA.
4. Materials and Methods
4.1. Materials
The wet grape pomace samples from seven grape cultivars, including Muscadine Carlos, organic Muscadine Noble, organic Cabernet Franc, Cabernet Sauvignon, Merlot, Sangiovese and Chardonnay were obtained from two North Carolina wineries. They were collected right after press, packed in gallon-size plastic bags separately and stored at −20 °C until use. Purified ochratoxin A (lyophilized powder) from Aspergillus ochraceus, carboxypeptidase A from bovine pancreas, lipase and protease from A. niger, alcalase from Bacillus licheniformis, and pepsin from porcine gastric mucosa were purchased from Sigma-Aldrich (St. Louis, MO, USA). Acetic acid, citric acid, lactic acid and hydrochloric acid were purchased from Fisher Scientific (Suwanee, GA, USA).
4.2. Treatments of Grape Pomace and OTA Extraction
4.2.1. Thermal Pressure Treatment
The GP samples were thawed overnight and 100 g of each was weighed into a set of three containers, capped, then autoclaved for 10, 20 and 30 min at 15 psi and 121 °C in a laboratory autoclave. The untreated pomace samples were used as controls. After cooling, 100 mL of DI water was added to each container, and the GP samples were homogenized. OTA was extracted using undiluted methanol. Briefly, 10 g of GP slurry was mixed with 20 mL of methanol in a 50-mL Erlenmeyer flask for 30 min on a magnetic stir, and centrifuged at 3000× g for 20 min. The supernatant was collected for OTA determination. The extraction was conducted in triplicate for each sample.
4.2.2. Acid Treatment
The reason to select acid treatment is that most of polyphenols (anthocyanins, catechins and flavonoids) in GP are stable under acidic conditions even at high temperatures [34,35,36]. The GP samples were treated with acetic acid (AA), citric acid (CA), lactic acid (LA) and hydrochloric acid (HCl) at pH 2.0, respectively, for 24 h at 37 °C. Briefly, 50 g of wet GP was suspended in 0.01 M of acid solution in a glass container at a GP-to-acid ratio of 1:1 (w/v) and adjusted to pH 2 using 2 M HCl and 2 M NaOH, then incubated at 50 °C for 3, 6, 9, 18 and 24 h. GP samples without added acid were used as the control. After homogenization, OTA was extracted using 100% methanol as described in Section 4.2.1.
4.2.3. Baking
According to our previous studies, cookies are one of the food products suitable for GP application [4,5,6]; thus, cookie making was used as the baking model in this study. The vacuum-dried GP was ground and sieved, and the portion passed through a 40-mesh screen was used for baking. The OTA content of GP powder and flour were determined before cookie making. Cookie dough was formulated with all-purpose flour, sugar, butter, egg, baking soda, vanilla extract, and 5% GP with known OTA content. The dough was then spiked with 5 ppb of OTA and mixed thoroughly with a kitchen aid mixer; the dough was then divided into 6 equal balls, 3 were baked at 350 °F (178 °C) for 20 min in a lab oven, and 3 were used to determine total OTA before baking. The dough and cookie samples spiked with OTA but without GP were used as controls. For OTA extraction, the dough was homogenized with 80% methanol, while cookie was broken into small pieces, ground into powder, and then extracted with 80% methanol. The moisture of dough and cookie were determined by drying spread samples in a vacuum oven for 24 h at 80 °C.
4.2.4. Enzymatic Treatment
Alcalase, flavourzyme, lipase, pepsin, and carboxypeptidase A were used for enzymatic treatment. For lipase, alcalase and flavourzyme, the treatments were conducted in pH 7.5 phosphate buffer (PB), the pepsin treatment was conducted in simulated gastric fluid at pH 1.5, papain treatment was conducted in PB at pH 6, and carboxypeptidase treatment was conducted in Tris buffer at pH 8.0. Purified OTA solution was diluted to 30 ng/mL in a set of test tubes with different buffers containing different enzymes. The enzyme concentration was 10 mg per 1µg OTA as described by Abrunhosa and colleagues [43]. The treatment was conducted at 37 °C in a water bath shaker for 0–24 h at the optimal pH of that enzyme, and samples were taken at 0, 3, 6, 9 and 24 h. After inactivation of the enzyme in a boiling water bath, the OTA concentration was determined by using an ELISA kit. The enzymes that resulted in obvious OTA reduction were selected to treat GP. Before enzyme treatment, the GP was sterilized by autoclaving to inactivate microorganisms, followed by homogenization to ensure the even distribution of spiked OTA and enzyme. The OTA content of the GP slurry was determined, and slurry was then spiked with 10 ng/g of OTA. After thorough mixing, the selected enzyme was added and GP slurry samples were incubated in the water bath shaker for 24 h at 37 °C followed by enzyme inactivation. OTA-spiked GP slurry without added enzyme but incubated under same conditions was used as a control. The OTA in treated GP samples was extracted in triplicate as described in Section 4.2.1.
4.3. OTA Determination
The OTA contents of extracts were determined in triplicate by a rapid immune assay using the AgraQuant® Ochratoxin Assay Kit (RomerLabs, Newark, DE, USA) according to the manufacturer’s instructions. All OTA extracts were adjusted to pH 7.0 ± 0.10 using 2 M HCl or 2 M NaOH, centrifuged again to remove any particles, and quantitatively diluted with 80% methanol before ELISA assay. The OTA content was expressed as ng/kg sample according to sample weight, extract volume and dilution factor. The OTA contents of dough and cookies were based on dry sample weight.
4.4. Polyphenol Extraction and Analysis
4.5. Data Analysis
Data were analyzed by post-ANOVA Duncan test using SAS version 9.4 (SAS Institute, Cary, NC, USA). The percentages of OTA reduction under specific treatments were calculated for each sample.
Author Contributions
Conceptualization, J.Y.; Methodology, J.Y.; Formal Analysis, J.Y.; Investigation, I.N.S. and N.M.; Resources, J.Y.; Data Curation, I.N.S. and N.M.; Writing—J.Y. and N.M.; Supervision, J.Y.; Project Administration, J.Y.; Funding Acquisition, J.Y. All authors have read and agreed to the published version of the manuscript.
Funding
This study was financially supported by USDA-National Institute of Food and Agriculture, Award Number: 2013-38821-21147.
Acknowledgments
We also appreciate the administrative support from Agricultural Research Station and Department of Family and Consumer Sciences at NC A&T State University.
Conflicts of Interest
The authors declare no conflict of interest.
References
- Varga, J.; Kozakiewicz, Z. Ochratoxin A in grapes and grape derived products. Trends Food Sci. Tech. 2006, 17, 72–81. [Google Scholar] [CrossRef]
- Dachery, B.; Manfroi, V.; Berleze, J.K.; Welke, J.E. Occurrence of ochratoxin A in grapes, juices and wines and risk assessment related to this mycotoxin exposure. Ciência Rural 2016, 46, 176–183. [Google Scholar] [CrossRef] [Green Version]
- Amézqueta, S.; Schorr-Galindo, S.; Murillo-Arbizu, M.; González-Peñas, E.; López de Cerain, A.; Guiraud, J.P. OTA-producing fungi in foodstuffs: A review. Food Control 2012, 26, 259–268. [Google Scholar] [CrossRef] [Green Version]
- Smith, I.; Yu, J. Nutritional and sensory quality of bread containing different cultivars and quantities of grape pomace. EC Nutr. 2015, 2, 291–301. [Google Scholar]
- Yu, J.; Smith, I.; Chen, G. Physical and chemical properties of corn-based extrudates containing grape pomace. SDRP J. Food Sci. Technol. 2018, 3, 516–526. [Google Scholar] [CrossRef]
- Maman, R.; Yu, J. Particle size and chemical composition of grape seed flour and their effects on the characteristics of cookies. J. Food Res. 2019, 8, 111–121. [Google Scholar] [CrossRef] [Green Version]
- Ishida, K.; Kishi, Y.; Oishi, K.; Hirooka, H.; Kumagai, H. Effects of feeding polyphenol-rich winery wastes on digestibility, nitrogen utilization, ruminal fermentation, antioxidant status and oxidative stress in wethers. Anim. Sci. J. 2015, 86, 260–269. [Google Scholar] [CrossRef]
- Hassan, Y.I.; Kosir, V.; Yin, X.; Ross, K.; Diarra, M.S. Grape pomace as a promising antimicrobial alternative in feed: A critical review. J. Agric. Food Chem. 2019, 67, 9705–9718. [Google Scholar] [CrossRef]
- Ianni, A.; Di Maio, G.; Pittia, P.; Grotta, L.; Perpetuini, G.; Tofalo, R.; Cichelli, A.; Martino, G. Chemical-nutritional quality and oxidative stability of milk and dairy products obtained from Friesian cows fed with a dietary supplementation of dried grape pomace. J. Sci. Food Agric. 2019, 99, 3635–3643. [Google Scholar] [CrossRef]
- Karlton-Senaye, B.D.; Yu, J.; Williams, L.L. Morphological and molecular characterization of ochratoxin A producing black Aspergillus from grape pomace. J. Food Res. 2015, 4, 39–50. [Google Scholar] [CrossRef]
- Yu, J.; Smith, I.; Karlton-Senaye, B.; Mikiashvili, N.; Williams, L. Impacts of different drying methods on mold viability and ochratoxin A content of grape pomace. Int. J. Appl. Agric. Sci. 2018, 4, 35–42. [Google Scholar] [CrossRef] [Green Version]
- Heussner, A.H.; Bingle, L.E.H. Comparative Ochratoxin Toxicity: A Review of the Available Data. Toxins Basel 2015, 7, 4253–4282. [Google Scholar] [CrossRef] [PubMed] [Green Version]
- Battacone, G.; Nudda, A.; Pulina, G. Effects of Ochratoxin A on livestock production. Toxins 2010, 2, 1796–1824. [Google Scholar] [CrossRef] [PubMed] [Green Version]
- Pitt, J.I.; Wild, C.P.; Baan, R.A.; Gelderblom, W.C.A.; Miller, J.D.; Riley, R.T.; Wu, F. Improving Public Health through Mycotoxin Control; International Agency for Research on Cancer: Lyon, France, 2012; pp. 31–38, 59–85. [Google Scholar]
- Bui-Klimke, T.R.; Wu, F. Ochratoxin A and human health risk: A review of the evidence. Crit. Rev. Food Sci. Nutr. 2015, 55, 1860–1869. [Google Scholar] [CrossRef] [Green Version]
- EFSA. Scientific opinion on the risk assessment of ochratoxin A in food. EFSA J. 2020, 18, 6113. [Google Scholar] [CrossRef]
- EC 2006. European Commission. Commission Regulation (EC) No 1881/2006 of 19 December 2006 Setting Maximum Levels for Certain Contaminants in Foodstuffs; European Commission: Brussels, Belgium, 2006; p. 5. [Google Scholar]
- USDA-FAS. USDA Foreign Agricultural Service. China Releases Standard for Maximum Levels of Mycotoxins in Foods. 2018. Available online: https://www.fas.usda.gov/data/china-china-releases-standard-maximum-levels-mycotoxins-foods (accessed on 8 May 2020).
- Kolakowski, B.; O’Rourke, S.M.; Bietlot, H.P.; Kurz, K.; Aweryn, B. Ochratoxin A concentrations in a variety of grain-based and non–grain-based foods on the Canadian retail market from 2009 to 2014. J. Food Prot. 2016, 79, 2143–2159. [Google Scholar] [CrossRef]
- Budavari, S.; O’Neil, M.J.; Smith, A.; Heckelman, P.E.; Kinneary, J.F. The Merk Index, 12th ed.; Merck & Co., Inc.: White House Station, NJ, USA, 1996; p. 1159. [Google Scholar]
- Malir, F.; Ostry, V.; Pfohl-Leszkowicz, A.; Malir, J.; Toman, J. Ochratoxin A: 50 Years of Research. Toxins 2016, 8, 191. [Google Scholar] [CrossRef] [Green Version]
- Bullerman, L.B.; Bianchini, A. Stability of mycotoxins during food processing. Int. J. Food Microbiol. 2007, 119, 40–146. [Google Scholar] [CrossRef]
- Karlovsky, P.; Suman, M.; Berthiller, F.; De Meester, J.; Eisenbrand, G.; Perrin, I.; Oswald, I.P.; Speijers, G.; Chiodini, A.; Recker, T.; et al. Impact of food processing and detoxification treatments on mycotoxin contamination. Mycotoxin Res. 2016, 32, 179–205. [Google Scholar] [CrossRef]
- Sueck, F.; Hemp, V.; Specht, J.; Torres, O.; Cramer, B.; Humpf, H.U. Occurrence of the Ochratoxin A Degradation Product 2′R-Ochratoxin A in Coffee and Other Food: An Update. Toxins Basel 2019, 11, 329. [Google Scholar] [CrossRef] [Green Version]
- Deberghes, P.; Betbeder, A.M.; Boisard, F.; Blanc, R.; Delaby, J.F.; Krivobok, S.; Steiman, R.; Seigle-Murandi, F.; Creppy, E. Detoxification of ochratoxin A, a food contaminant: Prevention of growth of Aspergillus ochraceus and its production of ochratoxin A. Mycotoxin Res. 1995, 11, 37–47. [Google Scholar] [CrossRef] [PubMed]
- Chen, W.; Li, C.; Zhang, B.; Zhou, Z.; Shen, Y.; Liao, X.; Yang, J.; Wang, Y.; Li, X.; Li, Y.; et al. Advances in Biodetoxification of Ochratoxin A–A Review of the Past Five Decades. Front Microbiol. 1918, 9, 1386. [Google Scholar] [CrossRef] [PubMed]
- Scudamore, K.A. Prevention of ochratoxin A in commodities and likely effects of processing fractionation and animal feeds. Food Addit. Contam. 2005, 22, 17–25. [Google Scholar] [CrossRef] [PubMed]
- Yu, J.; Mikiashvili, N.; Liang, C. Deoxynivalenol and Ochratoxin A in North Carolina grown organic wheat grains. J. Food Saf. 2019, 39, e12687. [Google Scholar] [CrossRef]
- Khoury, A.; Atoui, A. Ochratoxin A: General overview and actual molecular status. Toxins 2010, 2, 461–493. [Google Scholar] [CrossRef] [PubMed] [Green Version]
- Cramer, B.; Königs, M.; Humpf, H.U. Identification and in vitro cytotoxicity of ochratoxin A degradation products formed during coffee roasting. J. Agric. Food Chem. 2008, 56, 5673–5681. [Google Scholar] [CrossRef]
- Bittner, A.; Cramer, B.; Harrer, H.; Humpf, H.U. Structure elucidation and in vitro cytotoxicity of ochratoxin α amide, a new degradation product of ochratoxin A. Mycotoxin Res. 2015, 31, 83–90. [Google Scholar] [CrossRef]
- Park, J.W.; Chung, S.H.; Lee, C.; Kim, Y.B. Fate of ochratoxin A during cooking of naturally contaminated polished rice. J. Food Prot. 2005, 68, 2107–2111. [Google Scholar] [CrossRef]
- Boudra, H.; Le Bars, P.; Le Bars, J. Thermostability of ochratoxin A in wheat under two moisture conditions. Appl. Environ. Microbiol. 1995, 61, 1156–1158. [Google Scholar] [CrossRef] [Green Version]
- Friedman, M.; Jürgens, H.S. Effect of pH on the stability of plant phenolic compounds. J. Agric. Food Chem. 2000, 48, 2101–2110. [Google Scholar] [CrossRef]
- Zeng, L.; Ma, M.; Li, C.; Luo, L. Stability of tea polyphenols solution with different pH at different temperatures. Int. J. Food Prop. 2017, 20, 1–18. [Google Scholar] [CrossRef] [Green Version]
- Honda, S.; Ishida, R.; Hidaka, K.; Masuda, T. Stability of Polyphenols under Alkaline Conditions and the Formation of a Xanthine Oxidase Inhibitor from Gallic Acid in a Solution at pH 7.4. Food Sci. Technol. 2019, 25, 123–129. [Google Scholar] [CrossRef]
- Trivedi, A.B.; Dol, E.; Kitabatake, N. Detoxification of Ochratoxin A on heating under acidic and alkaline conditions. Biosci. Biotech. Biochem. 1992, 56, 741–745. [Google Scholar] [CrossRef]
- Dahal, S.; Lee, H.J.; Gu, K.; Ryu, D. Heat stability of Ochratoxin A in an aqueous buffered model system. J. Food Prot. 2016, 79, 1748–1752. [Google Scholar] [CrossRef] [PubMed]
- Xiao, H.; Madhyastha, S.; Marquardt, R.R.; Li, S.; Vodela, J.K.; Frohlich, A.A.; Kemppainen, B.W. Toxicity of ochratoxin A, its opened lactone form and several of its analogs: Structure-Activity relationships. Toxicol. Appl. Pharmacol. 1996, 137, 182–192. [Google Scholar] [CrossRef]
- Vidal, A.; Morales, H.; Sanchis, V.; Ramos, A.J.; Marín, S. Stability of DON and OTA during the breadmaking process and determination of process and performance criteria. Food Control 2014, 40, 234–242. [Google Scholar] [CrossRef] [Green Version]
- Abrunhosa, L.; Paterson, R.R.M.; Venâncio, A. Biodegradation of ochratoxin A for food and feed decontamination. Toxins 2010, 2, 1078–1099. [Google Scholar] [CrossRef] [Green Version]
- Yu, J.; Me, Y.; Ji, S. In vitro evaluation of grape seed polyphenol extract on the digestibility of macronutrient. J. Health Sci. 2016, 4, 167–176. [Google Scholar]
- Abrunhosa, L.; Paterson, R.R.M.; Venâncio, A. Degradation of ochratoxin A by proteases and by a crude enzyme of Aspergillus niger. Food Biotechnol. 2006, 20, 231–242. [Google Scholar] [CrossRef] [Green Version]
- Singleton, V.L.; Orthofer, R.; Lamuela-Raventós, R.M. Analysis of total phenols and other oxidation substrates and antioxidants by means of Folin-Ciocalteu re-agent. Methods Enzymol. 1999, 299, 152–178. [Google Scholar]
- Yang, J.; Martinson, T.E.; Liu, R.H. Phytochemical profiles and antioxidant activities of wine grapes. Food Chem. 2009, 116, 332–339. [Google Scholar] [CrossRef]
Figure 1.
The chemical structure of ochratoxin A [21].
Figure 1.
The chemical structure of ochratoxin A [21].

Figure 2.
Ochratoxin A (OTA) content of wet grape pomaces (GPs) from different grape cultivars and effects of autoclaving time on OTA contents in wet grape pomace samples (UNT—untreated).
Figure 2.
Ochratoxin A (OTA) content of wet grape pomaces (GPs) from different grape cultivars and effects of autoclaving time on OTA contents in wet grape pomace samples (UNT—untreated).
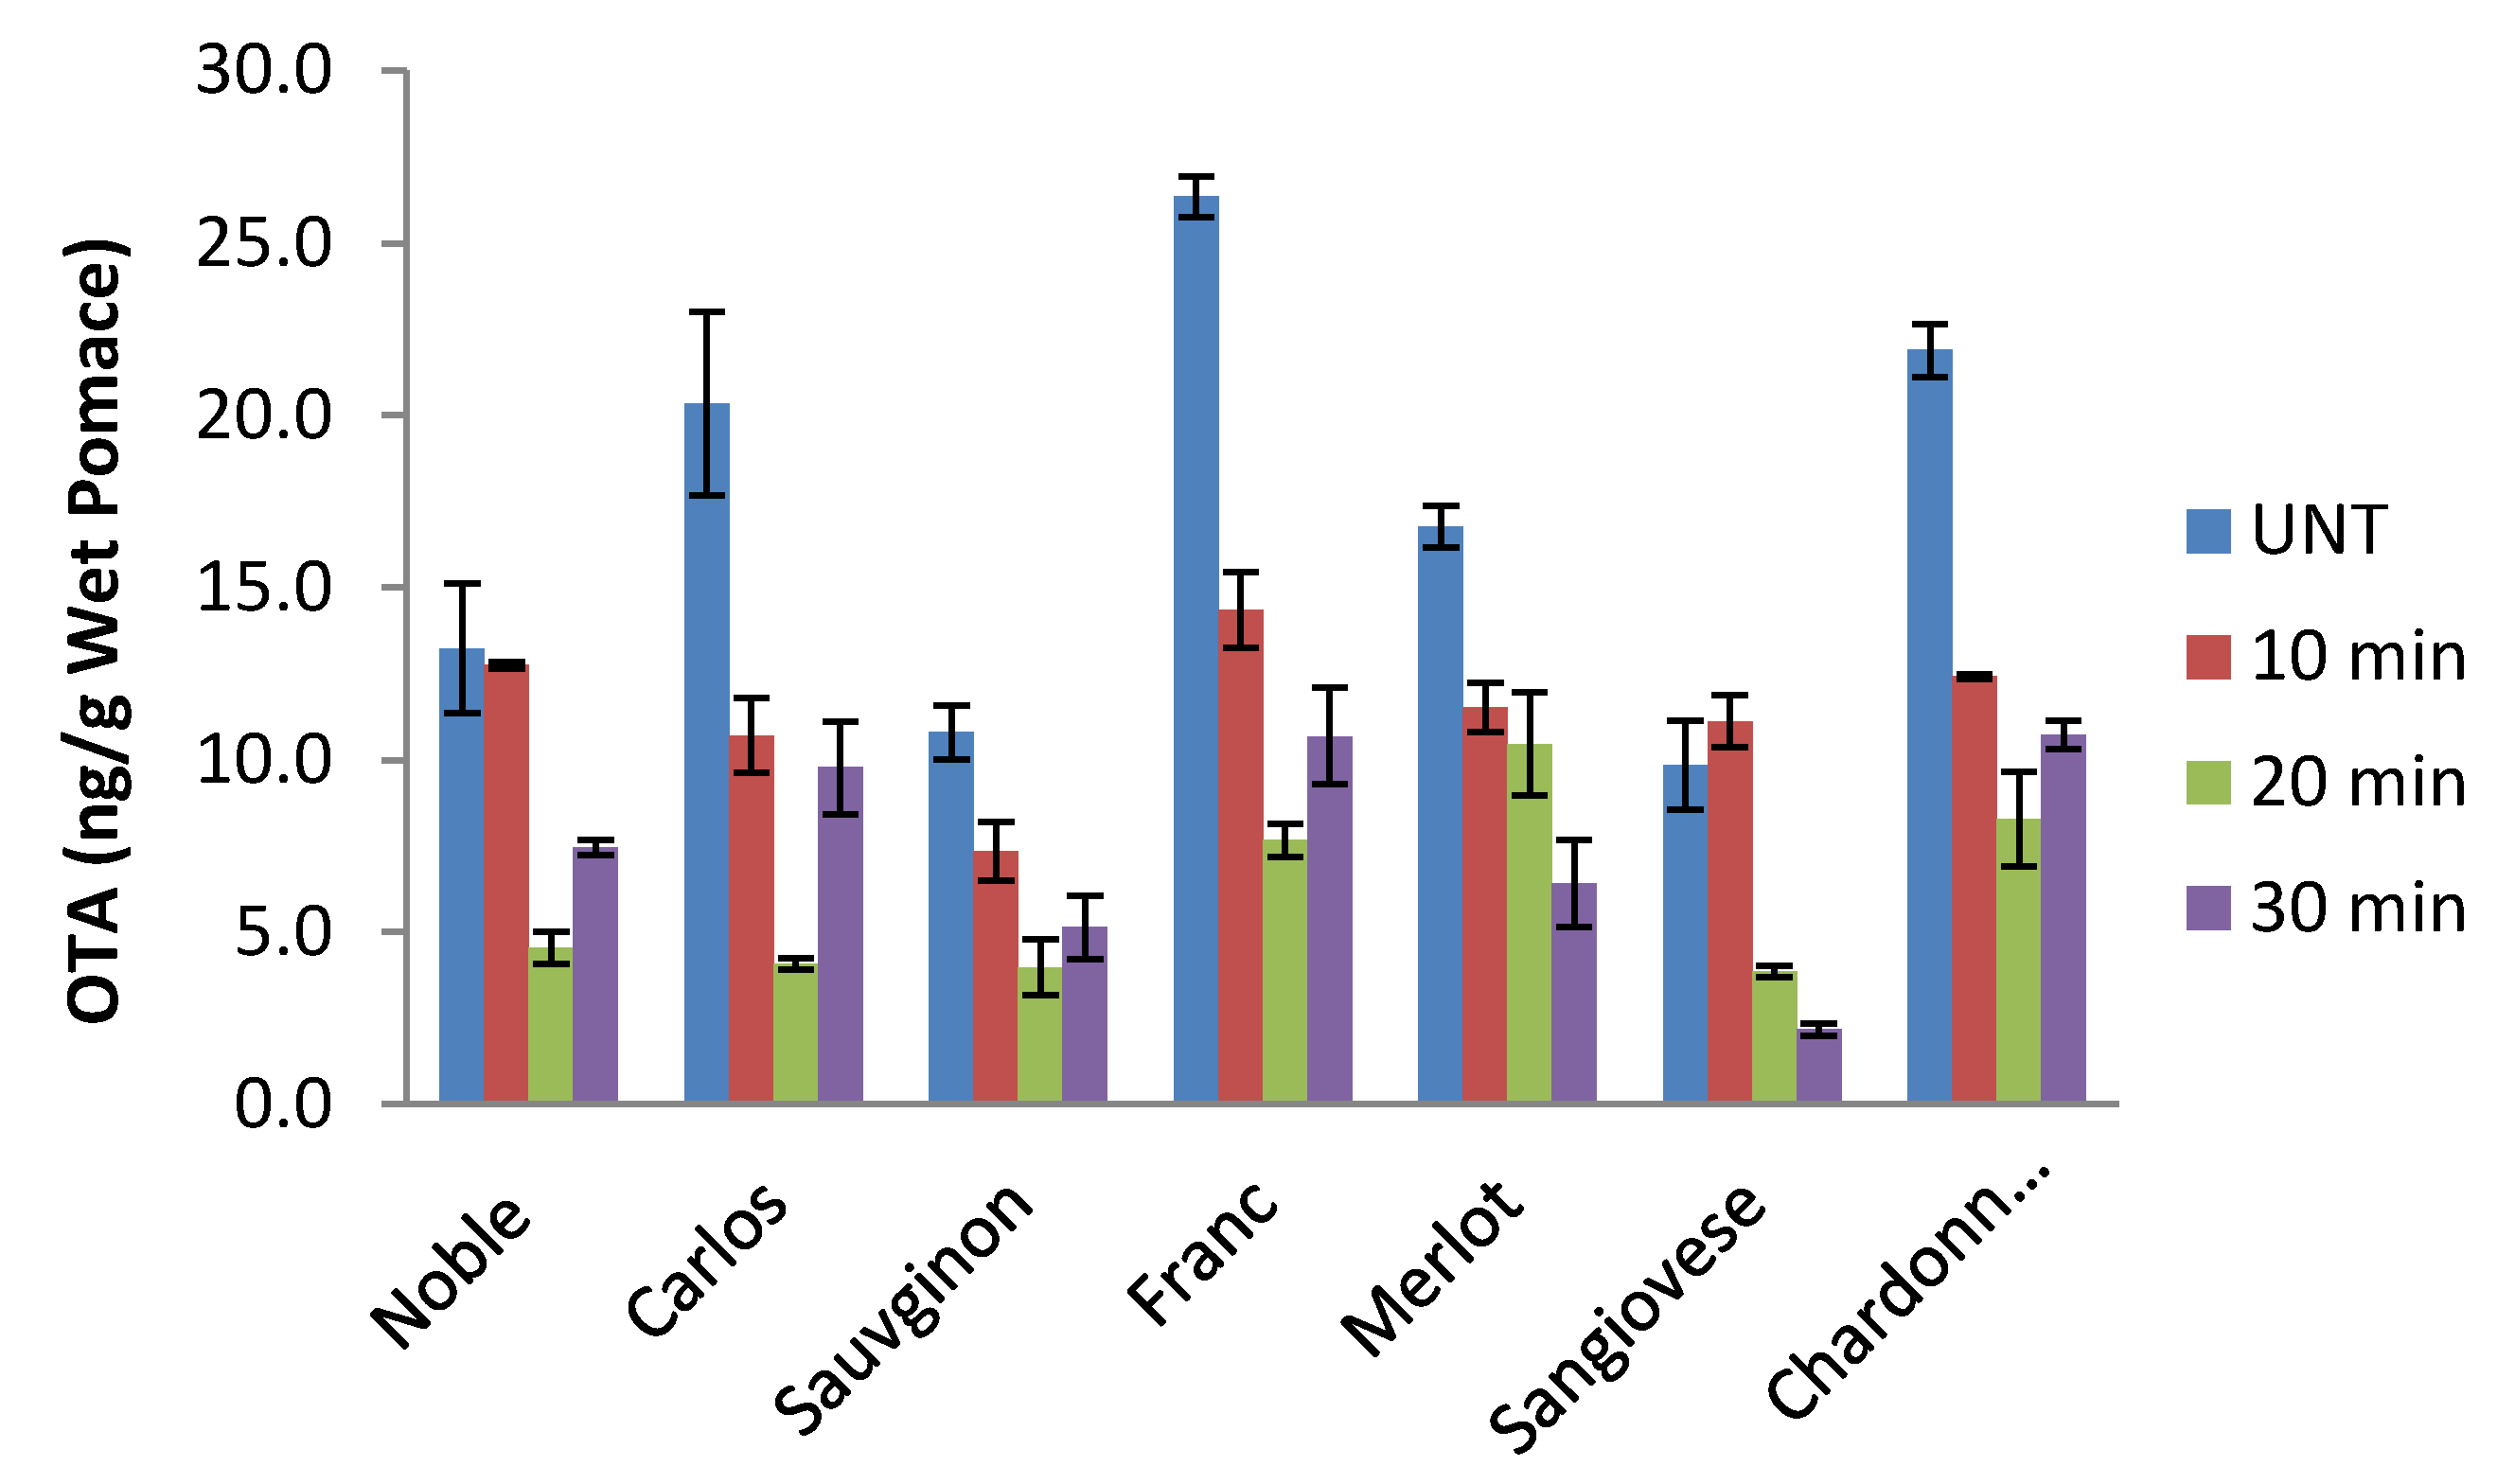
Figure 3.
Effects of thermal pressure processing (autoclaving) time on total polyphenol (A) and flavonoid (B) contents of grape pomace.
Figure 3.
Effects of thermal pressure processing (autoclaving) time on total polyphenol (A) and flavonoid (B) contents of grape pomace.

Figure 4.
OTA contents of dough and cookies with and without GP-containing cookies. (All GP-containing samples were spiked with OTA. Noble—Muscadine Noble, Franc—Cabernet Franc). (Different letters on data bars indicate significantly different values at p < 0.05).
Figure 4.
OTA contents of dough and cookies with and without GP-containing cookies. (All GP-containing samples were spiked with OTA. Noble—Muscadine Noble, Franc—Cabernet Franc). (Different letters on data bars indicate significantly different values at p < 0.05).

Figure 5.
Effects of enzymatic treatment on OTA content in buffer solution.

Figure 6.
Effects of enzymatic treatment on OTA content in grape pomace (37 °C for 24 h). (Different letters on data bars indicate significantly different values at p < 0.05).
Figure 6.
Effects of enzymatic treatment on OTA content in grape pomace (37 °C for 24 h). (Different letters on data bars indicate significantly different values at p < 0.05).


Table 1.
Percent OTA reduction in grape pomace as affected by different autoclaving times.
| Variety of Grape Pomace | OTA Reduction (%) | ||
|---|---|---|---|
| 10 min | 20 min | 30 min | |
| Muscadine Noble | 21.64 | 65.77 | 43.77 |
| Muscadine Carlos | 62.93 | 79.98 | 52.03 |
| Cabernet Sauvignon | 67.60 | 63.29 | 52.57 |
| Cabernet Franc | 47.89 | 70.95 | 59.46 |
| Merlot | 47.49 | 37.64 | 61.87 |
| Sangiovese | 19.21 | 61.03 | 78.01 |
| Chardonnay | 55.71 | 62.23 | 50.97 |
Table 2.
Reduction of OTA contents in acid-treated grape pomace samples.
| Treatment | Cabernet Franc | Reduction (%) | Cabernet Sauvignon | Reduction (%) | Chardonnay | Reduction (%) |
|---|---|---|---|---|---|---|
| Control | 25.11 ± 3.15 | 0.00 | 14.15 ± 0.79 | 0.00 | 21.68 ± 2.59 | 0.00 |
| AA | 10.09 ± 3.22 | 59.82 | 12.07 ± 2.57 | 14.68 | 8.36 ± 4.53 | 61.42 |
| CA | 10.84 ± 0.31 | 56.84 | 6.12 ± 5.44 | 56.78 | 17.29 ± 1.91 | 20.23 |
| HCl | 23.07 ± 0.12 | 8.12 | 5.27 ± 2.72 | 62.77 | 16.27 ± 0.73 | 24.95 |
| LA | 26.20 ± 0.42 | −4.35 | 4.64 ± 0.54 | 67.23 | 11.62 ± 3.29 | 46.39 |
AA—acetic acid, CA—citric acid, HCl—hydrochloric acid, LA—lactic acid.
© 2020 by the authors. Licensee MDPI, Basel, Switzerland. This article is an open access article distributed under the terms and conditions of the Creative Commons Attribution (CC BY) license (http://creativecommons.org/licenses/by/4.0/).
Share and Cite
MDPI and ACS Style
Yu, J.; Smith, I.N.; Mikiashvili, N. Reducing Ochratoxin A Content in Grape Pomace by Different Methods. Toxins 2020, 12, 424. https://0-doi-org.brum.beds.ac.uk/10.3390/toxins12070424
AMA Style
Yu J, Smith IN, Mikiashvili N. Reducing Ochratoxin A Content in Grape Pomace by Different Methods. Toxins. 2020; 12(7):424. https://0-doi-org.brum.beds.ac.uk/10.3390/toxins12070424
Chicago/Turabian StyleYu, Jianmei, Ivy N. Smith, and Nona Mikiashvili. 2020. "Reducing Ochratoxin A Content in Grape Pomace by Different Methods" Toxins 12, no. 7: 424. https://0-doi-org.brum.beds.ac.uk/10.3390/toxins12070424
Note that from the first issue of 2016, this journal uses article numbers instead of page numbers. See further details here.