Cyanobacterial Abundance and Microcystin Profiles in Two Southern British Lakes: The Importance of Abiotic and Biotic Interactions


 and
and
Abstract
:1. Introduction
2. Results
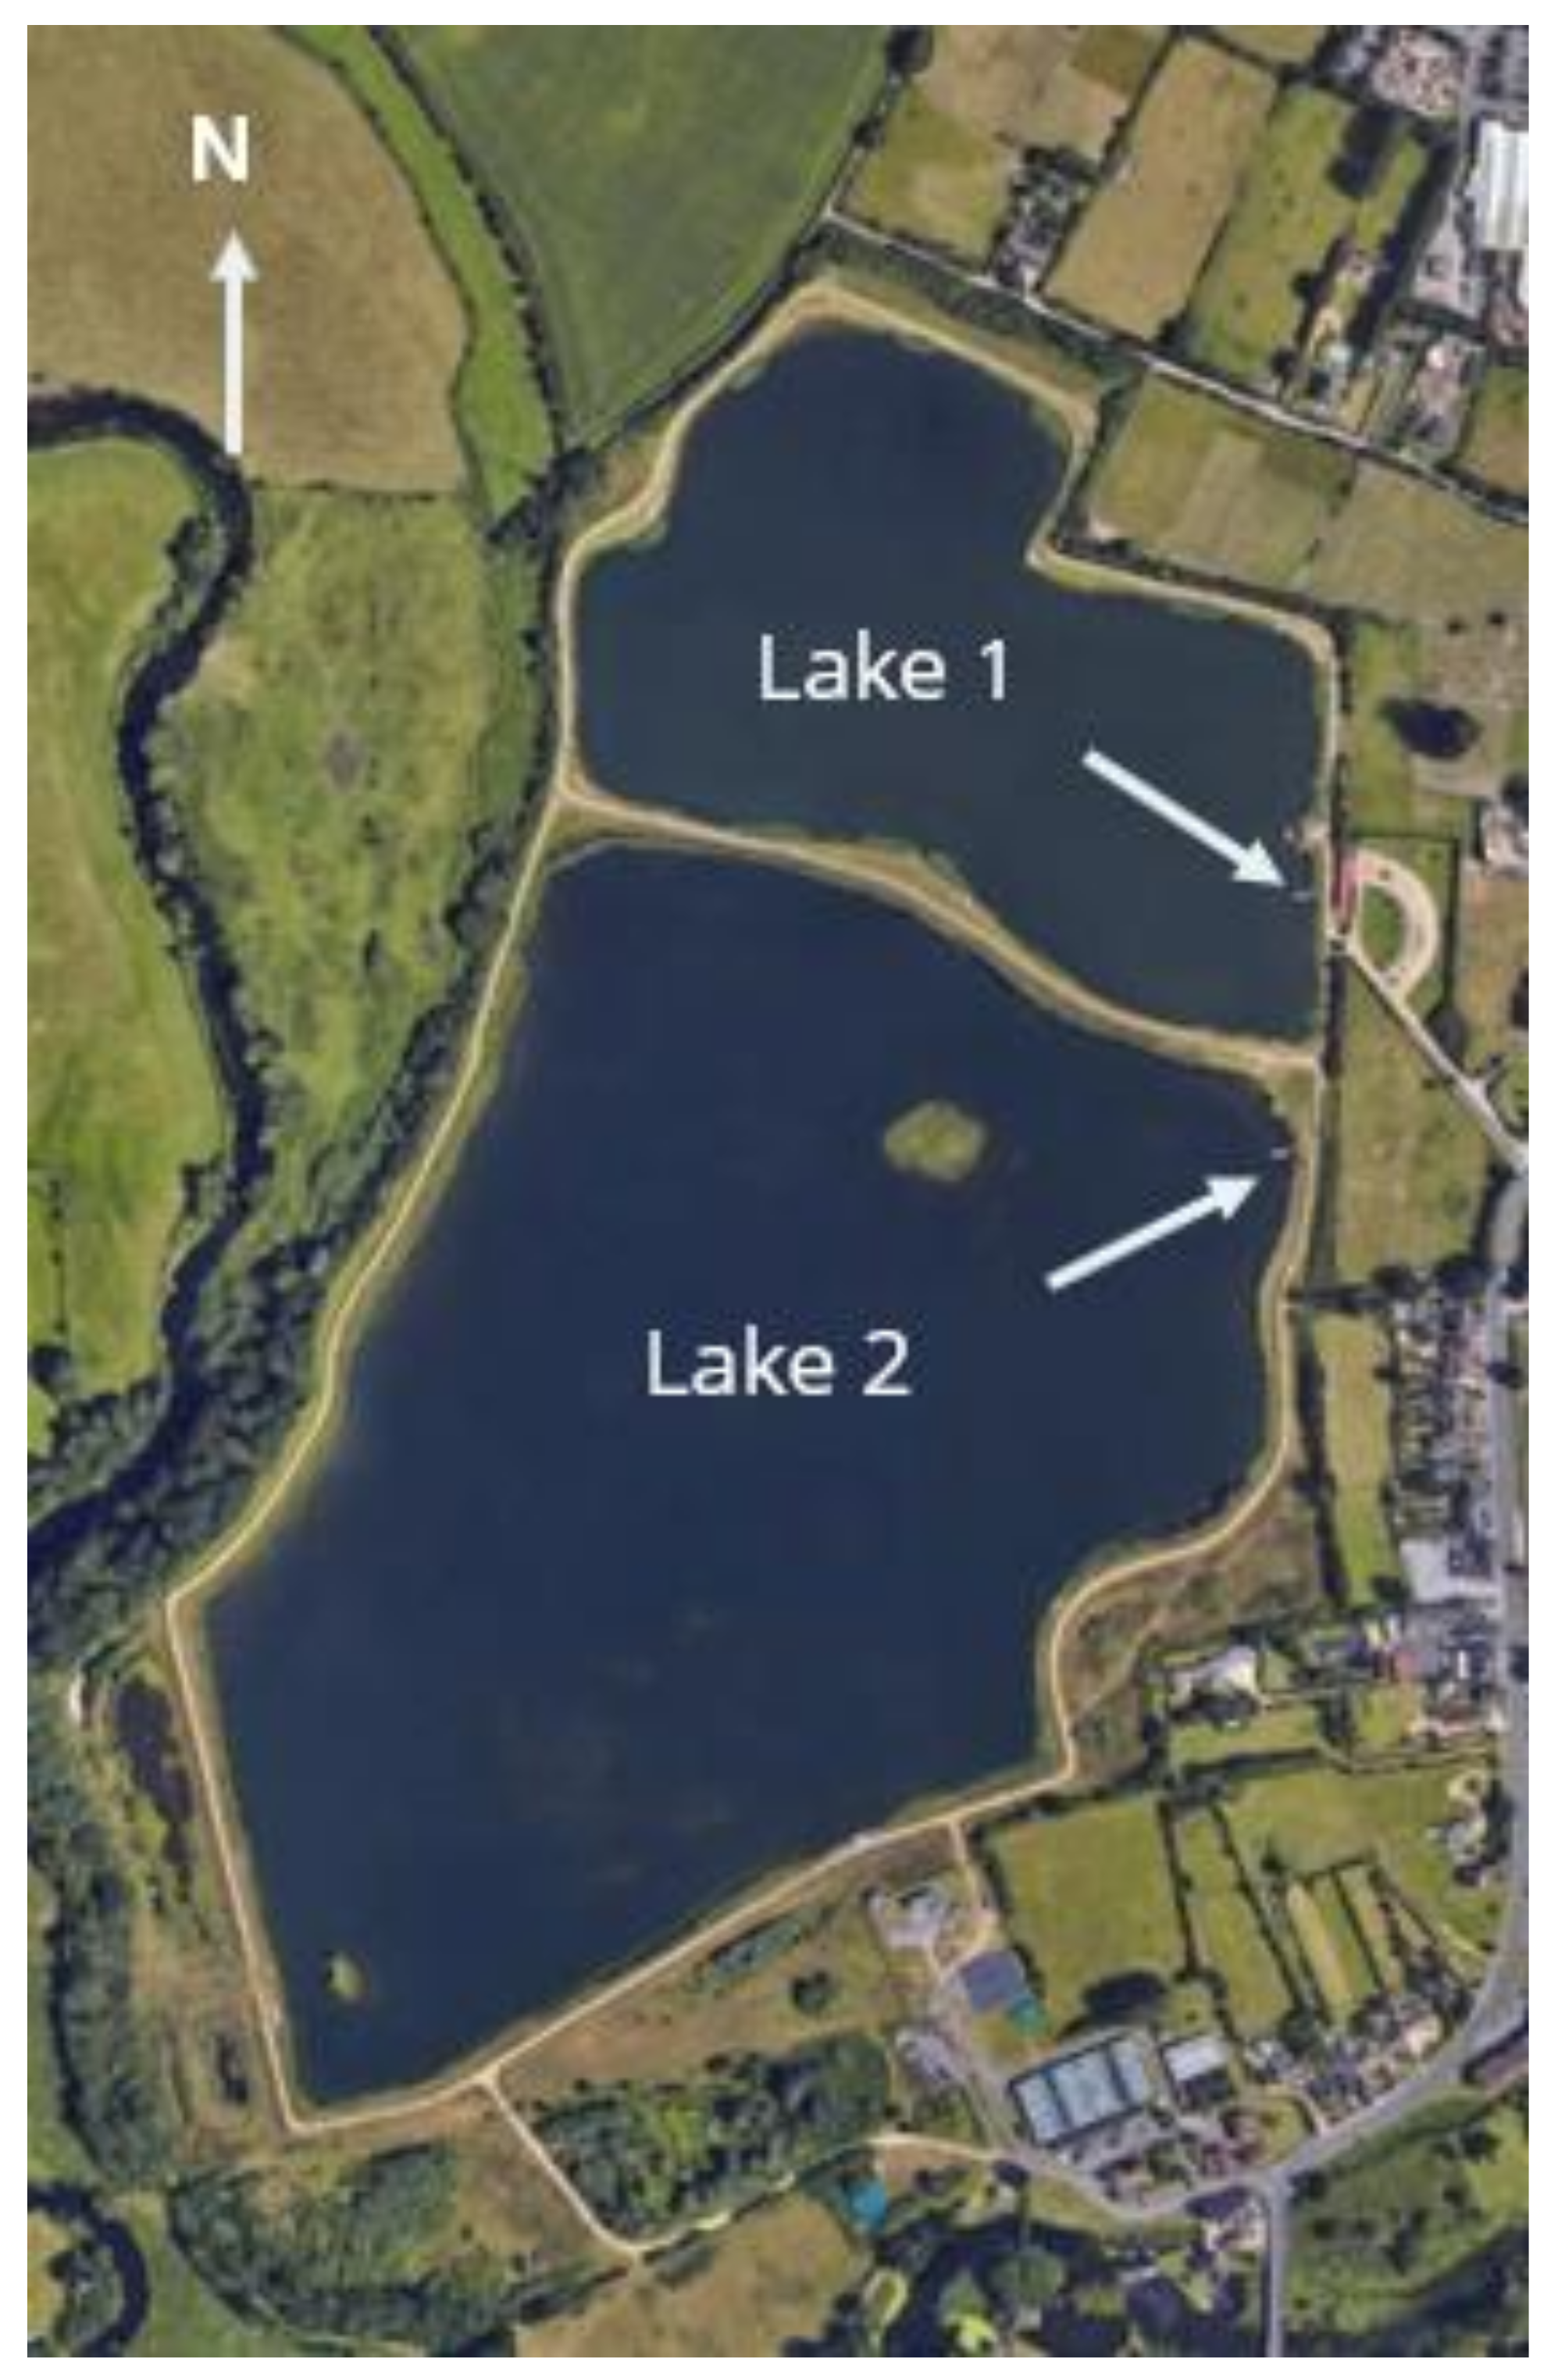
2.1. Study Site
2.2. Chemical and Biological Parameters
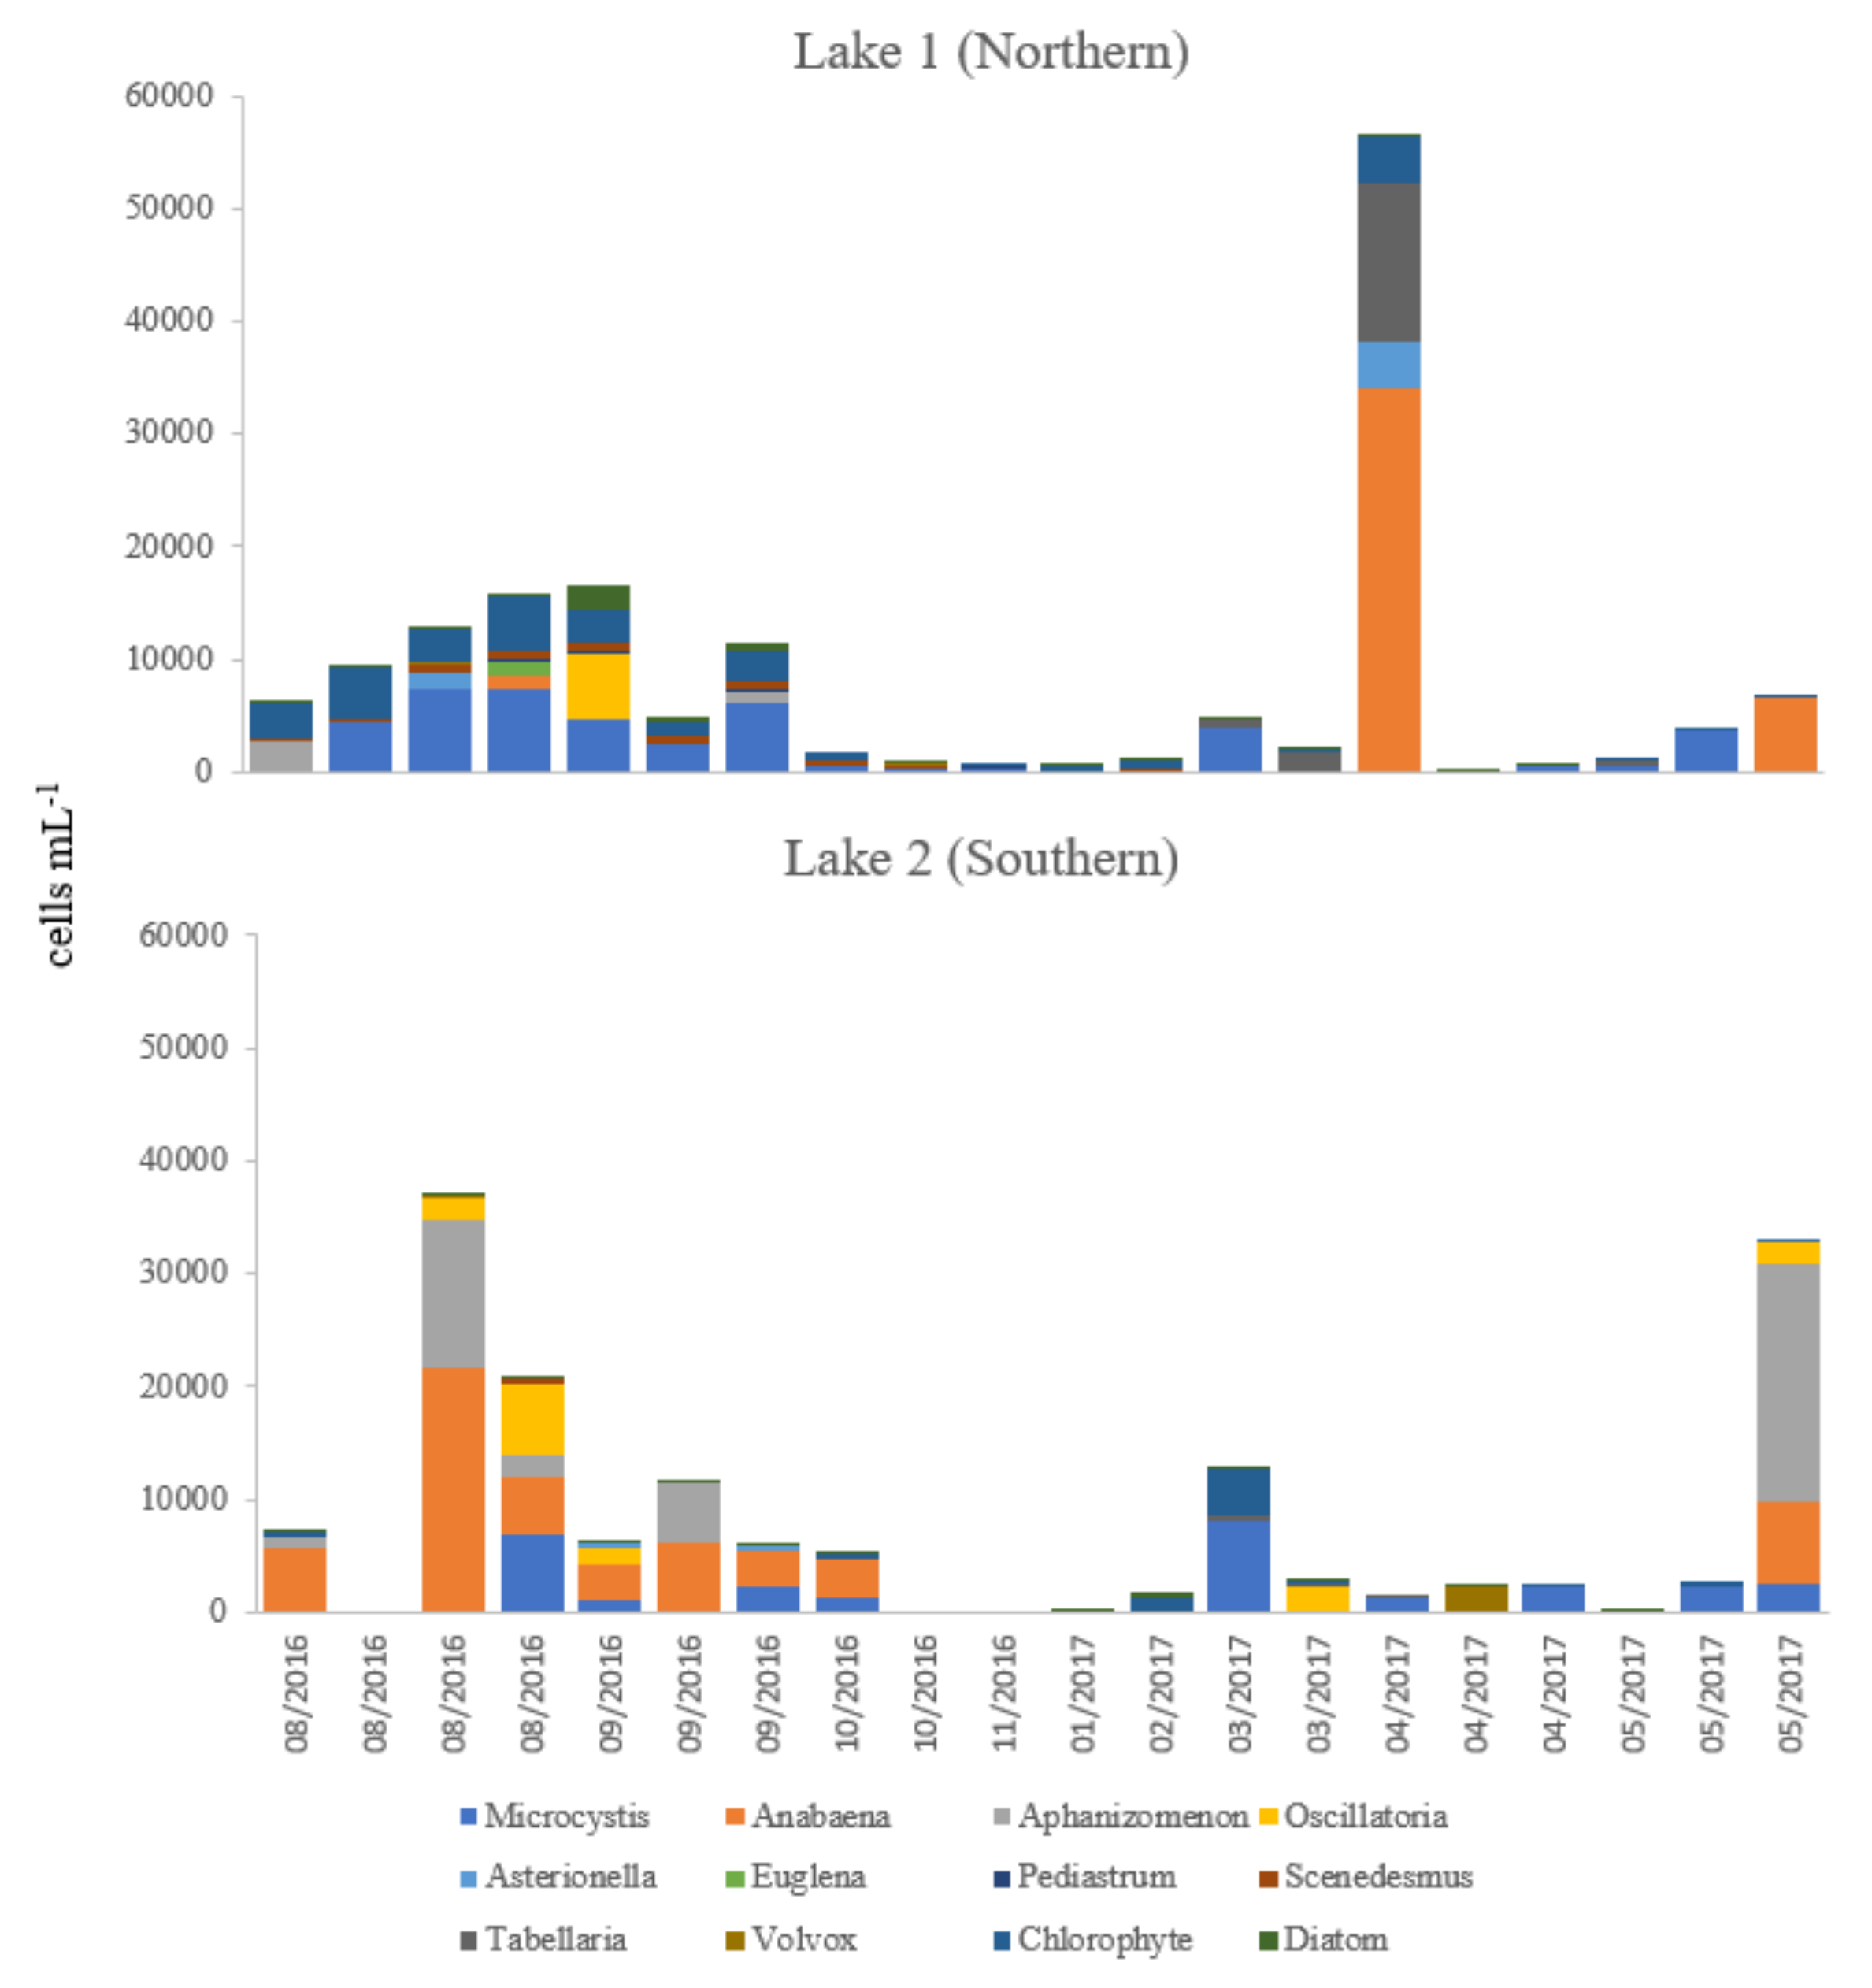
2.3. Identification and Enumeration of Phytoplankton by Light Microscopy
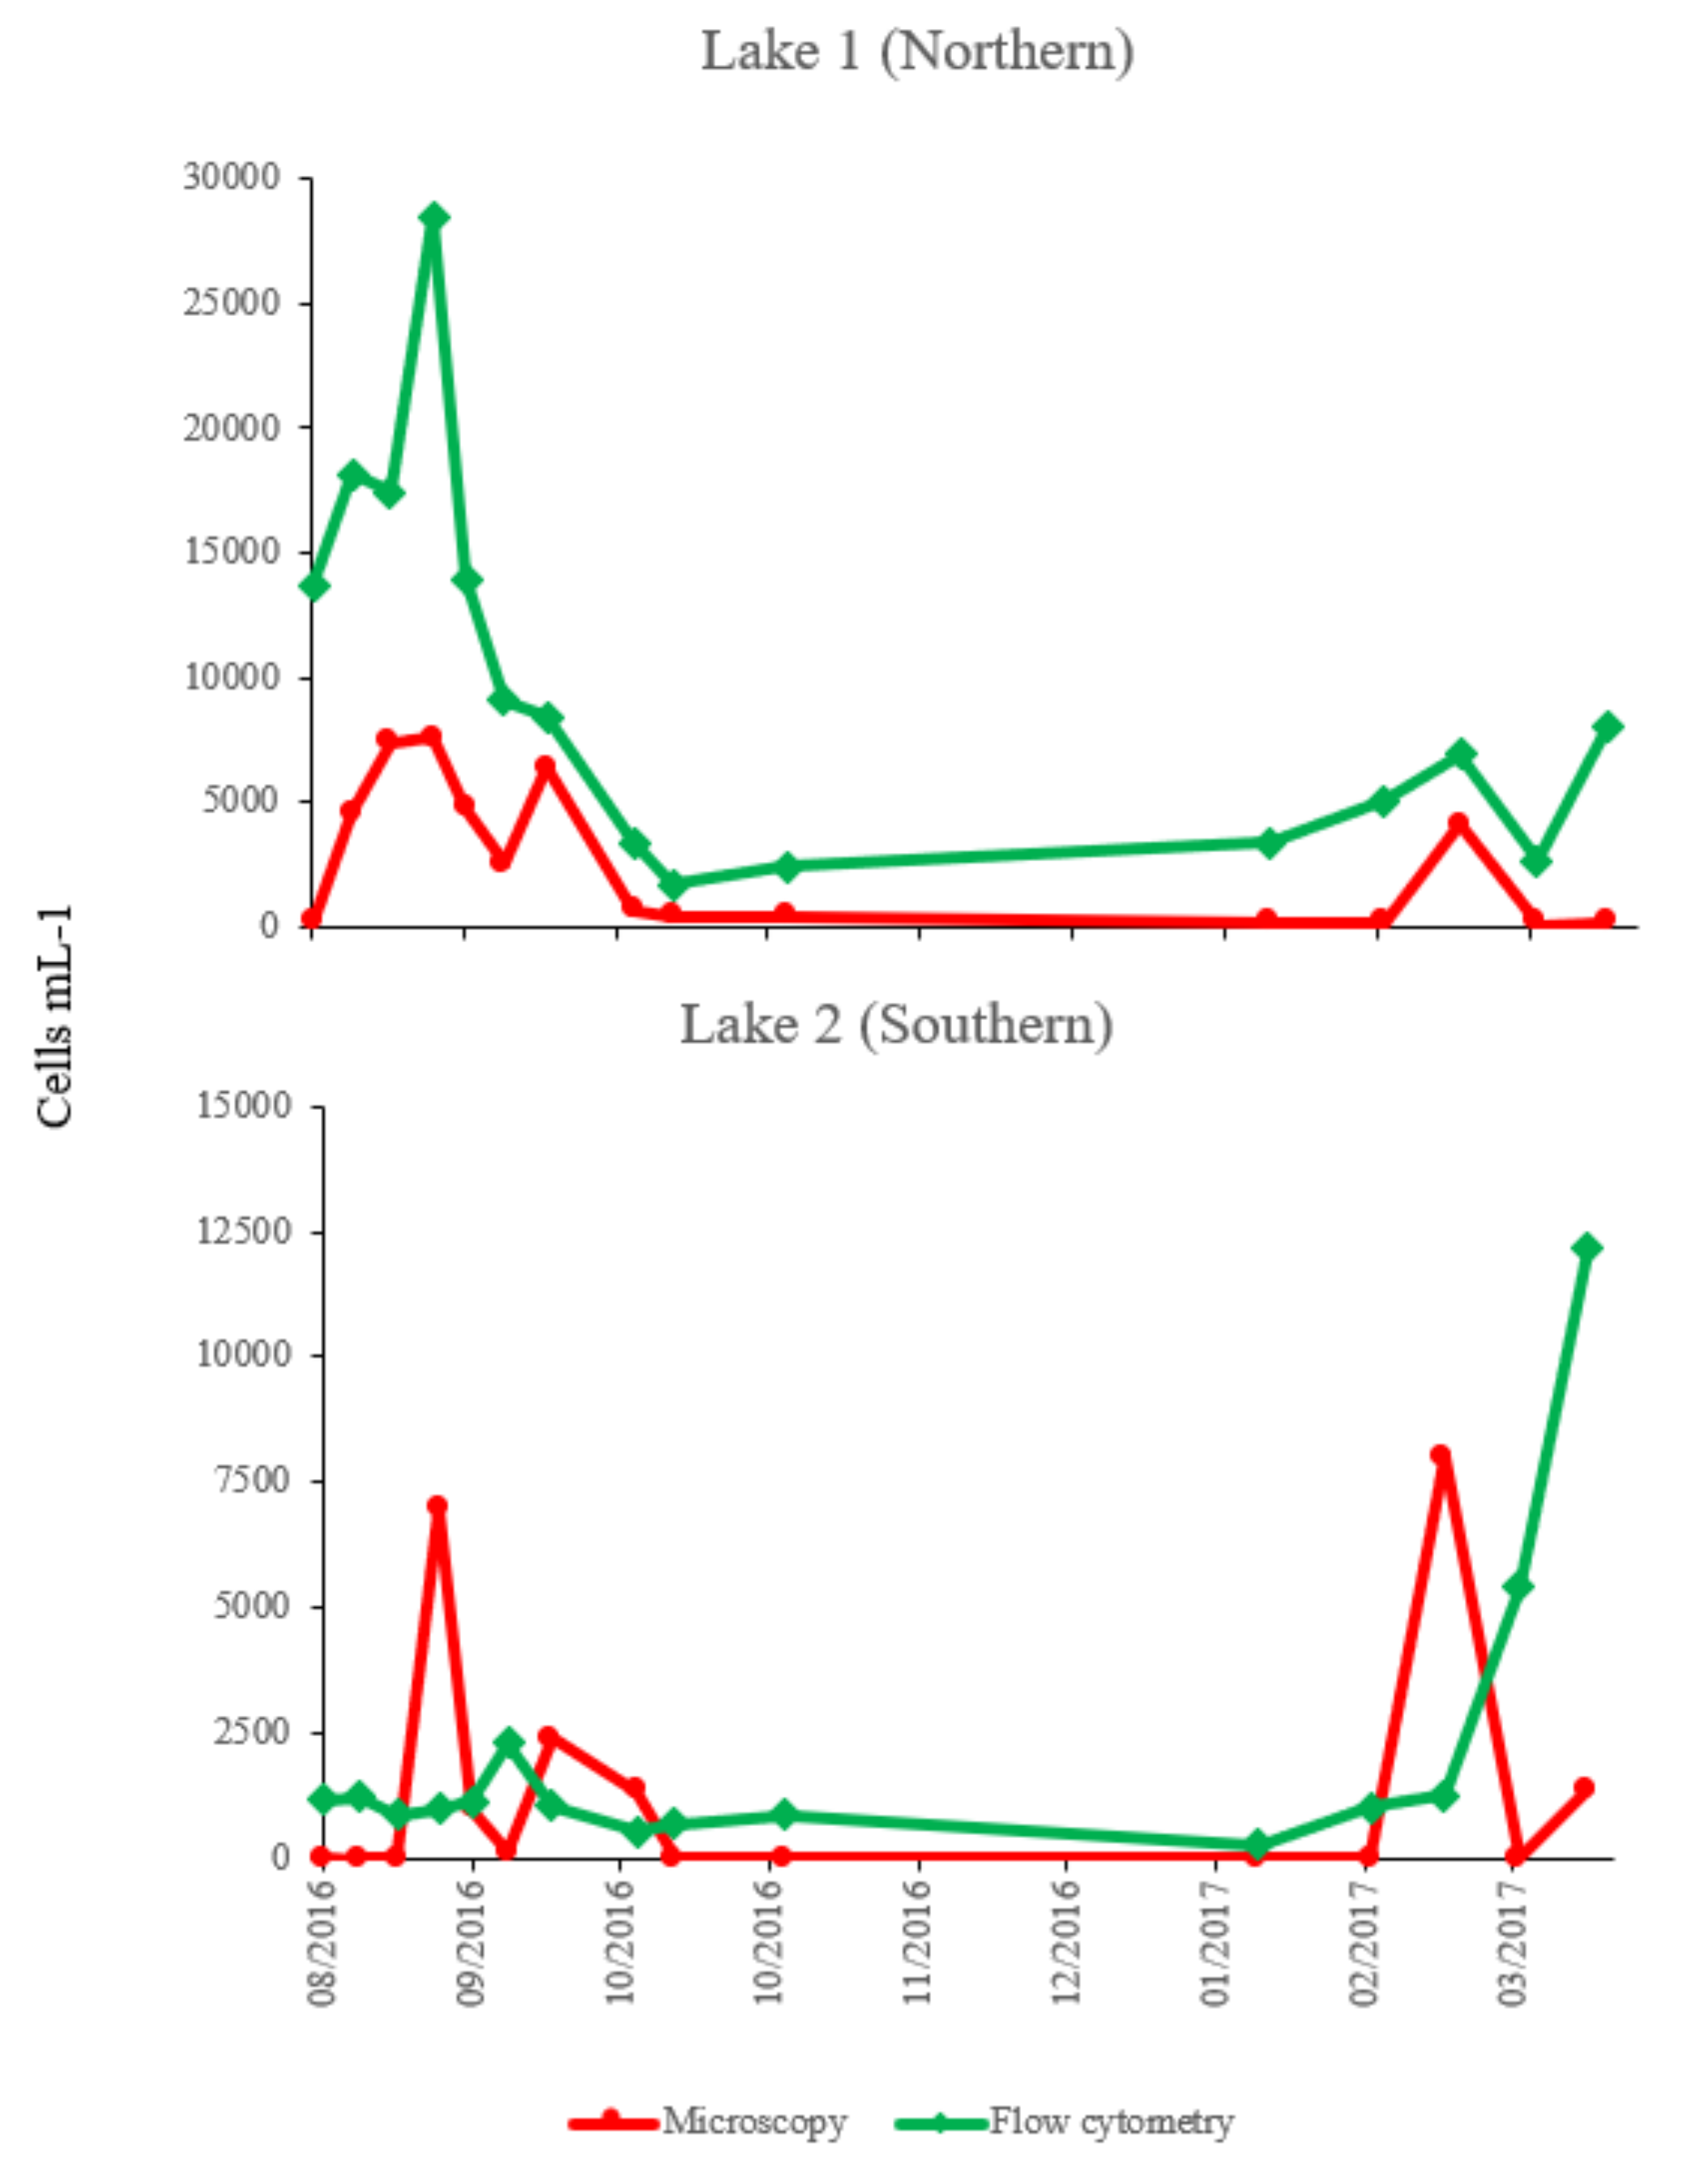
2.4. Comparison of Counts of Microcystis Cells by Flow Cytometry and Microscopic Method
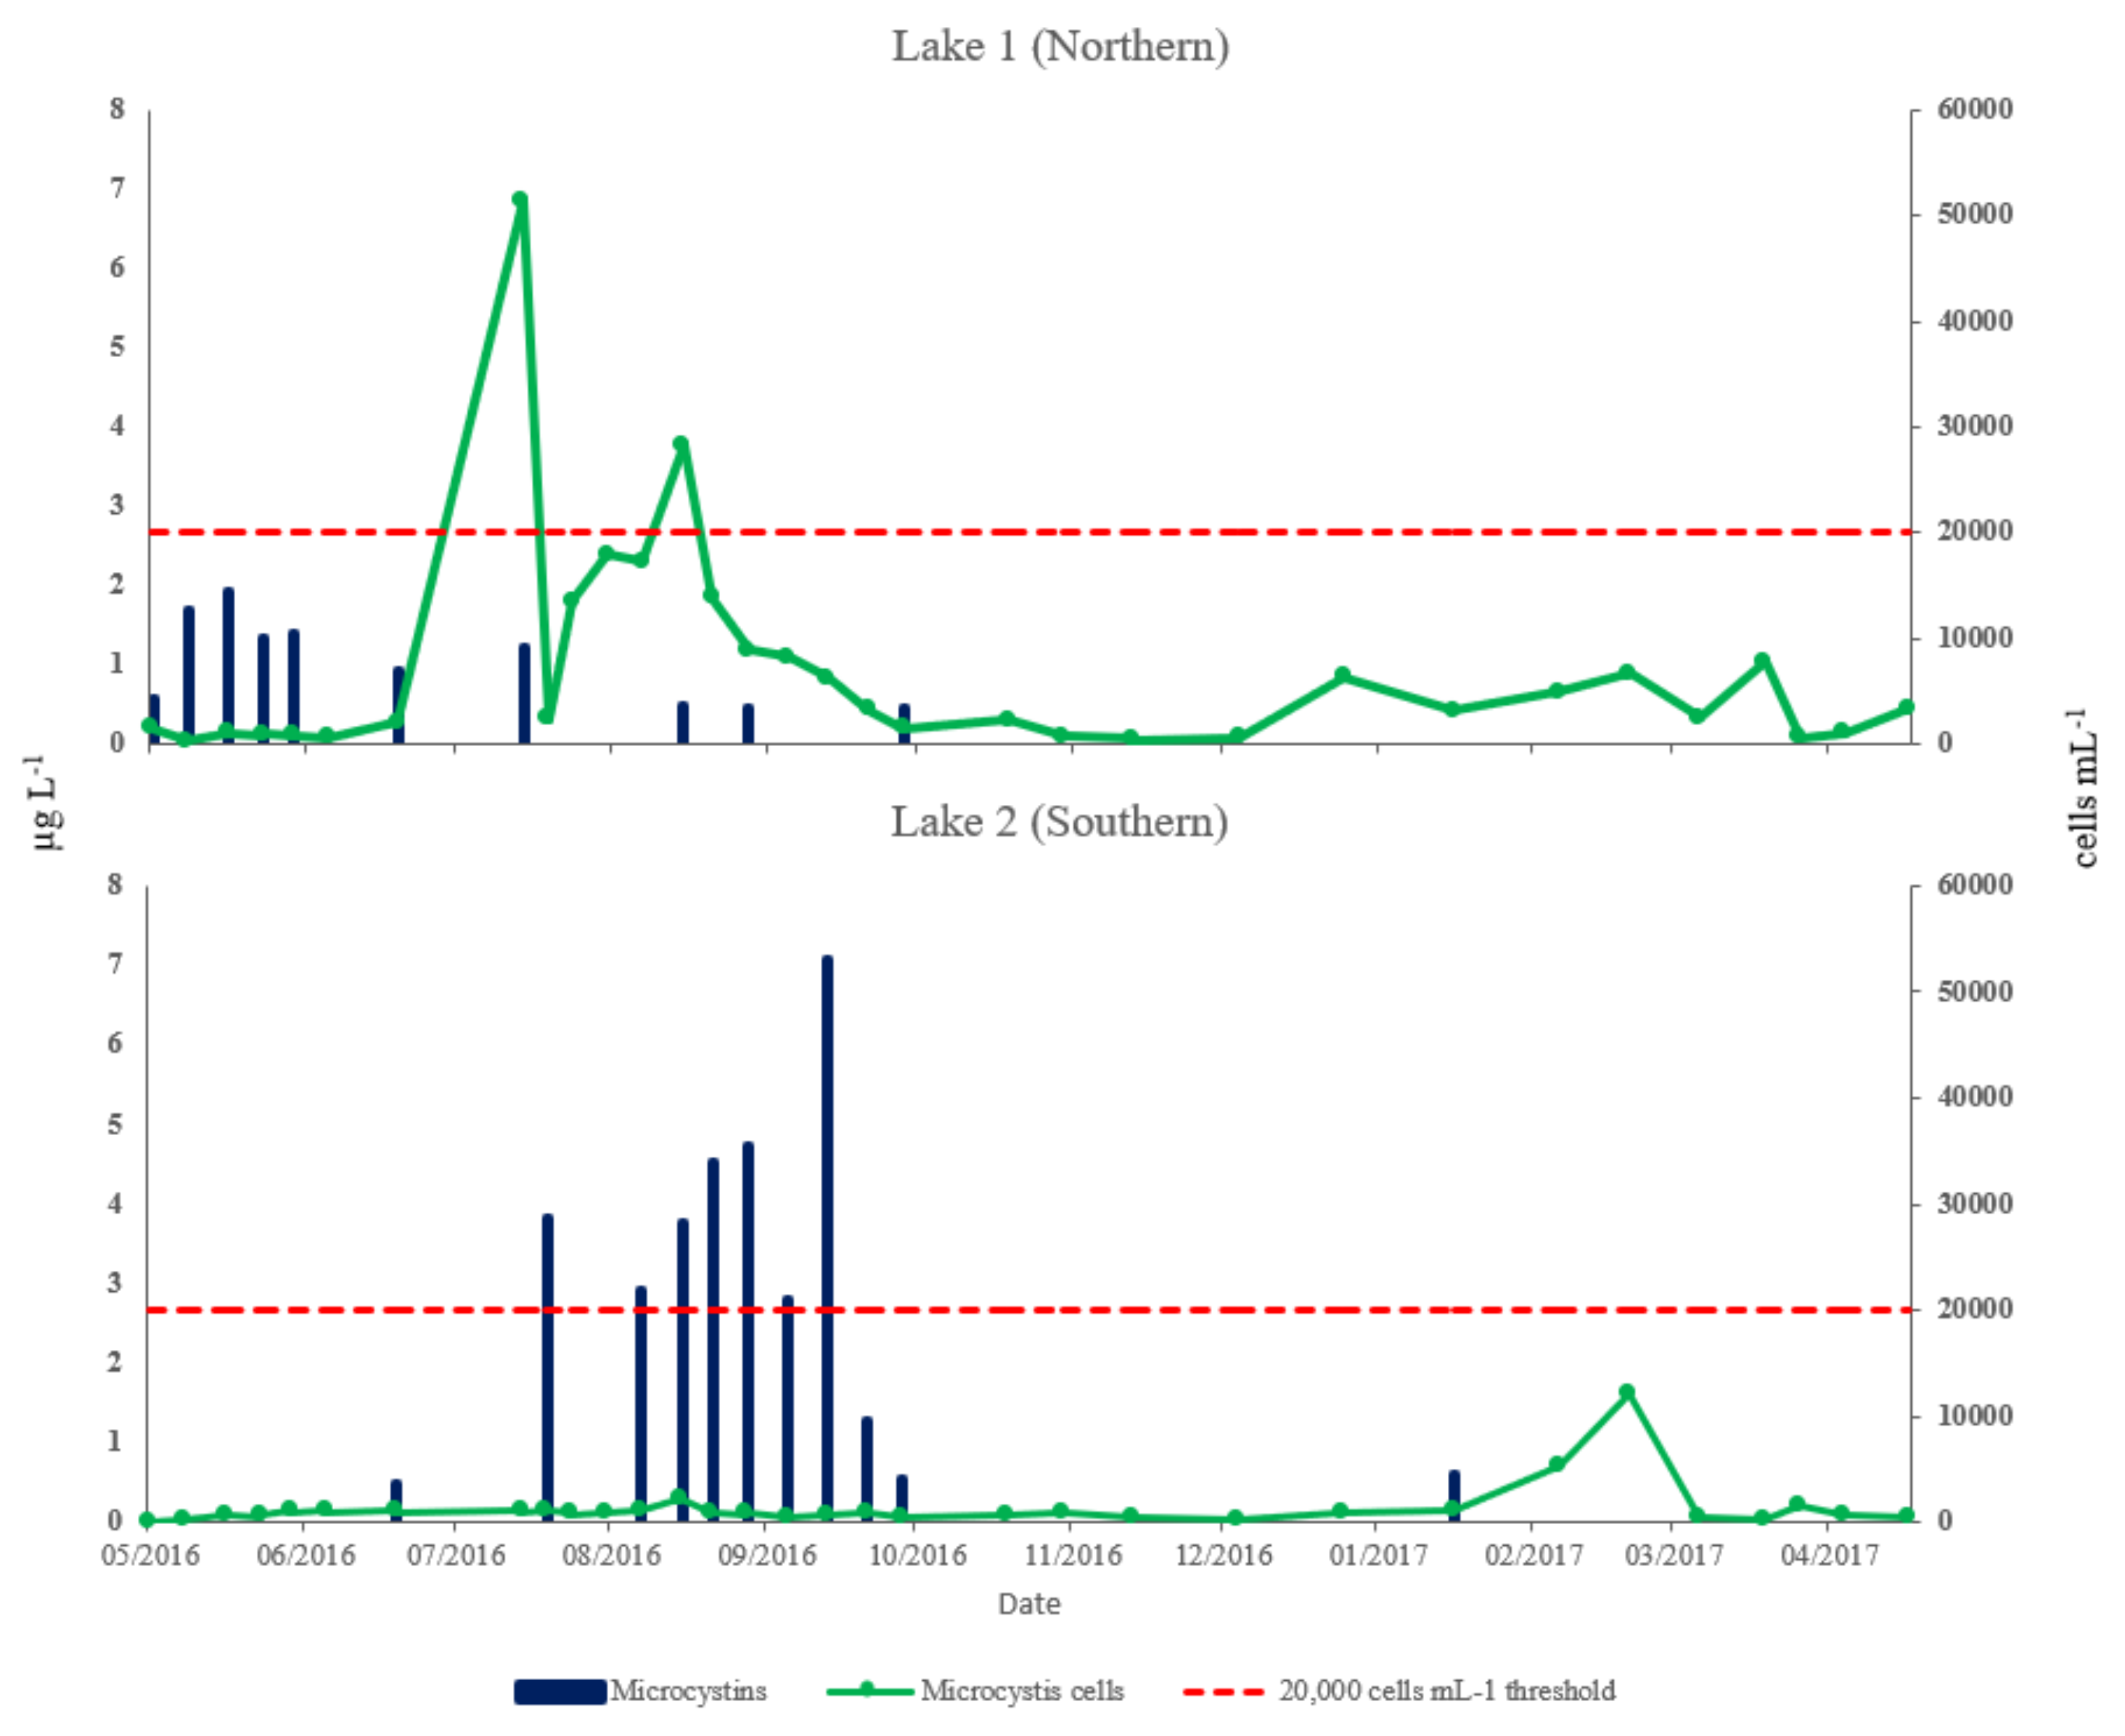
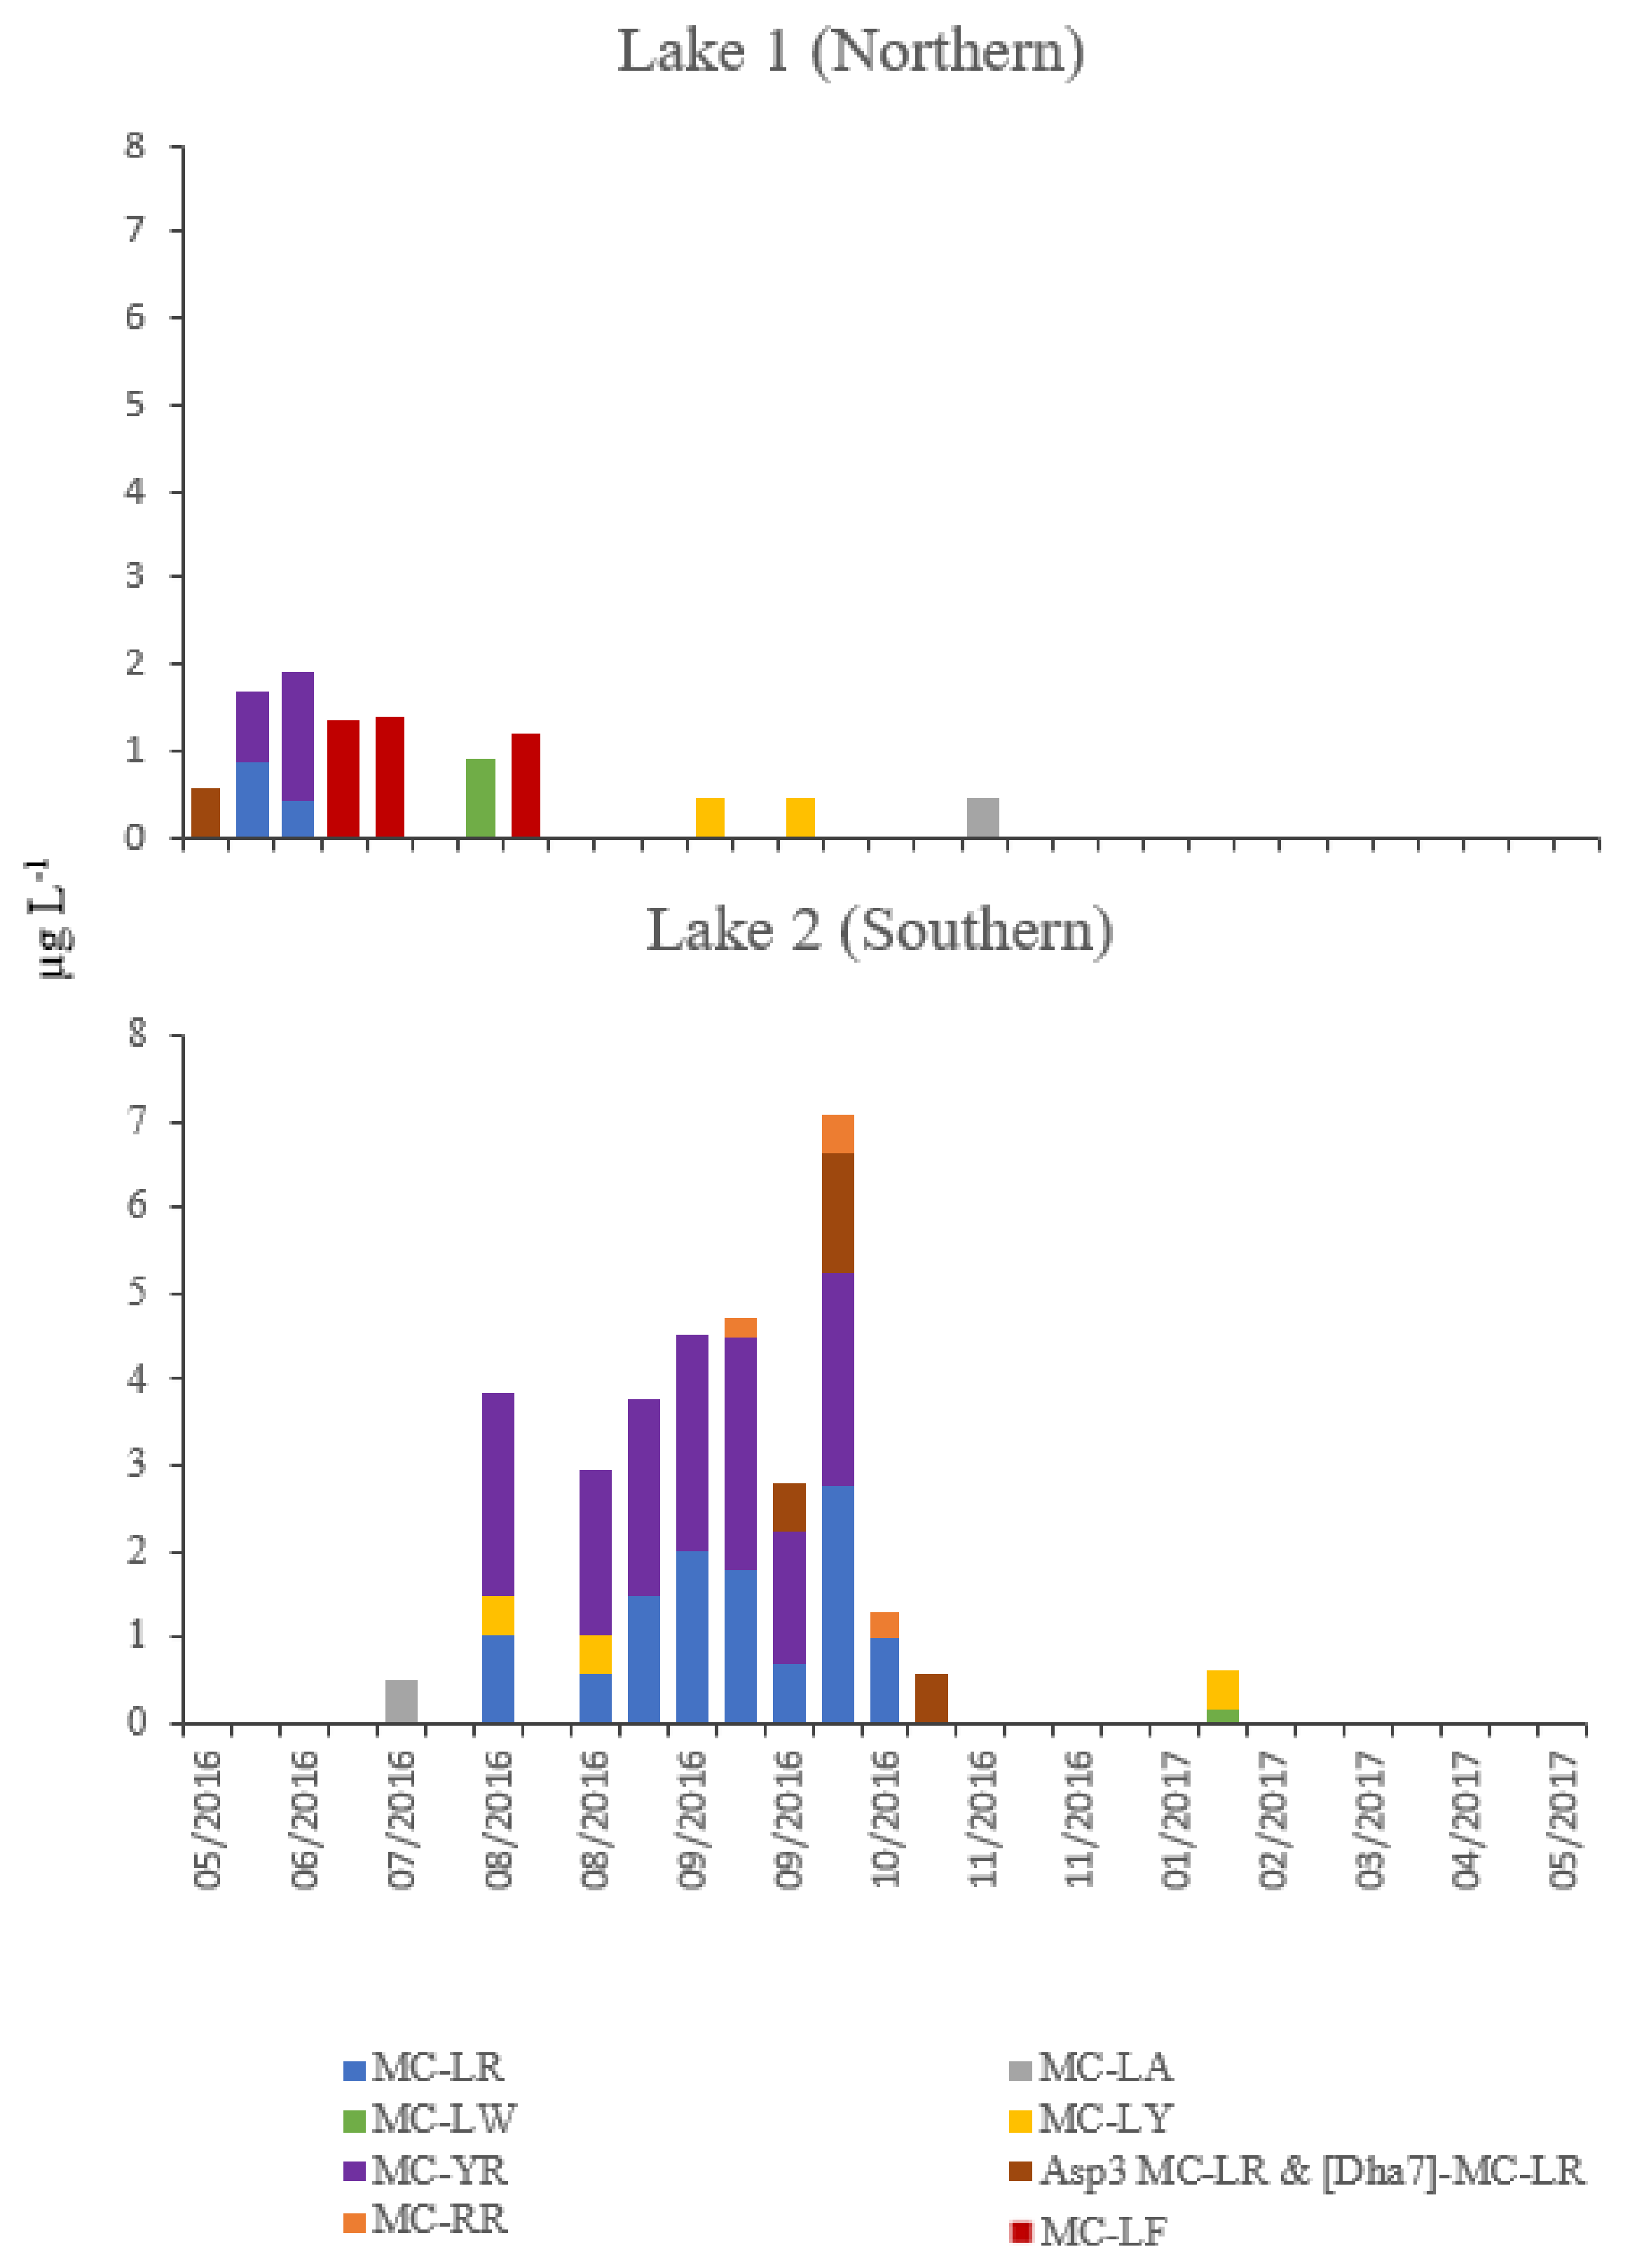
2.5. Determination of Microcystis Cells and Microcystin Concentrations
2.6. The Ability of Chemical and Biological Parameters to Predict Presence of Microcystins
3. Discussion
4. Materials and Methods
4.1. Sample Collection and Water Parameter Measurements
4.2. Cell Discrimination by Flow Cytometry
4.3. Toxin Analysis by Liquid Chromatography Coupled to Tandem Mass Spectrometry
4.4. Identification and Enumeration of Phytoplankton by Light Microscopy
4.5. Multiple Linear Regression Model
Author Contributions
Funding
Acknowledgments
Conflicts of Interest
References
- Codd, G.A. Cyanobacterial toxins, the perception of water quality, and the prioritisation of eutrophication control. Ecol. Eng. 2000, 16, 51–60. [Google Scholar] [CrossRef]
- Paerl, H.W.; Fulton, R.S.; Moisander, P.H.; Dyble, J. Harmful freshwater algal blooms, with an emphasis on cyanobacteria. Sci. World J. 2001, 1, 76–113. [Google Scholar] [CrossRef] [PubMed]
- Paerl, H.W.; Paul, V.J. Climate change: Links to global expansion of harmful cyanobacteria. Water Res. 2012, 46, 1349–1363. [Google Scholar]
- Robarts, R.D.; Zohary, T. Temperature effects on photosynthetic capacity, respiration and growth rates of bloom-forming cyanobacteria. New Zealand J. Mar. Fresh. 1987, 12, 391–399. [Google Scholar] [CrossRef] [Green Version]
- Paerl, H.W.; Huisman, J. Blooms like it hot. Science 2008, 320, 57–58. [Google Scholar] [CrossRef] [PubMed] [Green Version]
- O’Neil, J.M.; Davis, T.W.; Burford, M.A.; Gobler, C.J. The rise of harmful cyanobacteria blooms: The potential roles of eutrophication and climate change. Harmful Algae 2012, 14, 313–334. [Google Scholar] [CrossRef]
- Rigosi, A.; Carey, C.C.; Ibelings, B.W.; Brookes, J.D. The interaction between climate warming and eutrophication to promote cyanobacteria is dependent on trophic state and varies among taxa. Limnol. Oceanogr. 2014, 59, 99–114. [Google Scholar] [CrossRef] [Green Version]
- Lawton, L.A.; Codd, G.A. Cyanobacterial (blue-green algal) toxins and their significance in UK and European waters. Water Environ. J. 1991, 5, 460–465. [Google Scholar] [CrossRef]
- Chorus, I. Cyanotoxin occurrence in freshwaters—A summary of survey results from different countries. In Cyanotoxins—Occurrence, Causes, Consequences; Chorus, I., Ed.; Springer: Berlin, Germany, 2001; pp. 75–78. [Google Scholar]
- Turner, A.D.; Dhanji-Rapkova, M.; O’Neill, A.; Coates, L.; Lewis, A.; Lewis, K. Analysis of Microcystins in Cyanobacterial Blooms from Freshwater Bodies in England. Toxins 2018, 10, 39. [Google Scholar] [CrossRef] [Green Version]
- Kuiper-Goodman, T.; Falconer, I.O.M.; Fitzgerald, J. Human health aspects. In Toxic Cyanobacteria in Water: A Guide to Their Public Health Consequences, Monitoring and Management; Chorus, I., Bartram, J., Eds.; E & F N Spon: London, UK, 1999; pp. 125–160. [Google Scholar]
- Van Ginkel, C.E. Toxic Algal Incident in the Grootdraai Dam; Institute for Water Quality Studies, Department of Water Affairs and Forestry: Pretoria, South Africa, 2011. [Google Scholar]
- Alonso-Andicoberry, C.; García-Viliada, L.; Lopez-Rodas, V.; Costas, E. Catastrophic mortality of flamingos in a Spanish national park caused by cyanobacteria. Vet. Rec. 2002, 151, 706–707. [Google Scholar]
- Qin, B.; Zhu, G.; Gao, G.; Zhang, Y.; Li, W.; Paerl, H.W.; Carmichael, W.W. A drinking water crisis in Lake Taihu, China: Linkage to climatic variability and lake management. J. Environ. Manage 2010, 45, 105–112. [Google Scholar] [CrossRef]
- World Health Organization (WHO). Guidelines for Drinking-Water Quality: Fourth Edition Incorporating the First Addendum; WHO: Geneva, Switzerland, 2017. [Google Scholar]
- Water UK. Water UK Technical Briefing Note: Blue Green Algal Toxins in Drinking Water; Water UK Position Paper; Water UK: London, UK, 2006. [Google Scholar]
- Krokowski, J.T.; Lang, P.; Bell, A.; Broad, N.; Clayton, J.; Milne, I.; Nicolson, M.; Ross, A.; Ross, N. A review of the incidence of cyanobacteria (blue-green algae) in surface eaters in Scotland including potential effects of climate change, with a list of the common species and new records from the Scottish Environmental Protection Agency. Glasg. Nat. 2012, 25, 99–104. [Google Scholar]
- Mantzouki, E.; Lürling, M.; Fastner, J.; de Senerpont Domis, L. Temperature effects explain continental scale distribution of cyanobacterial toxins. Toxins 2018, 10, 156. [Google Scholar] [CrossRef] [Green Version]
- Miles, C.O.; Sandvik, M.; Nonga, H.E.; Rundberget, T.; Wilkins, A.L.; Rise, F.; Ballot, A. Thiol derivatization for LC-MS identification of microcystins in complex matrices. J. Environ. Sci. Technol. 2012, 46, 8937–8944. [Google Scholar] [CrossRef] [Green Version]
- Okello, W.; Ostermaier, V.; Portmann, C.; Gademann, K.; Kurmayer, R. Spatial isolation favours the divergence in microcystin net production by Microcystis in Ugandan freshwater lakes. Wat. Res. 2010, 44, 2803–2814. [Google Scholar] [CrossRef] [Green Version]
- Oliver, R.L.; Hamilton, D.P.; Brookes, J.D.; Ganf, G.G. Physiology, blooms and prediction of planktonic cyanobacteria. In Ecology of Cyanobacteria II; Whitton, B.A., Ed.; Springer: Dordrecht, Germany, 2012; pp. 155–194. [Google Scholar]
- Downing, J.A.; Watson, S.B.; McCauley, E. Predicting cyanobacteria dominance in lakes. Can. J. Fish. Aquat. Sci. 2001, 58, 1905–1908. [Google Scholar] [CrossRef]
- Howard, A.; Easthope, M.P. Application of a model to predict cyanobacterial growth patterns in response to climatic change at Farmoor Reservoir, Oxfordshire, UK. Sci. Total Environ. 2002, 282, 459–469. [Google Scholar] [CrossRef]
- Carvalho, L.; Miller, C.A.; Scott, E.M.; Codd, G.A.; Davies, P.S.; Tyler, A.N. Cyanobacterial blooms: Statistical models describing risk factors for national-scale lake assessment and lake management. Sci. Total Environ. 2011, 409, 5353–5358. [Google Scholar] [CrossRef] [Green Version]
- Rigosi, A.; Hanson, P.; Hamilton, D.P.; Hipsey, M.; Rusak, J.A.; Bois, J.; Sparber, K.; Chorus, I.; Watkinson, A.J.; Qin, B.; et al. Determining the probability of cyanobacterial blooms: The application of Bayesian networks in multiple lake systems. Ecol. Appl. 2015, 25, 186–199. [Google Scholar] [CrossRef] [PubMed]
- Sivonen, K.; Jones, G. Cyanobacterial toxins. In Toxic Cyanobacteria in Water: A Guide to Public Health Significance, Monitoring and Management; Chorus, I., Bartram, J., Eds.; E & F N Spon: London, UK, 1999; pp. 41–111. [Google Scholar]
- Mekebri, A.; Blondina, G.J.; Crane, D.B. Method validation of microcystins in water and tissue by enhanced liquid chromatography tandem mass spectrometry. J. Chromatogr. A 2009, 1216, 3147–3155. [Google Scholar] [CrossRef] [PubMed]
- Dyble, J.; Fahnenstiel, G.L.; Litaker, R.W.; Millie, D.F.; Tester, P.A. Microcystin concentrations and genetic diversity of Microcystis in the lower Great Lakes. Environ. Toxicol. 2008, 23, 507–516. [Google Scholar] [CrossRef] [PubMed]
- Sivonen, K. Cyanobacterial toxins. In Encyclopedia of Microbiology, 3rd ed.; Schaechter, M., Ed.; Academic Press: London, UK, 2009; pp. 290–307. [Google Scholar]
- Janse, I.; Kardinaal, W.E.A.; Meima, M.; Fastner, J.; Visser, P.M.; Zwart, G. Toxic and nontoxic Microcystis colonies in natural populations can be differentiated on the basis of rRNA gene internal transcribed spacer diversity. Appl. Environ. Microbiol. 2004, 70, 3979–3987. [Google Scholar] [CrossRef] [PubMed] [Green Version]
- Meyer, K.A.; Davis, T.W.; Watson, S.B.; Denef, V.J.; Berry, M.A.; Dick, G.J. Genome sequences of lower Great Lakes Microcystis sp. reveal strain-specific genes that are present and expressed in western Lake Erie blooms. PLoS ONE 2017, 12, e0183859. [Google Scholar] [CrossRef] [PubMed] [Green Version]
- Tillett, D.; Parker, D.L.; Neilan, B.A. Detection of toxigenicity by a probe for the microcystin synthetase A gene (mcyA) of the cyanobacterial genus Microcystis: Comparison of toxicities with 16S rRNA and phycocyanin operon (phycocyanin intergenic spacer) phylogenies. Appl. Environ. Microbiol. 2001, 67, 2810–2818. [Google Scholar] [CrossRef] [Green Version]
- Howard, A.; McDonald, A.T.; Kneale, P.E.; Whitehead, P.G. Cyanobacterial (blue-green algal) blooms in the UK: A review of the current situation and potential management options. Prog. Physic. Geograp. 1996, 20, 53–61. [Google Scholar] [CrossRef]
- Krokowski, J.T.; Jamieson, J. A decade of monitoring and management of freshwater algae, in particular cyanobacteria in England and Wales. Freshwat. Forum 2002, 18, 3–12. [Google Scholar]
- Zervou, S.K.; Christophoridis, C.; Kaloudis, T.; Triantis, T.M.; Hiskia, A. New SPE-LC-MS/MS method for simultaneous determination of multi-class cyanobacterial and algal toxins. J. Hazard. Mater. 2017, 323, 56–66. [Google Scholar] [CrossRef]
- Halinen, K.; Jokela, J.; Fewer, D.P.; Wahlsten, M.; Sivonen, K. Direct evidence for production of microcystins by Anabaena strains from the Baltic Sea. Appl. Environ. Microbiol. 2007, 73, 6543–6550. [Google Scholar] [CrossRef] [Green Version]
- Mowe, M.A.; Porojan, C.; Abbas, F.; Mitrovic, S.M.; Lim, R.P.; Furey, A.; Yeo, D.C. Rising temperatures may increase growth rates and microcystin production in tropical Microcystis species. Harmful Algae 2015, 50, 88–98. [Google Scholar] [CrossRef]
- Ferguson, C.A.; Carvalho, L.; Scott, E.M.; Bowman, A.W.; Kirika, A. Assessing ecological responses to environmental change using statistical models. J. Appl. Ecol. 2008, 45, 193–203. [Google Scholar] [CrossRef]
- Elliott, J.A. Is the future blue-green? A review of the current model predictions of how climate change could affect pelagic freshwater cyanobacteria. Wat. Res. 2012, 46, 1364–1371. [Google Scholar] [CrossRef] [PubMed] [Green Version]
- Sinden, A.; Sinang, S.C. Cyanobacteria in aquaculture systems: Linking the occurrence, abundance and toxicity with rising temperatures. Int. J. Environ. Sci. Technol. 2016, 13, 2855–2862. [Google Scholar] [CrossRef]
- Paerl, H.W.; Otten, T.G. Blooms bite the hand that feeds them. Science 2013, 342, 433–434. [Google Scholar] [CrossRef]
- Dai, R.; Wang, P.; Jia, P.; Zhang, Y.; Chu, X.; Wang, Y. A review on factors affecting microcystins production by algae in aquatic environments. World J. Microbiol. Biotechnol. 2016, 32, 51. [Google Scholar] [CrossRef] [PubMed]
- Beaulieu, M.; Pick, F.; Gregory-Eaves, I. Nutrients and water temperature are significant predictors of cyanobacterial biomass in a 1147 lakes data set. Limnol. Oceanogr. 2013, 58, 1736–1746. [Google Scholar] [CrossRef]
- Zapletal, T.; Mares, J.; Jurajda, P.; Vseticková, L. The food of roach, Rutilus rutilus (Actinopterygii: Cypriniformes: Cyprinidae), in a biomanipulated water supply reservoir. Acta Ichthyol. Piscat. 2014, 44, 15. [Google Scholar] [CrossRef] [Green Version]
- Van Wichelen, J.; Vanormelingen, P.; Codd, G.A.; Vyverman, W. The common bloom-forming cyanobacterium Microcystis is prone to a wide array of microbial antagonists. Harmful Algae 2016, 55, 97–111. [Google Scholar] [CrossRef]
- Rohrlack, T.; Dittmann, E.; Börner, T.; Christoffersen, K. Effects of cell-bound microcystins on survival and feeding of Daphnia spp. Appl. Environ. Microbiol. 2001, 67, 3523–3529. [Google Scholar] [CrossRef] [Green Version]
- Lotocka, M. Toxic effect of cyanobacterial blooms on the grazing activity of Daphnia magna Straus. Oceanologia 2001, 43, 441–453. [Google Scholar]
- Zurawell, R.W.; Chen, H.; Burke, J.M.; Prepas, E.E. Hepatotoxic cyanobacteria: A review of the biological importance of microcystins in freshwater environments. J. Toxicol. Environ. Health Part B 2005, 8, 1–37. [Google Scholar] [CrossRef]
- Chapman, I.J. Developing Pioneering New Tools to Detect and Control the Toxic Alga Microcystis in Lakes and Reservoirs. Ph.D. Thesis, Bournemouth University, Poole, UK, 2016. [Google Scholar]
- Turner, A.D.; Waack, J.; Lewis, A.; Edwards, C.; Lawton, L. Development and single-laboratory validation of a UHPLC-MS/MS method for quantitation of microcystins and nodularin in natural water, cyanobacteria, shellfish and algal supplement tablet powders. J. Chromatogr. B 2018, 1074, 111–123. [Google Scholar] [CrossRef] [PubMed]
- R Core Team. R: A Language and Environment for Statistical Computing; R Foundation for Statistical Computing: Vienna, Austria, 2020; Available online: https://www.R-project.org/ (accessed on 14 July 2020).


| Parameter | Lake 1 (Northern) | Lake 2 (Southern) | Student | ||||||
|---|---|---|---|---|---|---|---|---|---|
| Low | Mean | Median | High | Low | Mean | Median | High | t-Test | |
| Total microcystins (µg L−1) | nd 1 | 0.497 | nd 1 | 1.922 | nd 1 | 1.524 | nd 1 | 7.089 | p < 0.01 |
| Microcystis cells (cells mL−1) | 251 | 6874 | 2826 | 51,384 | 258 | 1403 | 1012 | 12,204 | p < 0.001 |
| Phycocyanin (Cells mL−1) | 109 | 1425 | 836 | 7649 | 20 | 1924 | 705 | 10,290 | p > 0.05 |
| Temperature (°C) | 5.57 | 14.96 | 16.51 | 21.64 | 5.81 | 15.13 | 15.88 | 21.51 | p > 0.05 |
| Turbidity (NTU) | −0.40 | 2.25 | 1.50 | 8.90 | −1.60 | 1.51 | 0.70 | 8.20 | p > 0.05 |
| Dissolved Oxygen (mg L−1) | 6.14 | 12.19 | 12.07 | 24.16 | 9.44 | 12.74 | 12.99 | 18.98 | p < 0.001 |
| pH | 7.52 | 8.44 | 8.47 | 9.29 | 8.06 | 8.52 | 8.54 | 8.97 | p > 0.05 |
| Chlorophyll a (mg mL−1) | 0.44 | 3.821 | 2.398 | 15.373 | 0.042 | 1.315 | 0.969 | 4.056 | p < 0.01 |
| Chlorophyll b (mg mL−1) | 0.41 | 2.296 | 2.206 | 6.752 | nd | 1.294 | 1.143 | 4.367 | p < 0.001 |
| Total Carotenoids (mg mL−1) | nd | 1.200 | 0.676 | 6.295 | nd | 0.260 | 0.135 | 1.467 | p < 0.001 |
| Parameter | Estimate | Std. Error | t-Value | Pr(>|t|) |
|---|---|---|---|---|
| Model 1: Zero microcystin values included (n = 43) | ||||
| Intercept | 1.446 | 1.295 | 1.116 | 0.271 |
| Lake | 2.183 | 0.583 | 3.748 | 0.001 |
| Dissolved O2 | −0.418 | 0.143 | 2.920 | 0.006 |
| Temperature | 0.173 | 0.062 | 2.780 | 0.008 |
| Model 2: Zero microcystin values removed (n = 20) | ||||
| Intercept | 1.408 | 2.358 | 0.597 | 0.559 |
| Lake | 3.523 | 0.698 | 5.051 | 0.000 |
| Dissolved O2 | −0.596 | 0.194 | 3.076 | 0.007 |
| Temperature | 0.295 | 0.119 | 2.470 | 0.025 |
© 2020 by the authors. Licensee MDPI, Basel, Switzerland. This article is an open access article distributed under the terms and conditions of the Creative Commons Attribution (CC BY) license (http://creativecommons.org/licenses/by/4.0/).
Share and Cite
Hartnell, D.M.; Chapman, I.J.; Taylor, N.G.H.; Esteban, G.F.; Turner, A.D.; Franklin, D.J. Cyanobacterial Abundance and Microcystin Profiles in Two Southern British Lakes: The Importance of Abiotic and Biotic Interactions. Toxins 2020, 12, 503. https://0-doi-org.brum.beds.ac.uk/10.3390/toxins12080503
Hartnell DM, Chapman IJ, Taylor NGH, Esteban GF, Turner AD, Franklin DJ. Cyanobacterial Abundance and Microcystin Profiles in Two Southern British Lakes: The Importance of Abiotic and Biotic Interactions. Toxins. 2020; 12(8):503. https://0-doi-org.brum.beds.ac.uk/10.3390/toxins12080503
Chicago/Turabian StyleHartnell, David M., Ian J. Chapman, Nick G. H. Taylor, Genoveva F. Esteban, Andrew D. Turner, and Daniel J. Franklin. 2020. "Cyanobacterial Abundance and Microcystin Profiles in Two Southern British Lakes: The Importance of Abiotic and Biotic Interactions" Toxins 12, no. 8: 503. https://0-doi-org.brum.beds.ac.uk/10.3390/toxins12080503